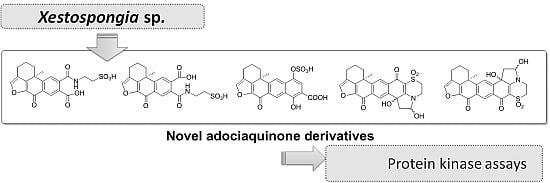
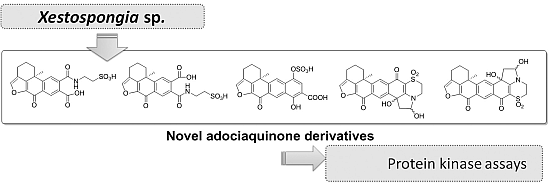
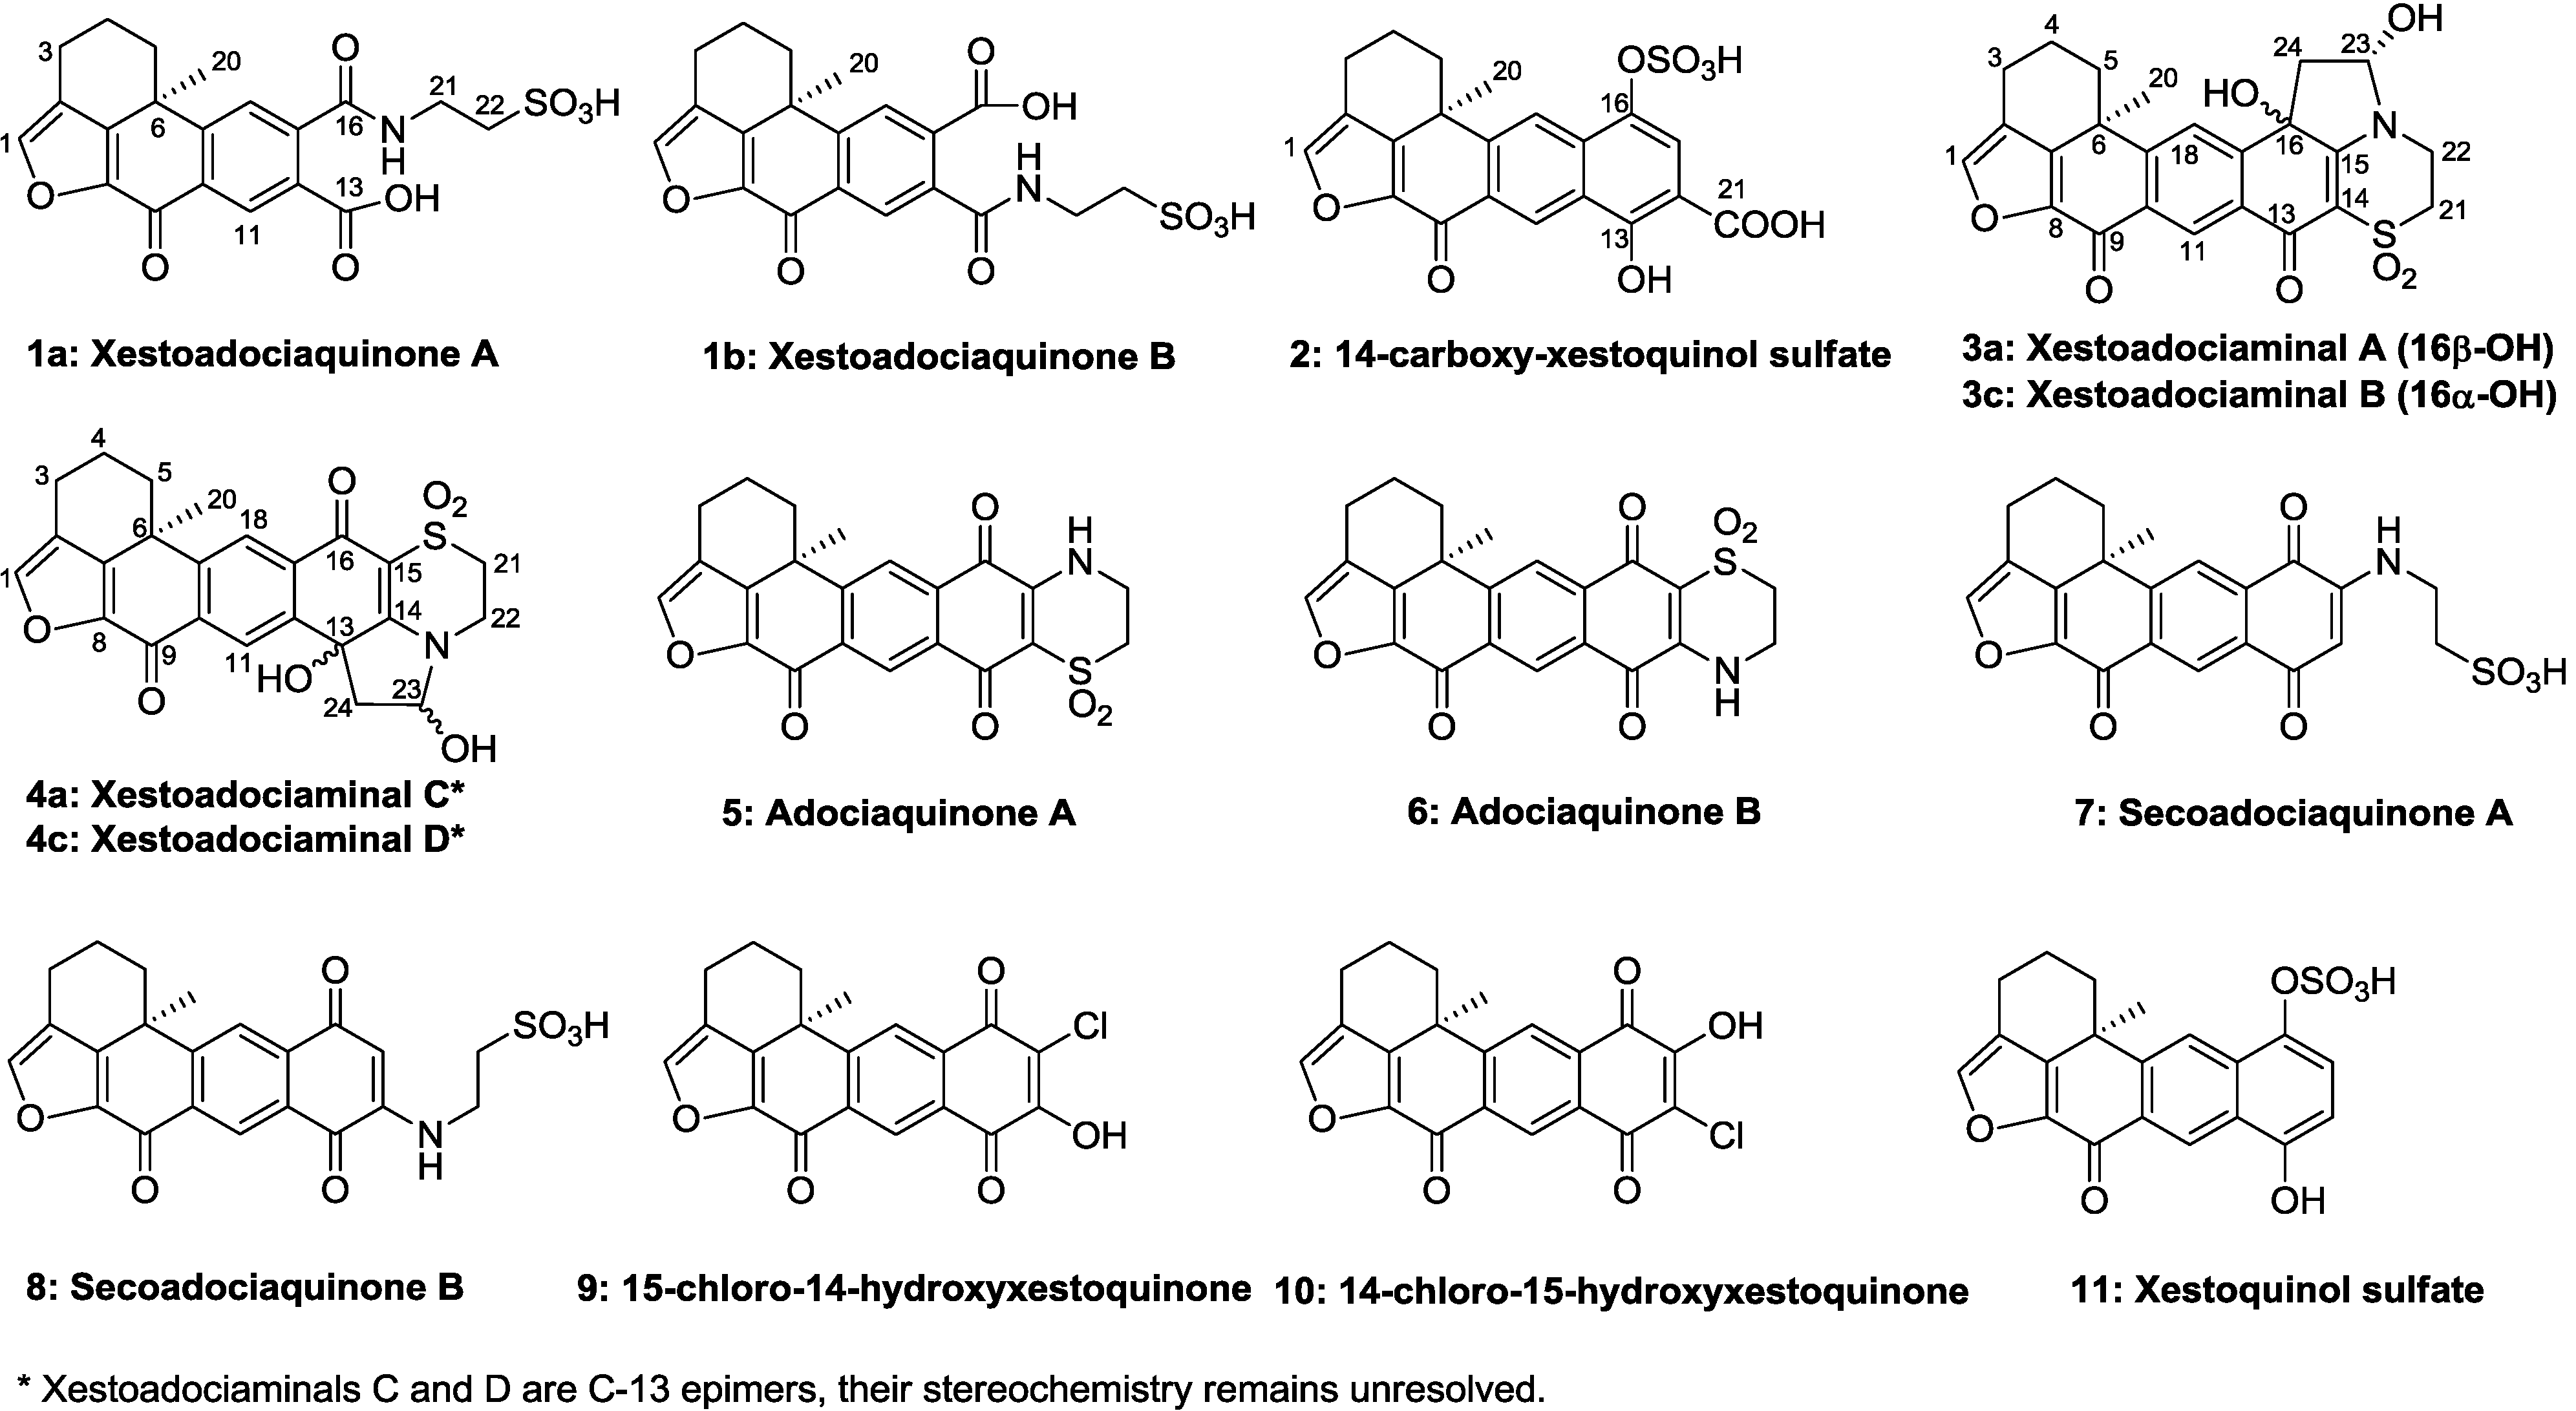
2. Results and Discussion
The mixture of
1a and
1b was isolated as a yellowish amorphous solid. The molecular formula was established as C
20H
19NO
8S by the HRESIMS data (
m/z 434.0905 [M + H]
+) and indicates 14 degrees of unsaturation. The
1H and
13C NMR data (recorded in methanol-
d4,
Table 1) were nearly identical to the known compounds secoadociaquinones A and B [
7], except for the loss of the quinonoid carbon resonances for C-14 and C-15. Furthermore, the key fragment ion peak at
m/z 309 in ESI-MS spectrum, corresponding to loss of an -NH(CH
2)
2SO
3H group, confirmed the presence of a taurine side chain in the molecule. In the
1H-
1H COSY spectrum, we observed the correlations between the protons at δ
H 2.66, 2.89 (H
2-3), δ
H 2.14, 2.32 (H
2-4) and δ
H 1.67, 2.57 (H
2-5), and between the protons at δ
H 3.84 (H
2-21) and δ
H 3.16 (H
2-22). The HMBC spectrum revealed the correlations between the proton at δ
H 7.70 (H-1) and the carbons at δ
C 123.2 (C-2), 145.2 (C-8) and 149.7 (C-7), and between the proton at δ
H 1.51 (H
3-20) and the carbons at δ
C 32.3 (C-5), 38.1 (C-6), 149.7 (C-7) and 153.8 (C-19) (
Figure 2). In addition, the HMBC correlations between the protons at δ
H 3.84 (H
2-21) and the carboxyl carbons at 173.0 (
1a) and 172.8 (
1b) indicated the connection between the taurine side chain and a carboxyl group.
However, two sets of signals were observed in the 1H NMR spectrum around δH 7.70 and δH 8.64 with a ratio 2:3 suggesting the presence of two isomers. Compound 1a showed resonances at δH 8.64 (s), 7.80 (s), and 7.70 (s), and the other set of resonances of compound 1b were displayed at δH 8.37 (s), 7.97 (s), and 7.70 (s). In the HMBC spectrum, the proton at δH 7.80 (H-18 of compound 1a) gave correlations with the carbons at δC 38.1 (C-6), 135.0 (C-12), 137.1 (C-10), and the carboxyl carbon at δC 173.0 (C-16). The signal at δH 8.64 (H-11) of compound 1a showed HMBC correlations with δC 141.8 (C-17), 153.8 (C-19) and one carboxyl carbon at δC 172.7 (C-13). Similarly, the signal at δH 8.37 (H-11 of compound 1b) correlated with the carbons at δC 141.8 (C-17), 154.2 (C-19) and the carboxyl carbon at δC 172.8 (C-13). The proton at δH 7.97 (H-18 of compound 1b) showed correlations with the carbons at δC 38.1 (C-6), 134.5 (C-12), 137.1 (C-10) and 172.5 (C-16). These data confirmed that the structures of 1a and 1b were similar to 14, 15-secoadociaquinone skeleton.
In addition, correlations from the protons at δ
H 7.80 (H-18) and 3.84 (H
2-21) to the carbon δ
C 173.0 (C-16) were observed in the HMBC spectrum of compound
1a, while correlations from the protons at δ
H 8.37 (H-11) and 3.84 (H
2-21) to the carbon δ
C 172.8 (C-13) were found in compound
1b. Thus, the structures of compounds
1a and
1b were determined as presented in
Figure 1 and named as xestoadociaquinone A (
1a) and xestoadociaquinone B (
1b).
Table 1.
1H and 13C NMR data for 1–4 (600 and 150 MHz, respectively) a.
Table 1.
1H and 13C NMR data for 1–4 (600 and 150 MHz, respectively) a.
| N° | 1a b | 1b b | 2 c | 3a c | 3c c | 4a c | 4c c |
|---|
| δC, m | δH, m d | δC, m | δH, m d | δC, m | δH, m d | δC, m | δH, m d | δC, m | δH, m d | δC, m | δH, m d | δC, m | δH, m d |
|---|
| 1 | 146.8 | 7.70, s | 146.8 | 7.70, s | 144.6 | 7.87, s | 145.6 | 7.94, dd, 1.5, 2.0 | 145.5 | 7.93, m | 145.7 | 7.95, m | 145.7 | 7.95, m |
| 2 | 123.2 | | 123.3 | | 121.2 | | 121.4 | | 121.5 | | 122.8 | | 122.7 | |
| 3 | 17.6 | 2.89, m | 17.6 | 2.89, m | 16.5 | 2.82, m | 16.3 | 2.83, m | 16.3 | 2.83, m | 16.3 | 2.83, m | 16.3 | 2.83, m |
| | | 2.66, m | | 2.66, m | | 2.58, m | | 2.59, m | | 2.59, m | | 2.59, m | | 2.59, m |
| 4 | 19.5 | 2.32, m | 19.5 | 2.32, m | 18.1 | 2.20, m | 17.8 | 2.20, m | 17.8 | 2.20, m | 17.9 | 2.21, m | 17.9 | 2.21, m |
| | | 2.14, m | | 2.14, m | | 2.08, m | | 2.05, m | | 2.05, m | | 2.05, m | | 2.05, m |
| 5 | 32.3 | 1.67, m | 32.2 | 2.57, m | 31.7 | 2.64, m | 30.4 | 2.67, m | 30.6 | | 30.8 | 2.55, m | 30.6 | 2.55, m |
| | | 2.57, m | | 1.67, m | | 1.68, m | | 1.56, m | | | | 1.58, m | | 1.58, m |
| 6 | 38.1 | | 38.1 | | 35.8 | | 36.7 | | 36.5 | | 36.4 | | 36.4 | |
| 7 | 149.7 | | 149.7 | | 146.4 | | 147.3 | | 147.3 | | 147.8 | | 147.8 | |
| 8 | 145.2 | | 145.2 | | 143.9 | | 143.1 | | 143.2 | | 143.3 | | 143.2 | |
| 9 | 172.5 | | 172.5 | | 171.4 | | 170.4 | | 170.5 | | 170.3 | | 170.3 | |
| 10 | 137.1 | | 137.1 | | 128.8 | | 142.6 | | 142.7 | | 135.1 | | 135.2 | |
| 11 | 128.4 | 8.64, s | 128.4 | 8.37, s | 124.7 | 9.03, s | 124.9 | 8.66, s | 124.8 | 8.65, s | 124.5 | 8.19, s | 124.4 | 8.19, s |
| 12 | 135.0 | | 134.5 | | 124.6 | | 130.2 | | 130.1 | | 137.8 | | 137.8 | |
| 13 | 172.7 e | | 172.8 e | | 162.1 | | 173.6 | | 173.6 | | 72.4 | | 72.5 | |
| 14 | | | | | 111.0 | | | | 104.0 | | 164.5 | | 164.5 | |
| 15 | | | | | 121.7 | 7.75, s | 164.2 | | 164.3 | | 104.2 | | 104.3 | |
| 16 | 173.0 | | 172.5 | | 136.6 | | 72.7 | | 72.6 | | 173.5 | | 173.7 | |
| 17 | 141.8 | | 141.8 | | 132.2 | | 132.9 | | 132.9 | | 133.9 | | 134.2 | |
| 18 | 126.2 | 7.80, s | 126.9 | 7.97, s | 119.0 | 8.16, s | 123.2 | 7.84, s | 123.3 | 7.86, s | 122.8 | 8.18, s | 122.7 | 8.16, s |
| 19 | 153.8 | | 154.2 | | 146.7 | | 154.3 | | 154.2 | | 150.9 | | 151.1 | |
| 20 | 32.6 | 1.51, s | 32.5 | 1.52, s | 34.4 | 1.44, s | 31.8 | 1.43, s | 31.6 | 1.48, s | 32.0 | 1.43, s | 32.0 | 1.43, s |
| 21 | 37.2 | 3.84, m | 37.2 | 3.84, m | 171.8 | | 48.7 | 3.38, m | 48.7 | 3.93, m | 48.7 | 3.39, m | 48.7 | 3.39, m |
| | | | | | | | | 3.40, m | | 3.90, m | | 3.33, m | | 3.33, m |
| 22 | 51.1 | 3.16, m | 51.2 | 3.16, m | | | 39.4 | 3.93, m | 39.4 | 3.38, m | 39.4 | 3.95, m | 39.4 | 3.95, m |
| | | | | | | | | 3.90, m | | 3.34, m | | 3.89, m | | 3.89, m |
| 23 | | | | | | | 87.5 | 5.61, m | 87.4 | 5.61, m | 87.5 | 5.62, m | 87.5 | 5.62, m |
| 24 | | | | | | | 44.1 | 3.24, m | 44.1 | 3.24, m | 44.0 | 3.19, m | 44.0 | 3.19, m |
| | | | | | | | | 2.12, m | | 2.12, m | | 2.04, m | | 2.04, m |
| -OH-16/13 | | | | | | | | 6.78, d, 2.0 | | 6.88, brs | | 6.79, d, 1.0 | | 6.74, d, 1.0 |
| -OH-23 | | | | | | | | 6.96, d, 9.0 | | 6.99, brs | | 7.03, d, 8.5 | | 7.03, d, 8.5 |
Figure 2.
Selected 1H-1H COSY (−) and HMBC (1H→13C) correlations of 1a and 1b.
Figure 2.
Selected 1H-1H COSY (−) and HMBC (1H→13C) correlations of 1a and 1b.
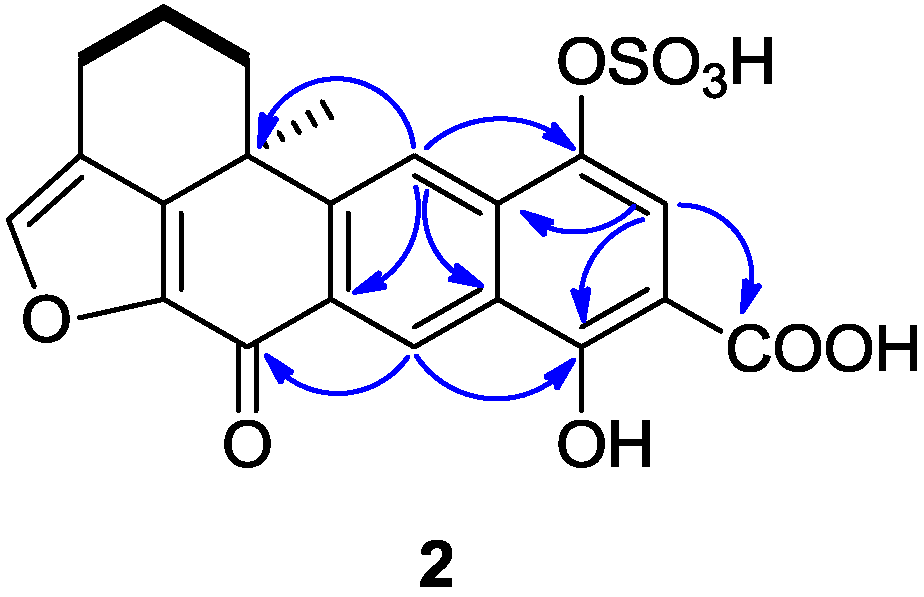
Compound
2 was isolated as a yellowish amorphous solid, with the molecular formula of C
21H
16O
9S deduced from HR-ESIMS data (
m/z 443.0447 [M + H]
+), indicating 16 degrees of unsaturation. The
1H and
13C NMR data (recorded in DMSO-
d6,
Table 1) showed similarities with those of the xestoquinol skeleton of compound
11. The major difference between compounds
2 and
11 [
8] was the presence in the
13C NMR spectrum of one carboxyl carbon signal at δ
C 171.8. The position of a carboxyl group was determined thanks to the HMBC correlations between the proton at δ
H 7.75 (H-15) and the carbons at δ
C 132.2 (C-17), 162.1(C-13), and 171.8 (C-21) (
Figure 3). Another major difference is the lack of the ortho-coupled protons system between H
14-H
15, replaced by the singlet due to H
15. Therefore, the structure of
2 was determined as being 14-carboxy-xestoquinol sulfate.
Figure 3.
Selected 1H-1H COSY (−) and HMBC (1H→13C) correlations of 2.
Figure 3.
Selected 1H-1H COSY (−) and HMBC (1H→13C) correlations of 2.
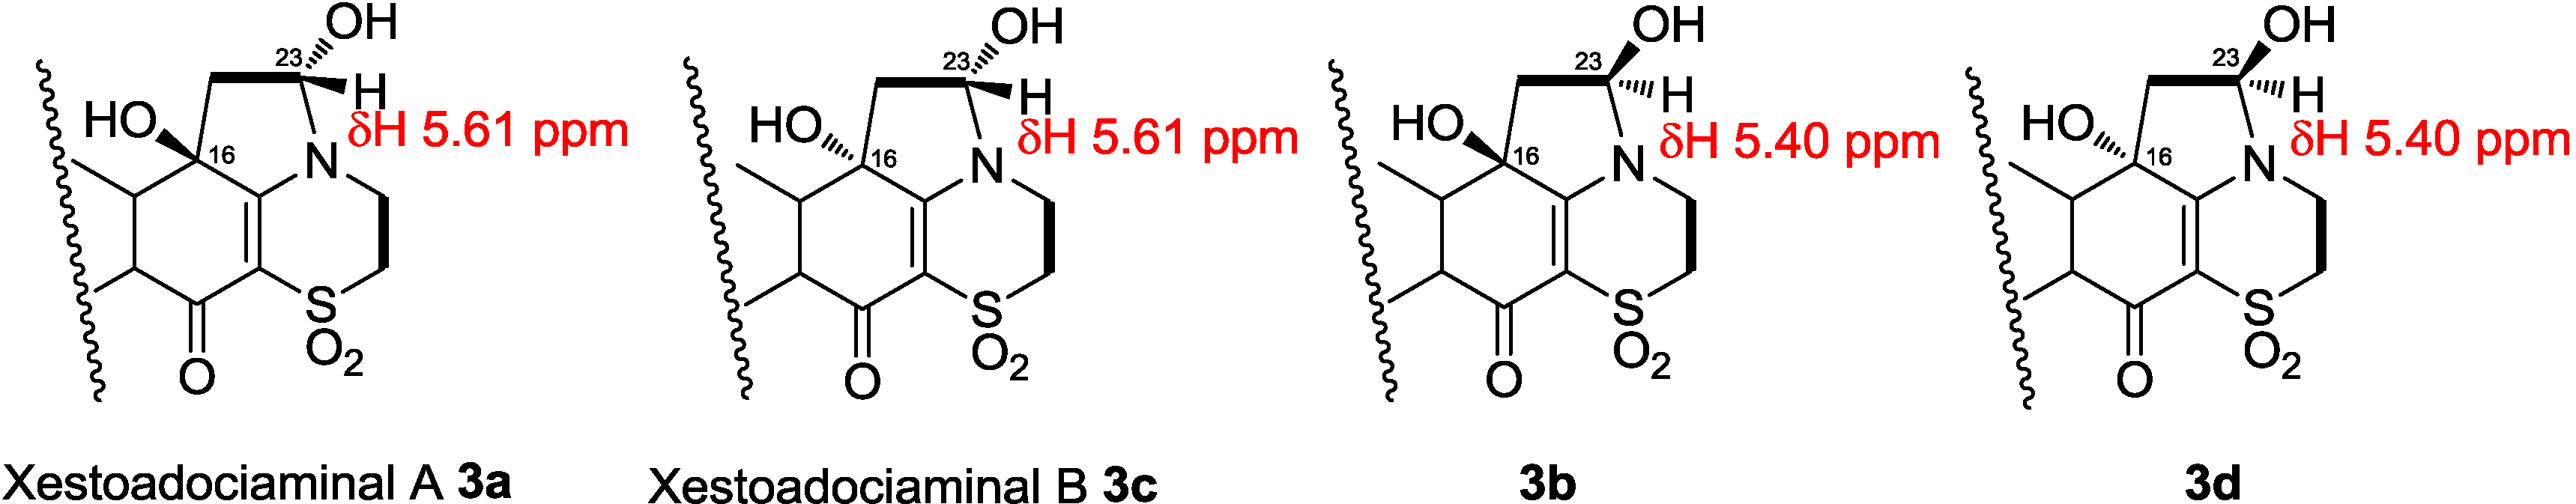
The structure elucidation of xestoadociaminals A
3a and B
3c was performed on two fractions, each of which contained the two natural products, and their hemiaminal diastereomers, in differing proportions. Compound
3a was obtained as a yellowish solid after being recrystallized slowly from a methanolic solution of
3a and
3c.
1H NMR rapidly established that the sample was comprised of
3a and
3c in a ratio of 1:0.14, in addition to two further minor compounds (hemiaminal diastereomers, see later) also being present, again in a relative ratio of 1:0.14 (see
1H NMR spectrum in
Supplementary Information). Particularly diagnostic of the presence of four compounds, were
1H resonances at δ
H 7.84, 7.78, 7.86 and 7.81 (H-18, all singlets) and δ
H 8.66, 8.64, 8.65 and 8.62 (H-11, all singlets), with both sets of signals observed in relative ratios of 1:0.14:0.14:0.02, respectively. The molecular formula of
3a was assigned as C
24H
21NO
7S based on its HRESIMS data (
m/z 468.1100 [M + H]
+), indicating 17 degrees of unsaturation. The presence of hydroxyl and carbonyl functional groups was deduced from the bands at 3649, 1752, and 1717 cm
−1 in the IR spectrum. The DEPT spectrum indicated 24 carbons, including one methyl, six methylenes, four methines, and thirteen quaternary carbons. The
1H and
13C NMR data (recorded in DMSO-
d6,
Table 1) of
3a showed some similarities with adociaquinone A [
6,
7]. In the HMBC spectrum, the correlations between the proton at δ
H 8.66 (H-11) and the carbons at δ
C 132.9 (C-17), 154.3 (C-19), 170.4 (C-9) and 173.6 (C-13), between the proton at δ
H 7.84 (H-18) and the carbons at δ
C 36.7 (C-6), 130.2 (C-12), 142.6 (C-10), as well as between the proton at δ
H 7.94 (H-1) and the carbons at δ
C 121.4 (C-2), 143.1 (C-8), and 147.3 (C-7), confirmed the partial fragment of adociaquinone skeleton [
5,
7]. The main differences were the lack of one carbonyl group and the presence of additional signals corresponding to one oxygenated quaternary carbon [δ
C 72.7 (C-16)], one oxymethine [δ
C 87.5 (C-23)/δ
H 5.61 (1H,
m, H-23)] and one methylene [δ
C 44.1 (C-24)/δ
H 3.24 (2H,
m, H-24)] signal in the
1H and
13C NMR spectra of
3a. From the
1H-
1H COSY spectrum, we observed the correlations between the protons at δ
H 2.83–2.59 (H
2-3) and the protons at δ
H 2.20–2.05 (H
2-4), which in turn gave correlations with the protons at δ
H 2.67, 1.56 (H
2-5), and between the proton at δ
H 3.93–3.90 (H
2-22) and the protons at δ
H 3.38, 3.34 (H
2-21), and particularly between the proton at δ
H 5.61 (H-23) and the protons at δ
H 3.24–2.12 (H
2-24) and the exchangeable proton at δ
H 6.96 (OH-23). The presence of a pyrrolidine ring in compound
3a was deduced by HMBC correlations between the proton at δ
H 3.24–2.12 (H
2-24) and the carbons at δ
C 72.7 (C-16), 87.5 (C-23), and 164.2 (C-15), and between the proton at δ
H 5.61 (H-23) and the carbon at δ
C 44.1 (C-24). Furthermore, the HMBC correlations observed from the exchangeable proton at δ
H 6.78 (OH-16) and the proton at δ
H 7.84 (H-18) to the carbon at δ
C 72.7 (C-16), and from the other exchangeable proton at δ
H 6.96 (OH-23) to the carbon at δ
C 87.5 (C-23) (
Figure 4) confirmed the presence of two hydroxyl groups at positions 16 and 23. Therefore, it was concluded that the structure of
3a contained a pyrrolidine ring fused between the dioxothiazine and quinone rings of adociaquinone A. With two stereogenic centres being present in this new ring system (at C-16 and C-23), in addition to the chiral centre at C-6, the four compounds in the sample being studied were ascribed to being pairs of hemiaminal diastereomers (each present in a 1:0.14 relative ratio) associated with each of the two possible C-16 stereoisomers. Observation of a NOESY correlation between the hemiaminal proton at δ
H 5.61 (H-23) and the hydroxyl proton at δ
H 6.78 (OH-16), indicated the relative disposition between these two protons in the dominant diastereomer present in the sample, however a lack of other correlations prevented determination of configuration relative to the stereocentre at C-6. While many of the
1H and
13C resonances associated with the hemiaminal diastereomer of
3a (
3b) were co-incident with those of
3a, discernible signals attributable to
3b were observed at δ
H 8.64/δ
C 124.9 (CH-11), δ
H 7.78/δ
C 123.3 (CH-18), δ
H 5.40/δ
C 88.3 (CH-23) and δ
C 74.7 (C-16). With NMR resonances assigned for each of
3a/
3b, attention then turned to a second column fraction that also contained the same four sets of NMR signals. Integration of the
1H NMR spectrum of this second fraction indicated it to be enriched in a second compound
3c, also present with its hemiaminal diastereomer
3d, with relative ratios of 1:0.15:1:0.15 (
3a:
3b:
3c:
3d). Differences between
1H NMR data observed for
3c compared to
3a were associated with the resonance of the exchangeable proton at OH-16 (δ
H 6.78 for
3a and δ
H 6.88 for
3c), H-11 (8.66
vs. 8.65), H-18 (7.84
vs. 7.86) while
13C NMR shift differences were observed for C-16 (72.7
vs. 72.6), C-23 (87.45
vs. 87.40), and C-18 (123.1
vs. 123.3). It was thus concluded that compound
3c was likely the C-16 epimer of
3a. It was named xestoadociaminal B. The fourth very minor constituent of the fraction mixtures was then presumed to be the hemiaminal diastereomer of
3c (
Figure 4).
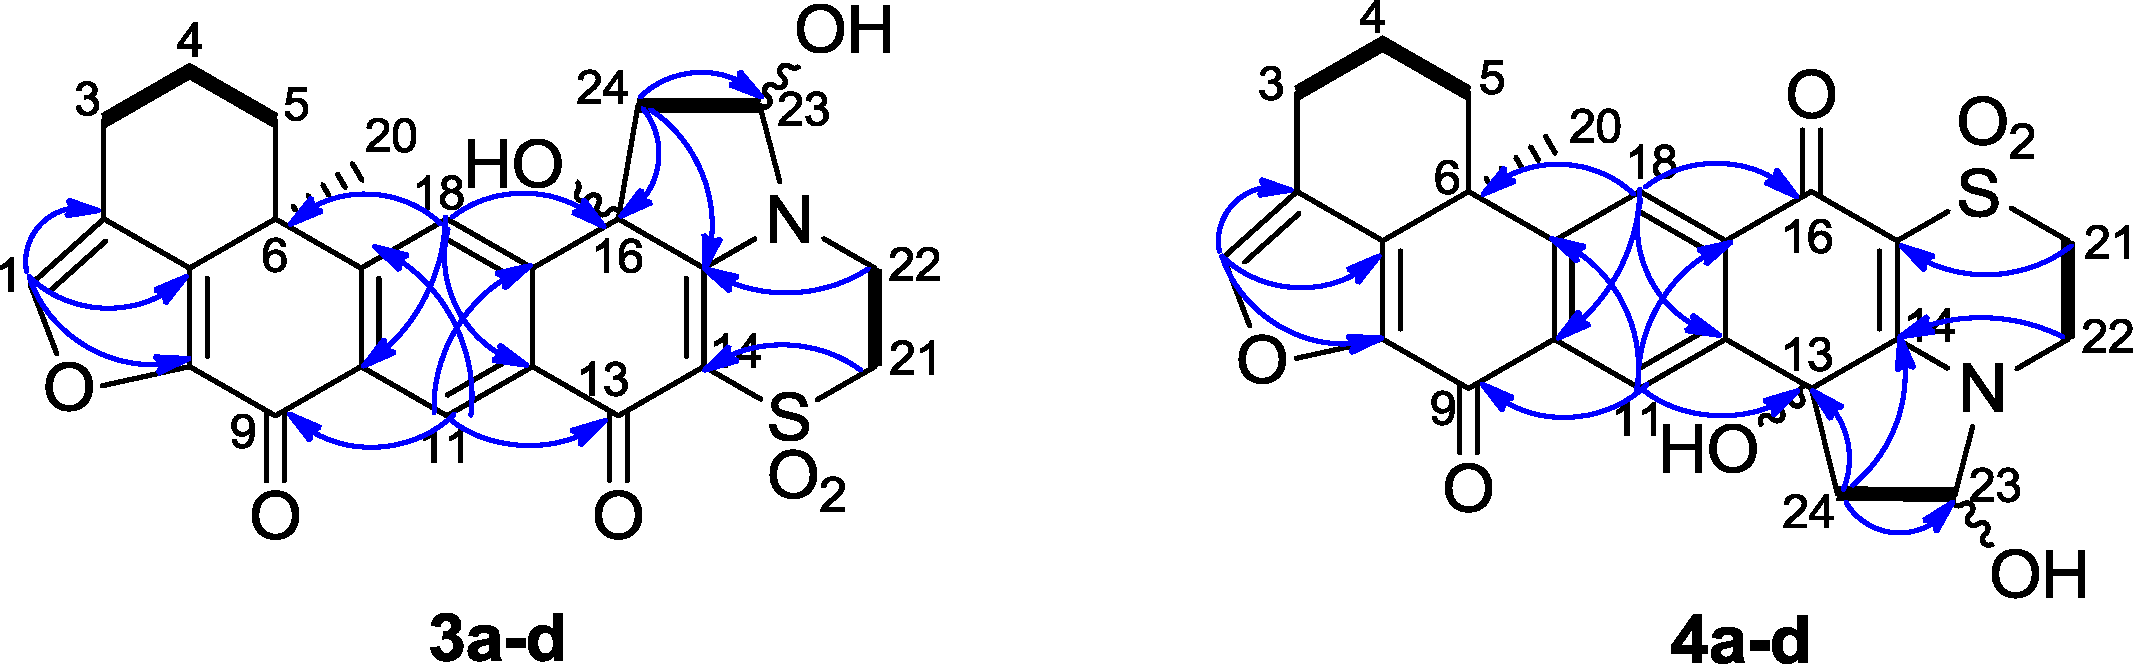
Figure 4.
Relative configuration of the hemiaminal diastereomers 3a–d.
Figure 4.
Relative configuration of the hemiaminal diastereomers 3a–d.
Compound
4 was obtained as a 1:1:0.29:0.29 mixture of four diastereoisomers (see
1H NMR spectrum in
supplementary data), isolated as a yellowish amorphous solid. The molecular formula was also assigned as C
24H
21NO
7S, being isomeric with
3a–
d. The
1H and
13C NMR data (recorded in DMSO-
d6,
Table 1) were also similar to those observed for compounds
3a–
d. The partial fragment of an adociaquinone skeleton was confirmed by the HMBC correlations between the proton at δ
H 8.19 (H-11) and the carbons at δ
C 133.9 (C-17), 150.9 (C-19) and 170.3 (C-9), between the proton at δ
H 8.18 (H-18) and the carbons at δ
C 36.5 (C-6), 135.2 (C-10), 137.8 (C-12) and 173.5 (C-16), and between the proton at δ
H 7.95 (H-1) and the carbons at δ
C 122.8 (C-2), 143.3 (C-8) and 147.8 (C-7). However, in contrast to the case of compound
3a, the HMBC spectrum also showed key correlations between the proton at δ
H 8.18 (H-18) and the carbon at δ
C 173.5 (C-16), and between the proton at δ
H 8.19 (H-11) and the carbon at δ
C 72.4 (C-13), between the exchangeable proton at δ
H 6.79 (O
H-13) and the carbons at δ
C 44.1 (C-24), 72.4 (C-13), and 137.8 (C-12) and between the other exchangeable proton at δ
H 7.03 (OH-23) to the carbons at δ
C 44.1 (C-24) and 87.5 (C-23) (
Figure 5). These correlations again identified the presence of a pyrrolidine ring fused between the dioxothiazine and quinone rings of an adociaquinone-type molecule, but in contrast to ring fusion to C-16 in
3a–
d, fusion in compound
4 was at C-13. Therefore, it was concluded that the fraction contained all four diastereomers represented by structures
4a–
d with the two major components
4a and
4c being C-13 epimers and the minor components
4b and
4d being their corresponding hemiaminal diastereomers. The major components were named xestoadociaminals C and D; their relative configurations remain unresolved due to overlapping signals. Biogenetically, the structures of
3a–
d and
4a–
d represent the addition of ethanal to adociaquinones A and B. However, it should be noted that ethanol was not used for the storage of the sponge nor in any chromatographic purification steps.
Figure 5.
Selected 1H-1H COSY (−) and HMBC (1H→13C) correlations of compounds 3a–d and 4a–d.
Figure 5.
Selected 1H-1H COSY (−) and HMBC (1H→13C) correlations of compounds 3a–d and 4a–d.
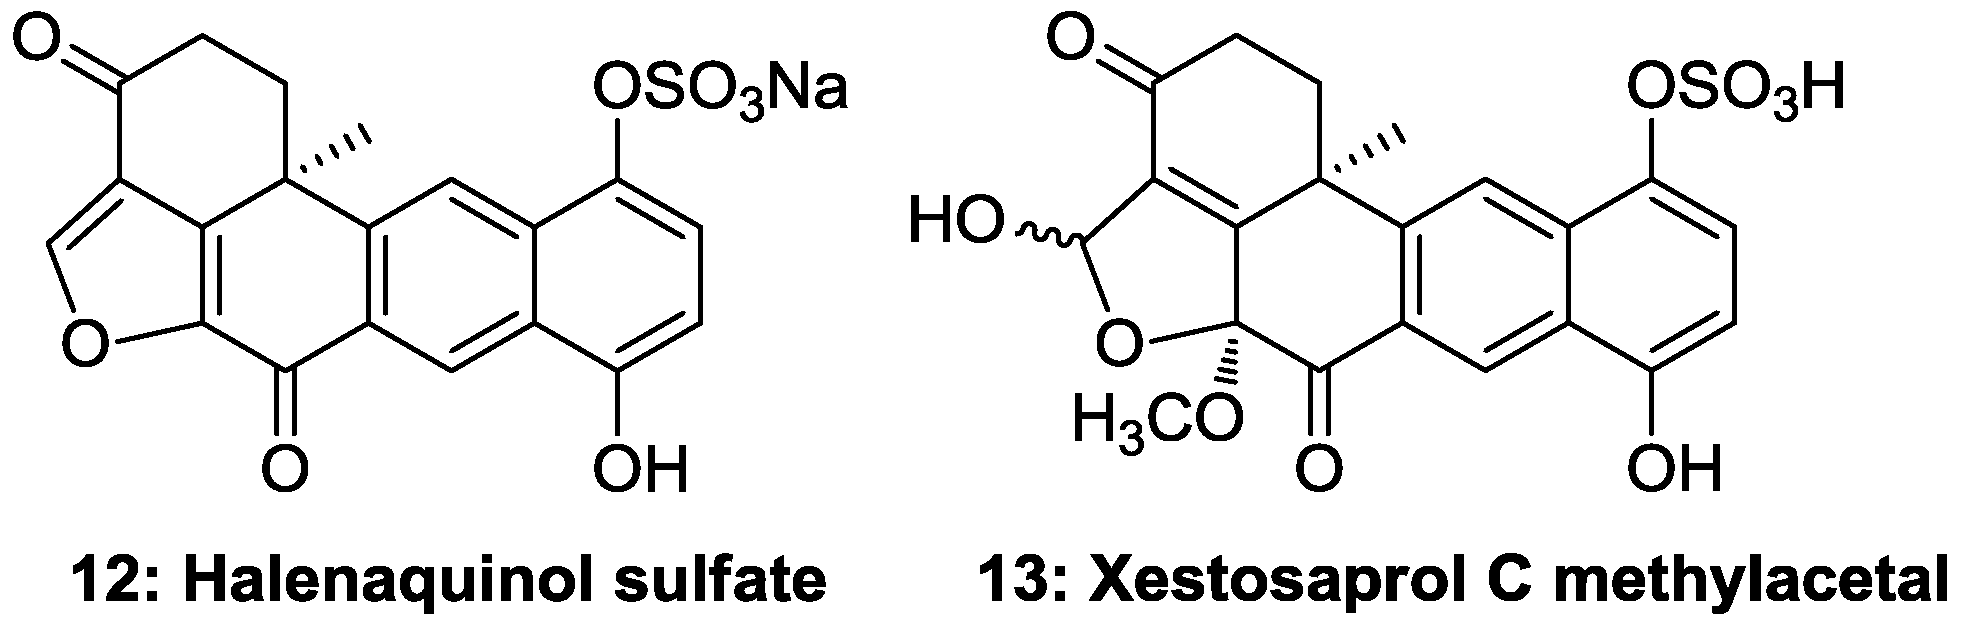
All compounds were tested against eight different protein kinases relevant to cell proliferation, cancer, diabetes and neurodegenerative disorders along with the related compounds
12 and
13 (
Figure 6), previously isolated from the marine sponge
Xestospongia sp., [
8] in order to establish structure-activity relationships. Compounds
6 and
8 revealed a modest but selective inhibitory activity towards CDK9/cyclin T (IC
50: 3 µM) and CDK5/p25 (IC
50: 6 µM), respectively. Compound
12, which is a sodium derivative and differs from
11 by the presence of the ketone group in the position 3, showed significant activity against most protein kinases ranging from 0.5 to 7.5 µM (
Table 2), while compound
13, with a hydroxyl in position C-1 and a methoxyl at C-8, showed marginal activity against DYRK1A. This information suggests that the presence of a ketone group in position 3 and eventually a non-substituted furan ring are important for the activity. Therefore, adociaquinone derivatives could be of interest in the discovery of new potential kinase inhibitors.
All the compounds were also tested for potential antioxidant and antibacterial activities. Only compound 11 showed moderate antibacterial activity with an IC50 value of 125 μM against Staphylococcus aureus.
Figure 6.
Halenaquinone derivatives of the marine sponge Xestospongia testudinaria collected in Solomon Islands.
Figure 6.
Halenaquinone derivatives of the marine sponge Xestospongia testudinaria collected in Solomon Islands.
Table 2.
Protein kinase inhibitory activity of compounds 7, 8, 12 and 13 a.
Table 2.
Protein kinase inhibitory activity of compounds 7, 8, 12 and 13 a.
| Compound b | CDK1 | CDK2 | CDK5 | CDK9 | CK1 | CLK1 | DYRK1A | GSK3 |
|---|
| 6 | >10 | >10 | >10 | 3 | >10 | >10 | >10 | >10 |
| 8 | >10 | >10 | 6 | >10 | >10 | >10 | >10 | >10 |
| 12 | 4.3 | 7.5 | 2.2 | 0.5 | 5.2 | 0.71 | 0.61 | 0.61 |
| 13 | >10 | >10 | >10 | >10 | >10 | >10 | 9.3 | >10 |
3. Experimental Section
3.1. General Experimental Procedures
Optical rotations were recorded on a Perkin-Elmer 341 polarimeter (Villebon-sur-Yvette, France). IR spectra were recorded on a FT-IR Shimadzu 8400 S spectrometer (Noisiel, France). UV spectra were recorded on a UVIKON 930 spectrometer (Kontron, France). Mass spectra were recorded on an API Q-STAR PULSAR I of Applied Biosystems (Concord, ON, Canada). NMR spectra were obtained on either a Bruker Avance 400 or 600 spectrometer (Wissenburg, France) using standard pulse sequences. The acquisition of HMBC spectra was optimized for either 7 or 8.3 Hz. Column chromatography (CC) purifications were performed using silica gel (200~400 mesh; Merck, Darmstadt, Germany) and Sephadex LH-20 (Amersham Pharmacia, Uppsala, Sweden). Fractions were analyzed by TLC using aluminum-backed sheets (Silica gel 60 F254) and visualized under UV (254 nm) and Lieberman spray reagent. Preparative TLC used glass plate coated with silica gel 60 F254, 0.25 mm thick (Merck, Darmstadt, Germany). Flash chromatography was carried out on Buchi C-615 pump system (Rungis, France). Analytical and semi-preparative reverse-phase (Gemini C6-phenyl, Luna C18 and HILIC, Phenomenex, Le Pecq, France) columns were performed with an Alliance HPLC apparatus (model 2695, Waters, Saint-Quentin en Yvelines, France), equipped with a photodiode array detector (model 2998, Waters), an evaporative light-scattering detector (model Sedex 80, Sedere, Alforville, France), and the Empower software.
3.2. Sponge Material
Specimens of Xestospongia sp. were collected in the North Sulawesi (Bunaken and other islands/reefs near Manado), Indonesia and were identified by Professor Van Soest, University of Amsterdam, the Netherlands.
3.3. Extraction and Isolation
Sponge specimens (500 g) were immediately immersed in MeOH after collection. The MeOH solution was evaporated and the aqueous residue was extracted and partitioned first with 1 L CH2Cl2 to give the CH2Cl2 extract (6.5 g). The aqueous phase was extracted with 1 L EtOAc and partitioned to afford to the EtOAc extract (1.7 g). Finally, the aqueous residue was extracted with 1 L BuOH and partitioned to obtain the BuOH extract (8.8 g).
An aliquot of the CH2Cl2 extract (3.0 g) was subsequently chromatographed on silica gel using a flash chromatographic gradient elution system from 100% (v/v) CH2Cl2 to 100% MeOH (v/v), to yield ten fractions (D1–D10). Fraction D3 (32 mg) was further purified on preparative normal-phase TLC (CH2Cl2/MeOH, 8:2 v/v) to furnish adociaquinone A 5 (7.0 mg). Fraction D4 (48.2 mg) was recrystallized in MeOH to obtain adociaquinone B 6 (18.5 mg). Fraction D5 (21 mg) was subjected to C6-phenyl reversed-phase HPLC using gradient ACN/H2O/HCOOH from 5/95/0.1 to 35/65/0.1 as eluent for 30 min (250 × 10 mm, flow rate: 3 mL/min, wavelength: 254 nm) to yield the mixture of xestoadociaminals C and D (4a, 4c, 8.8 mg). Also, fraction D6 (47 mg) was subjected to C6-phenyl reversed-phase HPLC using gradient ACN/H2O/HCOOH from 5/95/0.1 to 35/65/0.1 as eluent for 30 min (flow rate: 3 mL/min, wavelength: 254 nm) to yield the mixture of xestoadociaminals A and B 3a–d (15.0 mg) and 9.0 mg of the mixture of 15-chloro-14-hydroxyxestoquinone 9 and 14-chloro-15-hydroxyxestoquinone 10. The mixture of 3a–d was then recrystallized in MeOH to obtain mainly xestoadociaminal A 3a (3.3 mg). Fractions D8 and D9 (69 mg) were further purified on Sephadex LH-20 column, eluted with MeOH to give secoadociaquinones A 7 (12.0 mg) and B 8 (5.0 mg).
The EtOAc extract (1.7 g) was then chromatographed on silica gel using a flash chromatographic gradient elution system from 100% (v/v) CH2Cl2 to 100% MeOH (v/v), to give seven fractions (E1–E7). Fraction E3 (200 mg) was purified on a Sephadex LH-20 column (CH2Cl2/MeOH, 1:1 v/v) to give five sub-fractions (E3a–E3e). Fraction E3c was purified by preparative normal-phase TLC (CH2Cl2/MeOH, 8:2 v/v) to yield isomers of 15-chloro-14-hydroxyxestoquinone and 14-chloro-15-hydroxyxestoquinone 9 and 10 (2.5 mg). Fraction E4 (340 mg) was positive towards 2,2-diphenyl picrylhydrazyl DPPH antioxidant assay and was further purified on Sephadex LH-20 column (CH2Cl2/MeOH, 1:1 v/v) to give four sub-fractions (E4a–E4d). Sub-fraction E4a (73 mg) was purified by semi-preparative reversed-phase HPLC (Luna C-18 column 250 × 10 mm, ACN/H2O/HCOOH from 10/90/0.1 to 55/45/0.1, 30 min, 3 mL/min, 254 nm) to yield secoadociaquinones A and B 7 and 8 (5 mg). Fraction E4c (28 mg) was purified on preparative normal-phase TLC (CH2Cl2/MeOH, 8:2 v/v) to yield xestoquinol sulfate 11 (2 mg).
The butanol extract (2.7 g) was chromatographed on silica gel using a flash chromatographic gradient elution system from 100% (v/v) CH2Cl2 to 100% MeOH (v/v), to give seven fractions (B1–B7). Fraction B5 (CH2Cl2/MeOH, 8:2 v/v, 200 mg) was firstly purified on semi-preparative HPLC (Luna C-18 column, ACN/H2O/HCOOH 20/80/0.1 to 55/45/0.1, 3 mL/min, 254 nm) to yield three sub fractions B5a (60 mg), B5b (18 mg), and B5c (18 mg). Repeated purification of fraction B5b on semi-preparative HPLC (HILIC column, ACN/H2O/HCOOH 80/20/0.1, 3 mL/min, 254 nm) led to the isolation of xestoadociaquinones A and B 1a and 1b (1.7 mg) and xestoadociaminals A and B (3a, 3c, 1.5 mg). Fraction B6 (CH2Cl2/MeOH, 1:1 v/v, 115 mg) was firstly purified on semi-preparative HPLC (HILIC column, ACN/H2O/HCOOH 80/20/0.1, 254 nm) to yield three sub-fractions B6a (20 mg), B6b (65 mg), and B6c (30 mg). After repeated purification of the sub fraction B6b on semi-preparative HPLC (HILIC column 250 × 10 mm, ACN/H2O/HCOOH 90/10/0.1, 3 mL/min, 254 nm) and preparative silica TLC (CH2Cl2/MeOH, 7:3 v/v), 14-carboxy-xestoquinol sulfate 2 (2.4 mg) was isolated.
Xestoadociaquinones A and B (
1a and
1b): pale yellow amorphous solid;
1H and
13C NMR spectral data, see
Table 1; (+)-HRESIMS
m/z 434.0905 [M + H]
+ (calcd for C
20H
20NO
8S, 434.0904).
14-Carboxy-xestoquinol sulfate (
2): yellow amorphous solid, [α]
D25 −17 (
c 0.028, MeOH), UV (EtOH) λ
max (log ε): 207 (2.95) nm; IR (NaCl disk) ν
max 3318, 2924, 1740, 1458, 668 cm
−1;
1H and
13C NMR spectral data, see
Table 1; (−)-HRESIMS
m/z 443.0447 [M−H]
+ (calcd for C
21H
15O
9S, 443.0442).
Xestoadociaminal A (
3a): yellow amorphous solid, [α]
D25 −55 (
c 0.05, MeOH), UV (EtOH) λ
max (log ε): 205 (3.79), 231 (3.74), 251 (3.71), 314 (3.59) nm; IR (NaCl disk) ν
max 3649, 2924, 2855, 1752, 1717, 1508, 1458 cm
−1;
1H and
13C NMR spectral data, see
Table 1; (+)-HRESIMS
m/z 468.1100 [M + H]
+ (calcd for C
24H
22NO
7S, 468.1111).
Xestoadociaminal B (
3c): yellow amorphous solid;
1H and
13C NMR spectral data, see
Table 1; (+)-HRESIMS
m/z 468.1100 [M + H]
+ (calcd for C
24H
22NO
7S, 468.1111).
Xestoadociaminals C and D (
4a,
4c): yellow amorphous solid;
1H and
13C NMR spectral data, see
Table 1; (+)-HRESIMS
m/z 468.1100 [M + H]
+ (calcd for C
24H
22NO
7S, 468.1111).
3.4. Protein Kinase Assays
Evaluation of the protein kinase inhibitory activity was performed
in vitro as previously described [
10]. Briefly, homogenization buffer: 60 mM β-glycerophosphate, 15 mM
p-nitrophenylphosphate, 25 mM Mops (pH 7.2), 15 mM EGTA, 15 mM MgCl
2, 1 mM dithiothreitol, 1 mM sodium vanadate, 1 mM NaF, 1 mM phenylphosphate, 10 µg leupeptin mL
−1, 10 µg aprotinin mL
−1, 10 µg soybean trypsin inhibitor mL
−1, and 100 µg benzamidine. Buffer A: 10 mM MgCl
2, 1 mM EGTA, 1 mM dithiothreitol, 25 mM Tris-HCl pH 7.5, 50 µg heparin mL
−1. Buffer C: homogenization buffer but 5 mM EGTA, no NaF and no protease inhibitors. Kinase activities were assayed in triplicates in buffer A or C at 30 °C, at a final ATP concentration of 15 µM. The order of mixing the reagents was: buffers, substrate, enzyme, inhibitor and
33P-radiolabelled ATP. Isolated compounds were tested against a panel of eight kinases; namely cyclin-dependent kinase 1 (CDK1/cyclin B), cyclin-dependent kinase 2 (CDK2/cyclin A), cyclin-dependent kinase 5 (CDK5/p25), cyclin-dependent kinase 9 (CDK9/cyclin T), casein kinase 1 (CK1), Cdc2-like kinase 1 (CLK1), dual-specificity tyrosine-(Y)-phosphorylation regulated kinase 1A (DYRK1A) and glycogen synthase kinase-3α/β (GSK-3α/β).
3.5. Antibacterial Assay
The antibacterial activity assay was conducted on the bacterial strain Gram-positive Staphylococcus aureus ATCC 6538 and Gram-negative Escherichia coli ATCC 8739 evaluated in vitro by determining the IC50. A pre-culture of 5 mL LB (Luria Bertoni) medium was prepared by inoculating a colony of the bacterial strain and was incubated at 37 °C with stirring overnight. The concentration of the pre-culture was assessed by measuring the optical density OD at 620 nm and adjusted by dilution to obtain a suspension of 0.03 OD. The IC90 was determined by a liquid test in 96-well-plates. A quantity of 200 µL of the bacterial suspension was distributed in each well and 10 µL of the extracts, fractions or pure compounds solutions in DMSO (10, 5 and 2 mg/mL, respectively) were added in triplicate. The 96 well-plates were incubated at 30 °C for 16 to 18 h with shaking (450 rpm). The optical density of the wells was measured at 620 nm and the results were interpreted by calculating the percentage of growth inhibition in each well using the formula: % inhibition = 100 − (DOS − DOB)/(DOT − DOB) ×100 where T = bacterial suspension without test sample, B = culture medium without bacteria and S = bacterial suspension test sample. Ampicillin and chloramphenicol were used as positive control against S. aureus and E. coli, respectively.
3.6. Antioxidant Assay: Qualitative DPPH Screening
The potential antioxidant activity of sponge crude extract and fractions from different chromatography procedures was evaluated using the scavenging activity of the DPPH (2,2-diphenyl-1-picrylhydrazyl) free radicals. Active fractions were visualized by spraying a purple DPPH solution (2 mg/mL in MeOH) on a TLC, where extracts or fractions have been deposited. Immediate discoloration of DPPH around tested samples reveals their antioxidant activity. The well-known antioxidant ascorbic acid was used as positive control.


 ,
, 


