
Employment of Marine Polysaccharides to Manufacture Functional Biocomposites for Aquaculture Feeding Applications


Abstract
:1. Introduction
2. Results and Discussion
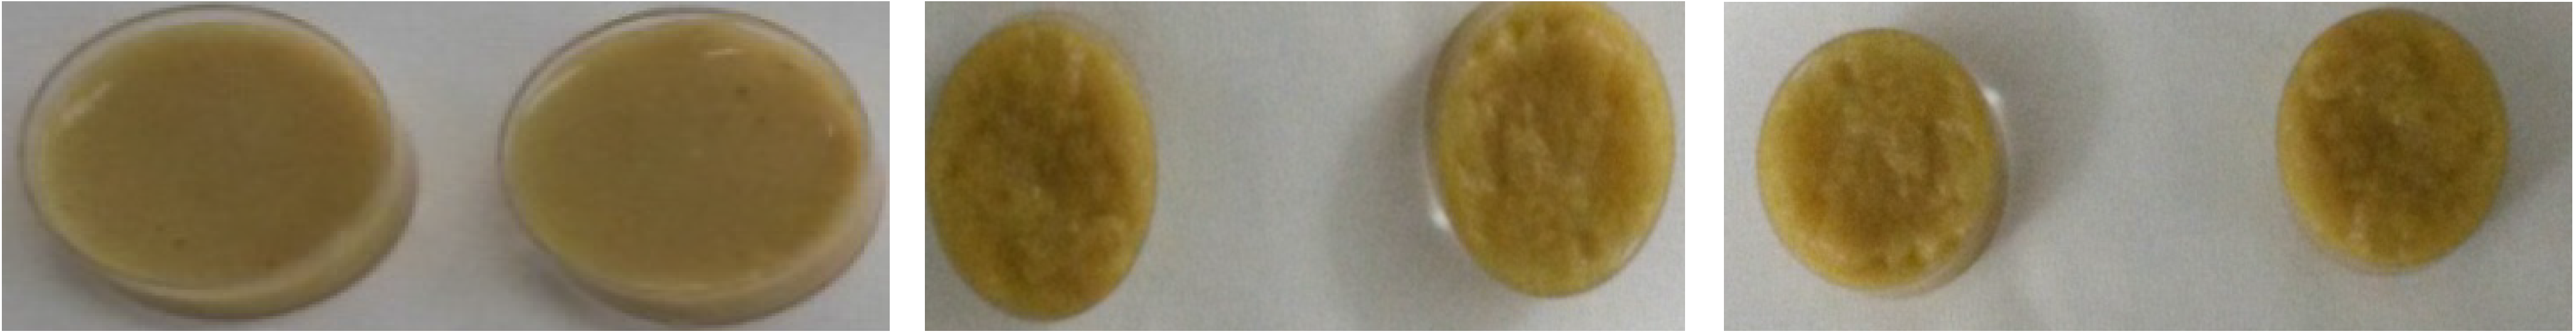
2.1. Biocomposites Manufacturing and Selection


| No. | Biocomposites | Biopolymer % | Nutrients % | Consistency |
|---|---|---|---|---|
| 1 | Sodium Alginate | 1 | 15–20–25 | 4 |
| 2 | Sodium Alginate | 1 | 5–10 | 3 |
| 3 | Sodium Alginate | 2 | 15–20–25 | 4 |
| 4 | Sodium Alginate | 2 | 5–10 | 3 |
| 5 | Sodium Alginate | 3 | 15–20–25 | 4 |
| 6 | Sodium Alginate | 3 | 5–10 | 3 |
| 7 | κ-Carrageenan | 1 | 15–20–25 | 4 |
| 8 | κ-Carrageenan | 1 | 5–10 | 3 |
| 9 | κ-Carrageenan | 2 | 15–20–25 | 4 |
| 10 | κ-Carrageenan | 2 | 5–10 | 3 |
| 11 | κ-Carrageenan | 3 | 15–20–25 | 4 |
| 12 | κ-Carrageenan | 3 | 5–10 | 3 |
| 13 | Agar | 1 | 15–20–25 | 2 |
| 14 | Agar | 1 | 5–10 | 2 |
| 15 | Agar | 2 | 15–20–25 | 2 |
| 16 | Agar | 2 | 5–10 | 1 |
| 17 | Agar | 3 | 15–20–25 | 2 |
| 18 | Agar | 3 | 5–10 | 1 |
2.2. Biocomposites Water Stability
| Agar (%) | Nutrients (%) | Total Lipids (%) | Protein (%) | Carbohydrates (%) | Water (%) |
|---|---|---|---|---|---|
| 1 | 5 | 0.240 ± 1.04 | 2.56 ± 0.44 | 7.9 ± 1.12 | 89.3 ± 0.98 |
| 1 | 10 | 0.420 ± 1.08 | 3.06 ± 0.60 | 14.7± 0.98 | 81.2 ± 1.01 |
| 1 | 15 | 0.740 ± 0.98 | 4.47 ± 0.38 | 21.7 ± 1.02 | 73.09± 1.15 |
| 1 | 20 | 0.975 ± 0.79 | 5.96 ± 1.02 | 30.5 ± 0.76 | 62.6 ± 1.30 |
| 1 | 25 | 1.58 ± 0.08 | 7.39 ± 0.79 | 38.4 ± 0.54 | 52.6 ± 0.94 |
| 2 | 5 | 0.257 ± 0.16 | 2.32 ± 1.12 | 7.7 ± 0.38 | 88.3 ± 0.84 |
| 2 | 10 | 0.432 ± 0.21 | 3.46 ± 0.74 | 13.7 ± 0.44 | 82.2 ± 0.79 |
| 2 | 15 | 0.750 ± 0.38 | 4.50 ± 0.67 | 21.0 ± 0.67 | 72.8 ± 0.78 |
| 2 | 20 | 0.946 ± 0.20 | 5.89 ± 0.21 | 30.3 ± 1.23 | 62.1 ± 1.05 |
| 2 | 25 | 1.64 ± 0.24 | 7.25 ± 1.02 | 38.0 ± 1.21 | 51.9 ± 1.16 |
| 3 | 5 | 0.235 ± 0.19 | 2.32 ± 0.14 | 7.5 ± 1.34 | 89.1 ± 0.60 |
| 3 | 10 | 0.453 ± 0.32 | 3.38 ± 0.23 | 14.3 ± 0.98 | 81.7 ± 0.59 |
| 3 | 15 | 0.736 ± 0.48 | 4.86 ± 0.36 | 21.9 ± 0.87 | 73.32 ± 0.54 |
| 3 | 20 | 0.967 ± 0.21 | 6.02 ± 0.16 | 31.1 ± 1.37 | 62.3 ± 0.54 |
| 3 | 25 | 1.59 ± 0.38 | 7.63 ± 0.76 | 38.2 ± 0.97 | 52.1 ± 0.38 |
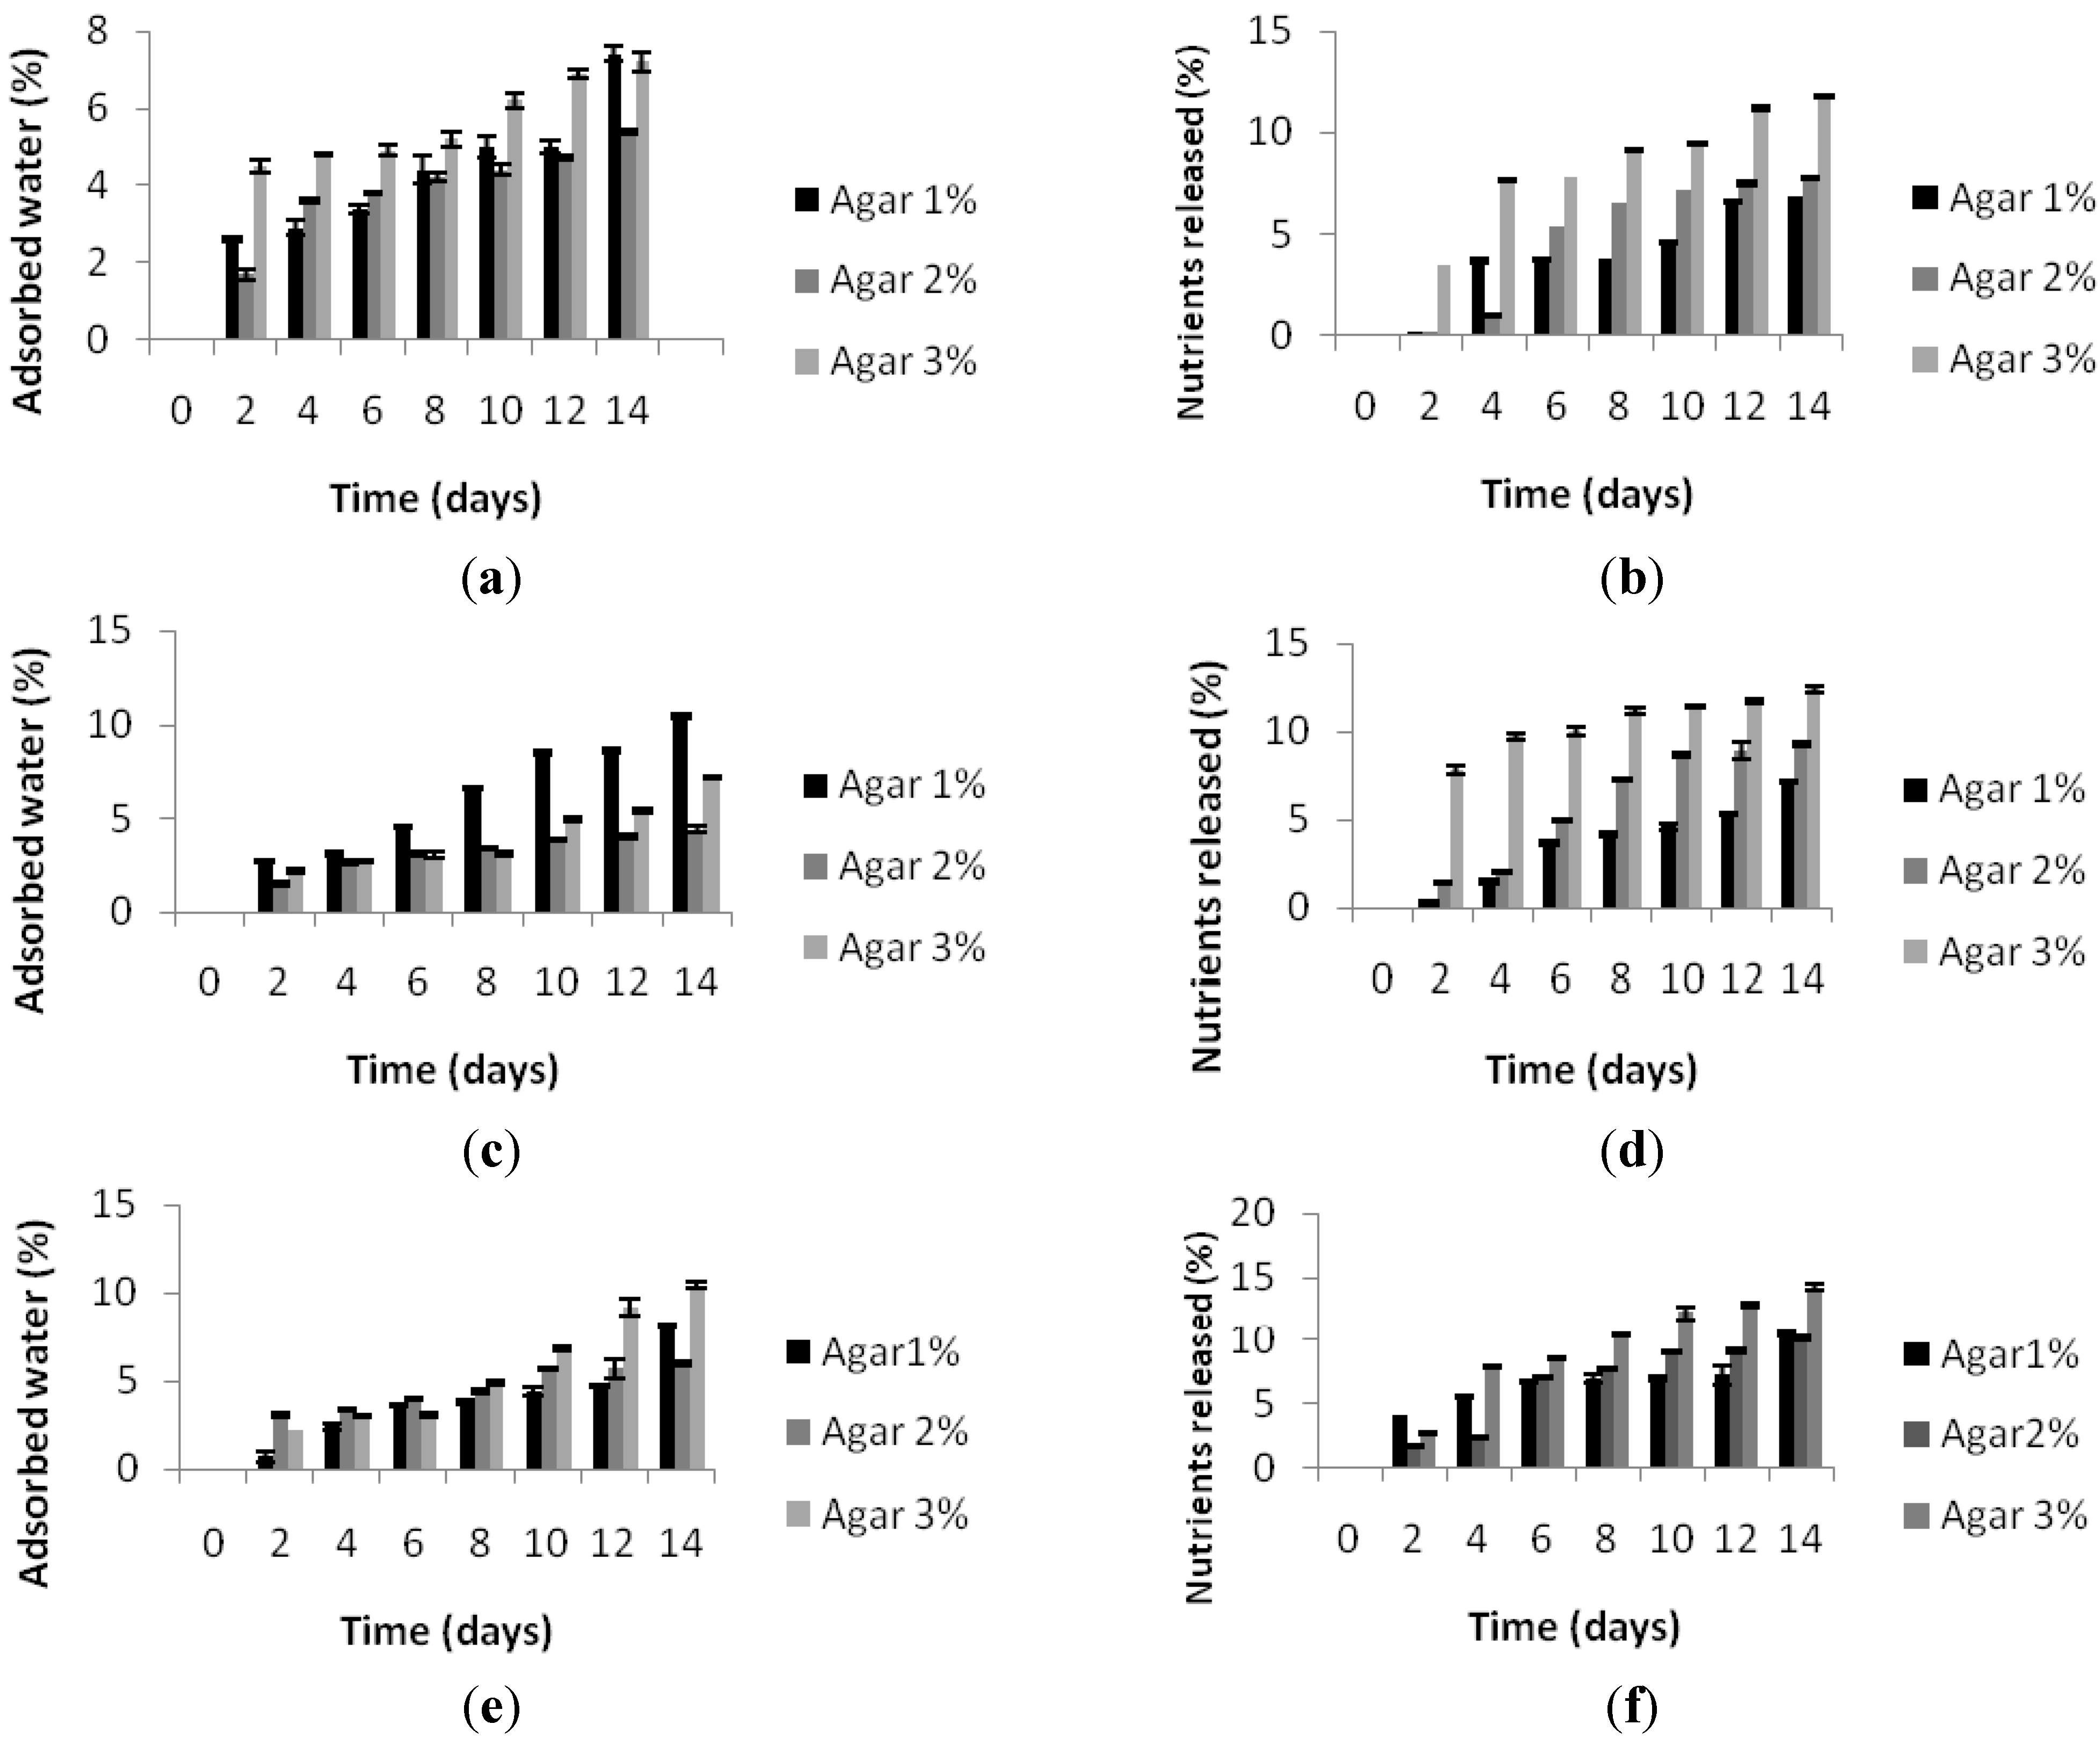
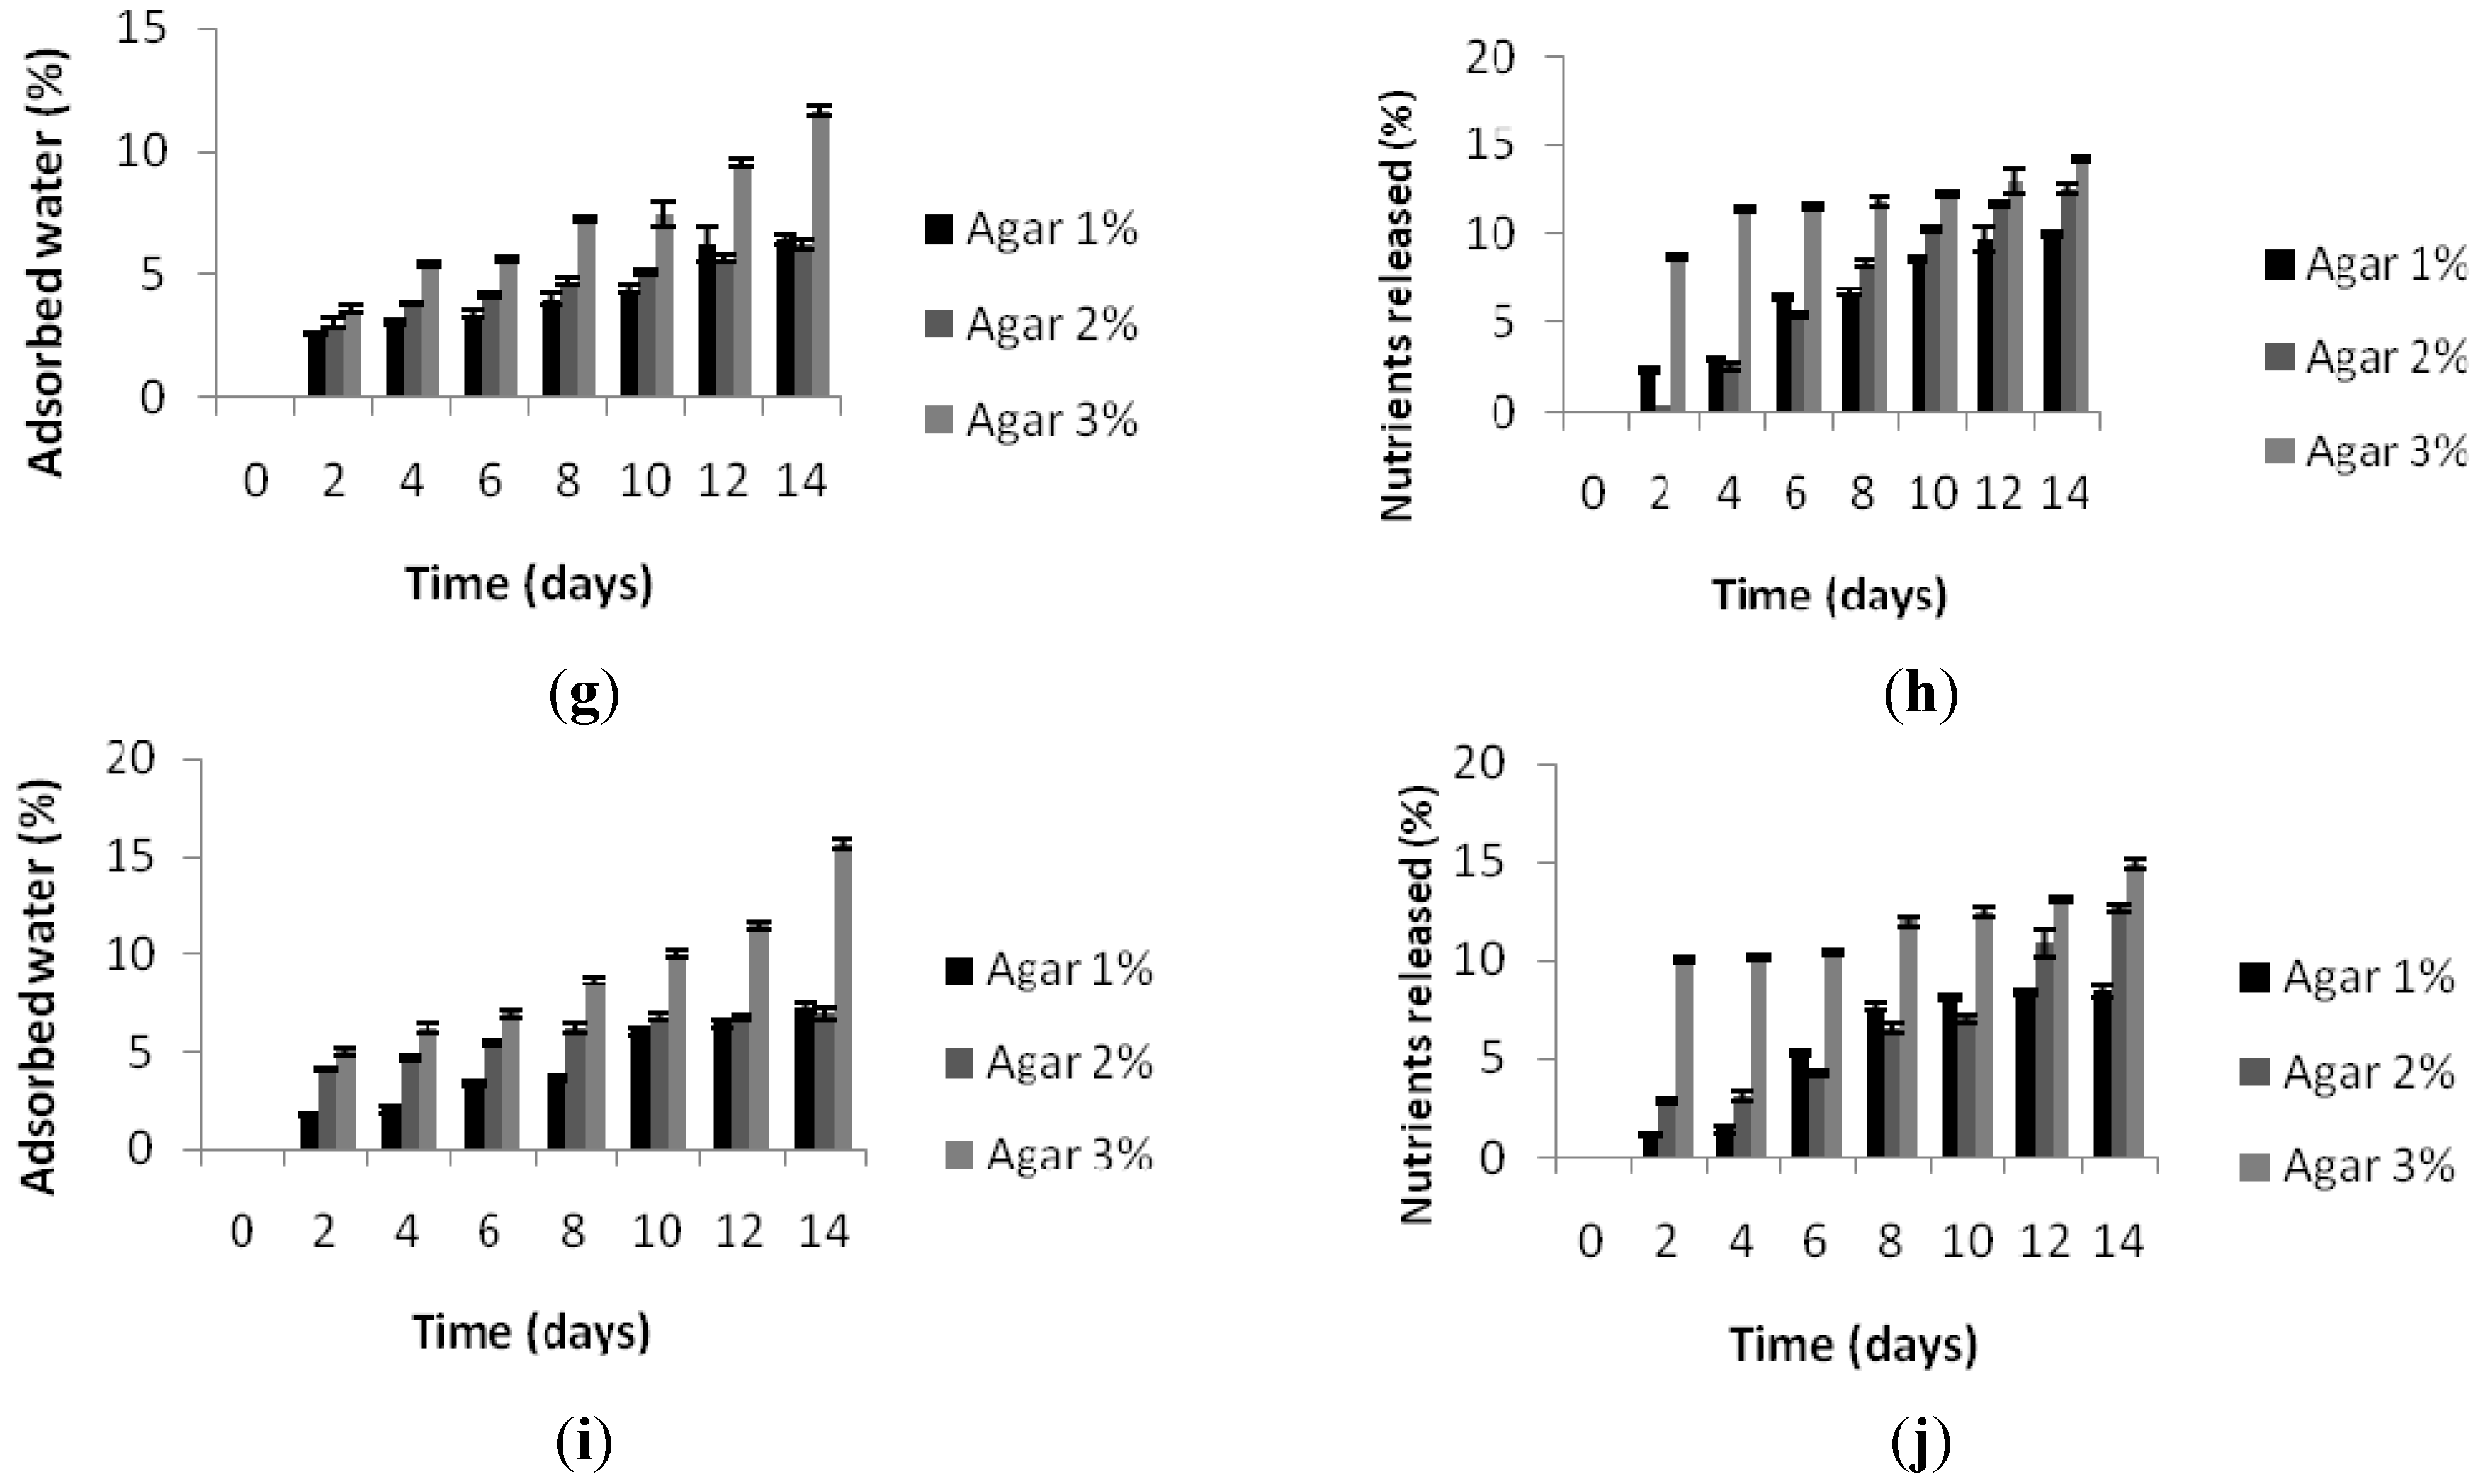
2.2.1. Swelling
2.2.2. Nutrient Release


2.2.3. Granulometric Analysis
| (a) | ||||||
| Days | Derived Diameters (μm) | Derived Diameters (μm) Nutrients 10% | ||||
| Nutrients 5% | Nutrients 10% | |||||
| Agar 1% | Agar 2% | Agar 3% | Agar 1% | Agar 2% | Agar 3% | |
| 2 | 46.24 ± 0.02 | 13.82 ± 0.03 | 44.50 ± 0.22 | 54.41 ± 0.02 | 269.71 ± 0.41 | 108.35 ± 0.04 |
| 4 | 284.28 ± 0.11 | 57.44 ± 0.02 | 56.91 ± 0.23 | 304.51 ± 0.32 | 223.34 ± 0.32 | 171.62 ± 0.12 |
| 6 | 272.58 ± 0.04 | 160.62 ± 0.14 | 121.64 ± 0.02 | 251.39 ± 0.44 | 326.05 ± 0.19 | 206.51 ± 0.22 |
| 8 | 260.88 ± 0.04 | 162.90 ± 0.22 | 141.17 ± 0.02 | 204.66 ± 0.34 | 356.84 ± 0.24 | 142.19 ± 0.32 |
| 10 | 245.33 ± 0.12 | 176.49 ± 0.03 | 181.60 ± 0.02 | 287.82 ± 0.27 | 242.10 ± 0.12 | 64.83 ± 0.28 |
| 12 | 239.62 ± 0.02 | 286.53 ± 0.05 | 310.29 ± 0.02 | 324.26 ± 0.78 | 248.48 ± 0.52 | 67.62 ± 0.34 |
| 14 | 233.92 ± 0.12 | 255.93 ± 0.11 | 333.36 ± 0.02 | 339.68 ± 0.05 | 140.13 ± 0.62 | 70.42 ± 0.25 |
| (b) | ||||||
| Days | Derived diameters (μm) | Derived diameters (μm) | ||||
| Nutrients 15% | Nutrients 20% | |||||
| Agar 1% | Agar 2% | Agar 3% | Agar 1% | Agar 2% | Agar 3% | |
| 2 | 317.48 ± 0.32 | 121.37 ± 0.04 | 109.40 ± 0.08 | 277.23 ± 0.04 | 258.04 ± 0.14 | 245.63 ± 0.18 |
| 4 | 335.00 ± 0.22 | 224.71 ± 0.24 | 327.59 ± 0.18 | 323.17 ± 0.11 | 218.70 ± 0.29 | 211.55 ± 0.21 |
| 6 | 303.12 ± 0.12 | 242.44 ± 0.14 | 218.19 ± 0.13 | 349.98 ± 0.12 | 295.13 ± 0.30 | 227.21 ± 0.24 |
| 8 | 217.69 ± 0.02 | 271.51 ± 0.12 | 114.81 ± 0.10 | 375.91 ± 0.12 | 265.84 ± 0.34 | 258.74 ± 0.34 |
| 10 | 306.61 ± 0.23 | 119.16 ± 0.05 | 153.46 ± 0.12 | 364.81 ± 0.09 | 236.55 ± 0.27 | 290.28 ± 0.27 |
| 12 | 280.82 ± 0.11 | 186.35 ± 0.11 | 192.12 ± 0.09 | 273.88 ± 0.09 | 330.72 ± 0.24 | 286.87 ± 0.38 |
| 14 | 238.41 ± 0.11 | 254.70 ± 0.12 | 356.19 ± 0.08 | 231.23 ± 0.22 | 188.70 ± 0.38 | 106.41 ± 0.44 |
2.2.4. Quercetin Release

3. Materials and Methods
3.1. Biocomposites Formulation and Preparation
| Ingredient | Dry Weight (%) |
|---|---|
| Fish meal | 19.00 |
| Legume meal | 27.00 |
| Corn meal a | 24.00–25.00 |
| Algae meal | 25.00 |
| Fish oil | 1.80 |
| Mineral mix | 0.10 |
| Vitamin mix | 0.10 |
3.2. Behavior in Water of Biocomposites
3.2.1. Swelling
3.2.2. Nutrients Release
3.2.3. Granulometric Analysis
3.2.4. Quercetin Release
3.3. Statistical Analysis
4. Conclusions
Acknowledgements
Author Contributions
Conflicts of Interest
References
- Silva, T.H.; Alves, A.; Ferreira, B.M.; Oliveira, J.M.; Reys, L.L.; Ferreira, R.J.F.; Sousa, R.A.; Silva, S.S.; Mano, J.F.; Reis, R.L. Materials of marine origin: A review on polymers and ceramics of biomedical interest. Int. Mater. Rev. 2012, 57, 276–306. [Google Scholar] [CrossRef]
- Farris, S.; Schaich, K.M.; Liu, L.; Piergiovanni, L.; Yam, K.L. Development of polyion-complex hydrogels as an alternative approach for the production of bio-based polymers for food packaging applications: A review. Trends Food Sci. Technol. 2009, 20, 316–332. [Google Scholar] [CrossRef]
- Volpe, M.G.; Malinconico, M.; Varricchio, E.; Paolucci, M. Polysaccharides as biopolymers for food shelf-life extention. Rec. Pat. Food Nutr. Agric. 2010, 2, 129–139. [Google Scholar] [CrossRef]
- Paolucci, M.; Fabbrocini, A.; Volpe, M.G.; Varricchio, E.; Coccia, E. Development of biopolymers as binders for feed for farmed aquatic organisms. In Aquaculture; Muchlisin, Z.A., Ed.; InTech Publishers: New York, NY, USA, 2012; pp. 3–34. [Google Scholar]
- Volpe, M.G.; Santagata, G.; Coccia, E.; di Stasio, M.; Malinconico, M.; Paolucci, M. Pectin based pellets for crayfish aquaculture: Structural and functional characteristics and effects on redclaw Cherax quadricarinatus performances. Aquac. Nutr. 2014, in press. [Google Scholar]
- Volpe, M.G.; Monetta, M.; di Stasio, M.; Paolucci, M. Rheological behavior of polysaccharide based pellets for crayfish feeding tested on growth in the crayfish Cherax albidus. Aquaculture 2008, 274, 339–346. [Google Scholar] [CrossRef]
- Volpe, M.G.; Varricchio, E.; Coccia, E.; Santagata, G.; di Stasio, M.; Malinconico, M.; Paolucci, M. Manufacturing pellets with different binders: Effect on water stability and feeding response in juvenile Cherax albidus. Aquaculture 2012, 324–325, 104–110. [Google Scholar] [CrossRef]
- Coccia, E.; Santagata, G.; Malinconico, M.; Volpe, M.G.; di Stasio, M.; Paolucci, M. Cherax albidus juveniles fed polysaccharide-based pellets: Rheological behavior and effect on growth. Freshw. Crayfish 2010, 17, 13–18. [Google Scholar]
- Usov, A.I. Structure analysis of red seaweed galactan of agar and carrageenan groups. Food Hydrocoll. 1998, 12, 301–308. [Google Scholar] [CrossRef]
- Draget, K.I.; Skjak-Bræk, G.; TorgerStokke, B. Similarities and differences between alginic acid gels and ionically crosslinked alginate gels. Food Hydrocoll. 2006, 20, 170–175. [Google Scholar] [CrossRef]
- Murano, E.; Toffanin, R.; Zanetti, F.; Knutsen, S.H.; Paoletti, S.; Rizzo, R. Chemical and macromolecular characterisation of agar polymers from Gracilaria dura (C. Agardh) J. agardh (Gracilariaceae, Rhodophyta). Carbohydr. Polym. 1992, 18, 171–178. [Google Scholar] [CrossRef]
- Kalia, A.N. Textbook of Industrial Pharmacognosy; CBS Publishers and Distributors: New Delhi, India, 2005; ISBN 8123912099. [Google Scholar]
- Anderson, N.S.; Campbell, J.W.; Harding, M.M.; Rees, D.A.; Samuel, J.W.B. X-ray diffraction studies of polysaccharide sulphates: Double helix models of κ-and ι-carrageenans. J. Mol. Biol. 1969, 45, 85–88. [Google Scholar] [CrossRef] [PubMed]
- Manach, C.; Scalbert, A.; Morand, C.; Rémésy, C.; Jiménez, L. Polyphenols, food sources and bioavailability. Am. J. Clin. Nut. 2004, 79, 727–747. [Google Scholar]
- Zandi, K.; Teoh, B.T.; Sam, S.S.; Wong, P.F.; Mustafa, M.R.; AbuBakar, S. Antiviral activity of four types of bioflavonoid against dengue virus type-2. Virol. J. 2011, 8, 560. [Google Scholar] [CrossRef]
- Funatogawa, K.; Hayashi, S.; Shimomura, H.; Yoshida, T.; Hatano, T.; Ito, H.; Iría, Y. Antibacterial activity of hydrolysable tannins derived from medicinal plants against Helicobacter pylori. Microbiol. Immunol. 2004, 48, 251–261. [Google Scholar] [CrossRef] [PubMed]
- Karou, D.; Dicko, M.H.; Simpore, J.; Traore, A.S. Antioxidant and antibacterial activities of polyphenols from ethnomedicinal plants of Burkina Faso. Afr. J. Biotechnol. 2005, 4, 823–828. [Google Scholar]
- Tavassoli, S.; Djomeh, Z.E. Total phenols, antioxidant potential and antimicrobial activity of methanol extract of rosemary (Rosmarinus officinalis L.). Glob. Vet. 2011, 7, 337–341. [Google Scholar]
- Yang, C.Y.L.; Yen, K.Y. Induction of apoptosis by hydrolysable tannins from Eugenia jambos L. on human leukemia cells. Cancer Lett. 2000, 157, 65–75. [Google Scholar] [CrossRef] [PubMed]
- Tanimura, S.; Kadomoto, R.; Tanaka, T.; Zhang, Y.J.; Kouno, I.; Kohno, M. Suppression of tumor cell invasiveness by hydrolyzable tannins (plant polyphenols) via the inhibition of matrix metalloproteinase-2/-9 activity. Biochem. Biophys. Res. Commun. 2005, 330, 1306–1313. [Google Scholar]
- Molan, A.L.; Faraj, A.M. The effects of condensed tannins extracted from different plant species on egg hatching and larval development of Teladorsagia circumcincta (Nematoda: Trichostrongylidae). Folia Parasitol. 2010, 57, 62–68. [Google Scholar] [CrossRef] [PubMed]
- Pearce, C.M.; Daggett, T.L.; Robinson, S.M.C. Effect of binder type and concentration of prepared feed stability and gonad yield and quality of the green sea urchin, Strongylocentrotus droebachiensis. Aquaculture 2002, 205, 301–323. [Google Scholar] [CrossRef]
- Armisen, R.; Galactas, F. Production, properties and uses of agar. In Production and Utilisation of Products from Commercial Seaweeds; McHugh, D.J., Ed.; FAO Fisheries Technical Paper Publisher: Roma, Italy, 1987; pp. 1–57. [Google Scholar]
- Dominy, W.G.; Lim, C. Performance of binder in pelleted shrimp diets. In Proceedings of the Aquaculture Fee Processing and Nutrition Workshop, Thailand and Indonesia, 19–25 September 1991; pp. 149–157.
- Araki, C. Some recent studies on the polysaccharides of agarophytes. Proc. Int. Seaweed Symp. 1966, 5, 3–19. [Google Scholar]
- Partridge, G.J.; Southgate, P.C. The effect ofbinder composition on ingestion and assimilation of microbound diets (MBD) by barramundi Lates calcarifer Bloch larvae. Aquac. Res. 1999, 30, 879–886. [Google Scholar] [CrossRef]
- Fabbrocini, A.; Volpe, M.G.; di Stasio, M.; D’Adamo, R.; Maurizio, D.; Coccia, E.; Paolucci, M. Agar-based pellet as feed for sea urchins (Paracentrotus lividus): Rheological behaviour, digestive enzymes and gonad growth. Aquac. Res. 2012, 43, 321–331. [Google Scholar] [CrossRef]
- Akroum, S.; Bendjeddou, D.; Satta, D.; Lalaoui, K. Antibacterial, antioxidant and acute toxicity tests on flavonoids extracted from some medicinal plants. Int. J. Green Pharm. 2010, 4, 165–169. [Google Scholar] [CrossRef]
- AOAC Official Method International. Available online: http://www.aoac.org (accessed on 8 October 2007).
© 2015 by the authors; licensee MDPI, Basel, Switzerland. This article is an open access article distributed under the terms and conditions of the Creative Commons Attribution license (http://creativecommons.org/licenses/by/4.0/).
Share and Cite
Paolucci, M.; Fasulo, G.; Volpe, M.G. Employment of Marine Polysaccharides to Manufacture Functional Biocomposites for Aquaculture Feeding Applications. Mar. Drugs 2015, 13, 2680-2693. https://doi.org/10.3390/md13052680
Paolucci M, Fasulo G, Volpe MG. Employment of Marine Polysaccharides to Manufacture Functional Biocomposites for Aquaculture Feeding Applications. Marine Drugs. 2015; 13(5):2680-2693. https://doi.org/10.3390/md13052680
Chicago/Turabian StylePaolucci, Marina, Gabriella Fasulo, and Maria Grazia Volpe. 2015. "Employment of Marine Polysaccharides to Manufacture Functional Biocomposites for Aquaculture Feeding Applications" Marine Drugs 13, no. 5: 2680-2693. https://doi.org/10.3390/md13052680