
Lipids and Composition of Fatty Acids of Saccharina latissima Cultivated Year-Round in Integrated Multi-Trophic Aquaculture


Abstract
:1. Introduction
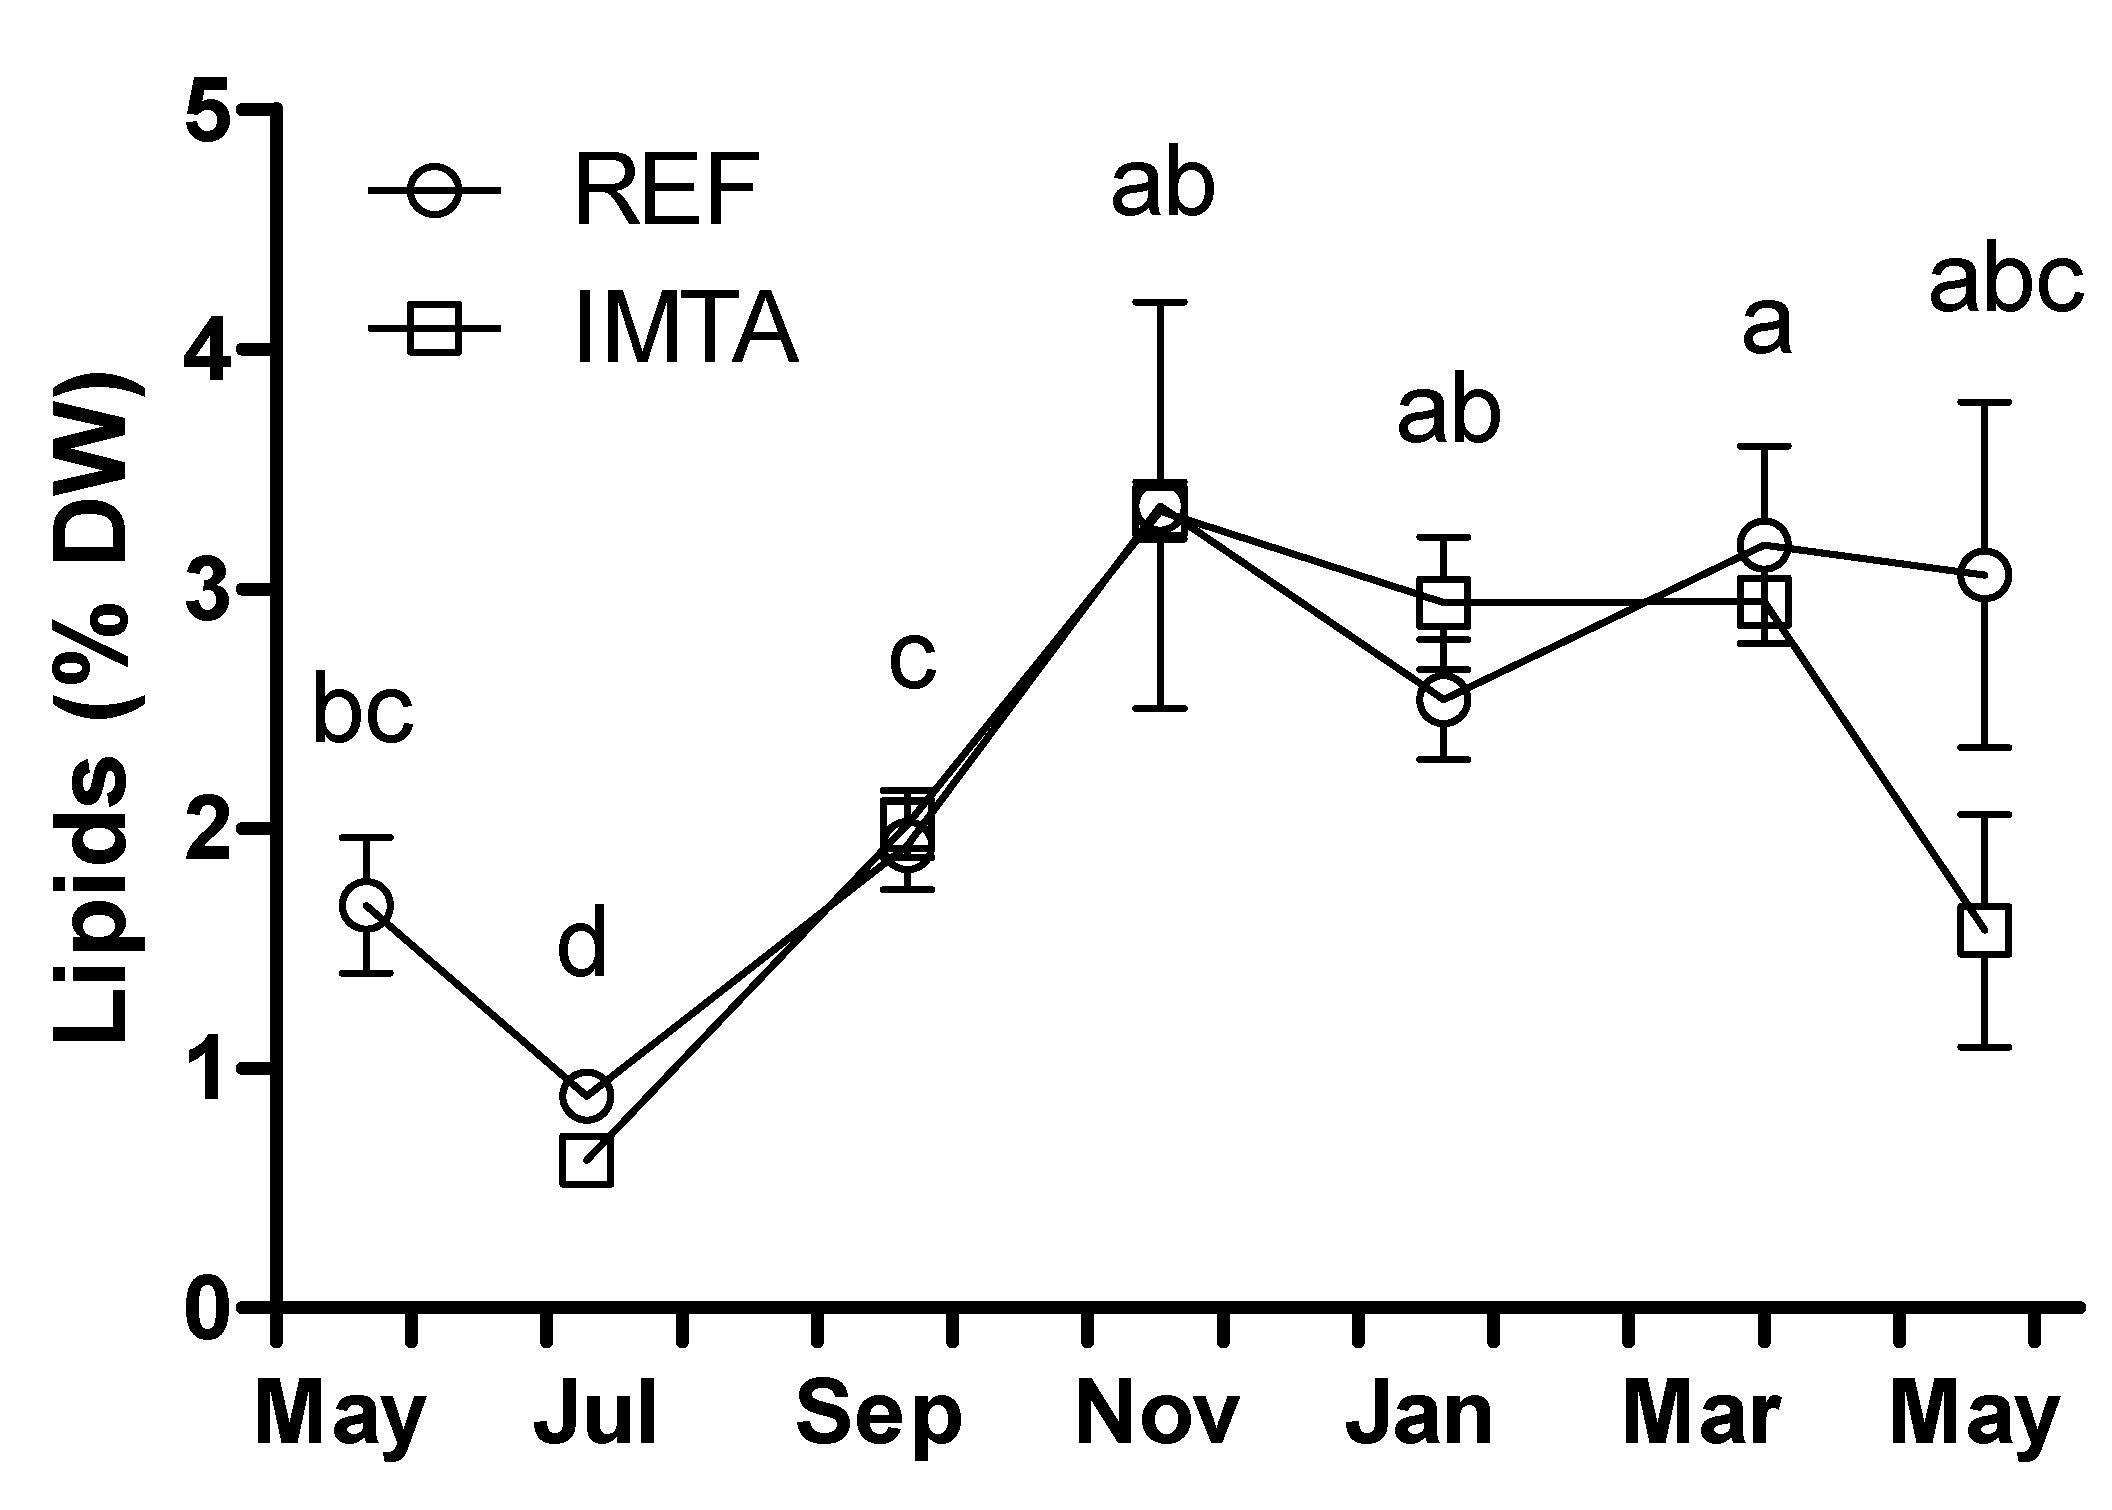
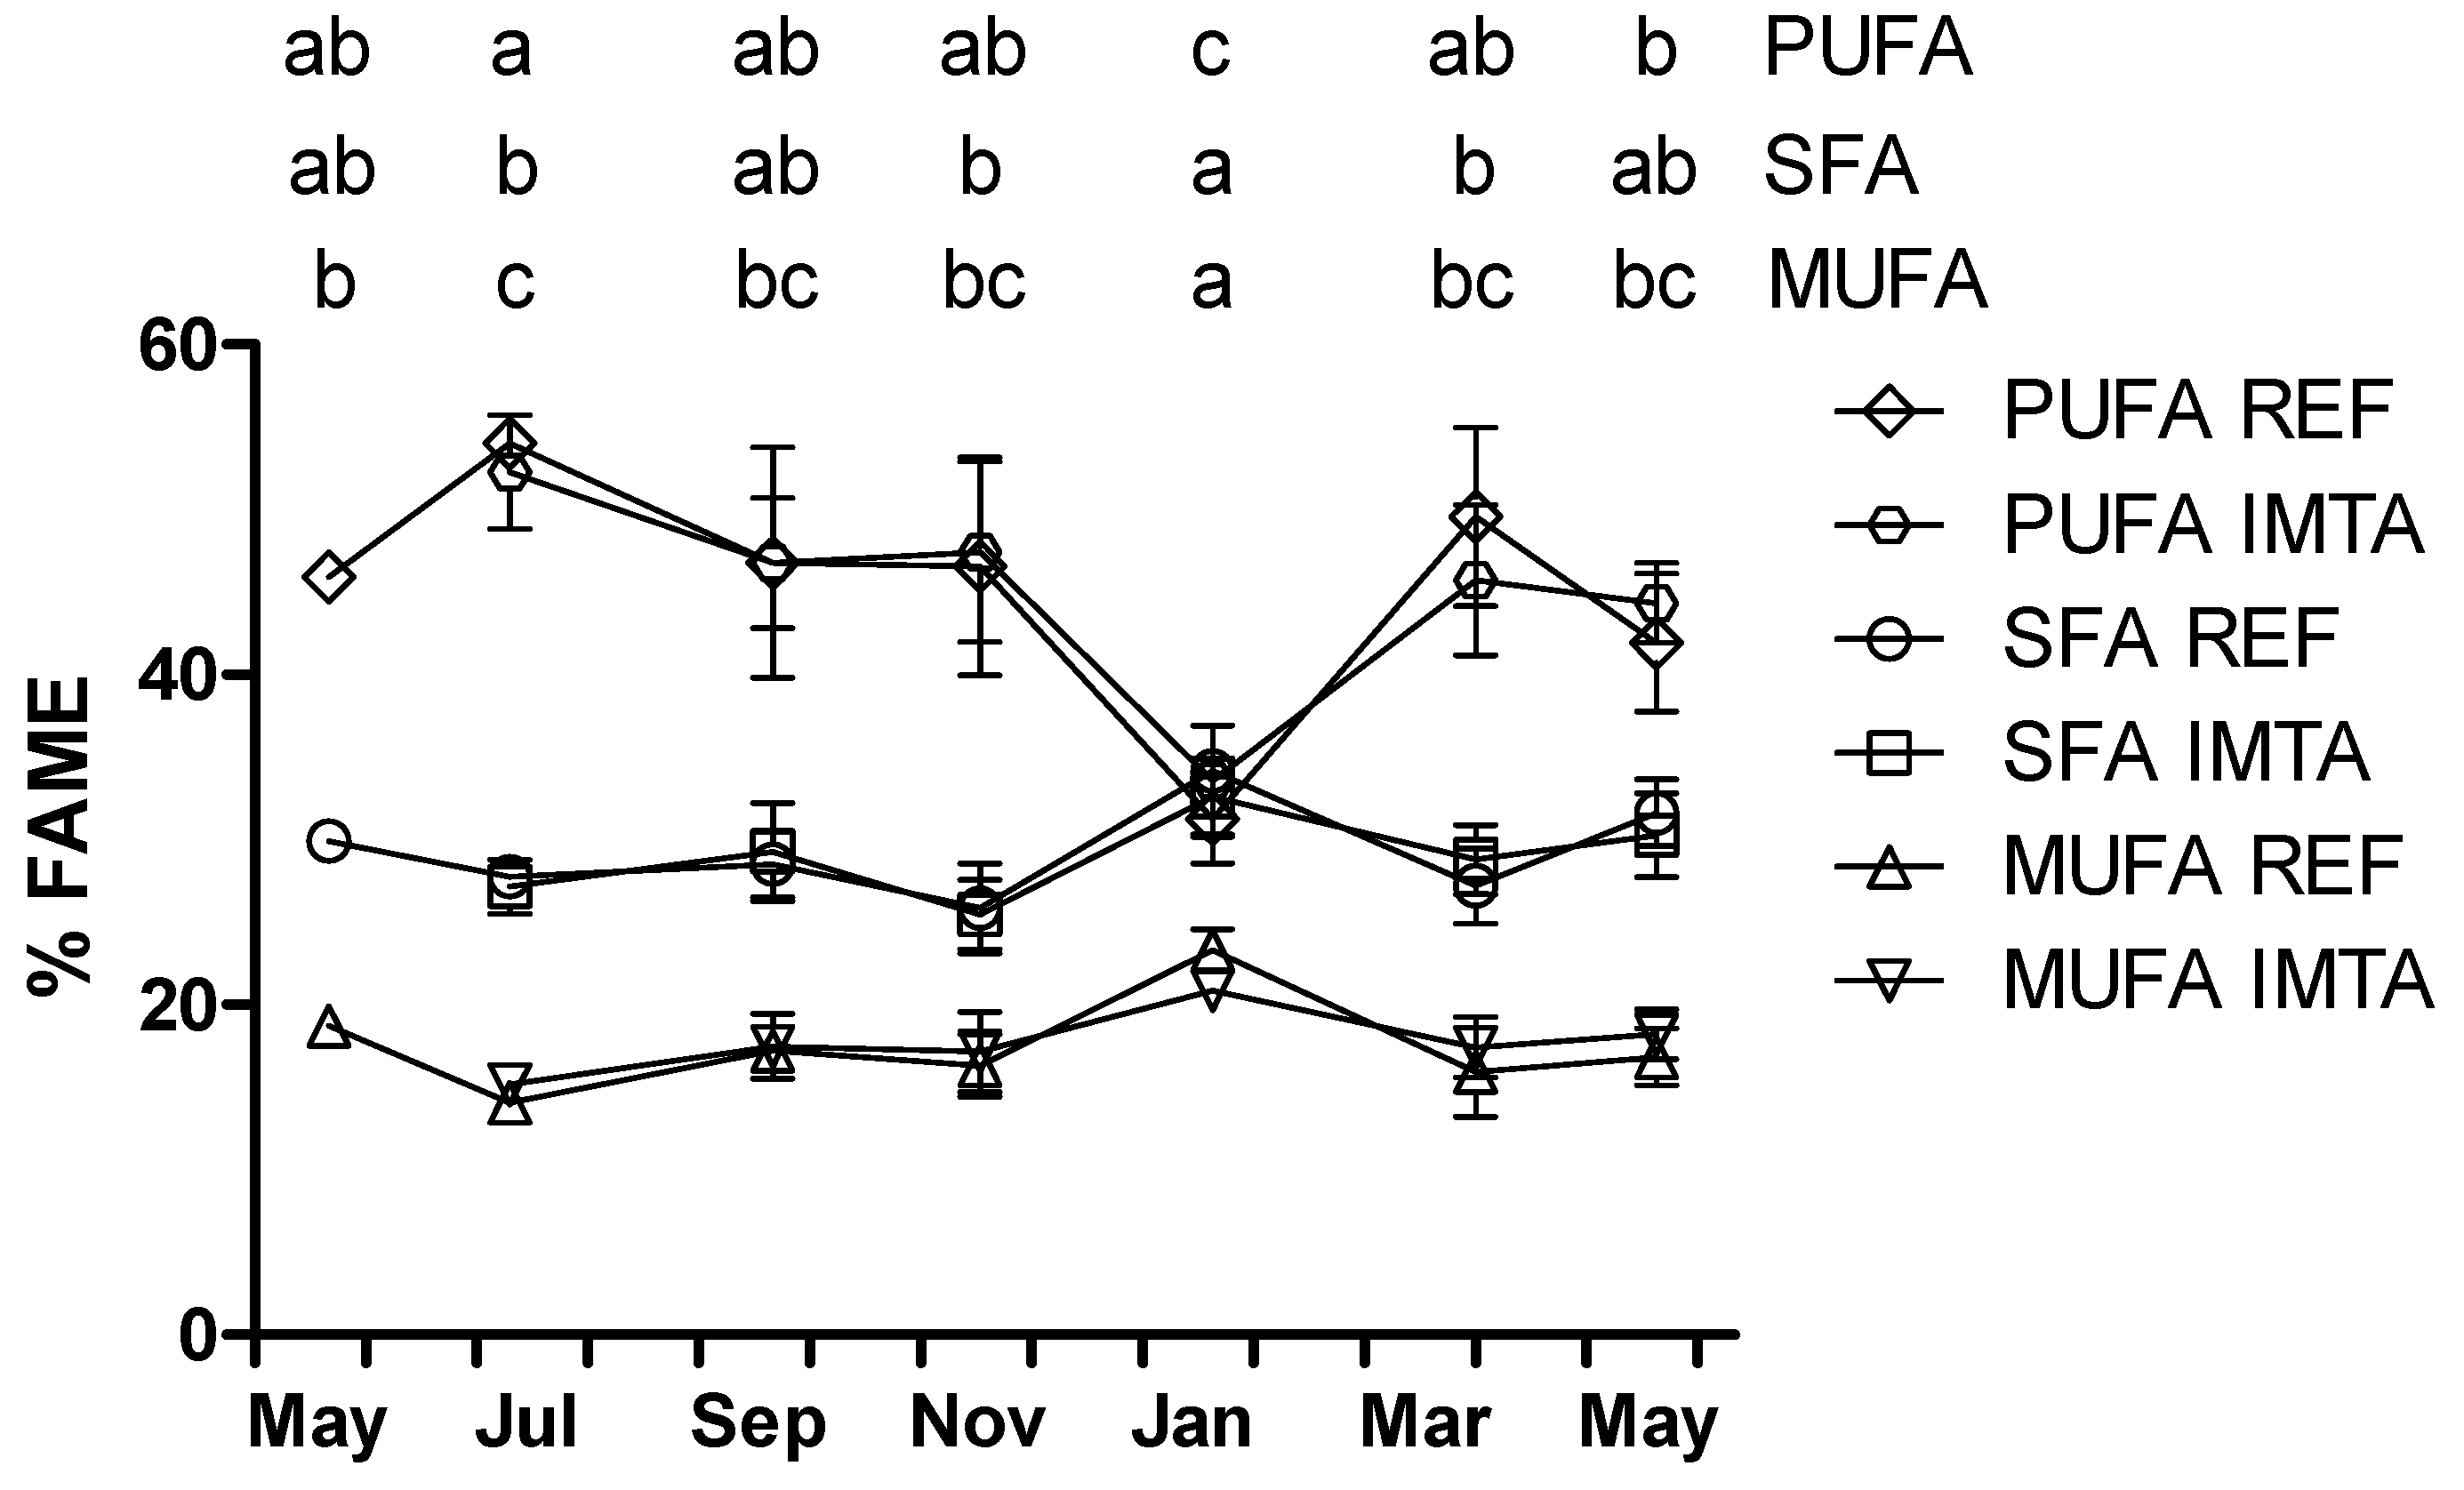
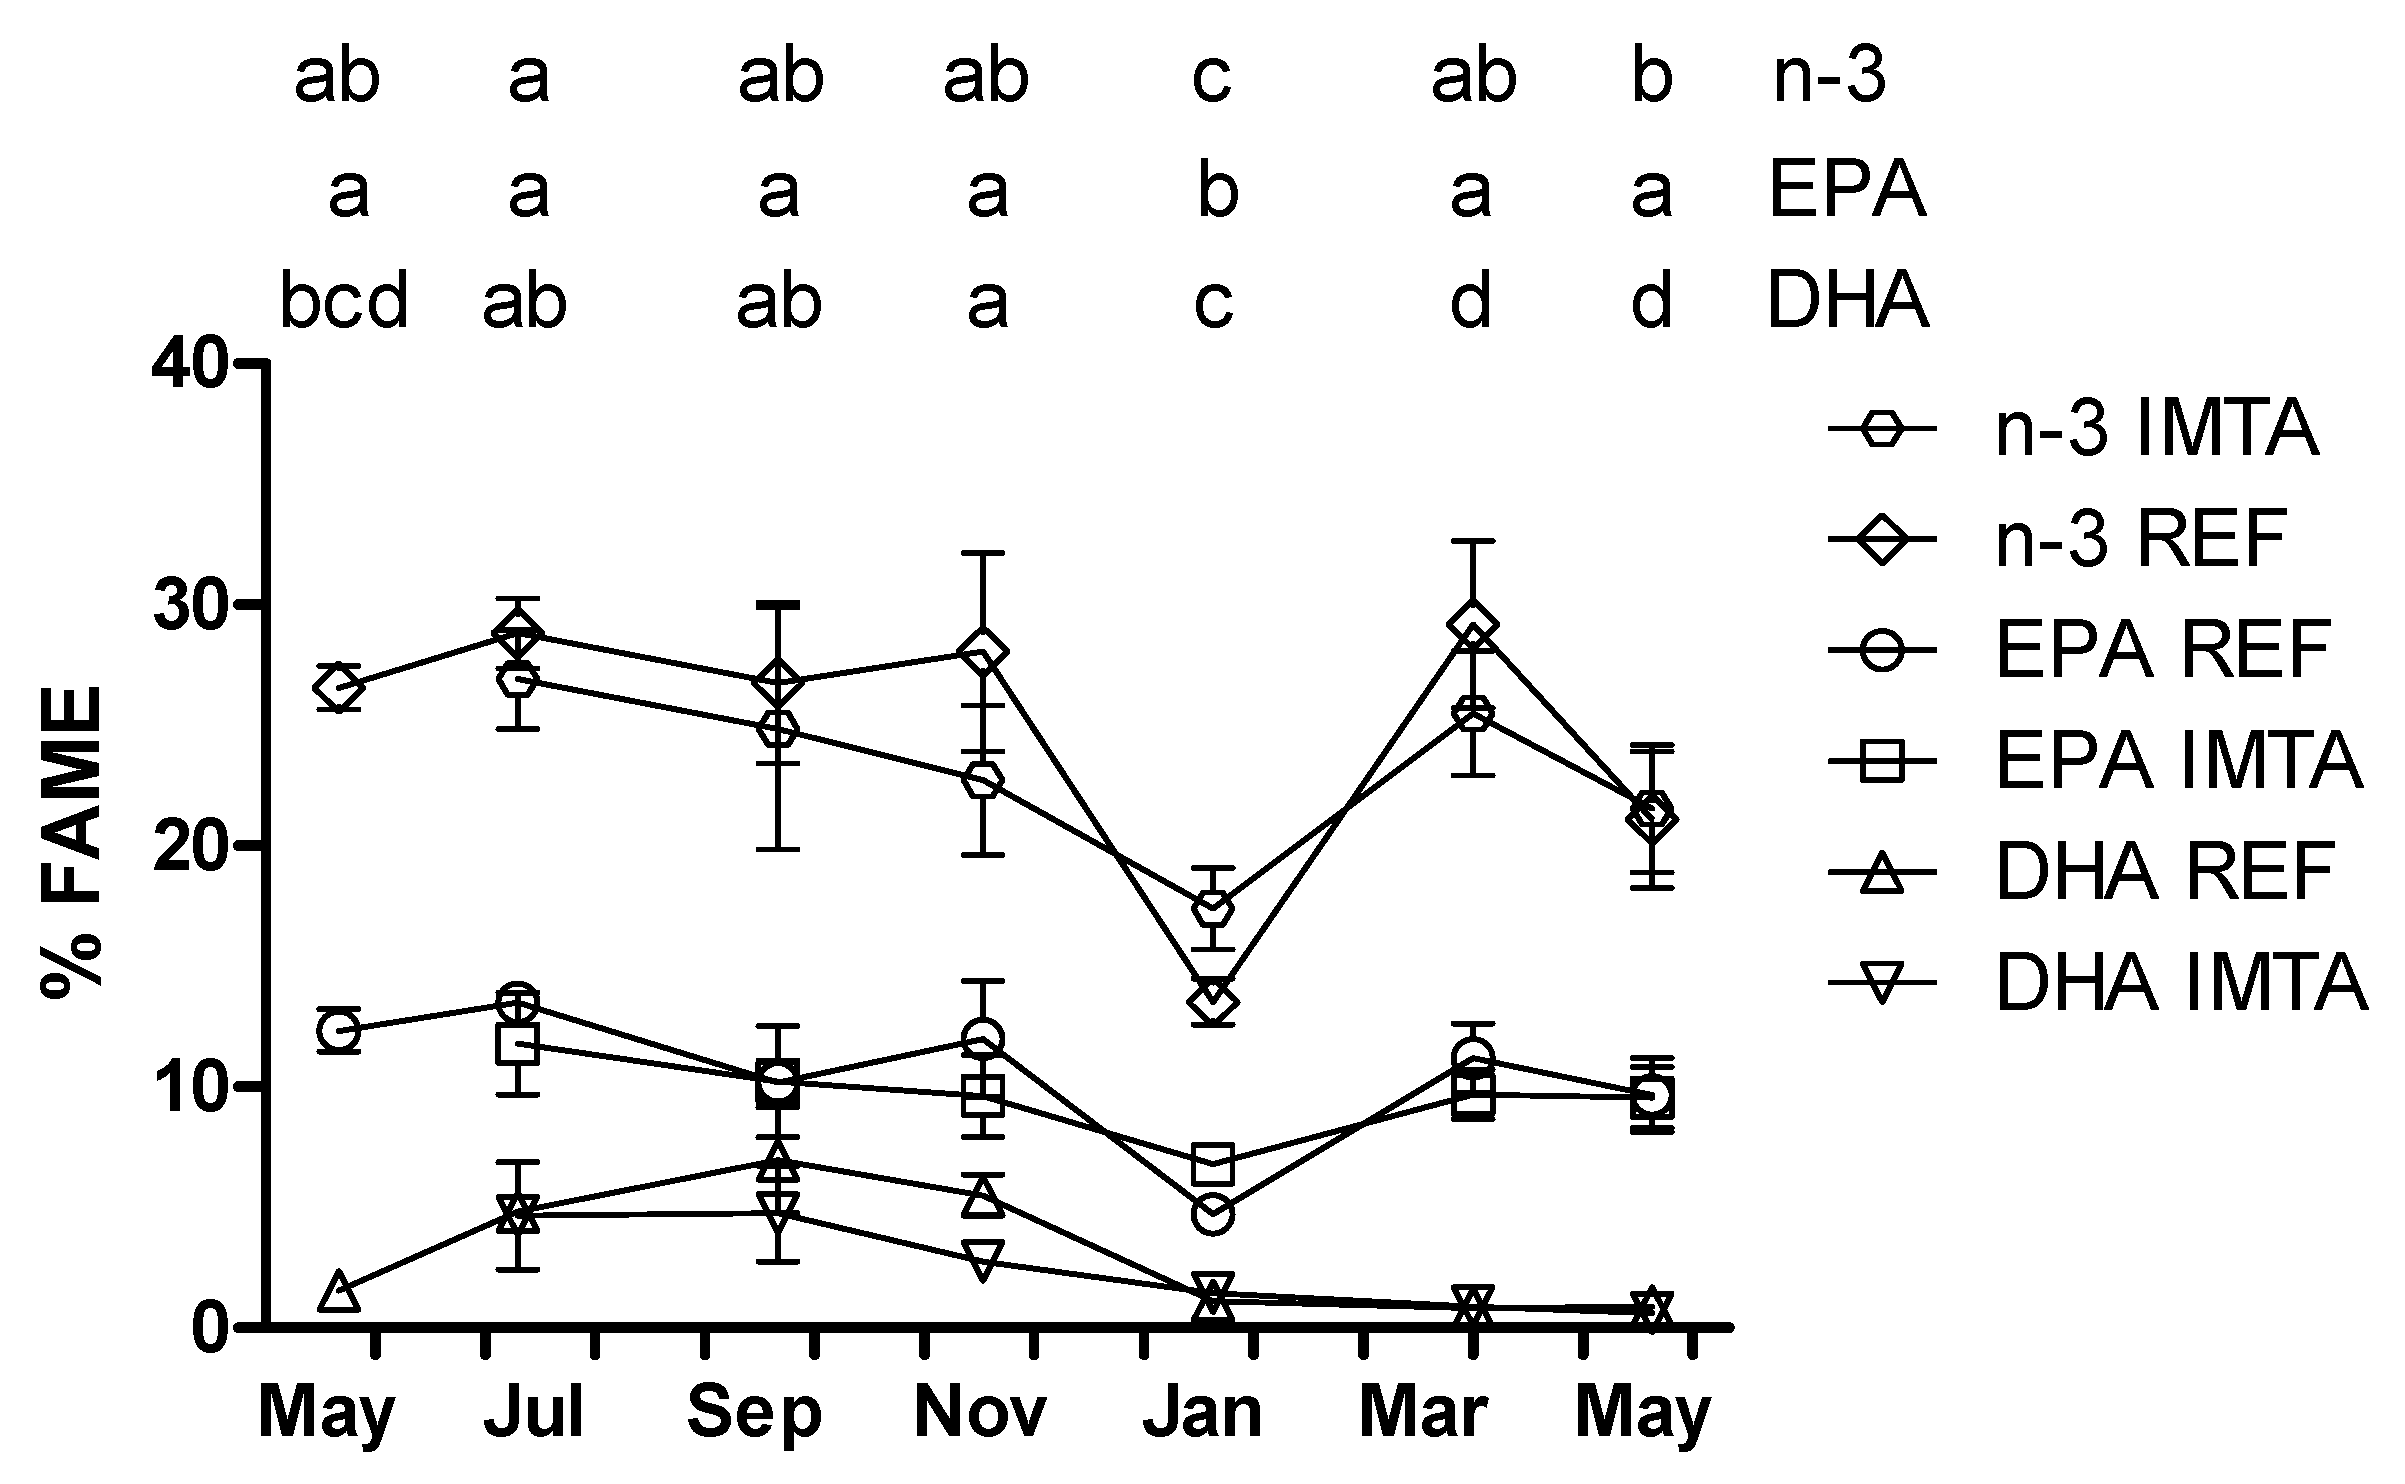
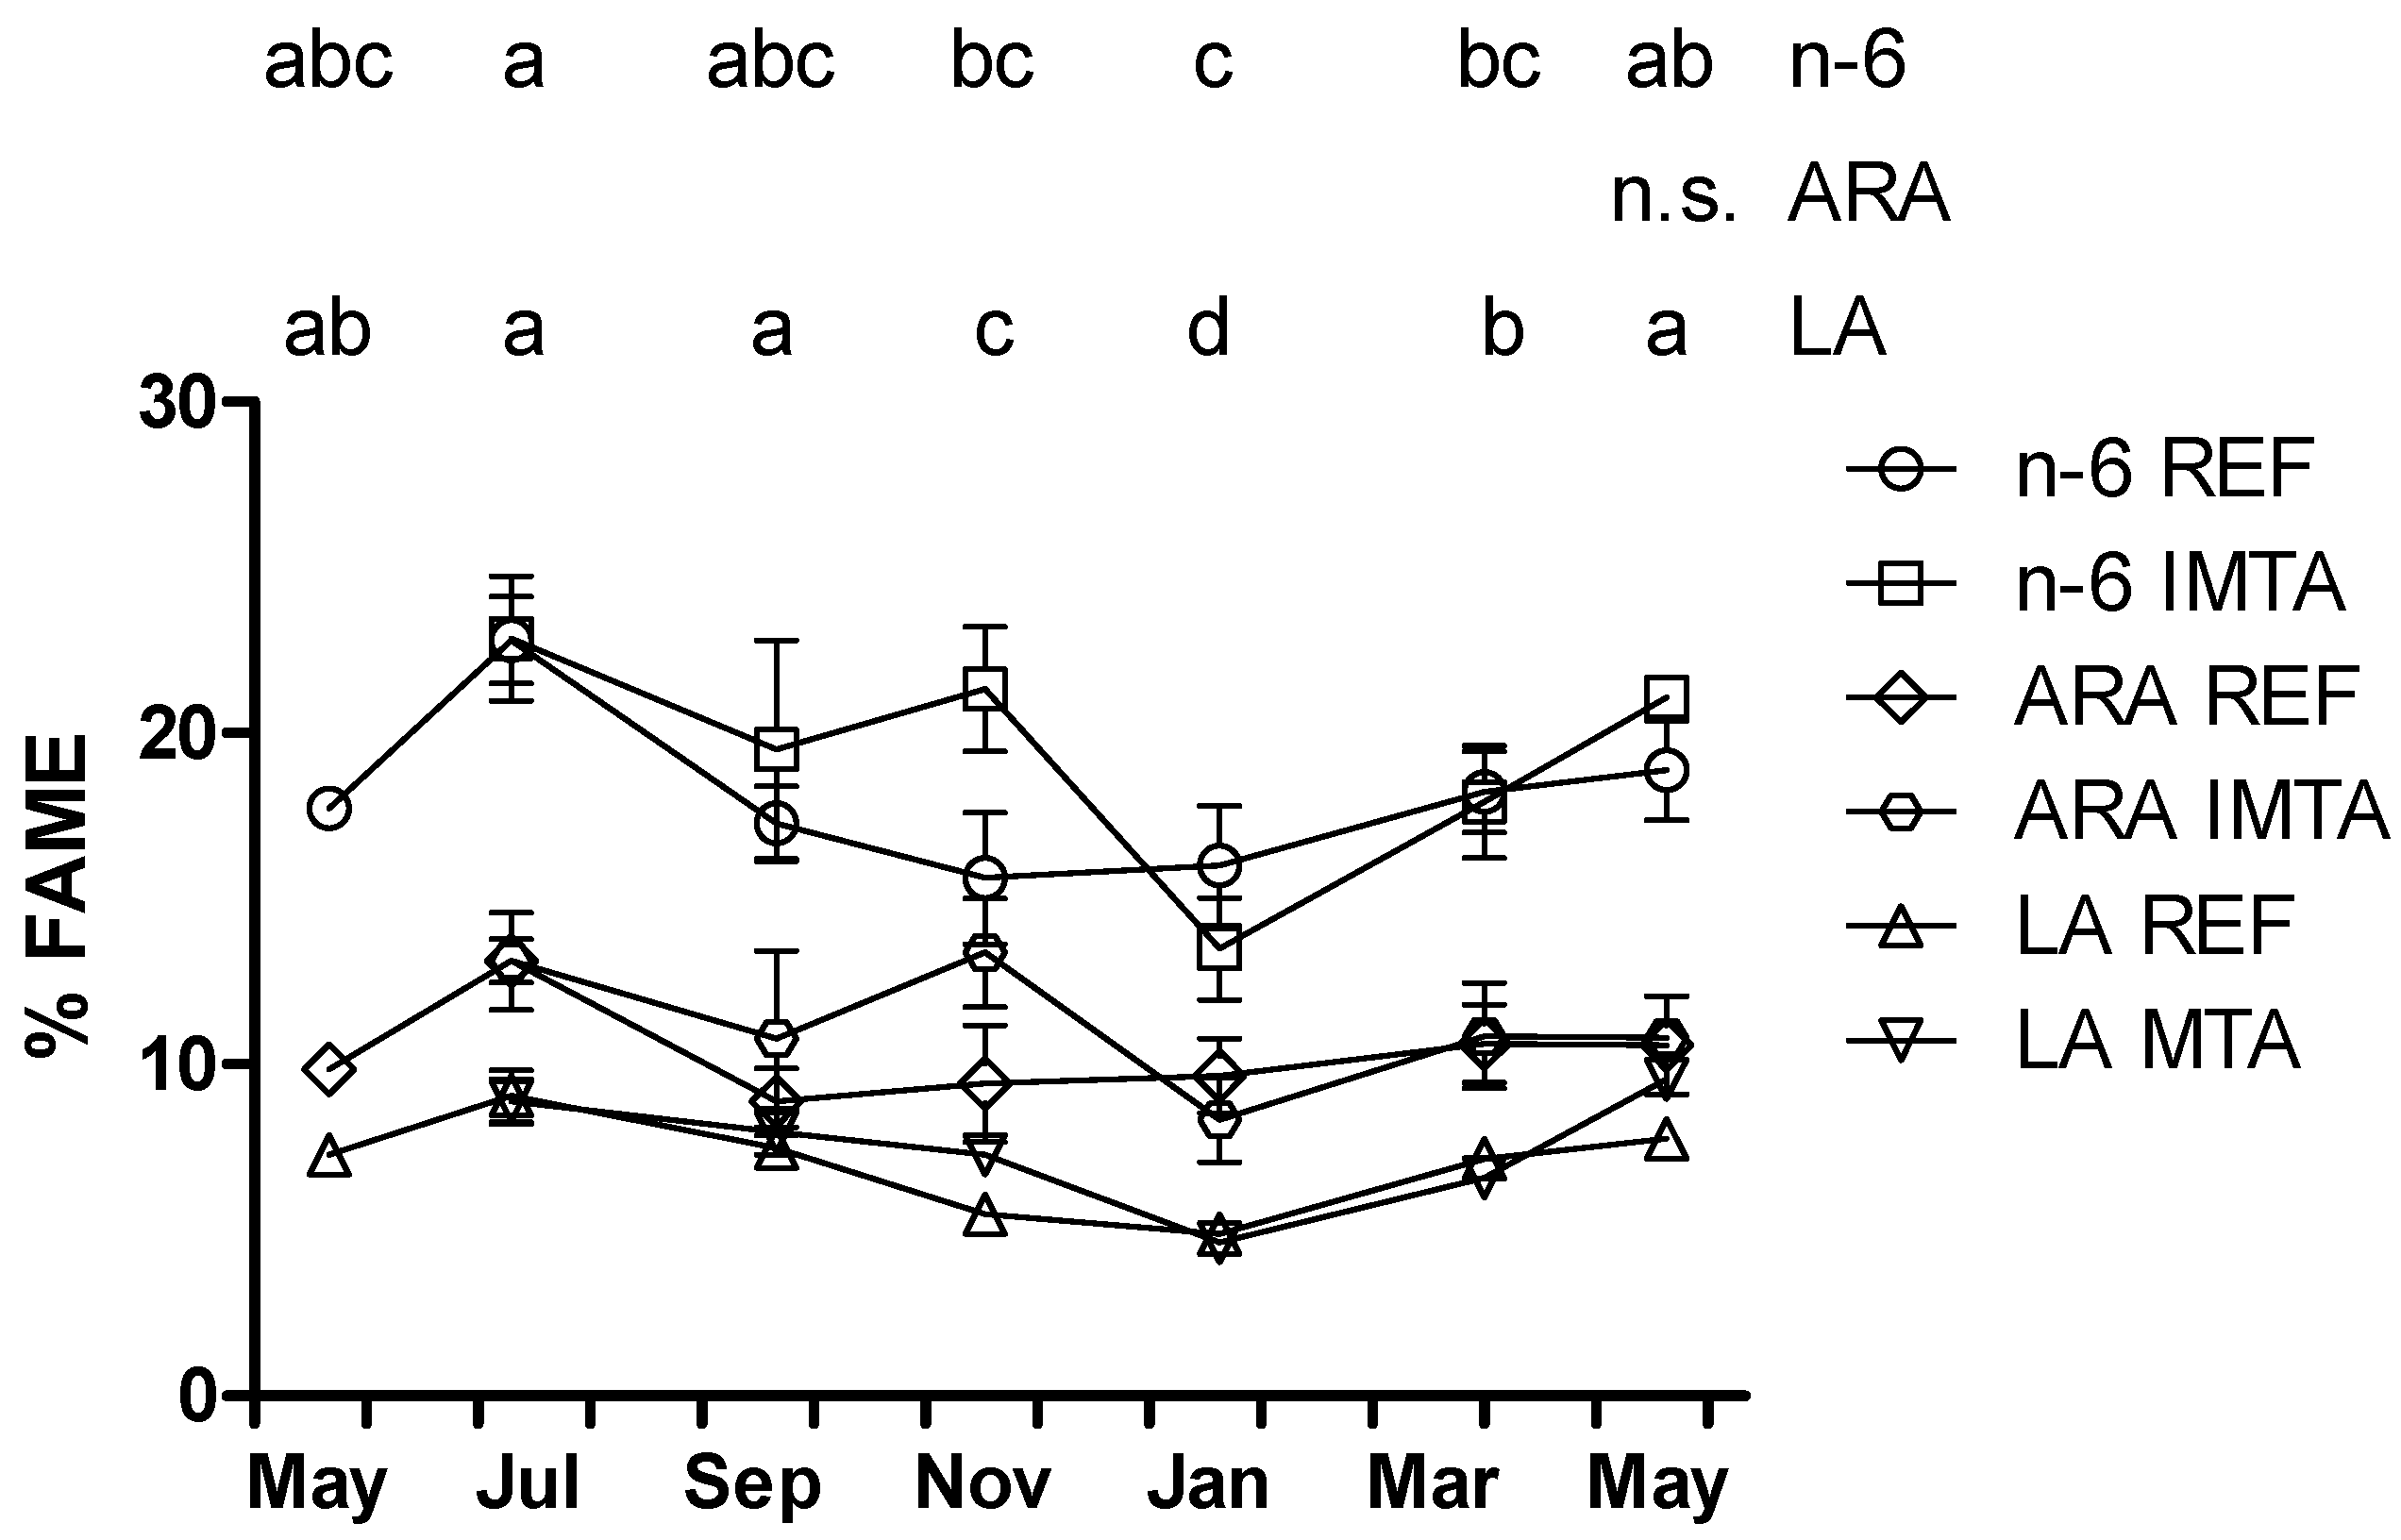
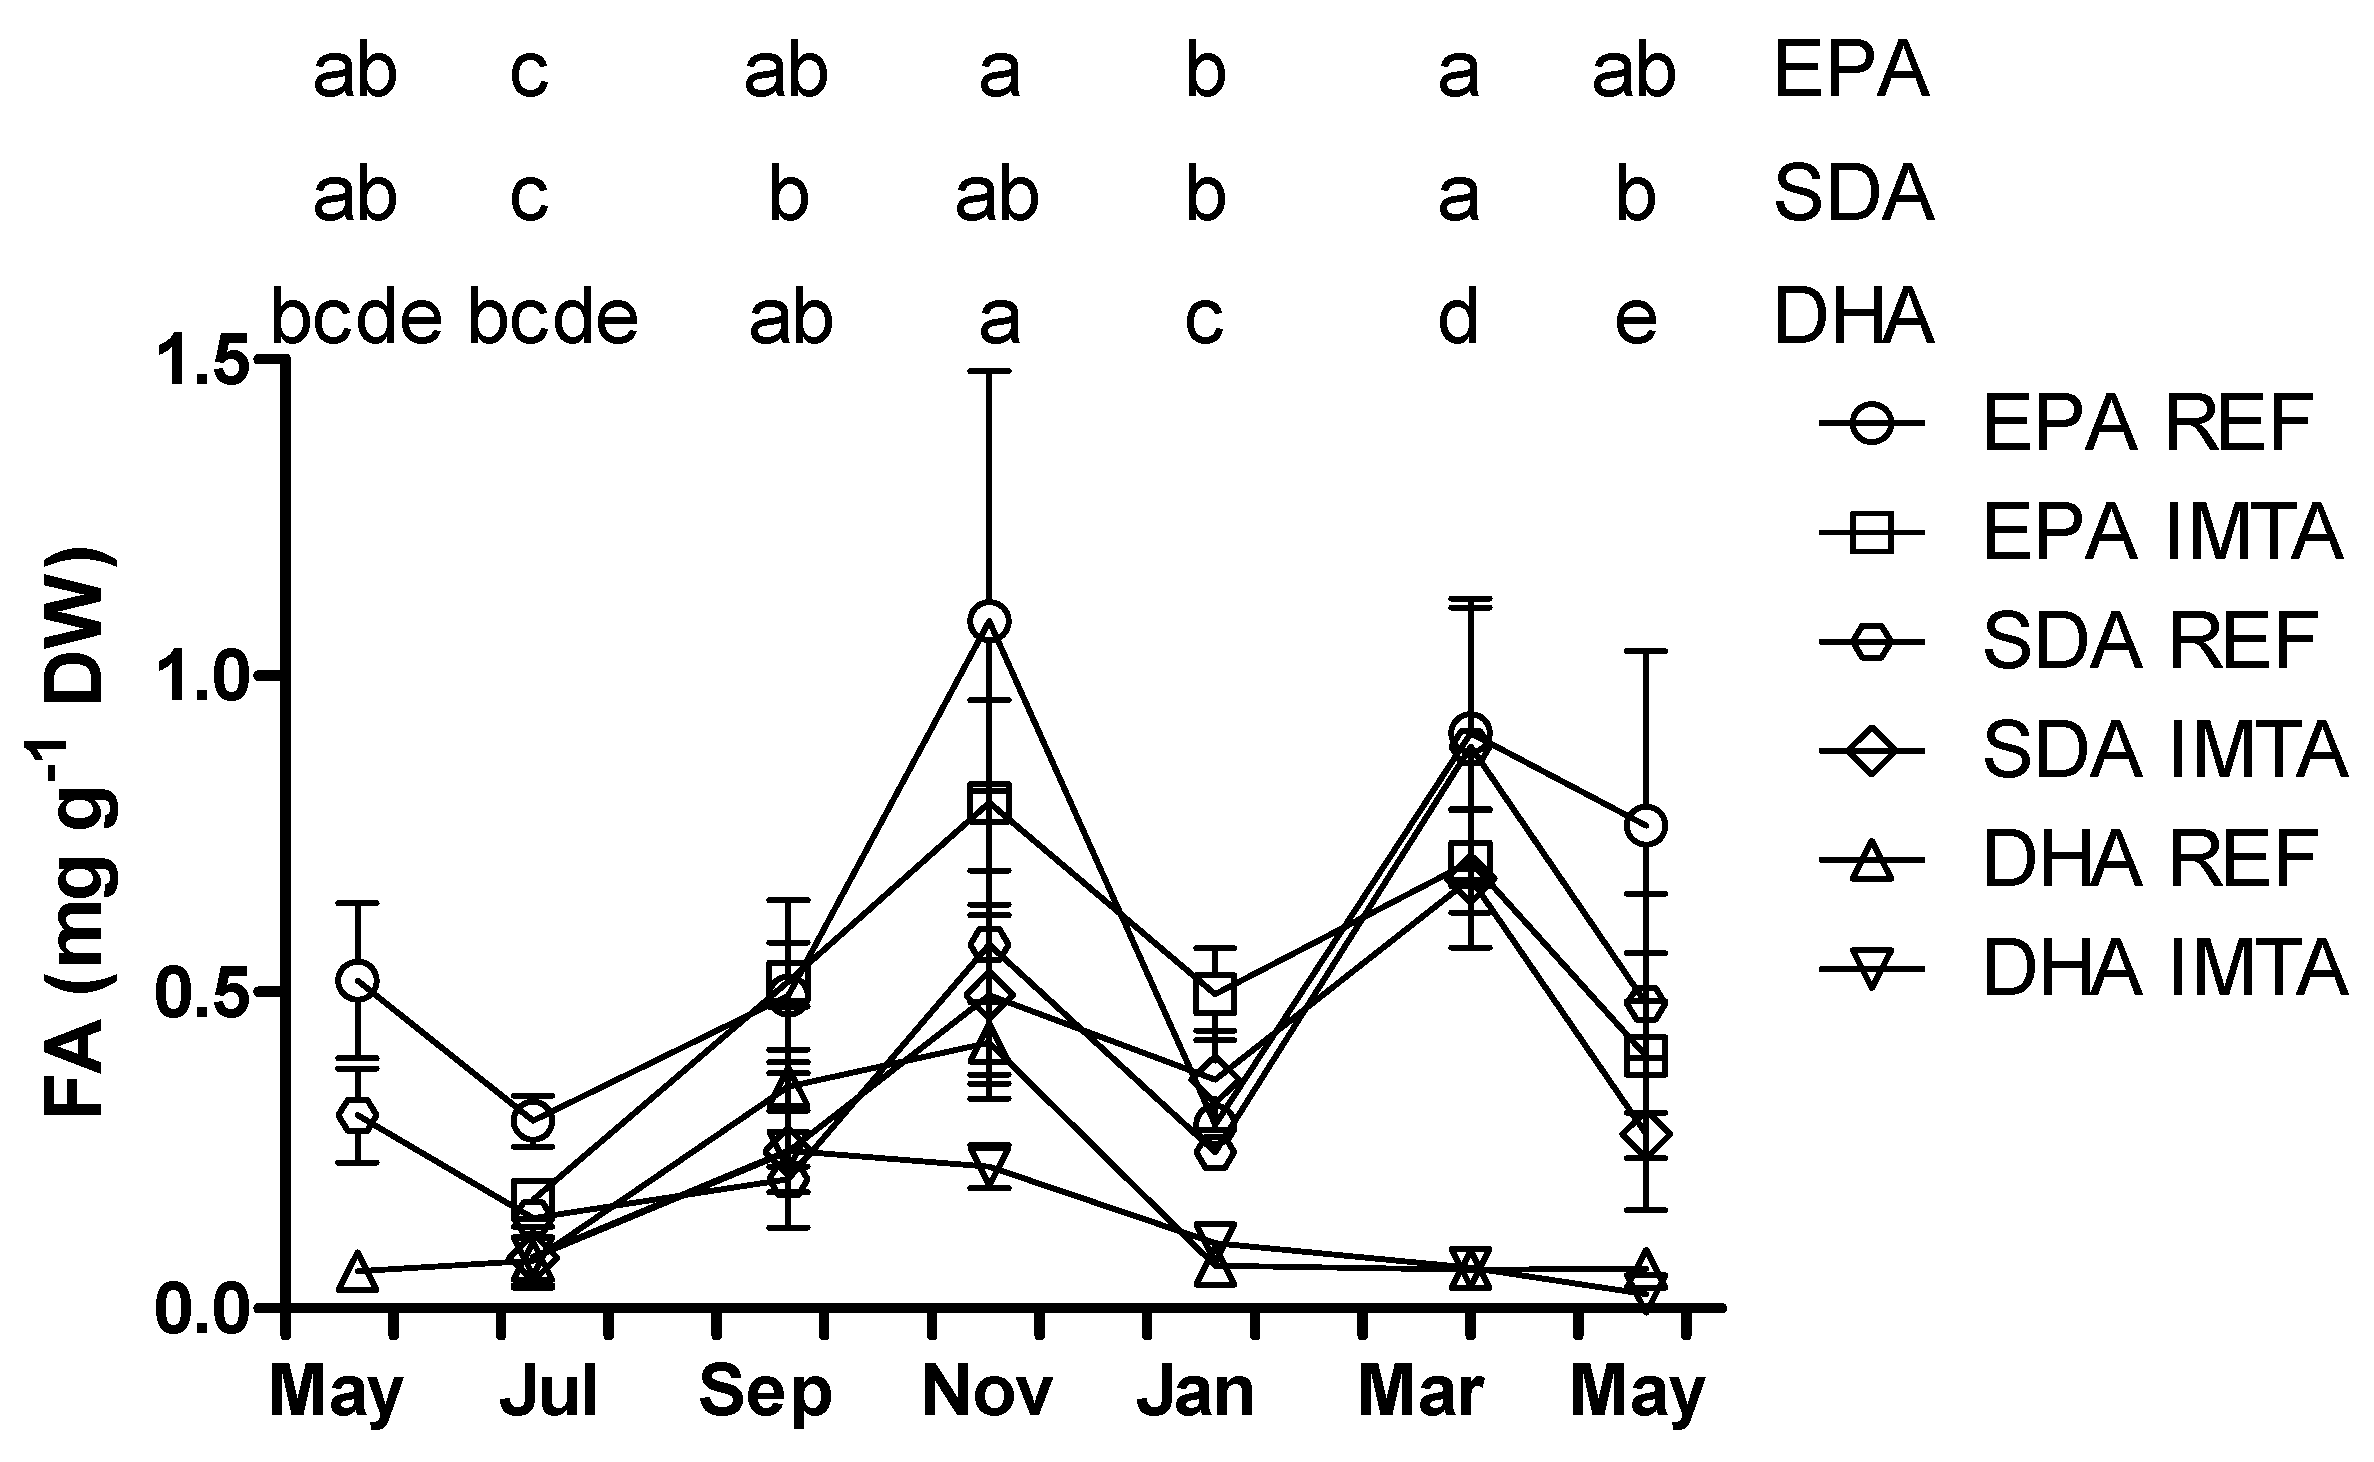
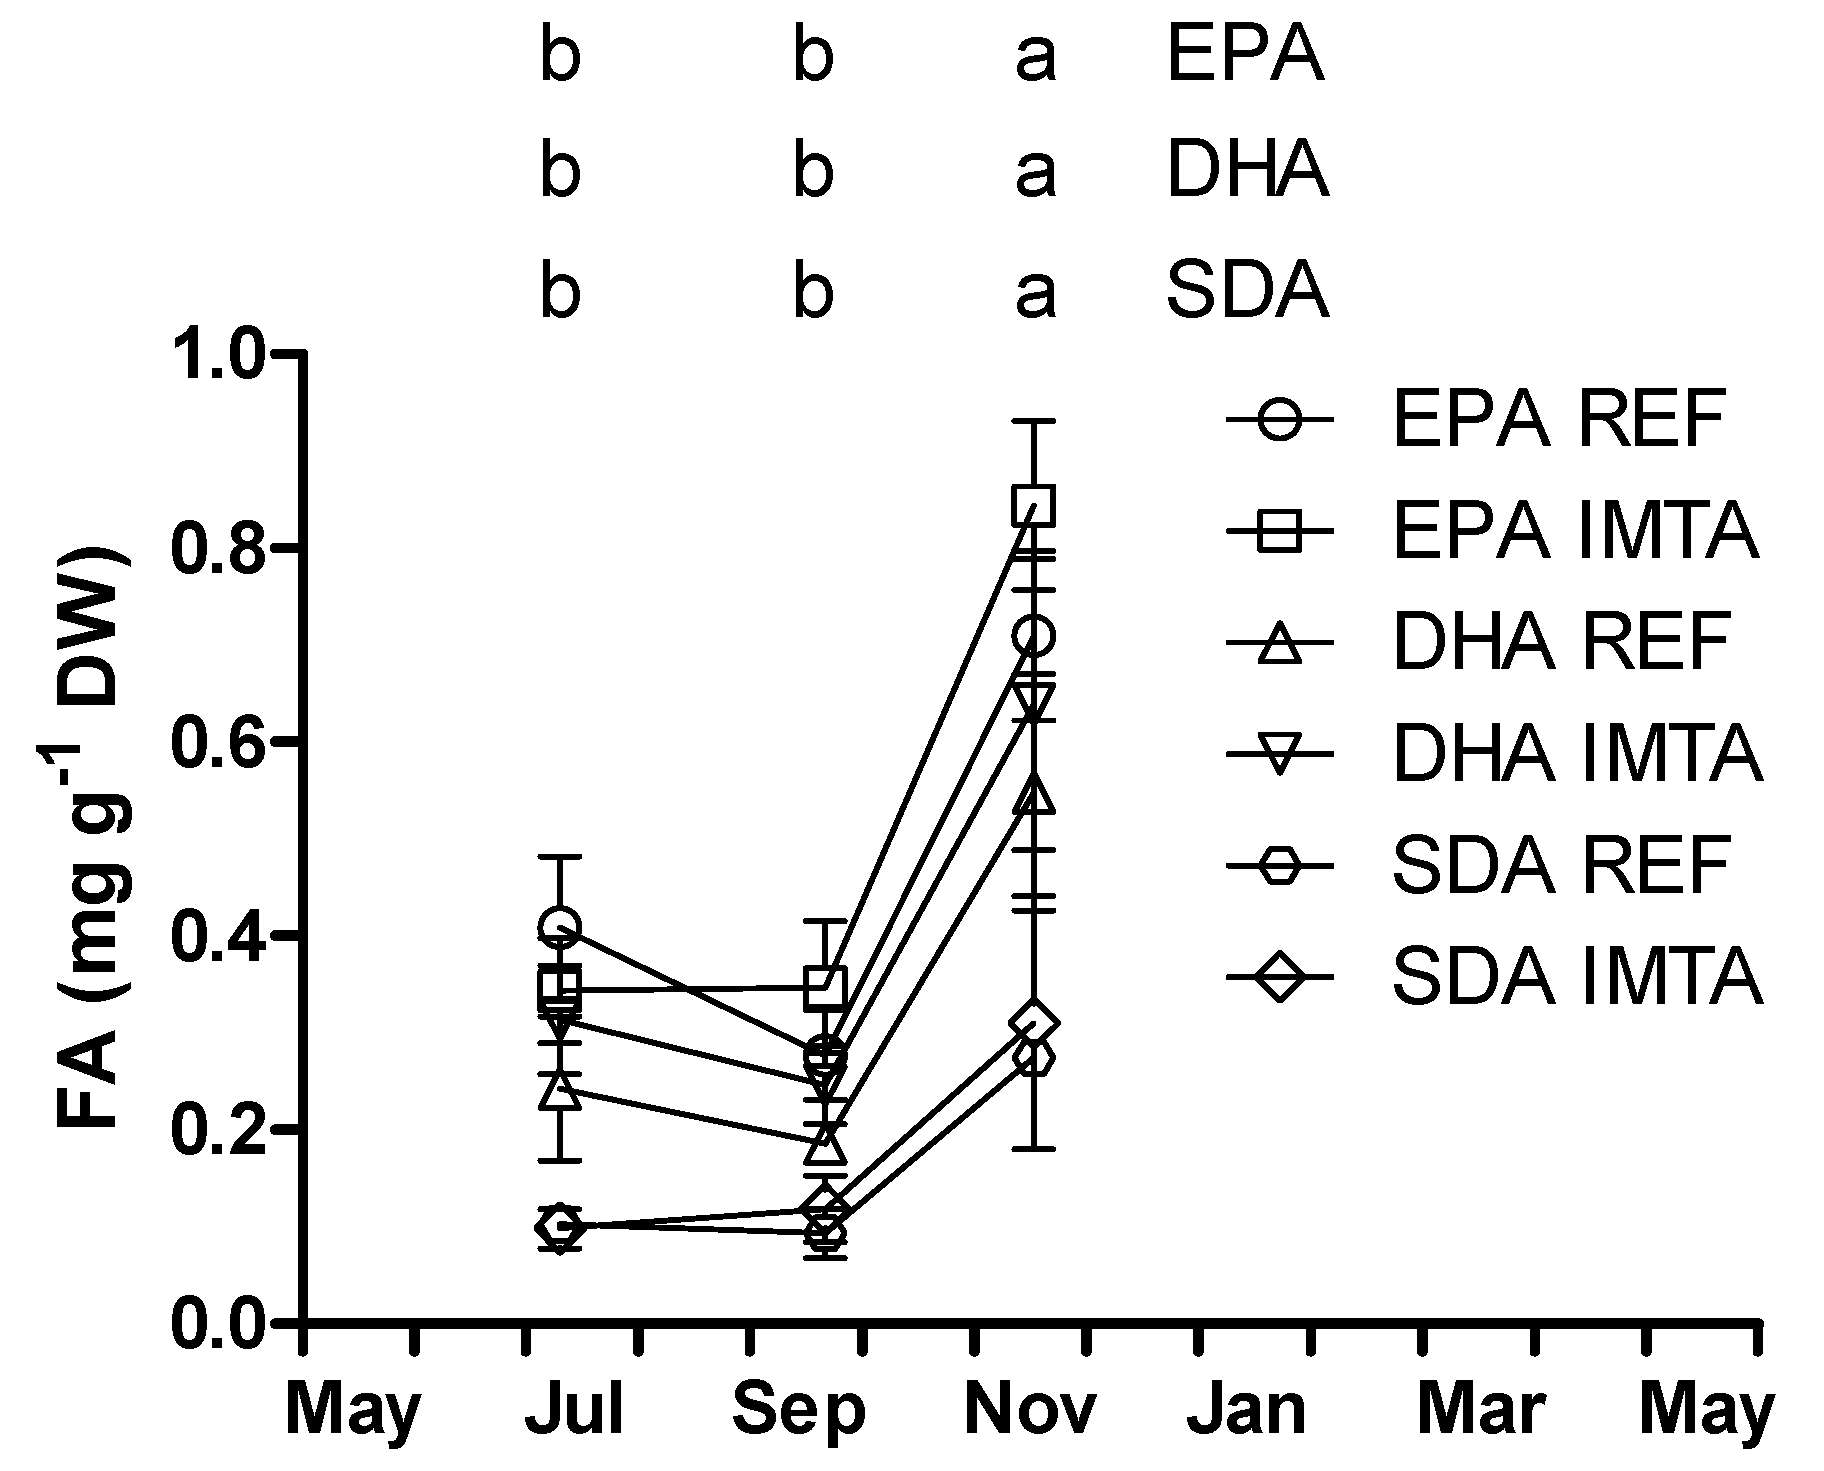
2. Results


| Fatty Acid | May 2013 | July | September | November | January | March | May 2014 | Cabbage 1 | Lettuce 1 | Salmon 1 | Cod 1 | ||||||
|---|---|---|---|---|---|---|---|---|---|---|---|---|---|---|---|---|---|
| INITIAL | REF | IMTA | REF | IMTA | REF | IMTA | REF | IMTA | REF | IMTA | REF | IMTA | |||||
| 14:0 | 7.71 ± 0.27 | 8.32 ± 1.11 | 6.83 ± 1.24 | 6.13 ± 1.57 | 7.19 ± 1.39 | 6.61 ± 0.24 | 7.95 ± 0.59 | 12.66 ± 1.13 | 12.44 ± 0.99 | 11.03 ± 0.14 | 12.19 ± 0.49 | 11.94 ± 0.87 | 9.87 ± 1.02 | 4.29 | |||
| 14:1 | 0.18 ± 0.02 | 0.50 ± 0.27 | 0.51 ± 0.14 | 0.35 ± 0.01 | 0.31 ± 0.17 | 0.32 ± 0.10 | 0.47 ± 0.14 | 1.96 ± 0.62 | 1.93 ± 0.79 | 1.52 ± 0.05 | 1.86 ± 0.19 | 0.88 ± 0.26 | 0.95 ± 0.20 | ||||
| 15:0 | 0.49 ± 0.05 | 0.45 ± 0.03 | 0.39 ± 0.01 | 0.46 ± 0.05 | 0.53 ± 0.13 | 0.45 ± 0.14 | 0.39 ± 0.08 | 0.59 ± 0.12 | 0.51 ± 0.05 | 0.45 ± 0.00 | 0.44 ± 0.05 | 0.60 ± 0.10 | 0.74 ± 0.10 | ||||
| 16:0 | 19.41 ± 1.05 | 16.71 ± 0.35 | 17.33 ± 0.45 | 17.87 ± 0.95 | 18.08 ± 1.52 | 16.10 ± 1.79 | 14.79 ± 1.07 | 19.27 ± 0.96 | 18.62 ± 1.50 | 14.78 ± 1.65 | 15.39 ± 1.40 | 18.04 ± 1.37 | 18.28 ± 1.54 | 23.2 | 17.1 | 17.1 | 33.1 |
| 16:1 (n-7) | 5.17 ± 0.03 | 3.20 ± 0.82 | 3.84 ± 0.75 | 5.05 ± 0.12 | 4.84 ± 0.86 | 4.95 ± 0.72 | 4.60 ± 0.22 | 5.60 ± 0.49 | 4.82 ± 0.49 | 2.87 ± 0.51 | 4.37 ± 0.42 | 2.41 ± 0.28 | 3.73 ± 0.18 | 2.58 | 1.43 | 5.71 | |
| 16:2 (n-4) | 0.35 ± 0.00 | 0.54 ± 0.13 | 0.65 ± 0.02 | 0.65 ± 0.07 | 0.47 ± 0.01 | 0.32 ± 0.13 | 0.34 ± 0.01 | 0.97 ± 0.36 | 1.00 ± 0.33 | 0.98 ± 0.40 | 0.91 ± 0.35 | 0.27 ± 0.16 | 0.42 ± 0.18 | ||||
| 16:3 (n-4) | 0.31 ± 0.03 | 0.45 ± 0.04 | 0.45 ± 0.17 | 0.59 ± 0.13 | 0.38 ± 0.15 | 0.41 ± 0.07 | 0.20 ± 0.04 | 0.30 ± 0.05 | 0.26 ± 0.06 | 0.15 ± 0.01 | 0.20 ± 0.02 | 0.16 ± 0.01 | 0.11 ± 0.00 | ||||
| 17:0 | 0.17 ± 0.01 | 0.24 ± 0.05 | 0.21 ± 0.04 | 0.48 ± 0.11 | 0.38 ± 0.07 | 0.51 ± 0.11 | 0.37 ± 0.06 | nd | nd | nd | nd | nd | nd | ||||
| 16:4 (n-1) | 0.20 ± 0.01 | 0.19 ± 0.08 | 0.15 * | 0.21 ± 0.02 | 0.23 ± 0.05 | 0.86 ± 0.17 | 0.52 ± 0.20 | 0.16 ± 0.04 | 0.25 ± 0.03 | 0.15 ± 0.03 | 0.14 ± 0.02 | 0.16 ± 0.02 | 0.16 ± 0.01 | ||||
| 18:0 | 1.76 ± 0.38 | 1.69 ± 0.24 | 2.00 ± 0.58 | 3.16 ± 0.26 | 2.58 ± 0.67 | 1.98 ± 0.61 | 1.74 ± 0.48 | 1.58 ± 0.49 | 0.97 ± 0.10 | 0.95 ± 0.50 | 0.73 ± 0.19 | 0.78 ± 0.11 | 0.98 ± 0.18 | 2.58 | 1.43 | 2.86 | |
| 18:1 (n-9) | 11.73 ± 0.22 | 8.85 ± 0.90 | 8.89 ± 0.21 | 9.15 ± 0.83 | 9.64 ± 0.89 | 8.31 ± 0.19 | 10.74 ± 1.81 | 13.89 ± 1.88 | 12.29 ± 0.93 | 10.77 ± 1.87 | 10.26 ± 1.08 | 12.38 ± 0.97 | 12.25 ± 1.12 | 4.29 | 25.7 | ||
| 18:1 (n-7) | 0.76 ± 0.14 | 0.60 ± 0.18 | 0.67 ± 0.17 | 0.95 ± 0.08 | 0.79 ± 0.17 | 1.15 ± 0.30 | 0.60 ± 0.07 | 0.61 ± 0.15 | 0.60 ± 0.10 | 0.44 ± 0.24 | 0.47 ± 0.13 | 0.35 ± 0.08 | 0.34 ± 0.04 | ||||
| 18:2 (n-6) | 7.28 ± 0.13 | 9.05 ± 0.79 | 8.89 ± 0.68 | 7.47 ± 0.21 | 7.97 ± 0.68 | 5.49 ± 0.23 | 7.29 ± 0.28 | 4.88 ± 0.22 | 4.63 ± 0.27 | 7.15 ± 0.15 | 6.59 ± 0.07 | 7.75 ± 0.28 | 9.57 ± 0.51 | 19.4 | 21.4 | 4.29 | |
| 18:2 (n-4) | 0.77 ± 0.02 | 1.43 ± 0.11 | 1.51 ± 0.14 | 1.31 ± 0.11 | 1.35 ± 0.13 | 1.34 ± 0.39 | 2.32 ± 0.39 | 1.19 ± 0.17 | 1.17 ± 0.12 | 1.27 ± 0.11 | 1.06 ± 0.10 | 1.38 ± 0.06 | 1.12 ± 0.07 | ||||
| 18:3 (n-6) | nd | nd | nd | nd | nd | nd | nd | nd | nd | nd | nd | nd | nd | ||||
| 18:3 (n-4) | nd | nd | nd | nd | nd | nd | nd | nd | nd | nd | nd | nd | nd | ||||
| 18:3 (n-3) | 4.26 ± 0.16 | 4.34 ± 0.60 | 3.62 ± 0.85 | 3.40 ± 0.35 | 3.40 ± 0.61 | 3.13 ± 0.66 | 3.07 ± 0.46 | 2.64 ± 0.06 | 3.10 ± 0.25 | 5.35 ± 0.45 | 4.73 ± 0.21 | 3.54 ± 0.25 | 3.76 ± 0.40 | 52.3 | 54.3 | 2.86 | |
| 18-4(n-3) SDA | 7.24 ± 0.59 | 6.60 ± 0.49 | 5.70 ± 1.40 | 4.27 ± 0.18 | 4.95 ± 1.25 | 6.03 ± 1.99 | 5.93 ± 1.36 | 3.95 ± 0.16 | 4.86 ± 0.73 | 10.88 ± 1.58 | 9.29 ± 1.39 | 6.09 ± 0.93 | 6.51 ± 1.09 | 1.43 | |||
| 20:0 | 0.41 ± 0.07 | 0.55 ± 0.02 | 0.61 ± 0.08 | 0.63 ± 0.05 | 0.75 ± 0.03 | 0.31 ± 0.01 | 0.36 ± 0.02 | nd | nd | nd | nd | 0.35 ± 0.01 | 0.52 ± 0.03 | ||||
| 20:1 (n-11) + (n-9) | 0.23 ± 0.03 | 0.65 ± 0.08 | 0.77 ± 0.21 | 1.04 ± 0.11 | 0.93 ± 0.20 | 0.74 ± 0.33 | 0.43 ± 0.19 | 0.40 ± 0.14 | 0.34 ± 0.16 | nd | nd | nd | nd | 1.43 | |||
| 20-1 (n-7) | nd | nd | nd | 0.09 ± 0.02 | 0.31 ± 0.05 | 0.68 ± 0.51 | 0.14 ± 0.02 | 0.25 * | 0.20 ± 0.03 | nd | nd | nd | nd | ||||
| 20:2 (n-6) | 0.18 * | 0.30 ± 0.06 | 0.56 ± 0.34 | 0.86 ± 0.06 | 0.51 ± 0.32 | 0.35 ± 0.07 | 0.30 ± 0.00 | 0.22 ± 0.02 | 0.19 ± 0.00 | 0.08 ± 0.04 | 0.14 ± 0.02 | 0.20 ± 0.01 | 0.17 ± 0.00 | ||||
| 20:3 (n-6) | 0.50 ± 0.02 | 0.44 ± 0.02 | 0.47 ± 0.04 | 0.36 ± 0.02 | 0.41 ± 0.03 | 0.36 ± 0.06 | 0.47 ± 0.08 | 0.41 ± 0.04 | 0.42 ± 0.03 | 0.37 ± 0.03 | 0.38 ± 0.02 | 0.43 ± 0.03 | 0.59 ± 0.03 | ||||
| 20:4 (n-6) ARA | 9.85 ± 0.03 | 13.13 ± 0.65 | 13.13 ± 1.46 | 8.88 ± 1.01 | 10.79 ± 2.66 | 9.43 ± 1.76 | 13.38 ± 1.64 | 9.67 ± 1.12 | 8.33 ± 1.27 | 10.64 ± 1.17 | 10.87 ± 1.59 | 10.58 ± 1.48 | 10.81 ± 0.27 | ||||
| 20:3 (n-3) | 0.91 ± 0.07 | 0.73 ± 0.20 | 0.81 ± 0.26 | 0.69 ± 0.09 | 0.72 ± 0.14 | 0.49 * | 0.37 * | 0.32 ± 0.02 | 0.28 ± 0.02 | 0.23 ± 0.05 | 0.21 ± 0.04 | 0.26 ± 0.02 | 0.30 ± 0.07 | ||||
| 20:4 (n-3) | nd | 0.91 * | 0.70 * | 0.45 * | 0.36 * | 0.58 ± 0.11 | 0.59 ± 0.04 | 0.27 ± 0.02 | 0.30 ± 0.06 | 0.56 ± 0.08 | 0.50 ± 0.08 | 0.57 ± 0.13 | 0.76 ± 0.01 | ||||
| 20:5 (n-3) EPA | 12.32 ± 0.89 | 13.48 ± 0.61 | 11.80 ± 2.11 | 10.20 ± 0.90 | 10.22 ± 2.29 | 11.98 ± 2.40 | 9.61 ± 1.69 | 4.70 ± 0.55 | 6.78 ± 0.55 | 11.18 ± 1.44 | 9.69 ± 1.04 | 9.65 ± 1.53 | 9.54 ± 1.27 | 7.14 | 33.1 | ||
| 22:1 (n-11) | 0.35 ± 0.10 | 0.41 ± 0.02 | 0.58 ± 0.08 | 0.43 ± 0.06 | 0.51 ± 0.04 | 0.18 ± 0.09 | 0.19 ± 0.04 | 0.55 ± 0.11 | 0.34 ± 0.04 | 0.30 ± 0.12 | 0.30 ± 0.13 | 0.50 ± 0.19 | 0.56 ± 0.33 | 1.43 | |||
| 21:5 (n-3) | nd | 0.68 * | 0.15 ± 0.03 | 0.61 ± 0.06 | 0.48 ± 0.14 | 0.18 ± 0.00 | 0.05 ± 0.01 | 0.30 ± 0.17 | 0.41 ± 0.04 | 0.12 ± 0.03 | 0.13 ± 0.00 | nd | nd | ||||
| 22:5 (n-3) | 0.28 ± 0.07 | 0.25 ± 0.04 | 0.75 * | 0.69 ± 0.08 | 0.60 ± 0.08 | 0.55 ± 0.09 | 0.62 ± 0.13 | 0.35 ± 0.05 | 0.34 ± 0.01 | 0.10 ± 0.05 | 0.12 ± 0.02 | 0.17 ± 0.04 | 0.11 ± 0.03 | 2.86 | |||
| 22:6 (n-3) DHA | 1.54 ± 0.72 | 4.81 ± 0.15 | 4.65 ± 2.22 | 6.95 ± 2.20 | 4.74 ± 1.99 | 5.50 ± 0.85 | 2.74 ± 0.43 | 1.11 ± 0.24 | 1.44 ± 0.12 | 0.81 ± 0.11 | 0.90 ± 0.14 | 0.88 ± 0.13 | 0.61 ± 0.03 | 18.6 | 33.1 | ||
| 24:1 (n-9) | 0.32 ± 0.08 | 0.37 ± 0.04 | 0.28* | 0.25 ± 0.02 | 0.40 ± 0.11 | nd | nd | 0.43 ± 0.08 | 0.52 ± 0.03 | 0.13 ± 0.01 | 0.13 ± 0.01 | 0.28 ± 0.03 | 0.28 ± 0.04 | 1.43 | |||
| ∑ IFA | 94.56 ± 0.33 abc | 95.90 ± 1.45 | 94.58 ± 1.35 a | 92.54 ± 1.26 | 93.54 ± 2.11 ab | 88.76 ± 1.95 | 90.08 ± 0.99 bc | 88.76 ± 2.12 | 87.02 ± 0.64 c | 92.69 ± 0.50 | 91.98 ± 0.75 b | 90.43 ± 1.73 | 92.83 ± 2.26 a | ||||
| n-6/n-3 ratio | 0.67 ± 0.03 | 0.80 ± 0.08 | 0.85 ± 0.04 | 0.66 ± 0.08 | 0.84 ± 0.16 | 0.56 ± 0.01 | 0.96 ± 0.07 | 1.18 ± 0.10 | 0.78 ± 0.07 | 0.63 ± 0.04 | 0.71 ± 0.04 | 0.91 ± 0.07 | 1.01 ± 0.12 (SxM) | ||||
| EPA + DHA | 13.87 ± 0.17 ab | 16.69 ± 1.93 | 16.45 ± 0.61 a | 17.15 ± 3.04 | 14.95 ± 3.32 ab | 17.47 ± 1.55 | 12.35 ± 1.48 a | 5.82 ± 0.78 | 8.22 ± 0.58 c | 12.00 ± 1.34 | 10.59 ± 0.92 b | 10.52 ± 1.55 | 10.15 ± 1.25 b | ||||


| Fatty Acid | July | September | November | FM 1 | ||||
|---|---|---|---|---|---|---|---|---|
| REF | IMTA | REF | IMTA | REF | IMTA | |||
| 14:0 | 7.47 ± 1.40 | 7.63 ± 0.50 | 10.09 ± 0.83 | 8.81 ± 1.37 | 6.74 ± 0.56 | 5.90 ± 1.29 | 4.9 | |
| 14:1 | 0.29 ± 0.13 | 0.36 ± 0.11 | 0.42 ± 0.09 | 0.76 ± 0.50 | 0.40 ± 0.17 | 0.32 ± 0.04 | ||
| 15:0 | 0.55 ± 0.03 | 0.56 ± 0.04 | 0.48 ± 0.03 | 0.65 ± 0.20 | 0.50 ± 0.07 | 0.44 ± 0.03 | ||
| 16:0 | 19.72 ± 1.19 | 18.30 ± 0.91 | 19.82 ± 1.48 | 20.28 ± 1.75 | 18.28 ± 0.92 | 15.65 ± 0.64 | 14.8 | |
| 16:1 (n-7) | 5.68 ± 0.24 | 6.71 ± 0.30 | 6.90 ± 0.41 | 6.57 ± 0.04 | 5.84 ± 0.19 | 4.73 ± 0.27 | 5.8 | |
| 16:2 (n-4) | 0.44 ± 0.24 | 0.38 ± 0.14 | 0.25 ± 0.04 | 0.55 ± 0.21 | 0.63 ± 0.07 | 0.48 ± 0.03 | ||
| 16:3 (n-4) | 0.37 ± 0.13 | 0.50 ± 0.14 | 0.48 ± 0.05 | 0.40 ± 0.02 | 0.55 ± 0.16 | 0.59 ± 0.22 | ||
| 17:0 | 0.72 ± 0.21 | 0.78 ± 0.03 | 0.30 ± 0.06 | 0.64 ± 0.38 | 0.76 ± 0.08 | 0.97 ± 0.34 | ||
| 16:4 (n-1) | 0.70 ± 0.31 | 4.84 ± 0.34 | 0.64 ± 0.28 | 1.16 ± 0.12 | 1.75 ± 0.59 | 2.48 ± 1.12 | ||
| 18:0 | 4.28 ± 1.60 | 3.19 ± 0.27 | 2.21 ± 0.29 | 4.16 ± 1.95 | 2.82 ± 0.23 | 3.57 ± 0.97 | 2.1 | |
| 18:1 (n-9) | 8.37 ± 1.02 | 6.52 ± 0.14 | 10.80 ± 0.72 | 10.43 ± 0.83 | 8.39 ± 0.67 | 7.43 ± 0.80 | 14.4 | |
| 18:1 (n-7) | 1.54 ± 0.57 | 2.09 ± 0.10 | 0.92 ± 0.09 | 1.27 ± 0.51 | 1.78 ± 0.05 | 1.52 ± 0.33 | ||
| 18:2 (n-6) | 5.15 ± 1.82 | 4.26 ± 0.25 | 7.04 ± 0.99 | 5.87 ± 1.75 | 3.55 ± 0.27 | 3.53 ± 0.98 | ||
| 18:2 (n-4) | 0.66 ± 0.18 | 0.65 ± 0.07 | 1.20 ± 0.34 | 1.04 ± 0.40 | 0.76 ± 0.13 | 0.92 ± 0.41 | ||
| 18:3 (n-6) | nd | nd | nd | nd | nd | nd | ||
| 18:3 (n-4) | nd | nd | nd | nd | nd | nd | ||
| 18:3 (n-3) | 1.99 ± 0.51 | 1.82 ± 0.11 | 1.56 ± 0.29 | 1.63 ± 0.13 | 2.34 ± 0.08 | 2.22 ± 0.71 | ||
| 18-4 (n-3) SDA | 2.69 ± 0.75 | 2.34 ± 0.29 | 1.88 ± 0.47 | 1.81 ± 0.42 | 4.16 ± 0.22 | 3.97 ± 1.57 | ||
| 20:0 | 0.64 ± 0.17 | 0.37 ± 0.03 | 0.85 ± 0.05 | 0.77 ± 0.05 | 0.29 ± 0.02 | 0.35 ± 0.06 | ||
| 20:1 (n-11) + (n-9) | 1.44 ± 0.68 | 1.42 ± 0.28 | 0.41 ± 0.17 | 1.34 ± 0.95 | 1.12 ± 0.19 | 0.90 ± 0.25 | 10.9 | |
| 20-1 (n-7) | 0.82 ± 0.18 | 1.72 ± 0.41 | 0.15 ± 0.05 | 0.22 ± 0.11 | 0.70 ± 0.13 | 0.53 ± 0.28 | ||
| 20:2 (n-6) | 0.32 ± 0.09 | 0.48 ± 0.19 | 0.51 ± 0.02 | 0.41 ± 0.02 | 0.53 ± 0.01 | 0.75 ± 0.02 | ||
| 20:3 (n-6) | 0.57 ± 0.21 | 0.66 ± 0.45 | 0.36 ± 0.07 | 0.58 ± 0.13 | 0.36 ± 0.09 | 0.28 ± 0.08 | ||
| 20:4 (n-6) ARA | 6.54 ± 1.61 | 5.38 ± 0.29 | 8.60 ± 2.07 | 7.52 ± 2.60 | 4.61 ± 0.45 | 6.76 ± 2.19 | ||
| 20:3 (n-3) | nd | nd | nd | nd | nd | nd | ||
| 20:4 (n-3) | 0.59 ± 0.08 | 0.28 ± 0.02 | 0.37 ± 0.02 | 0.28 ± 0.05 | 0.58 ± 0.05 | 0.71 ± 0.26 | ||
| 20:5 (n-3) EPA | 9.83 ± 0.61 | 8.18 ± 0.28 | 5.60 ± 0.79 | 5.27 ± 0.65 | 10.68 ± 1.13 | 10.87 ± 0.74 | 10.1 | |
| 22:1 (n-11) | 0.28 ± 0.12 | 0.28 ± 0.07 | 0.24 ± 0.11 | 0.56 ± 0.09 | 0.24 ± 0.08 | 0.25 ± 0.09 | 11.9 | |
| 21:5 (n-3) | 0.32 ± 0.14 | 0.61 ± 0.04 | 0.11 ± 0.04 | nd | 0.37 ± 0.13 | 0.24 ± 0.05 | ||
| 22:5 (n-3) | 0.88 ± 0.44 | 0.63 ± 0.07 | 0.43 ± 0.01 | 0.53 ± 0.11 | 0.92 ± 0.15 | 1.92 ± 0.69 | ||
| 22:6 (n-3) DHA | 5.72 ± 1.55 | 7.42 ± 0.50 | 3.77 ± 0.06 | 3.72 ± 0.15 | 8.27 ± 1.84 | 8.40 ± 2.18 | 15.4 | |
| 24:1 (n-9) | nd | nd | nd | nd | nd | nd | ||
| Lipids (% DW) | 1.67 ± 0.21 | 1.70 ± 0.25 b | 2.00 ± 0.05 | 2.68 ± 0.40 ab | 2.69 ± 0.17 | 3.13 ± 0.12 a | ||
| ∑ IFA | 88.36 ± 1.83 | 86.30 ± 1.56 | 86.35 ± 1.58 | 87.00 ± 1.19 | 87.74 ± 0.44 | 86.43 ± 2.31 n.s. | ||
| SFA | 33.17 ± 1.20 | 30.70 ± 1.44 a | 33.74 ± 2.72 | 35.06 ± 2.72 a | 29.29 ± 1.54 | 26.76 ± 0.93 b | ||
| MUFA | 18.41 ± 1.82 | 19.09 ± 1.30 | 19.83 ± 1.03 | 21.15 ± 1.32 | 18.46 ± 1.20 | 15.68 ± 0.18 n.s. | ||
| PUFA | 36.78 ± 3.01 | 36.50 ± 1.34 ab | 32.78 ± 5.32 | 30.79 ± 5.22 b | 40.00 ± 3.15 | 43.99 ± 2.2 a | ||
| n-3 | 22.14 ± 0.76 | 20.97 ± 0.56 b | 13.71 ± 1.56 | 13.41 ± 0.89 c | 27.46 ± 3.21 | 28.45 ± 0.7 a | ||
| n-6 | 12.47 ± 3.33 | 10.78 ± 1.01 | 16.51 ± 3.16 | 14.25 ± 4.35 | 8.86 ± 0.62 | 11.07 ± 2.99 n.s. | ||
| n-6/n-3 ratio | 0.57 ± 0.17 | 0.52 ± 0.06 b | 1.19 ± 0.09 | 1.03 ± 0.28 a | 0.34 ± 0.07 | 0.39 ± 0.10 b | ||
| EPA + DHA | 10.05 ± 0.49 | 8.58 ± 0.35 a | 5.70 ± 0.75 | 5.27 ± 0.65 b | 11.04 ± 1.25 | 11.11 ± 0.69 a | ||

3. Discussion
4. Experimental Section
4.1. Sampling Site
4.2. Seaweed Sampling
4.3. Chemical Analyses
4.4. Statistical Analysis
5. Conclusions
Acknowledgments
Author Contributions
Conflicts of Interest
References
- Van Ginneken, V.J.T.; Helsper, J.P.F.G.; de Visser, W.; van Keulen, H.; Brandenburg, W.A. Polyunsaturated fatty acids in various macroalgal species from North Atlantic and tropical seas. Lipids Health Dis. 2011, 10, 104. [Google Scholar] [CrossRef] [PubMed]
- Gerster, H. Can adults adequately convert alpha-linolenic acid (18:3n-3) to eicosapentaenoic acid (20:5n-3) and docosahexaenoic acid (22:6n-3)? Int. J. Vitam. Nutr. Res. 1998, 68, 159–173. [Google Scholar] [PubMed]
- Owen, J.M.; Adron, J.W.; Middleton, C.; Cowey, C.B. Elongation and desaturation of dietary fatty acids in turbot Scophthalmus maximus L., and rainbow trout, Salmo gairdnerii rich. Lipids 1975, 10, 528–531. [Google Scholar] [CrossRef] [PubMed]
- March, B.E. Essential fatty acids in fish physiology. Can. J. Physiol. Pharmacol. 1993, 71, 684–689. [Google Scholar] [CrossRef] [PubMed]
- Lands, W. Nutritional Evaluation of Long Chain Fatty Acids in Fish Oil; Barlow, S., Stansby, M., Eds.; Academic Press: London, UK, 1982. [Google Scholar]
- Simopoulos, A.P. The importance of the ratio of omega-6/omega-3 essential fatty acids. Biomed. Pharmacother. 2002, 56, 365–379. [Google Scholar] [CrossRef]
- Simopoulos, A.P. The importance of the omega-6/omega-3 fatty acid ratio in cardiovascular disease and other chronic diseases. Exp. Biol. Med. 2008, 233, 674–688. [Google Scholar] [CrossRef] [PubMed]
- Bell, M.V.; Henderson, R.J.; Sargent, J.R. The role of polyunsaturated fatty acids in fish. Comp. Biochem. Physiol. B. 1986, 83, 711–719. [Google Scholar] [CrossRef]
- Wahbeh, M.I. Amino acid and fatty acid profiles of four species of macroalgae from Aqaba and their suitability for use in fish diets. Aquaculture 1997, 159, 101–109. [Google Scholar] [CrossRef]
- Schmid, M.; Guihéneuf, F.; Stengel, D.B. Fatty acid contents and profiles of 16 macroalgae collected from the Irish Coast at two seasons. J. Appl. Phycol. 2014, 26, 451–463. [Google Scholar] [CrossRef]
- Kendel, M.; Couzinet-Mossion, A.; Viau, M.; Fleurence, J.; Barnathan, G.; Wielgosz-Collin, G. Seasonal composition of lipids, fatty acids, and sterols in the edible red alga Grateloupia turuturu. J. Appl. Phycol. 2013, 25, 425–432. [Google Scholar] [CrossRef]
- Fleurence, J.; Gutbier, G.; Mabeau, S.; Leray, C. Fatty acids from 11 marine macroalgae of the French Brittany coast. J. Appl. Phycol. 1994, 6, 527–532. [Google Scholar] [CrossRef]
- Colombo, M.L.; Risè, P.; Giavarini, F.; De Angelis, L.; Galli, C.; Bolis, C.L. Marine macroalgae as sources of polyunsaturated fatty acids. Plant Foods Hum. Nutr. 2006, 61, 67–72. [Google Scholar] [CrossRef] [PubMed]
- Kumari, P.; Kumar, M.; Gupta, V.; Reddy, C.R.K.; Jha, B. Tropical marine macroalgae as potential sources of nutritionally important PUFAs. Food Chem. 2010, 120, 749–757. [Google Scholar] [CrossRef]
- Food and Agriculture Organization (FAO) of the United Nations. Fishery Statistical Collections. Global Aquaculture Production. Available online: http://www.fao.org/fishery/statistics/global-aquaculture-production/en (accessed on 10 May 2015).
- Peteiro, C.; Salinas, J.M.; Freire, Ó.; Fuertes, C. Cultivation of the autoctonous seaweed Laminaria saccharina off the Galician coast (NW Spain): Production and features of the sporophytes for an annual and biennial harvest. Thalassas 2006, 22, 45–53. [Google Scholar]
- Reid, G.K.; Chopin, T.; Robinson, S.M.C.; Azevedo, P.; Quinton, M.; Belyea, E. Weight ratios of the kelps, Alaria esculenta and Saccharina latissima, required to sequester dissolved inorganic nutrients and supply oxygen for Atlantic salmon, Salmo salar, in Integrated Multi-Trophic Aquaculture systems. Aquaculture 2013, 408–409, 34–46. [Google Scholar] [CrossRef]
- Marinho, G.S.; Holdt, S.L.; Birkeland, M.J.; Angelidaki, I. Commercial cultivation and bioremediation potential of sugar kelp, Saccharina latissima, in Danish waters. J. Appl. Phycol. 2015. [Google Scholar] [CrossRef]
- Sanderson, J.C.; Dring, M.J.; Davidson, K.; Kelly, M.S. Culture, yield and bioremediation potential of Palmaria palmata (Linnaeus) Weber & Mohr and Saccharina latissima (Linnaeus) C.E. Lane, C. Mayes, Druehl & G.W. Saunders adjacent to fish farm cages in northwest Scotland. Aquaculture 2012, 354–355, 128–135. [Google Scholar]
- Peteiro, C.; Freire, Ó. Biomass yield and morphological features of the seaweed Saccharina latissima cultivated at two different sites in a coastal bay in the Atlantic coast of Spain. J. Appl. Phycol. 2013, 25, 205–213. [Google Scholar] [CrossRef]
- Neori, A.; Chopin, T.; Troell, M.; Buschmann, A.H.; Kraemer, G.P.; Halling, C.; Shpigel, M.; Yarish, C. Integrated aquaculture: Rationale, evolution and state of the art emphasizing seaweed biofiltration in modern mariculture. Aquaculture 2004, 231, 361–391. [Google Scholar] [CrossRef]
- Chopin, T.; Cooper, J.A.; Reid, G.; Cross, S.; Moore, C. Open-water integrated multi-trophic aquaculture: Environmental biomitigation and economic diversification of fed aquaculture by extractive aquaculture. Rev. Aquac. 2012, 4, 209–220. [Google Scholar] [CrossRef]
- Chopin, T.; Yarish, C.; Wilkes, R.; Belyea, E.; Lu, S. Developing Porphyra/salmon integrated aquaculture for bioremediation and diversification of the aquaculture industry. J. Appl. Phycol. 2000, 11, 463–472. [Google Scholar] [CrossRef]
- Chopin, T.; Robinson, S.M.C.; Troell, M.; Neori, A.; Buschmann, A.H.; Fang, J. Multitrophic integration for sustainable marine aquaculture. In Ecological Engineering; Jørgensen, S.E., Fath, B.D., Eds.; Elsevier: Oxford, UK, 2008; pp. 2463–2475. [Google Scholar]
- Abreu, M.H.; Varela, D.A.; Henríquez, L.; Villarroel, A.; Yarish, C.; Sousa-Pinto, I.; Buschmann, A.H. Traditional vs. integrated multi-trophic aquaculture of Gracilaria chilensis C.J. Bird, J. McLachlan & E.C. Oliveira: Productivity and physiological performance. Aquaculture 2009, 293, 211–220. [Google Scholar]
- Guschina, I.A.; Harwood, J.L. Lipids and lipid metabolism in eukaryotic algae. Prog. Lipid Res. 2006, 45, 160–186. [Google Scholar] [CrossRef] [PubMed]
- Floreto, E.A.T.; Teshima, S.; Ishikawa, M. Effects of nitrogen and phosphorus on the growth and fatty acid composition of Ulva pertusa Kjellman (Chlorophyta). Bot. Mar. 1996, 39, 69–74. [Google Scholar] [CrossRef]
- Floreto, E.A.T.; Hirata, H.; Ando, S.; Yamasaki, S. Effects of temperature, light intensity, salinity and source of nitrogen on the growth, total lipid and fatty acid composition of Ulva pertusa Kjellman (Chlorophyta). Bot. Mar. 1993, 36, 149–158. [Google Scholar] [CrossRef]
- DTU Food. Food Composition Databank. National Food Institute. Available online: http://www.foodcomp.dk/v7/fcdb_search.asp (accessed on 28 February 2015).
- Opstvedt, J. Fish Lipids in Animal Nutrition; International Fishmeal & Oil Manufactures Association (IFOMA): Hertfordshire, UK, 1985. [Google Scholar]
- Wong, K.H.; Cheung, P.C.K. Nutritional evaluation of some subtropical red and green seaweeds: Part I—Proximate composition, amino acid profiles and some physico-chemical properties. Food Chem. 2000, 71, 475–482. [Google Scholar] [CrossRef]
- Dawczynski, C.; Schubert, R.; Jahreis, G. Amino acids, fatty acids, and dietary fibre in edible seaweed products. Food Chem. 2007, 103, 891–899. [Google Scholar] [CrossRef]
- Nelson, M.M.; Phleger, C.F.; Nichols, P.D. Seasonal lipid composition in macroalgae of the northeastern Pacific Ocean. Bot. Mar. 2002, 45, 58–65. [Google Scholar] [CrossRef]
- Sánchez-Machado, D.I.; López-Cervantes, J.; López-Hernández, J.; Paseiro-Losada, P. Fatty acids, total lipid, protein and ash contents of processed edible seaweeds. Food Chem. 2004, 85, 439–444. [Google Scholar] [CrossRef]
- Silva, G.; Pereira, R.B.; Valentão, P.; Andrade, P.B.; Sousa, C. Distinct fatty acid profile of ten brown macroalgae. Rev. Bras. Farmacogn. 2013, 23, 608–613. [Google Scholar] [CrossRef]
- Moon, B.Y.; Higashi, S.; Gombos, Z.; Murata, N. Unsaturation of the membrane lipids of chloroplasts stabilizes the photosynthetic machinery against low-temperature photoinhibition in transgenic tobacco plants. Proc. Natl. Acad. Sci. USA 1995, 92, 6219–6223. [Google Scholar] [CrossRef] [PubMed]
- Gombos, Z.; Wada, H.; Murata, N. The recovery of photosynthesis from low-temperature photoinhibition is accelerated by the unsaturation of membrane lipids: A mechanism of chilling tolerance. Proc. Natl. Acad. Sci. USA 1994, 91, 8787–8791. [Google Scholar] [CrossRef] [PubMed]
- White, F.; Somero, G. Acid-base regulation and phospholipid adaptations to temperature: Time courses and physiological significance of modifying the milieu for protein function. Physiol. Rev. 1982, 62, 40–90. [Google Scholar] [PubMed]
- Pohl, P.; Zurheide, F. Fatty acids and lipids of marine algae and the control of their biosynthesis by environmental factors. In Marine Algae in Pharmaceutical Science; Hoppe, H.A., Levring, T., Tanaka, Y., Eds.; Springer: Berlin, Germany, 1979; pp. 473–523. [Google Scholar]
- Tabarsa, M.; Rezaei, M.; Ramezanpour, Z.; Waaland, J.R.; Rabiei, R. Fatty acids, amino acids, mineral contents, and proximate composition of some brown seaweeds. J. Phycol. 2012, 48, 285–292. [Google Scholar] [CrossRef]
- Polat, S.; Ozogul, Y. Seasonal proximate and fatty acid variations of some seaweeds from the northeastern Mediterranean coast. Oceanologia 2013, 55, 375–391. [Google Scholar] [CrossRef]
- Iveša, L.; Blažina, M.; Najdek, M. Seasonal variations in fatty acid composition of Caulerpa taxifolia (M. Vahl.) C. Ag. in the northern Adriatic Sea (Malinska, Croatia). Bot. Mar. 2004, 47, 209–214. [Google Scholar] [CrossRef]
- Department of Health. Nutritional Aspects of Cardiovascular Disease. Report Health Social Subjects No. 46; HMSO: London, UK, 1994.
- Lagiou, P.; Løvik, M.; Marchelli, R.; Martin, A.; Moseley, B.; Berg, H.V.L.; Verhagen, H. Labelling reference intake values for n-3 and n-6 polyunsaturated fatty acids Scientific Opinion of the Panel on Dietetic Products, Nutrition and Allergies on a request from the Commission related to labelling reference intake values for n-3 and n-6 poly. EFSA J. 2009. [Google Scholar] [CrossRef]
- Ward, O.P.; Singh, A. Omega-3/6 fatty acids: Alternative sources of production. Process Biochem. 2005, 40, 3627–3652. [Google Scholar] [CrossRef]
- FAO Fisheries and aquaculture department Lipids and Fatty Acids. Aquaculture Development and Coordination Programme. Fish Feed Technology. In Proceedings of the FAO/UNDP Training Course in Fish Feed Technology, College of Fisheries, University of Washington, Seattle, WA, USA, 9 October–15 December 1980; p. 400.
- Marinho, G.; Nunes, C.; Sousa-Pinto, I.; Pereira, R.; Rema, P.; Valente, L.M.P. The IMTA-cultivated Chlorophyta Ulva spp. as a sustainable ingredient in Nile tilapia (Oreochromis niloticus) diets. J. Appl. Phycol. 2013, 25, 1359–1367. [Google Scholar] [CrossRef]
- Valente, L.M.P.; Gouveia, A.; Rema, P.; Matos, J.; Gomes, E.F.; Pinto, I.S. Evaluation of three seaweeds Gracilaria bursa-pastoris, Ulva rigida and Gracilaria cornea as dietary ingredients in European sea bass (Dicentrarchus labrax) juveniles. Aquaculture 2006, 252, 85–91. [Google Scholar] [CrossRef]
- Soler-Vila, A.; Coughlan, S.; Guiry, M.D.; Kraan, S. The red alga Porphyra dioica as a fish-feed ingredient for rainbow trout (Oncorhynchus mykiss): Effects on growth, feed efficiency, and carcass composition. J. Appl. Phycol. 2009, 21, 617–624. [Google Scholar] [CrossRef]
- Bligh, E.G.; Dyer, W.J. A rapid method of total lipid extraction and purification. Can. J. Biochem. Physiol. 1959, 37, 911–917. [Google Scholar] [CrossRef] [PubMed]
- Iverson, S.J.; Lang, S.L.; Cooper, M.H. Comparison of the Bligh and Dyer and Folch methods for total lipid determination in a broad range of marine tissue. Lipids 2001, 36, 1283–1287. [Google Scholar] [CrossRef] [PubMed]
- Firestone, D.; Society, A.O.C. Official Methods and Recommended Practices of the AOCS, 5th ed.; American Oil Chemists’ Society: Urbana, IL, USA, 1998. [Google Scholar]
- Anderson, M.; Gorley, R.; Clarke, K. PERMANOVA+ for PRIMER: Guide to Software and Statistical Methods; PRIMER-E: Plymouth, UK, 2008. [Google Scholar]
© 2015 by the authors; licensee MDPI, Basel, Switzerland. This article is an open access article distributed under the terms and conditions of the Creative Commons Attribution license (http://creativecommons.org/licenses/by/4.0/).
Share and Cite
Marinho, G.S.; Holdt, S.L.; Jacobsen, C.; Angelidaki, I. Lipids and Composition of Fatty Acids of Saccharina latissima Cultivated Year-Round in Integrated Multi-Trophic Aquaculture. Mar. Drugs 2015, 13, 4357-4374. https://doi.org/10.3390/md13074357
Marinho GS, Holdt SL, Jacobsen C, Angelidaki I. Lipids and Composition of Fatty Acids of Saccharina latissima Cultivated Year-Round in Integrated Multi-Trophic Aquaculture. Marine Drugs. 2015; 13(7):4357-4374. https://doi.org/10.3390/md13074357
Chicago/Turabian StyleMarinho, Gonçalo S., Susan L. Holdt, Charlotte Jacobsen, and Irini Angelidaki. 2015. "Lipids and Composition of Fatty Acids of Saccharina latissima Cultivated Year-Round in Integrated Multi-Trophic Aquaculture" Marine Drugs 13, no. 7: 4357-4374. https://doi.org/10.3390/md13074357