2. Results and Discussion
The freeze-dried
C. stolonifera tunicate was sequentially extracted with
n-hexane, dichloromethane (DCM), and methanol (MeOH). The DCM/MeOH extracts were then combined and chromatographed using C
18 bonded silica HPLC MeOH/H
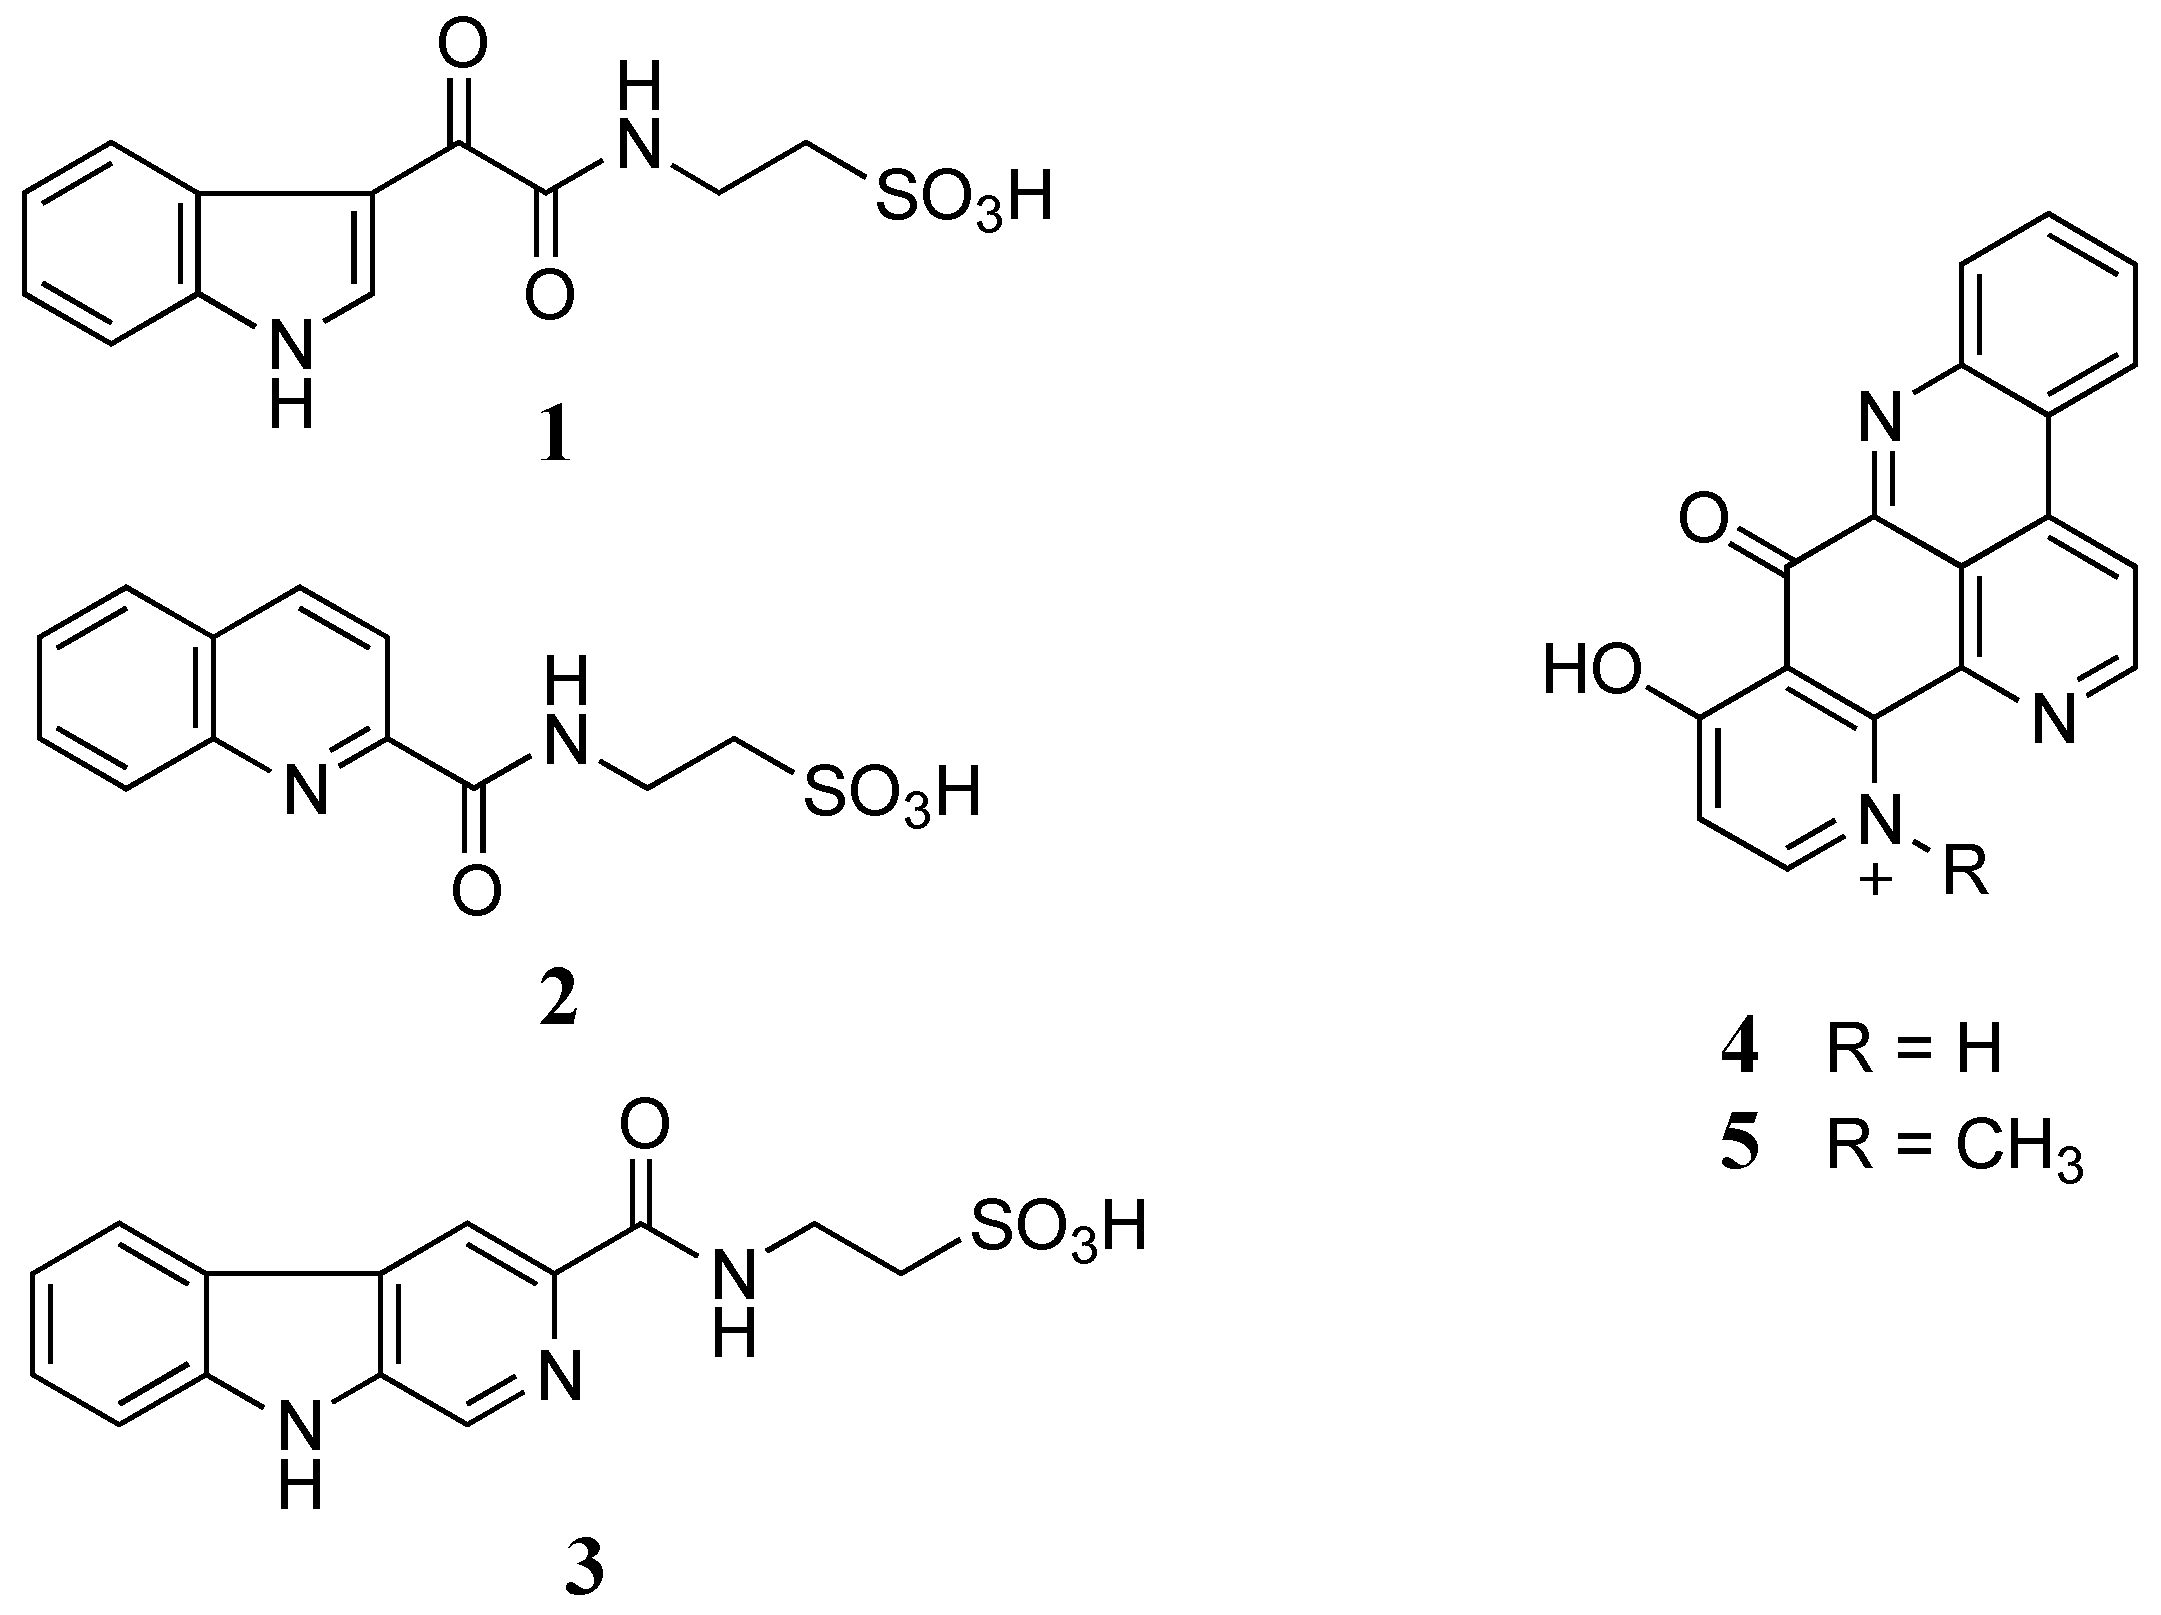
2O/0.1% trifluoroacetic acid (TFA) to yield three new alkaloids, stolonines A–C (
1–
3) together with two known alkaloids, 11-hydroxyascididemin (
4) and cnemidine A (
5) (
Figure 1).
Figure 1.
Structures of stolonines A-C (1–3), 11-hydroxyascididemin (4) and cnemidine A (5) isolated from the tunicate C. stolonifera.
Figure 1.
Structures of stolonines A-C (1–3), 11-hydroxyascididemin (4) and cnemidine A (5) isolated from the tunicate C. stolonifera.
Stolonine A (
1) was obtained as a white amorphous solid. The (−)-HRESIMS spectrum displayed a molecular ion [M−H]
− at
m/
z 295.0390, which was consistent with the molecular formula C
12H
12N
2O
5S. The IR spectrum indicated the presence of an S=O stretching band at 1205 cm
−1 [
16]. A
1H NMR spectrum of
1 showed two exchangeable protons (δ
H 12.20 and 8.78 ppm), five aromatic protons (δ
H 8.82, 8.22, 7.52, 7.26 and 7.24 ppm) and two methylenes (δ
H 3.50 and 2.66 ppm). Further analysis of the
13C NMR and gHSQCAD spectra indicated that the molecule contained two carbonyls (δ
C 181.6 and 162.7 ppm), eight aromatic carbons (δ
C 138.5, 136.2, 126.2, 123.3, 122.4, 121.3, 112.5 and 112.1 ppm) and two methylenes (δ
C 49.8 and 35.5 ppm) (
Table 1).
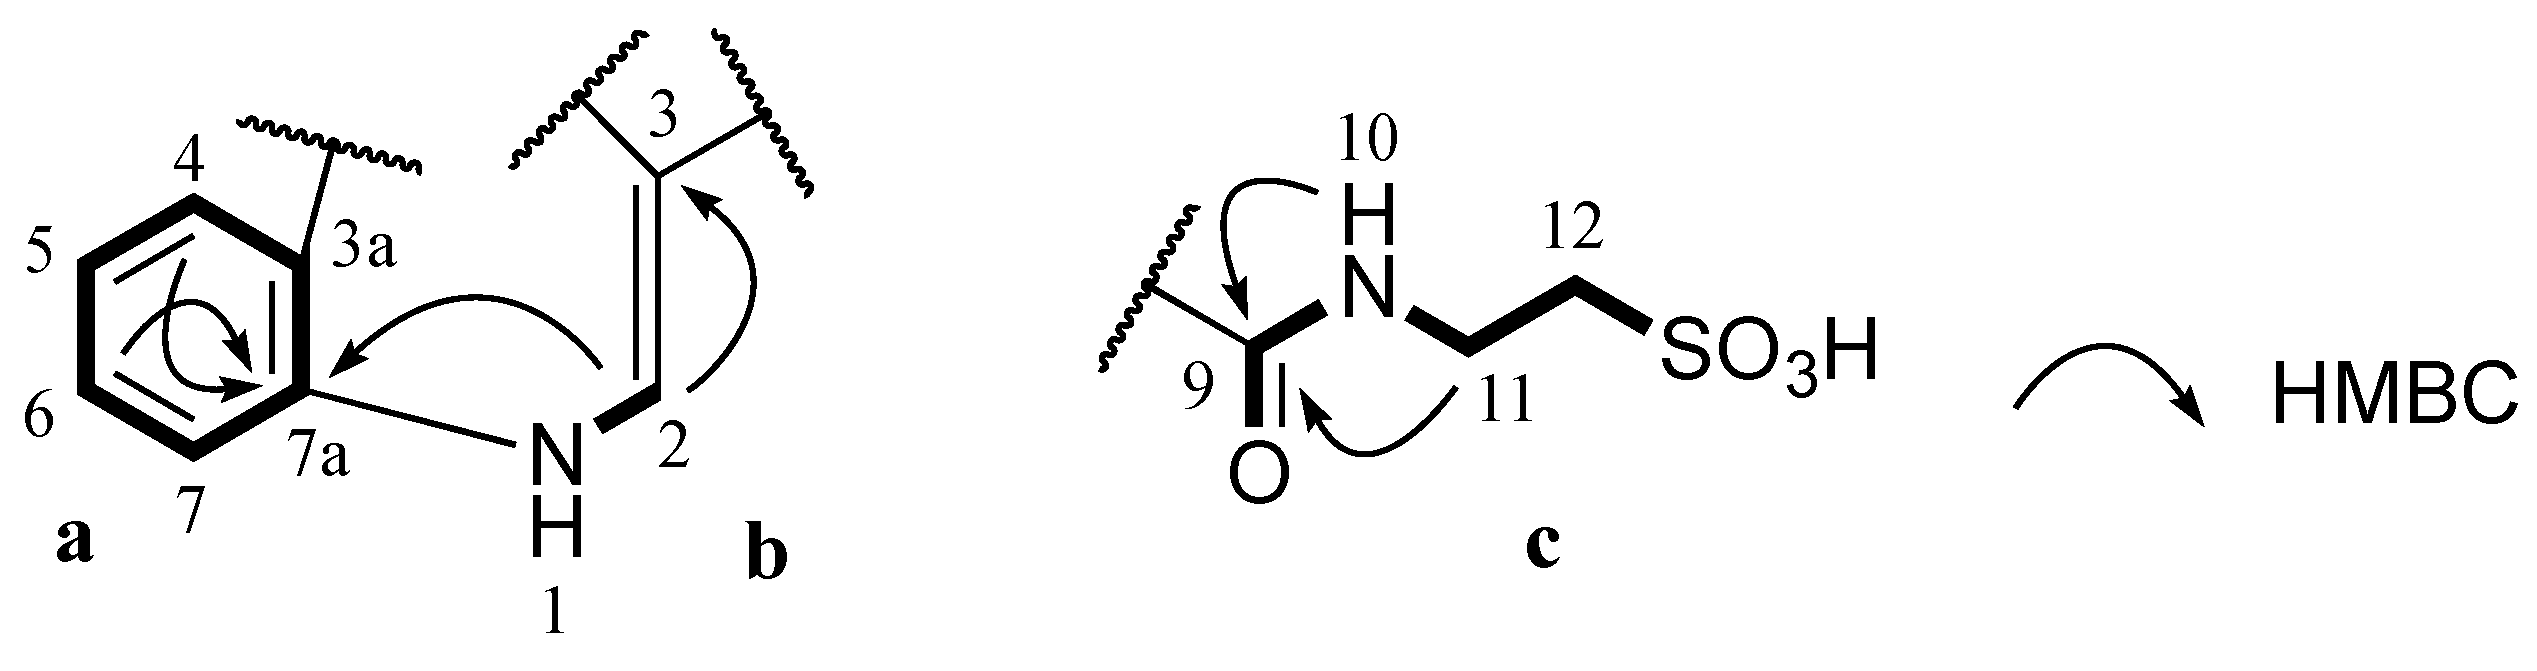
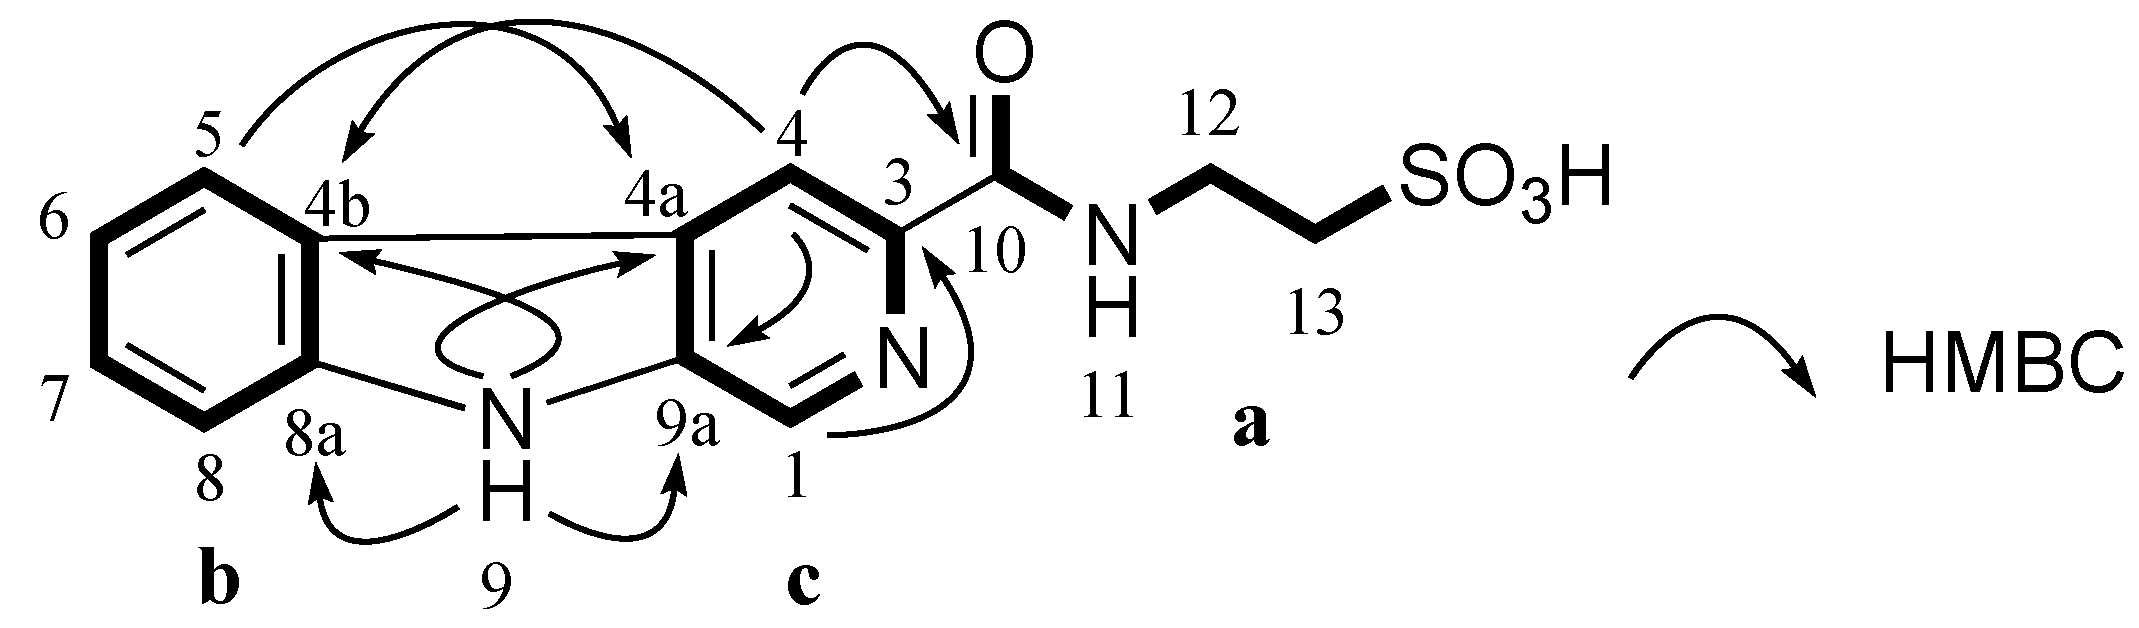
J coupling constants of aromatic protons H-4 (δ
H 8.22, dd, 1.8, 7.2 Hz), H-5 (δ
H 7.24, dt, 1.8, 7.2 Hz), H-6 (δ
H 7.26, dt, 1.8, 7.2 Hz) and H-7 (δ
H 7.52, dd, 1.8, 7.2 Hz) and their COSY correlations were characteristic of a 1,2-disubstituted benzene ring (
a,
Figure 2). A gCOSY spectrum displayed correlations from the exchangeable proton H-1 (δ
H 12.20, br.s) to H-2 (δ
H 8.82, d, 3.0 Hz) and also from H-11 (δ
H 3.50, dd, 6.0, 6.6 Hz) to the triplet exchangeable proton H-10 (δ
H 8.78, t, 5.4 Hz) and H-12 (δ
H 2.66, t, 6.6 Hz) facilitating the establishment of two other spin systems, –NH–CH= (
b,
Figure 2) and –NH–CH2–CH2– (
c,
Figure 2) respectively. The aromatic carbon C-3 (δ
C 112.1 ppm) was attached to C-2 (δ
C 138.5 ppm) in the moiety
b determined by a HMBC correlation from H-2 to C-3. A HMBC correlation from H-2 to C-7a (δ
C 136.2 ppm) supported the linkage from
a to
b at C-7a (
Figure 2). Both protons H-10 and H-11 in the moiety
c showed HMBC correlations with a carbonyl carbon at δ
C 162.7 ppm suggesting the connection of this carbonyl to N-10 to form an amide bond (
c,
Figure 2). Two methylene signals at δ
H 3.50 and 2.66 ppm corresponding to carbons C-11 (δ
C 35.5 ppm) and C-12 (δ
C 49.8 ppm) as well as the relatively downfield resonance of the methylene C-12 were diagnostic of methylenes in a taurine moiety (
c,
Figure 2) [
17,
18,
19].
Table 1.
NMR data for 1 in DMSO-d6 a.
Table 1.
NMR data for 1 in DMSO-d6 a.
| Position | δC | δH (J in Hz) | gCOSY | gHMBCAD |
|---|
| 1 | | 12.20, br.s | 2 | |
| 2 | 138.5 | 8.82, d (3.0) | 1 | 3, 3a, 7a |
| 3 | 112.1 | | | |
| 3a | 126.2 | | | |
| 4 | 121.3 | 8.22, dd (1.8, 7.2) | 5 | 6, 7a |
| 5 | 122.4 | 7.24, dt (1.8, 7.2) | 4, 6 | 3a, 7 |
| 6 | 123.3 | 7.26, dt (1.8, 7.2) | 5, 7 | 4, 7a |
| 7 | 112.5 | 7.52, dd (1.8, 7.2) | 6 | 3a, 5 |
| 7a | 136.2 | | | |
| 8 | 181.6 | | | |
| 9 | 162.7 | | | |
| 10 | | 8.78, t (5.4) | 11 | 9 |
| 11 | 35.5 | 3.50, dd (6.0, 6.6) | 10, 12 | 9, 12 |
| 12 | 49.8 | 2.66, t (6.6) | 11 | 11 |
Figure 2.
Partial structures (a, b and c) of 1 and their key HMBC correlations.
Figure 2.
Partial structures (a, b and c) of 1 and their key HMBC correlations.
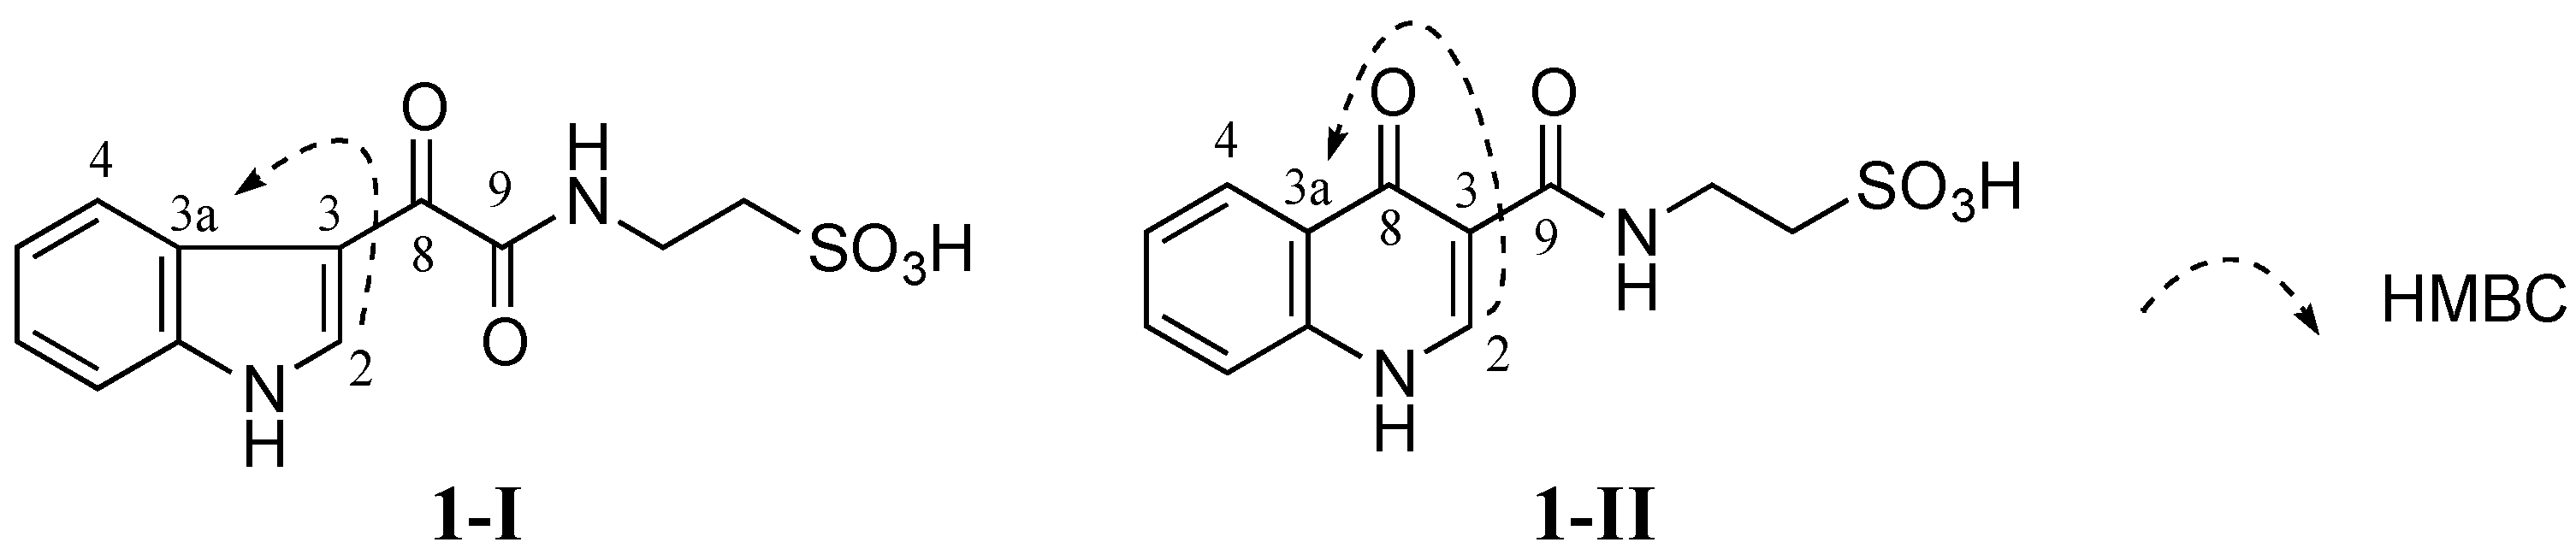
No HMBC correlation from any proton to the carbonyl C-8 (δ
C 181.6 ppm) was observed when HMBC experiments were performed and optimized with different
JHC couplings. Therefore, two different isomers
1-I and
1-II were conceivable from these data (
Figure 3). Detailed HMBC analysis showed that H-2 had a HMBC correlation with C-3a (δ
C 126.2 ppm). This suggested that
1 was favorable to
1-I since the H-2 to C-3a correlation in
1-I was a three-bond coupling while the H-2 to C-3a correlation in
1-II was a four-bond coupling (
Figure 3).
Figure 3.
Two possible structures 1-I and 1-II of 1 (1-I and 1-II are possible structural isomers of 1).
Figure 3.
Two possible structures 1-I and 1-II of 1 (1-I and 1-II are possible structural isomers of 1).
Density functional theory (DFT) NMR calculations together with the DP4 probability analysis, which have recently emerged as powerful tools for the determination of structures that lack sufficient NMR characterization or contain unusual constituents or connectivities [
20,
21,
22,
23,
24,
25], were employed to verify the assigned structure for
1. Theoretical
1H and
13C chemical shifts were calculated at the mPW1PW91/6-31G(d)//B3lyp/6-31G(d) levels. Calculated NMR data of
1-I and
1-II were then compared with the experimental NMR data based on the corrected mean absolute error (CMAE) and the DP4 probability (Computational Details, Experimental Section) to determine which of the isomers fit with the experimental data. The results (
Table 2) indicated that both
13C and
1H chemical shifts of the isomer
1-I showed lower CMAE compared to those of the isomer
1-II. Significant differences were observed in DP4 probabilities. In particular,
1-I had 100% probability for
13C chemical shifts and 85.3% probability for
1H chemical shifts while
1-II only occupied 0% for
13C chemical shifts and 14.7% for
1H chemical shifts (
Table 2). These probabilities indicated that the assignment of the isomer
1-I for
1 was at a high level of confidence [
20]. Therefore, the structure of
1 was suggested as the isomer
1-I.
Table 2.
Comparison of experimental and calculated 13C and 1H chemical shifts for 1 in DMSO-d6.
Table 2.
Comparison of experimental and calculated 13C and 1H chemical shifts for 1 in DMSO-d6.
| Position | δC (Exp.) | 1-I | 1-II | δH (Exp.) | 1-I | 1-II |
|---|
| δC (Calc.) | δC (Scaled) | δC (Calc.) | δC (Scaled) | δH (Calc.) | δH (Scaled) | δH (Calc.) | δH (Scaled) |
|---|
| 2 | 138.5 | 136.9 | 140.3 | 141.3 | 142.8 | 8.82 | 8.74 | 8.61 | 8.84 | 8.67 |
| 3 | 112.1 | 111.5 | 112.9 | 111.2 | 110.2 | | | | | |
| 3a | 126.2 | 124.1 | 126.5 | 123.0 | 122.9 | | | | | |
| 4 | 121.3 | 118.9 | 120.9 | 124.3 | 124.4 | 8.22 | 8.62 | 8.48 | 8.40 | 8.19 |
| 5 | 122.4 | 120.1 | 122.1 | 121.1 | 120.9 | 7.24 | 7.63 | 7.40 | 7.63 | 7.35 |
| 6 | 123.3 | 120.9 | 123.0 | 129.4 | 129.9 | 7.26 | 7.59 | 7.36 | 8.00 | 7.76 |
| 7 | 112.5 | 108.7 | 109.9 | 114.8 | 114.1 | 7.52 | 7.55 | 7.31 | 7.53 | 7.24 |
| 7a | 136.2 | 131.9 | 134.9 | 134.4 | 135.3 | | | | | |
| 8 | 181.6 | 176.7 | 183.2 | 172.5 | 176.5 | | | | | |
| 9 | 162.7 | 156.8 | 161.7 | 159.4 | 162.4 | | | | | |
| 11 | 35.5 | 37.1 | 32.6 | 36.9 | 29.8 | 3.50 | 3.69 | 3.11 | 3.71 | 3.08 |
| 12 | 49.8 | 57.2 | 54.4 | 58.4 | 53.1 | 2.66 | 3.55 | 2.95 | 3.57 | 2.93 |
| CMAE | | | 1.5 | | 3.1 | | | 0.23 | | 0.25 |
| DP4 | | 100.0% | | 0.0% | | | 85.3% | | 14.7% | |
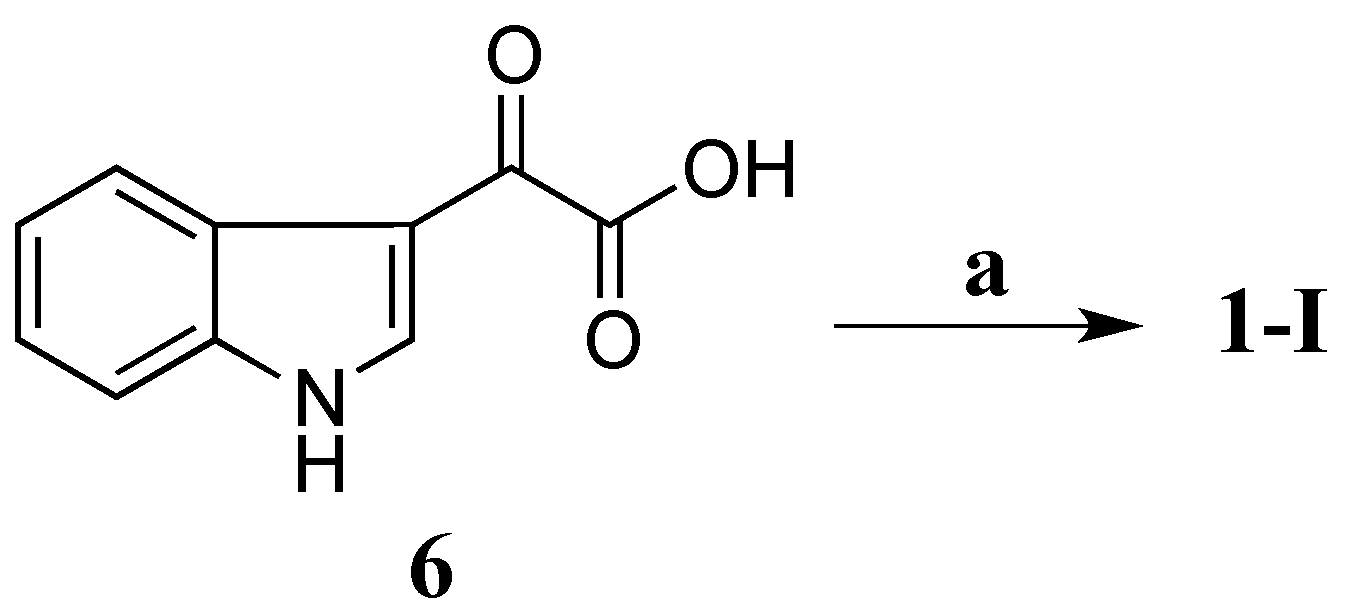
Compound
1-I was synthesized by coupling 3-indoleglyoxylic acid (
6) with taurine (
Scheme 1) in the presence of
N-(3-dimethylaminopropyl)-
N′-ethylcarbodiimide (EDCI),
N-hydroxybenzotriazole (HOBt) and dimethylformamide (DMF) at room temperature (rt) for 21 h (64% yield) [
26]. Both
1H and
13C NMR data of the synthetic
1-I completely matched those of the natural product
1 (
Table 3) confirming that
1-I was the structure of
1. Therefore, compound
1 was defined as a new alkaloid with a trivial name stolonine A.
Scheme 1.
Synthesis of 1. (a) Taurine, EDCI, HOBt, DMF, rt, 21 h, 64%.
Scheme 1.
Synthesis of 1. (a) Taurine, EDCI, HOBt, DMF, rt, 21 h, 64%.
Table 3.
1H and 13C NMR chemical shifts of natural and synthetic products of 1–3 a.
Table 3.
1H and 13C NMR chemical shifts of natural and synthetic products of 1–3 a.
| Position | 1 | 2 | 3 |
|---|
| Natural Product a | Synthetic Product b | Natural Product a | Synthetic Product b | Natural Product a | Synthetic Product b |
|---|
| δC | δH (J in Hz) | δC | δH (J in Hz) | δC | δH (J in Hz) | δC a | δH (J in Hz) | δC | δH (J in Hz) | δC | δH (J in Hz) |
|---|
| 1 | | 12.20, br.s | | 12.19, br.s | | | | | 131.3 | 8.95, s | 131.3 | 8.95, s |
| 2 | 138.5 | 8.82, d (3.0) | 138.5 | 8.82, d (3.0) | 150.1 | | 150.1 | | | | | |
| 3 | 112.1 | | 112.1 | | 118.6 | 8.15, d (8.4) | 118.6 | 8.15, d (8.5) | 138.0 | | 138.0 | |
| 3a | 126.2 | | 126.2 | | | | | | | | | |
| 4 | 121.3 | 8.22, dd (1.8, 7.2) | 121.3 | 8.22, d (7.5) | 137.8 | 8.55, d (8.4) | 137.8 | 8.55, d (8.5) | 114.0 | 8.93, s | 114.1 | 8.93, s |
| 4a | | | | | 129.2 | | 129.2 | | 128.9 | | 129.0 | |
| 4b | | | | | | | | | 120.7 | | 120.7 | |
| 5 | 122.4 | 7.24, dt (1.8, 7.2) | 122.4 | 7.24, t (7.5) | 128.7 | 8.08, d (7.8) | 128.7 | 8.08, d (8.0) | 122.3 | 8.39, d (7.8) | 122.3 | 8.39, d (8.0) |
| 6 | 123.3 | 7.26, dt (1.8, 7.2) | 123.3 | 7.26, t (7.5) | 128.0 | 7.71, t (7.2, 7.8) | 128.0 | 7.71, t (8.0) | 120.3 | 7.35, t (7.2, 7.8) | 120.3 | 7.35, t (7.5, 8.0) |
| 7 | 112.5 | 7.52, dd (1.8, 7.2) | 112.5 | 7.52, d (7.5) | 130.4 | 7.87, t (7.2, 7.8) | 130.4 | 7.87, t (8.0) | 129.2 | 7.64, t (7.2, 7.8) | 129.2 | 7.64, t (7.5, 8.0) |
| 7a | 136.2 | | 136.2 | | | | | | | | | |
| 8 | 181.6 | | 181.6 | | 128.1 | 8.06, d (7.8) | 128.1 | 8.06, d (8.0) | 112.5 | 7.70, d (7.8) | 112.5 | 7.70, d (8.0) |
| 8a | | | | | 146.0 | | 146.0 | | 141.6 | | 141.6 | |
| 9 | 162.7 | | 162.7 | | 163.5 | | 163.5 | | | 12.11, s | | 12.10, s |
| 9a | | | | | | | | | 136.7 | | 136.6 | |
| 10 | | 8.78, t (5.4) | | 8.78, t (5.4) | | 9.29, t (5.4) | | 9.29, t (5.0) | 163.3 | | 163.3 | |
| 11 | 35.5 | 3.50, dd (6.0, 6.6) | 35.5 | 3.50, dd (6.0, 6.5) | 35.9 | 3.65, dd (6.0, 6.6) | 35.9 | 3.65, dd (5.5, 6.5) | | 9.15, t (5.4) | | 9.15, t (5.5) |
| 12 | 49.8 | 2.66, t (6.6) | 49.8 | 2.66, t (6.5) | 50.1 | 2.72, t (6.6) | 50.1 | 2.72, t (6.5) | 35.9 | 3.66, dd (5.4, 6.6) | 35.9 | 3.66, dd (5.5, 6.0) |
| 13 | | | | | | | | | 50.3 | 2.72, t (6.6) | 50.3 | 2.72, t (6.0) |
Stolonine B (
2) was purified as a white amorphous solid. A molecular ion [M − H]
− at
m/
z 279.0441 in the (−)-HRESIMS spectrum indicated that
2 had a molecular formula C
12H
12N
2O
4S. A
1H NMR spectrum of
2 displayed one exchangeable proton (δ
H 9.29 ppm), six aromatic protons (δ
H 8.55, 8.15, 8.08, 8.06, 7.87 and 7.71 ppm) and two methylenes (δ
H 3.65 and 2.72 ppm).
13C NMR combined with gHSQCAD spectra indicated that
2 contained nine aromatic carbons including six tertiary carbons (δ
C 137.8, 130.4, 128.7, 128.1, 128.0 and 118.6 ppm) and three quaternary carbons (δ
C 150.1, 146.0 and 129.2 ppm), one carbonyl (δ
C 163.5 ppm) and two methylenes (δ
C 50.1 and 35.9 ppm) (
Table 4). Compared to
1, compound
2 displayed similar COSY and HMBC correlations from the two methylene protons resulting in the assignment of a taurine moiety. A 1,2-disubstituted benzene ring was deduced on the basis of
J coupling constants and COSY correlations of H-5 (δ
H 8.08, d, 7.8 Hz), H-6 (δ
H 7.71, t, 7.2, 7.8 Hz), H-7 (δ
H 7.87, t, 7.2, 7.8 Hz) and H-8 (δ
H 8.06, d, 7.8 Hz). Two doublet aromatic protons H-3 (δ
H 8.15 ppm) and H-4 (δ
H 8.55 ppm) coupling together with a
J coupling value of 8.4 Hz showed HMBC correlations from H-3 to C-4a (δ
C 129.2 ppm) and from H-4 to C-5 (δ
C 128.7 ppm) and C-8a (δ
C 146.0 ppm) facilitating a connection from
c to
b at C-4. Two quaternary carbons C-2 (δ
C 150.1 ppm) and C-8a (δ
C 146.0 ppm) were linked through a nitrogen atom N-1 based on their downfield resonances, which are characteristic for the imine carbons [
27]. According to a HMBC correlation from H-4 to the imine C-2, C-2 was attached to C-3 leading to the establishment of a quinoline ring system.
Table 4.
NMR data for 2 in DMSO-d6 a.
Table 4.
NMR data for 2 in DMSO-d6 a.
| Position | δC | δH (J in Hz) | gCOSY | gHMBCAD |
|---|
| 2 | 150.1 | | | |
| 3 | 118.6 | 8.15, d (8.4) | 4 | 4a |
| 4 | 137.8 | 8.55, d (8.4) | 3 | 2, 5, 8a |
| 4a | 129.2 | | | |
| 5 | 128.7 | 8.08, d (7.8) | 6 | 4, 7, 8a |
| 6 | 128.0 | 7.71, t (7.2, 7.8) | 5, 7 | 4a, 8 |
| 7 | 130.4 | 7.87, t (7.2, 7.8) | 6, 8 | 5, 8a |
| 8 | 128.1 | 8.06, d (7.8) | 7 | 4a, 6 |
| 8a | 146.0 | | | |
| 9 | 163.5 | | | |
| 10 | | 9.29, t (5.4) | 11 | |
| 11 | 35.9 | 3.65, dd (5.4, 6.6) | 10, 12 | 9, 12 |
| 12 | 50.1 | 2.72, t (6.6) | 11 | 11 |
Due to lack of HMBC correlations from H-3 (δ
H 8.15 ppm) to C-9 (δ
C 163.5 ppm) or from H-10 (δ
H 9.29 ppm) to C-2 to obtain unequivocal evidence of the final structure, total synthesis of
2 was undertaken to verify the structure assignment (
Scheme 2).
o-Nitrobenzaldehyde (
7) was reduced with 4.5 equivalents (eq.) of iron powder in the presence of 0.05 mol of HCl (aqueous, aq.) in ethanol (EtOH) under reflux in 40 min. Methyl pyruvate and potassium hydroxide powder were then added and the condensation reaction was under reflux in additional 1.5 h to obtain quinoline-2-carboxylic acid (
8) (55% yield) [
28]. This compound was coupled with taurine using EDCI/HOBt in DMF at rt for 48 h to produce
2 with a yield of 75%. The NMR data of the synthetic compound
2 (
Table 3) was identical to that of the natural product
2 confirming the structure assignment of
2 as a new taurine amide. Thus, the structure of
2, stolonine B, was established.
Scheme 2.
Synthesis of 2. (a) (i) Fe, HCl, EtOH, reflux, 40 min; (ii) methyl pyruvate, KOH, reflux, 1.5 h, 55% (b) Taurine, EDCI, HOBt, DMF, rt, 48 h, 75%.
Scheme 2.
Synthesis of 2. (a) (i) Fe, HCl, EtOH, reflux, 40 min; (ii) methyl pyruvate, KOH, reflux, 1.5 h, 55% (b) Taurine, EDCI, HOBt, DMF, rt, 48 h, 75%.
Stolonine C (
3) was isolated as a white amorphous solid. Its (−)-HRESIMS spectrum showed a signal for [M − H]
− at
m/
z 318.0550 indicating a molecular formula C
14H
13N
3O
4S to be assigned to
3. A
13C NMR spectrum combined with 2D NMR data indicated that compound
3 had 11 aromatic carbons including six tertiary carbons (δ
C 132.2, 128.2, 122.3, 120.0, 113.9 and 112.3 ppm), five quaternary carbons (δ
C 141.1, 139.6, 137.1, 128.7 and 121.0 ppm), one carbonyl (δ
C 164.3 ppm) and two methylenes (δ
C 50.4 and 35.7 ppm) (
Table 5). COSY and HMBC correlations confirmed
3 had a taurine moiety (
a,
Figure 4) and a 1,2-disubstituted benzene ring (
b,
Figure 4), which were similar to those in
1 and
2. HMBC correlations from a singlet proton H-1 (δ
H 8.89 ppm) to C-3 (δ
C 139.6 ppm), C-4a (δ
C 128.7 ppm) and C-9a (δ
C 137.1 ppm) and from a singlet proton H-4 (δ
H 8.84 ppm) to C-9a indicated the presence of a 2,4,5-trisubstituted pyridine ring (
c,
Figure 4). HMBC correlations from an exchangeable proton H-9 (δ
H 11.96 ppm) to C-4a, C-9a, C-4b (δ
C 121.0 ppm) and C-8a (δ
C 141.1 ppm) supported the connection of
b to
c forming a β-carboline ring system. A HMBC key correlation from H-4 to C-10 (δ
C 164.3 ppm) allowed the connection of
c to
a at C-3 (δ
C 139.6 ppm). Therefore, the structure of stolonine C (
3) was determined as shown in
Figure 4.
Table 5.
NMR data for 3 in DMSO-d6.
Table 5.
NMR data for 3 in DMSO-d6.
| Position | δC a | δH (J in Hz) a | δC b,c | δH (J in Hz) b | gCOSY b | gHMBCAD b |
|---|
| 1 | 132.2 | 8.89, s | 131.3 | 8.95, s | | 3, 4a, 9a |
| 3 | 139.6 | | 138.0 | | | |
| 4 | 113.9 | 8.84, s | 114.0 | 8.93, s | | 4b, 9a, 10 |
| 4a | 128.7 | | 128.9 | | | |
| 4b | 121.0 | | 120.7 | | | |
| 5 | 122.3 | 8.39, d (8.1) | 122.3 | 8.39, d (7.8) | 6 | 4a, 7, 8a |
| 6 | 120.0 | 7.30, t (7.2, 8.1) | 120.3 | 7.35, t (7.2, 7.8) | 5, 7 | 4b, 8 |
| 7 | 128.2 | 7.59, t (7.2, 8.1) | 129.2 | 7.64, t (7.2, 7.8) | 6, 8 | 5, 8a |
| 8 | 112.3 | 7.65, d (8.1) | 112.5 | 7.70, d (7.8) | 7 | 4b, 6 |
| 8a | 141.1 | | 141.6 | | | |
| 9 | | 11.96, s | | 12.11, s | | 4a, 4b, 8a, 9a |
| 9a | 137.1 | | 136.7 | | | |
| 10 | 164.3 | | 163.3 | | | |
| 11 | | 9.09, t (5.4) | | 9.15, t (5.4) | 12 | |
| 12 | 35.7 | 3.64, dd (5.4, 6.3) | 35.9 | 3.66, dd (5.4, 6.6) | 11, 13 | 10, 13 |
| 13 | 50.4 | 2.70, t (6.3) | 50.3 | 2.72, t (6.6) | 12 | 12 |
Figure 4.
Partial structures (a, b and c) of 3 and their key HMBC correlations.
Figure 4.
Partial structures (a, b and c) of 3 and their key HMBC correlations.
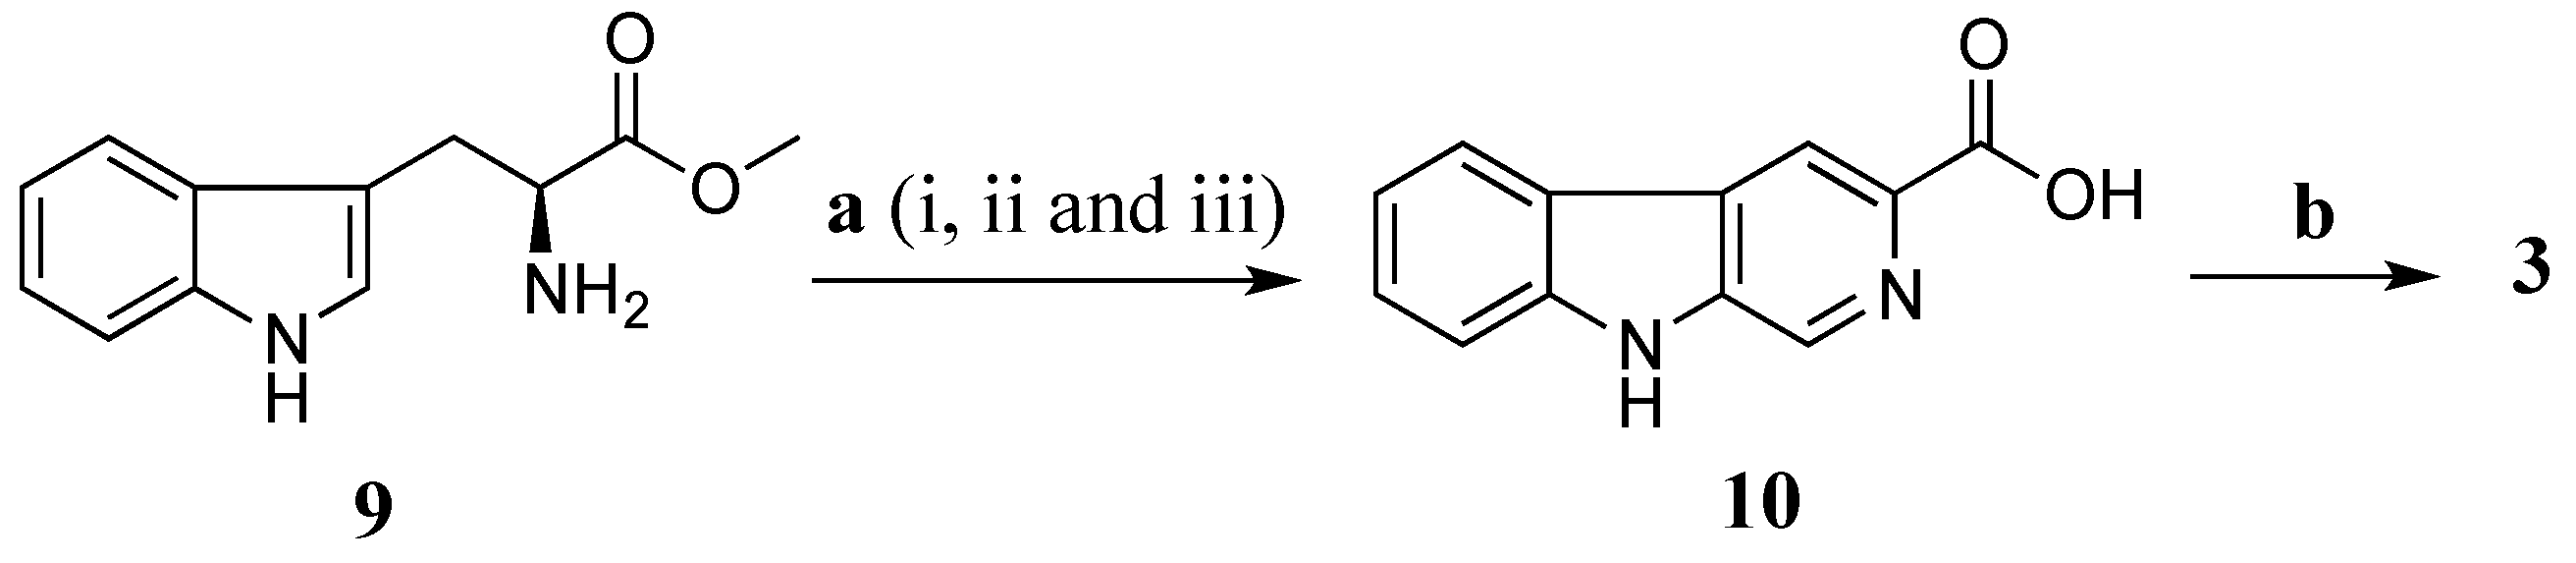
Total synthesis of
3 was performed using
l-tryptophan methyl ester (
9) as a starting material (
Scheme 3). The
l-tryptophan methyl ester was treated with formaldehyde (37% aqueous) in a mixture of MeOH and HCl 0.1 N (ratio 10:1) at rt for 16 h to give methyl (3
S)-1,2,3,4-tetrahydro-β-carboline-3-carboxylate [
29]. The crude methyl (3
S)-1,2,3,4-tetrahydro-β-carboline-3-carboxylate was further oxidized by activated manganese (IV) oxide (MnO
2) in benzene (C
6H
6) under reflux for 5 h yielding a crude methyl β-carboline-3-carboxylate [
30]. This ester was then hydrolysed in a mixture of aq. NaOH 20% and MeOH (ratio 1:4) to provide β-carboline-3-carboxylic acid (
10) (10% yield in three steps) [
30]. Amide coupling of
10 and taurine was performed using EDCI/HOBt in DMF at rt in 16 h to produce
3 with a yield of 40%. The synthetic product
3 had superimposable
1H and
13C NMR data with stolonine C (
3) confirming its structure assignment (
Table 3).
Scheme 3.
Synthesis of 3. (a) (i) HCHO, MeOH, HCl 0.1 N, rt, 16 h; (ii) MnO2, C6H6, reflux, 5 h; (iii) NaOH 20%, MeOH, reflux, 45 min (10% in three steps); (b) Taurine, EDCI, HOBt, DMF, rt, 16 h, 40%.
Scheme 3.
Synthesis of 3. (a) (i) HCHO, MeOH, HCl 0.1 N, rt, 16 h; (ii) MnO2, C6H6, reflux, 5 h; (iii) NaOH 20%, MeOH, reflux, 45 min (10% in three steps); (b) Taurine, EDCI, HOBt, DMF, rt, 16 h, 40%.
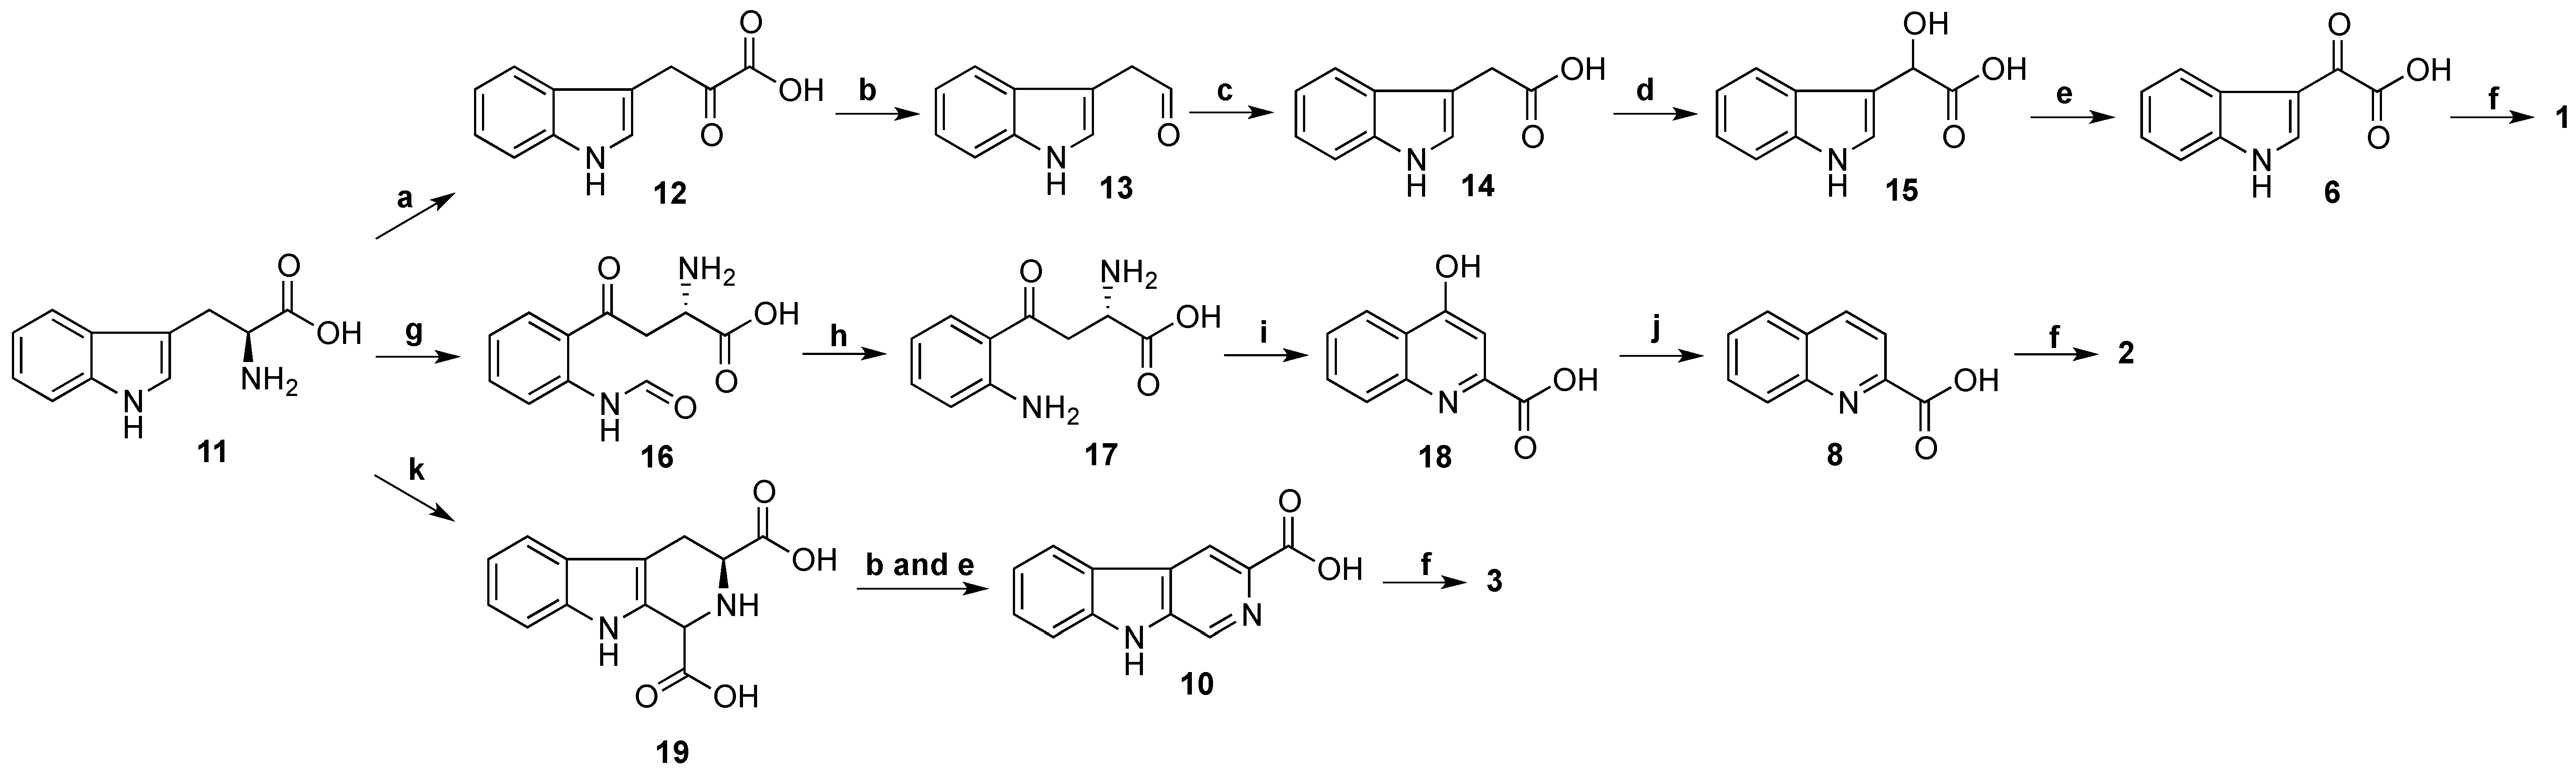
Biosynthesis of stolonines A–C (
1–
3) is shown in
Scheme 4. Tryptophan (
11) has been known as a precursor of 3-indoleglyoxylic acid (
6), quinoline-2-carboxylic acid (
8) and β-carboline-3-carboxylic acid (
10) [
31]. The acids
6,
8 and
10 undergo amide bond formation with taurine either by non-ribosomal peptide synthase [
32,
33] or by acyl-CoA:amino acid
N-acyltransferase 1 [
34,
35] to produce stolonines A–C (
1–
3).
Scheme 4.
Biosynthesis of stolonines A–C (1–3). a: transaminase; b: decarboxylase; c: aldehyde dehydrogenase; d: hydroxylase; e: dehydrogenase; f: taurine + non-ribosomal peptide synthase or acyl-CoA:amino acid N-acyltransferase 1; g: tryptophan 2,3-dioxygenase or indoleamine 2,3-dioxygenase; h: kynurenine formamidase or arylformamidase; i: kynurenine aminotransferases; j: reductase; k: glyoxylic acid.
The two known compounds, 11-hydroxyascididemin (
4) and cnemidine A (
5), were identified by NMR comparisons with those in the literature [
11].
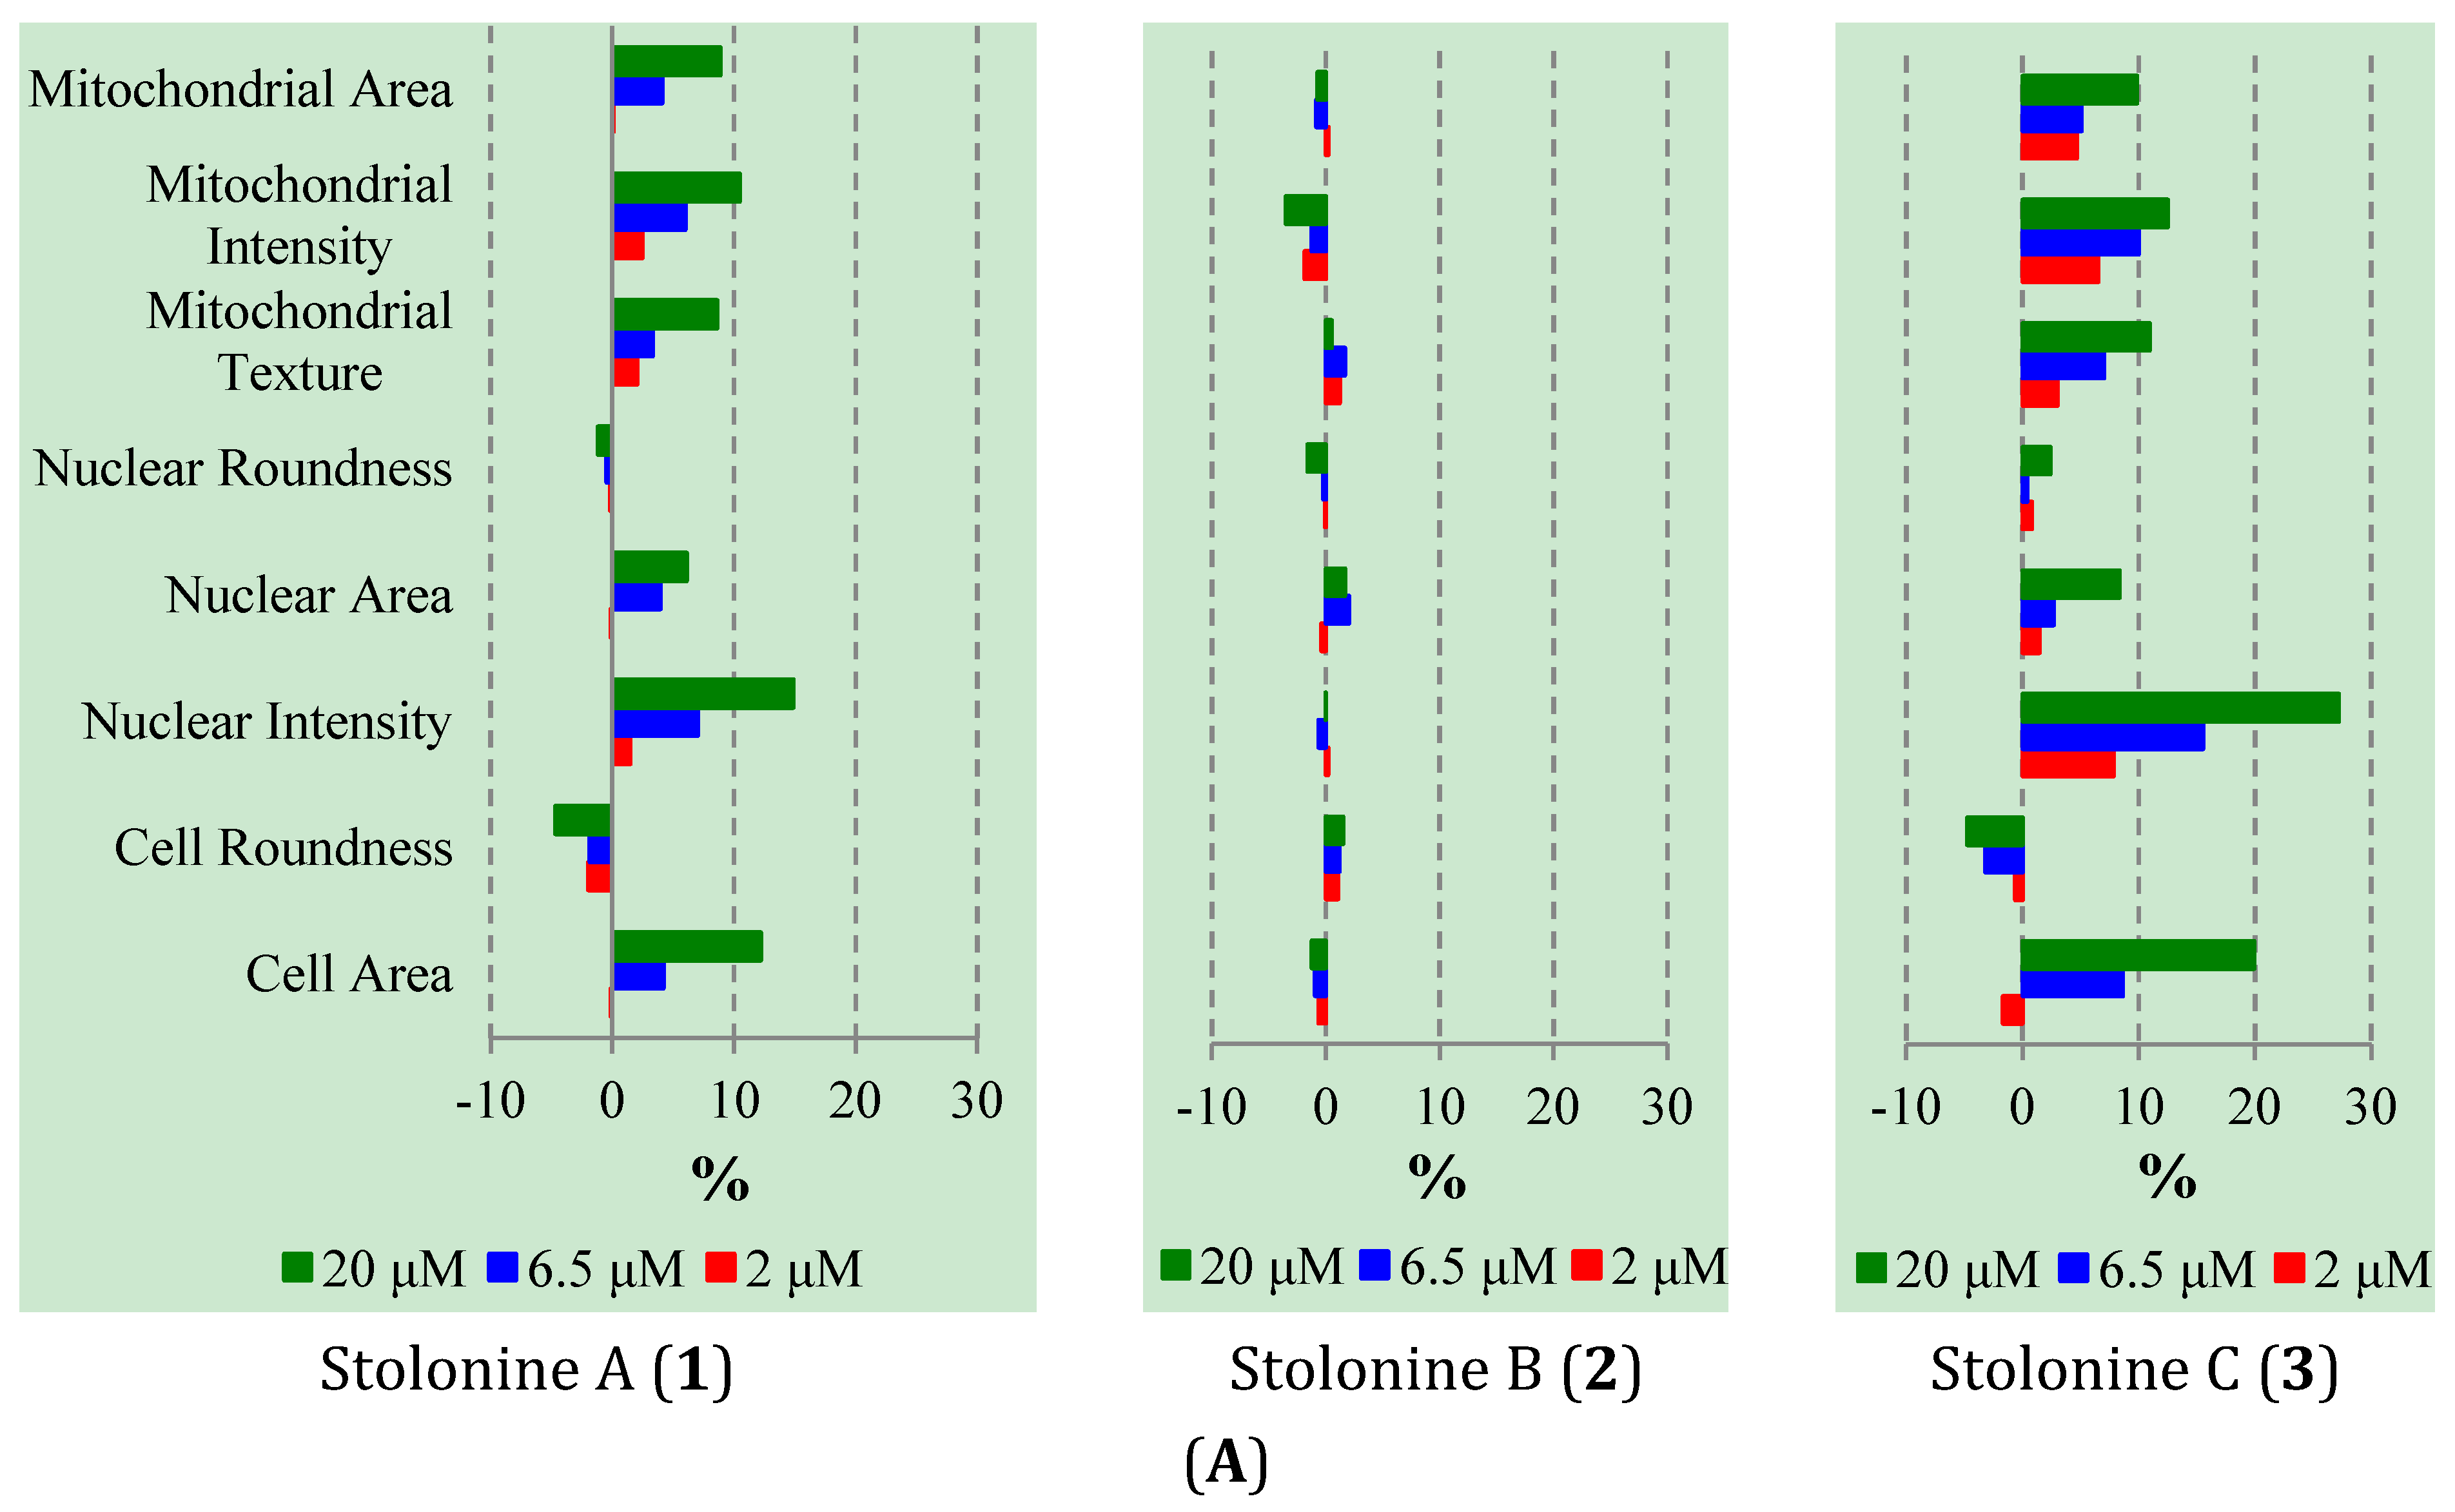
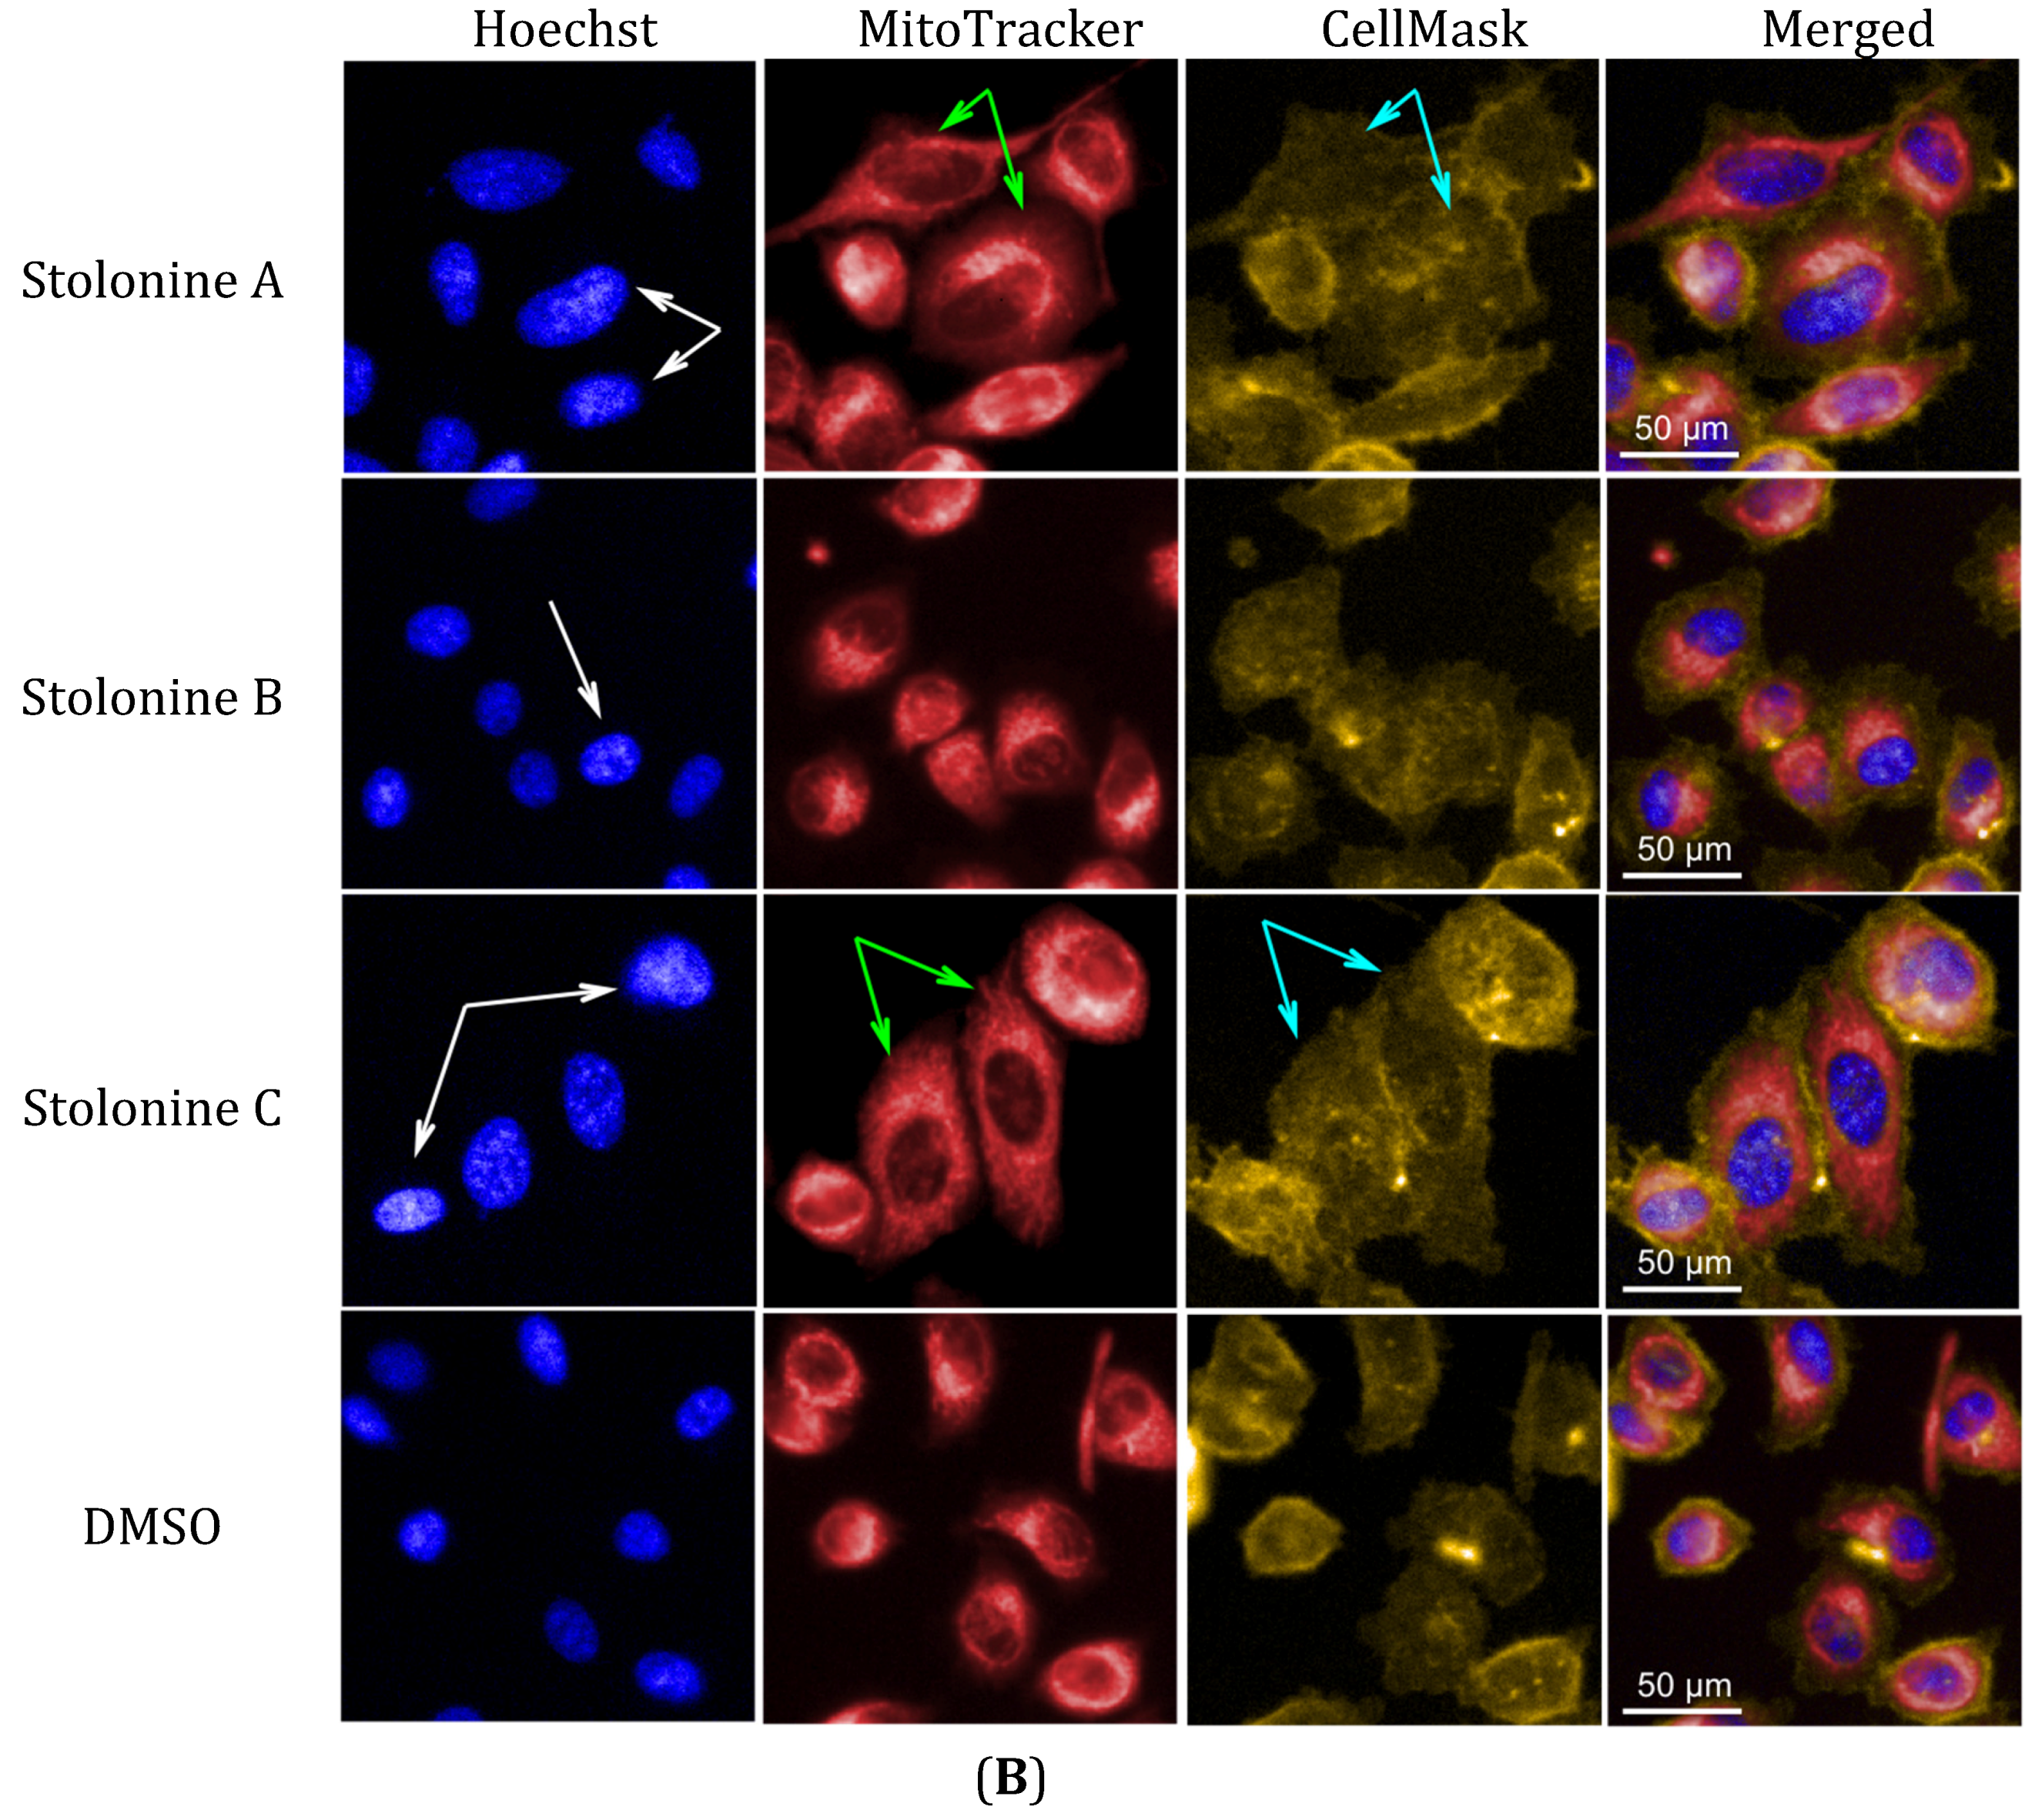
Cytotoxic evaluation of compounds
1–
3 against PC3 cells using the Alamar blue assay indicated that these compounds inhibited the growth of PC3 cells at only 19%, 14%, and 26%, respectively, at their maximum tested concentration of 20 μM. In order to explore whether these compounds have any effect on cellular organelles in PC3 cells, an immunofluorescence assay with three markers for cell membrane, nuclei, and mitochondria was performed. A high-content imaging system was used to image and analyze the data. Compared to vehicle, compounds
1 and
3 had effects on cell morphology, nuclei and mitochondria while compound
2 showed no or very weak effects (
Figure 5A). In general, the influence of
1 and
3 on PC3 cells was similar and clearly observed in cell morphology, nuclear, and mitochondrial intensities as well as mitochondrial texture in a dose-dependent manner. In particular, cells treated with
1 and
3 increased cell size and induced cells to become longer shown by the increase in cell, mitochondrial and nuclear area, and the decrease in cell roundness. Compounds
1 and
3 also caused mitochondrial texture to become larger and elongated compared to
2 and DMSO. The increase in nuclear and mitochondrial intensities, which displayed brighter blue-whitish and brighter red-whitish fluorescent appearance respectively in the images (
Figure 5B), indicated that the nuclei and mitochondria had more packed masses [
36]. The brighter blue-whitish also demonstrated the condensation of chromatins [
37], which has been considered as a hallmark feature of apoptotic pathway of programmed cell death [
38,
39]. The phenotype of nuclei suggested that compounds
1 and
3 affected the PC3 cell death via apoptosis. Moreover, at the non-toxic doses, compounds
1 and
3 also increased the cell size and induced mitochondrial texture elongation. How these compounds influence the PC3 cell morphology and mitochondria is something that warrants further investigation.
Figure 5.
(A) Phenotypic profiles for cell proliferation study of 1–3 (results were normalized by a vehicle DMSO); (B) Representative images of the PC3 cells treated with 20 μM of 1–3 and DMSO in three channels: Hoechst 33,342 (Blue), MitoTracker (Red) and CellMask (Yellow) (scale bar: 50 μm); chromatin condensation (white arrow), mitochondrial texture elongation (green arrow) and larger cell size (cyan arrow) compared with vehicle DMSO.
3. Experimental Section
3.1. General Experimental Procedures
UV spectra were recorded on a CAMSPEC M501 UV/V is spectrophotometer. NMR spectra were recorded at 30 °C on Varian Inova 500 and 600 MHz and on Bruker 900 MHz spectrometers. The 1H and 13C chemical shifts were referenced to the DMSO-d6 solvent peaks at δH 2.50 and δC 39.52 ppm. Standard parameters were used for the 2D NMR spectra obtained, which included gCOSY, gHSQCAD (1JCH = 140 Hz), gHMBCAD (nJCH = 8 Hz), and ROESY. Low-resolution mass spectra were acquired using a Mariner TOF mass spectrometer (Applied Biosystems Pty Ltd, Melbourne, Australia.). High-resolution mass measurement was acquired on a Bruker Solarix 12 Tesla Fourier transform mass spectrometer, fitted with an Apollo API source. For the HPLC isolation, a Water 600 pump equipped with a Water 966 PDA detector and Gilson 715 liquid handler were used. A Betasil C18 column (5 μm, 21.2 × 150 mm) and Hypersil BDS C18 column (5 μm, 10 × 250 mm) were used for semi-preparative HPLC. A Phenomenex Luna C18 column (3 μm, 4.6 × 50 mm) was used for LC-MS controlled by MassLynx 4.1 software (Waters, Milford, MA, USA). All solvents used for extraction and chromatography were HPLC grade from RCI Labscan or Burdick & Jackson (Lomb Scientific, Sydney, Australia), and the H2O used was ultrapure water (Arium® proVF, Sartorius Stedim Biotech, Melbourne, Australia).
3.2. Animal Material
A specimen of the tunicate C. stolonifera (phylum Tunicata, class Ascidiacea, order Stolidobranchia, family Styelidae) was collected at the depth of 15 m, at Peel Island, Myora Light, North Stradbroke Island, Queensland, Australia in 2005. A voucher specimen (G322208) has been stored at the Queensland Museum, South Brisbane, Queensland, Australia. Material was collected under Moreton Bay Marine Park Permit Number QS2005/CVL588 and Queensland Fisheries Service General Fisheries Permit Number PRM02988B issued to the Queensland Museum.
3.3. Extraction and Isolation
The freeze-dried and ground tunicate C. stolonifera (19 g) was extracted exhaustively with hexane (250 mL), DCM (250 mL) and MeOH (2 × 250 mL), respectively. The DCM and MeOH extracts were combined and the solvents were evaporated to yield a yellow residue (2.2 g). This extract was pre-adsorbed onto C18 (1 g) and packed dry into a small cartridge, which was connected to a C18 preparative HPLC column (5 μm, 21.2 × 150 mm). A linear gradient from 100% H2O (0.1% TFA) to 100% MeOH (0.1% TFA) was performed over 60 min at a flow rate of 9 mL/min and 60 fractions (1.0 min each) were collected. Pure cnemidine A (5, 3.5 mg, 0.018% dry wt) and 11-hydroxyascididemin (4, 4.1 mg, 0.021% dry wt) were obtained in fractions 28, 29 and 32 respectively. Fraction 19 was further chromatographed on a Hypersil C18 HPLC column (5 μm, 10 × 250 mm) from 10% MeOH (0.1% TFA)/90% H2O (0.1% TFA) to 25% MeOH (0.1% TFA)/75% H2O (0.1% TFA) at a flow rate of 4 mL/min in 30 min to yield stolonine C (3, 0.1 mg, 0.0021% dry wt) in fraction 14 and stolonine A (1, 0.9 mg, 0.0047% dry wt) in fractions 17–18. Fractions 20 and 21 in the first chromatography were combined and purified using the Hypersil C18 HPLC column (5 μm, 10 × 250 mm) from 10% MeOH (0.1% TFA)/90% H2O (0.1% TFA) to 40% MeOH (0.1% TFA)/60% H2O (0.1% TFA) at a flow rate of 4 mL/min in 45 min to obtain stolonine C (3, 0.3 mg, 0.0021% dry wt in total) in fraction 33 and stolonine B (2, 1.2 mg, 0.0063% dry wt) in fractions 34–36.
Stolonine A (
1): white, amorphous solid; UV (MeOH) λ
max (log ε) 210 (3.8), 252 (3.5) and 325 (3.3) nm; IR (film) ν
max 3307, 1681, 1205, 1049 and 802 cm
−1;
1H (600 MHz, DMSO-
d6) and
13C (150 MHz, DMSO-
d6) NMR data are summarized in
Table 1; (−)-HRESIMS
m/
z 295.0390 [M − H]
− (calcd for [C
12H
11N
2O
5S]
−, 295.0394, Δ −1.4 ppm).
Stolonine B (
2): white, amorphous solid; UV (MeOH) λ
max (log ε) 210 (3.8) and 240 (3.9) nm; IR (film) ν
max 3386, 1684, 1204 and 1066 cm
−1;
1H (600 MHz, DMSO-
d6) and
13C (150 MHz, DMSO-
d6) NMR data are summarized in
Table 3; (−)-HRESIMS
m/
z 279.0441 [M − H]
− (calcd for [C
12H
11N
2O
4S]
−, 279.0445, Δ −1.4 ppm).
Stolonine C (
3): white, amorphous solid; UV (MeOH) λ
max (log ε) 210 (4.1) and 272 (3.8) nm; IR (film) ν
max 3418, 1682, 1197 and 1034 cm
−1;
1H (600 MHz, DMSO-
d6) and
13C (150 MHz, DMSO-
d6) NMR data are summarized in
Table 4; (−)-HRESIMS
m/
z 318.0550 [M − H]
− (calcd for [C
14H
12N
3O
4S]
−, 318.0554, Δ −1.3 ppm).
Synthetic stolonine A (
1): To a solution of taurine (12 mg, 0.096 mmol) in dry DMF (1 mL) was added HOBt (26 mg, 0.193 mmol) and the reaction mixture was stirred for 15 min at rt. The reaction mixture was then cooled to 0 °C, EDCI (37 mg, 0.193 mmol) was added and continued stirring for 30 min at 0 °C. To this mixture was then added 3-indoleglyoxylic acid (
6, 18 mg, 0.095 mmol) and the mixture was stirred for 21 h at rt. The crude product was concentrated
in vacuo and separated by RP-HPLC (MeOH, H
2O, 0.1% TFA) to obtain the synthetic stolonine A (18 mg, 64%); IR (film) ν
max 3371, 1681, 1205, 1047, 802 and 749 cm
−1;
1H (600 MHz, DMSO-
d6) and
13C (150 MHz, DMSO-
d6) NMR data are summarized in
Table 5; (−)-HRESIMS
m/
z 295.0391 [M − H]
− (calcd for [C
12H
11N
2O
5S]
−, 295.0394, Δ −1.0 ppm).
Quinoline-2-carboxylic acid (8): To a solution of o-nitrobenzaldehyde (7, 302 mg, 2 mmol) in ethanol (5 mL) was added iron powder (504 mg, 9 mmol), followed by 0.1 N HCl (2 mL, 0.2 mmol) and the resulting mixture was vigorously stirred under reflux for 45 min. Methyl pyruvate (200 μL, 2 mmol) and powder KOH (135 mg, 2.4 mmol) were added slowly. The reaction mixture was stirred under reflux for 90 min and then cooled to rt. The crude product was purified by RP-HPLC (MeOH, H2O, 0.1% TFA) to yield 8 (190 mg, 55% in two steps); 1H NMR (500 MHz, DMSO-d6) δ 8.56 (1H, d, J = 8.5 Hz), 8.16 (1H, d, J = 8.0 Hz), 8.11 (1H, d, J = 8.5 Hz), 8.09 (1H, d, J = 8.0 Hz), 7.88 (1H, t, J = 8.0 and 7.5 Hz) and 7.74 (1H, t, J = 8.0 and 7.5 Hz); 13C NMR (125 MHz, DMSO-d6) δ 166.2 (COOH), 148.5 (C), 146.6 (C), 137.6 (CH), 130.5 (CH), 129.5 (CH), 128.7 (C), 128.5 (CH), 127.9 (CH) and 120.6 (CH). (+)-LRESIMS m/z 174.
Synthetic stolonine B (
2): To a solution of taurine (13 mg, 0.104 mmol) in dry DMF (1 mL) was added HOBt (28 mg, 0.207 mmol) and the reaction mixture was stirred for 15 min at rt. The reaction mixture was then cooled to 0 °C, EDCI (40 mg, 0.209 mmol) was added and continued stirring for 30 min at 0 °C. To this mixture was then added compound
8 (18 mg, 0.104 mmol) and the mixture was stirred for 48 h at rt. The pure synthetic stolonine B was purified by RP-HPLC (MeOH, H
2O, 0.1% TFA) to obtain 21.8 mg (75% yield); IR (film) ν
max 3383, 1677, 1201 and 1064 cm
−1;
1H (600 MHz, DMSO-
d6) and
13C (150 MHz, DMSO-
d6) NMR data are summarized in
Table 5; (−)-HRESIMS
m/z 279.0446 [M − H]
− (calcd for [C
12H
11N
2O
4S]
−, 279.0445, Δ 0.4 ppm).
β-carboline-3-carboxylic acid (10): Formaldehyde (37%, 2 mL) was added to l-tryptophan methyl ester hydrochloride (9) (2.54 g, 10 mmol) in aqueous MeOH (10 mL, MeOH-H2O (10:1)). The resulting mixture was stirred at rt for 16 h. The reaction mixture was evaporated to dryness in vacuo and oxidized by activated MnO2 (2.5 g, 28.7 mmol) in benzene under reflux for 5 h. The hot solution was filtered through a bed of C18 to remove the MnO2 and the filter cake was washed with hot benzene. The crude product was suspended in a mixture of aq. NaOH 20% and MeOH (ratio 1:4) and heated to reflux for 45 min. The reaction was cooled to rt, evaporated to dryness in vacuo and then loaded onto RP-HPLC (MeOH, H2O, 0.1% TFA) yielding 10 (215 mg, 10% in three steps). 1H NMR (600 MHz, DMSO-d6) δ 12.07 (1H, s), 8.98 (1H, s), 8.92 (1H, s), 8.39 (1H, d, J = 8.4 Hz), 7.67 (1H, d, J = 8.4 Hz), 7.60 (1H, t, J = 7.2, 7.8 Hz), 7.31 (1H, t, J = 7.2, 7.8 Hz); 13C NMR (150 MHz, DMSO-d6) δ 166.8 (COOH), 141.1 (C), 137.4 (2xC), 133.1 (CH), 128.7 (CH), 127.8 (C), 122.2 (CH), 120.9 (C), 120.1 (CH), 117.2 (CH), 112.3 (CH). (+)-LRESIMS m/z 213.
Synthetic stolonine C (
3): To a solution of taurine (5 mg, 0.040 mmol) in dry DMF (1 mL) was added HOBt (13.5 mg, 0.1 mmol) and the reaction mixture was stirred for 15 min at rt. The reaction mixture was then cooled to 0 °C, EDCI (19 mg, 0.099 mmol) was added and continued stirring for 30 min at 0 °C. To this mixture was then added
10 (8 mg, 0.038 mmol) and the mixture was stirred for 16 h at rt. The crude product was concentrated
in vacuo and separated by RP-HPLC (MeOH, H
2O, 0.1% TFA) to obtain the synthetic stolonine C (4.8 mg, 40%); IR (film) ν
max 3419, 1683, 1198 and 1034 cm
−1;
1H (600 MHz, DMSO-
d6) and
13C (150 MHz, DMSO-
d6) NMR data are summarized in
Table 5; (−)-HRESIMS
m/
z 318.0556 [M − H]
− (calcd for [C
14H
12N
3O
4S]
−, 318.0554, Δ 0.6 ppm).
3.4. Computational Details
Molecular mechanics calculations were performed using Macromodel [
40] interfaced to the Maestro program [
41]. All conformational searches used the MMFFs force field. Twenty-one conformers of
1-I and six conformers of
1-II within a relative energy of 2 kcal/mol were found. The geometries of these conformers were subsequently optimized at DFT level with the B3LYP functional and 6-31G(d) basis set using Jaguar [
42]. Single point calculations in DMSO with the mPW1PW91 functional and the same basis set were employed using Jaguar [
42] to provide the shielding constant of carbon and proton nuclei. Meanwhile, the same procedure was applied on tetramethylsilane (TMS). Final
1H and
13C chemical shifts were obtained as the results of the Boltzmann weighted average. The theoretical chemical shifts were calculated according to a below equation.
where
is the calculated shift for nucleus
x (in ppm);
is the shielding constant for nucleus
x;
is the shielding constant for the carbon in TMS
= 194.6867 ppm and for the proton in TMS
= 32.0845 ppm.
Statistical parameters were used to quantify the agreement between experimental and calculated data:
- -
The slope (a), the intercept (b) and the correlation coefficient (R2) were determined from a plot of
against
for each particular compound.
- -
Systematic errors during the shift calculation were removed by empirical scaling according to
- -
The corrected mean absolute error (CMAE) was defined as
- -
DP4 parameter was calculated by using the online applet [
43].
3.5. Cytotoxicity Assay
Human prostate adenocarcinoma cells (PC3) and human neonatal foreskin fibroblast (noncancer cells, NFF) were grown in media RPMI-1640 (Life Technologies, Grand Island, NY, USA) supplemented with 10% foetal bovine serum (FBS) (Life Technologies, Grand Island, NY, USA). Cells were grown under 5% CO2 in a humidified environment at 37 °C. Fifty microliters of media containing 500 cells were added to a 384 well microtiter plate (Perkin Elmer, Shelton, CT, USA, part number: 6,007,660) containing 0.2 μL of a compound. Final compound concentrations tested were 20, 6.5, 2, 0.65, 0.2, 0.065, 0.020 and 0.0065 μM (final DMSO concentration of 0.4%). Each concentration in media was tested in triplicate and in two independent experiments. Cells and compounds were then incubated in 72 h at 37 °C, 5% CO2 and 80% humidity. Cell proliferation was measured with the addition of 10 μL of a 60% Alamar blue (Invitrogen, Carlsbad, CA, USA) solution in media to each well of the microtiter plate to give a final concentration of 10% Alamar blue. The plates were incubated at 37 °C, 5% CO2 and 80% humidity within 24 h. The fluorescence of each well was read at excitation 535 nm and emission 590 nm on the Perkin Elmer EnVision Multilabel Reader 2104. Eight-point concentration response curves were then analyzed using non-linear regression and IC50 values determined by using GraphPad Prism 5 (GraphPad Software Inc., La Jolla, CA, USA). Paclitaxel and doxorubicin were used during each screening as positive control compounds.
3.6. Immunofluorescence Staining
Cells (2000 cells/well) were allowed to seed in a 96-well plate (CellCarrier, Perkin Elmer, Shelton, CT, USA, part number: 6,005,558) containing 0.4 μL of a compound at room temperature for 30 min and then placed under 5% CO2 in a humidified environment at 37 °C. After 72 h incubation, 100 μL of a solution containing 1/1000 Hoechst 33,342 (Molecular Probes, Invitrogen, Carlsbad, CA, USA), 1 μM MitoTracker Deep Red (Molecular Probes, Invitrogen, Carlsbad, CA, USA) and 1/1000 CellMask Plasma Membrane (Molecular Probes, Invitrogen, Carlsbad, CA, USA) were added to each well and incubated for 30 min at 37 °C. Stained cells were washed once with PBS to remove excess stains and then replaced with 100 μL of PBS before being imaged.
3.7. Automated Microscopy and Image Analysis
Plates were imaged with an Operetta high-content wide-field fluorescence imaging system, coupled to Harmony software (Perkin Elmer, Shelton, CT, USA). Wells in a 96-well plate were captured at 25 locations per well at 20× magnification at three wavelengths (350 nm: Hoechst 33,342; 554 nm: CellMask Plasma Membrane; 644 nm: MitoTracker Deep Red). The three images were combined and analyzed using the Harmony software. The analysis protocol involved in the following steps: (1) each cell nucleus was identified using Hoechst stain; (2) the cell cytoplasm as defined from CellMask fluorescence; (3) cells that overlapped the border of the image were excluded from the analysis. Each concentration was repeated in at least two separated experiments. To obviate observer bias, the image analysis was automated using the same parameters for every image.


