Quantification of Representative Ciguatoxins in the Pacific Using Quantitative Nuclear Magnetic Resonance Spectroscopy

Japan Food Research Laboratories, Tama Laboratory, Nagayama 6-11-10, Tama, Tokyo 206-0025, Japan
*
Author to whom correspondence should be addressed.
Mar. Drugs 2017, 15(10), 309; https://doi.org/10.3390/md15100309
Submission received: 8 September 2017
/
Revised: 29 September 2017
/
Accepted: 9 October 2017
/
Published: 12 October 2017
(This article belongs to the Special Issue Target Identification of Marine Products)
Abstract
:The absolute quantification of five toxins involved in ciguatera fish poisoning (CFP) in the Pacific was carried out by quantitative 1H-NMR. The targeted toxins were ciguatoxin-1B (CTX1B), 52-epi-54-deoxyciguatoxin-1B (epideoxyCTX1B), ciguatoxin-3C (CTX3C), 51-hydroxyciguatoxin-3C (51OHCTX3C), and ciguatoxin-4A (CTX4A). We first calibrated the residual protons of pyridine-d5 using certified reference material, 1,4-BTMSB-d4, prepared the toxin solutions with the calibrated pyridin-d5, measured the 1H-NMR spectra, and quantified the toxin using the calibrated residual protons as the internal standard. The absolute quantification was carried out by comparing the signal intensities between the selected protons of the target toxin and the residual protons of the calibrated pyridine-d5. The proton signals residing on the ciguatoxins (CTXs) to be used for quantification were carefully selected for those that were well separated from adjacent signals including impurities and that exhibited an effective intensity. To quantify CTX1B and its congeners, the olefin protons in the side chain were judged appropriate for use. The quantification was achievable with nano-molar solutions. The probable errors for uncertainty, calculated on respective toxins, ranged between 3% and 16%. The contamination of the precious toxins with nonvolatile internal standards was thus avoided. After the evaporation of pyridine-d5, the calibrated CTXs were ready for use as the reference standard in the quantitative analysis of ciguatoxins by LC/MS.
1. Introduction
Ciguatera fish poisoning (CFP) refers to a peculiar form of neurologic poisoning resulting from the ingestion of fish inhabiting warm water regions. Though the mortality rate is low, the morbidity rate for CFP is the highest among the poisoning of natural etiology, with an estimated number of around 50,000 patients annually [1]. In the Pacific, the causative toxins, named ciguatoxins (CTXs), are produced by microalgae, Gambierdiscus spp., and accumulate in various species of fish via the food chain [2]. The toxicity of individual fish is unpredictable and markedly fluctuates, as the population of the causative alga and feeding history of fish can greatly vary [3]. To protect human health and avoid serious economic loss due to the implication of commercially important species, proper measures to detect toxins are highly desired. Mouse bioassays [4] have been the routine practice to detect CTXs since early days but need to be substituted by other methods of higher sensitivity and specificity, not to mention the call to limit animal use for routine assays. Previously, we proposed using an LC/MS method as an alternative and successfully revealed the details of regional and species variations of toxin profiles in fish and causative algae [5]. The method is highly sensitive and produces accurate data, but we have to clear three hurdles to promote its wide use. First, we have to quantify extremely low concentrations of the toxins. The consensus on the regulation level is 0.01 ppb for ciguatoxin 1B or its equivalent in flesh [6]. Even higher is the second hurdle to prepare pure toxins to be used as standards. The major toxin, ciguatoxin-1B, needed four tons of toxic fish collected over ten years to obtain 0.35 mg. Much effort had to be continued, therefore, to prepare toxins of less abundance. The final problem to be solved was how to quantify such minute samples. The toxins have no chromophore. Complete drying for weighing is defied because recovery from the vessel surface becomes difficult. Therefore, we chose a quantitative 1H-NMR (qNMR) method for quantitation [7]. The foreseeable problems in NMR were the small samples, multiple and often overlapping proton signals, the large ladder-shape structure comprising stereo-flexible medium size rings (seven, eight, and nine membered), and the large signals of water that remain in the samples. The routine practice of using Certified Reference Material (CRM) as an internal standard [8] was disfavored to avoid the contamination of the target toxins with the nonvolatile CRMs. Instead, we used CRM to quantify the residual protons in pyridine-d5 and subsequently used the calibrated pyridine-d5 as the secondary inner standard to quantify the CTXs. Ciguatoxins present in fish in the Pacific consist of two groups differing in their skeletal structures, ciguatotoxin-1B type, and ciguatoxin-3C type. Hence, the selection of suitable protons in each type is required for quantification. We carried out the NMR measurements, meticulously choosing the parameters. The quantity of each CTX was calculated by employing the signal area ratio accurately integrated between the CTXs and calibrated pyridine-d5 proton signals. Thus, we achieved, for the first time, the quantification of five toxins important in monitoring fish toxicity in the Pacific (Figure 1): CTX1B, epideoxyCTX1B, CTX3C, 51OHCTX3C, and CTX4A. The calibrated toxins will serve as an invaluable tool to identify and quantify the toxins in fish that have remained elusive in the past. A great contribution is expected to toxicology, epidemiology, environmental studies, and commercial fisheries.
2. Results
2.1. Determination of the Residual Proton Content of Pyridine-d5 and Purity Calculation
The 1H-NMR spectrum of pyridine-d5 (Figure 2) exhibited three residual proton signals arising from H-2 and H-6 (8.76 ppm), H-4 (7.61 ppm), and H-3 and H-5 (7.24 ppm). The residual proton content in pyridine-d5 was calculated by 1H-NMR experiments using 1,4-BTMSB-d4 as the internal standard, based on the following Equation (1):
where ValueA is the quantity of the residual proton in the pyridine-d5; IA is the area ratio of each individual (define ratio) signal arising from the residual proton; IIS is the area ratio of the internal standard; NIS is the number of protons of the internal standard; NA is the number of protons of the residual proton; MA is the mole weight of the residual proton, calculated by employing C5H5N as the chemical formula; MIS is the mole weight of the internal standard; WIS is the weight of the internal standard; WA is the weight of the pyridine-d5; and PIS is the purity of the internal standard.
The quantity of each residual proton signal in pyridine-d5 calculated was determined to be 0.149%, 0.159%, and 0.153%, respectively. Those residual proton signals showed good repeatability (relative standard deviations (RSD) ranged from 0.30% to 0.33%) between the content of five ampoules, indicating the validity of the signals as internal standards. In the same production lot of ampoules, the residual proton of pyridine-d5 was stably included in a fixed amount. Thus, the use of the same lot of pyridine-d5 ampoules as an internal standard solution was enabled. On the other hand, the dispersion between three signals was as large as 3.1% RSD, and it was considered that the deuteration ratio differs for each position of pyridine. The residual proton amount was not averaged among the signals and was used as an individual value.
The pre-calibrated pyridine-d5 ensures an ability to trace an absolute quantity of the CTX standards to the SI units. Of the three signals of the residual protons, two signals at a higher field (7.61 and 7.24 ppm) were overlapped with the hydroxy protons of 11-OH and 47-OH in CTX1B or 7-OH and 44-OH of CTX3C and thus judged unsuitable for use as the internal standard. Being free of contamination, the signal at 8.43 ppm (H-2, H-6) was judged appropriate for calculation (Figure 2).
2.2. Quantification of Respective CTXs
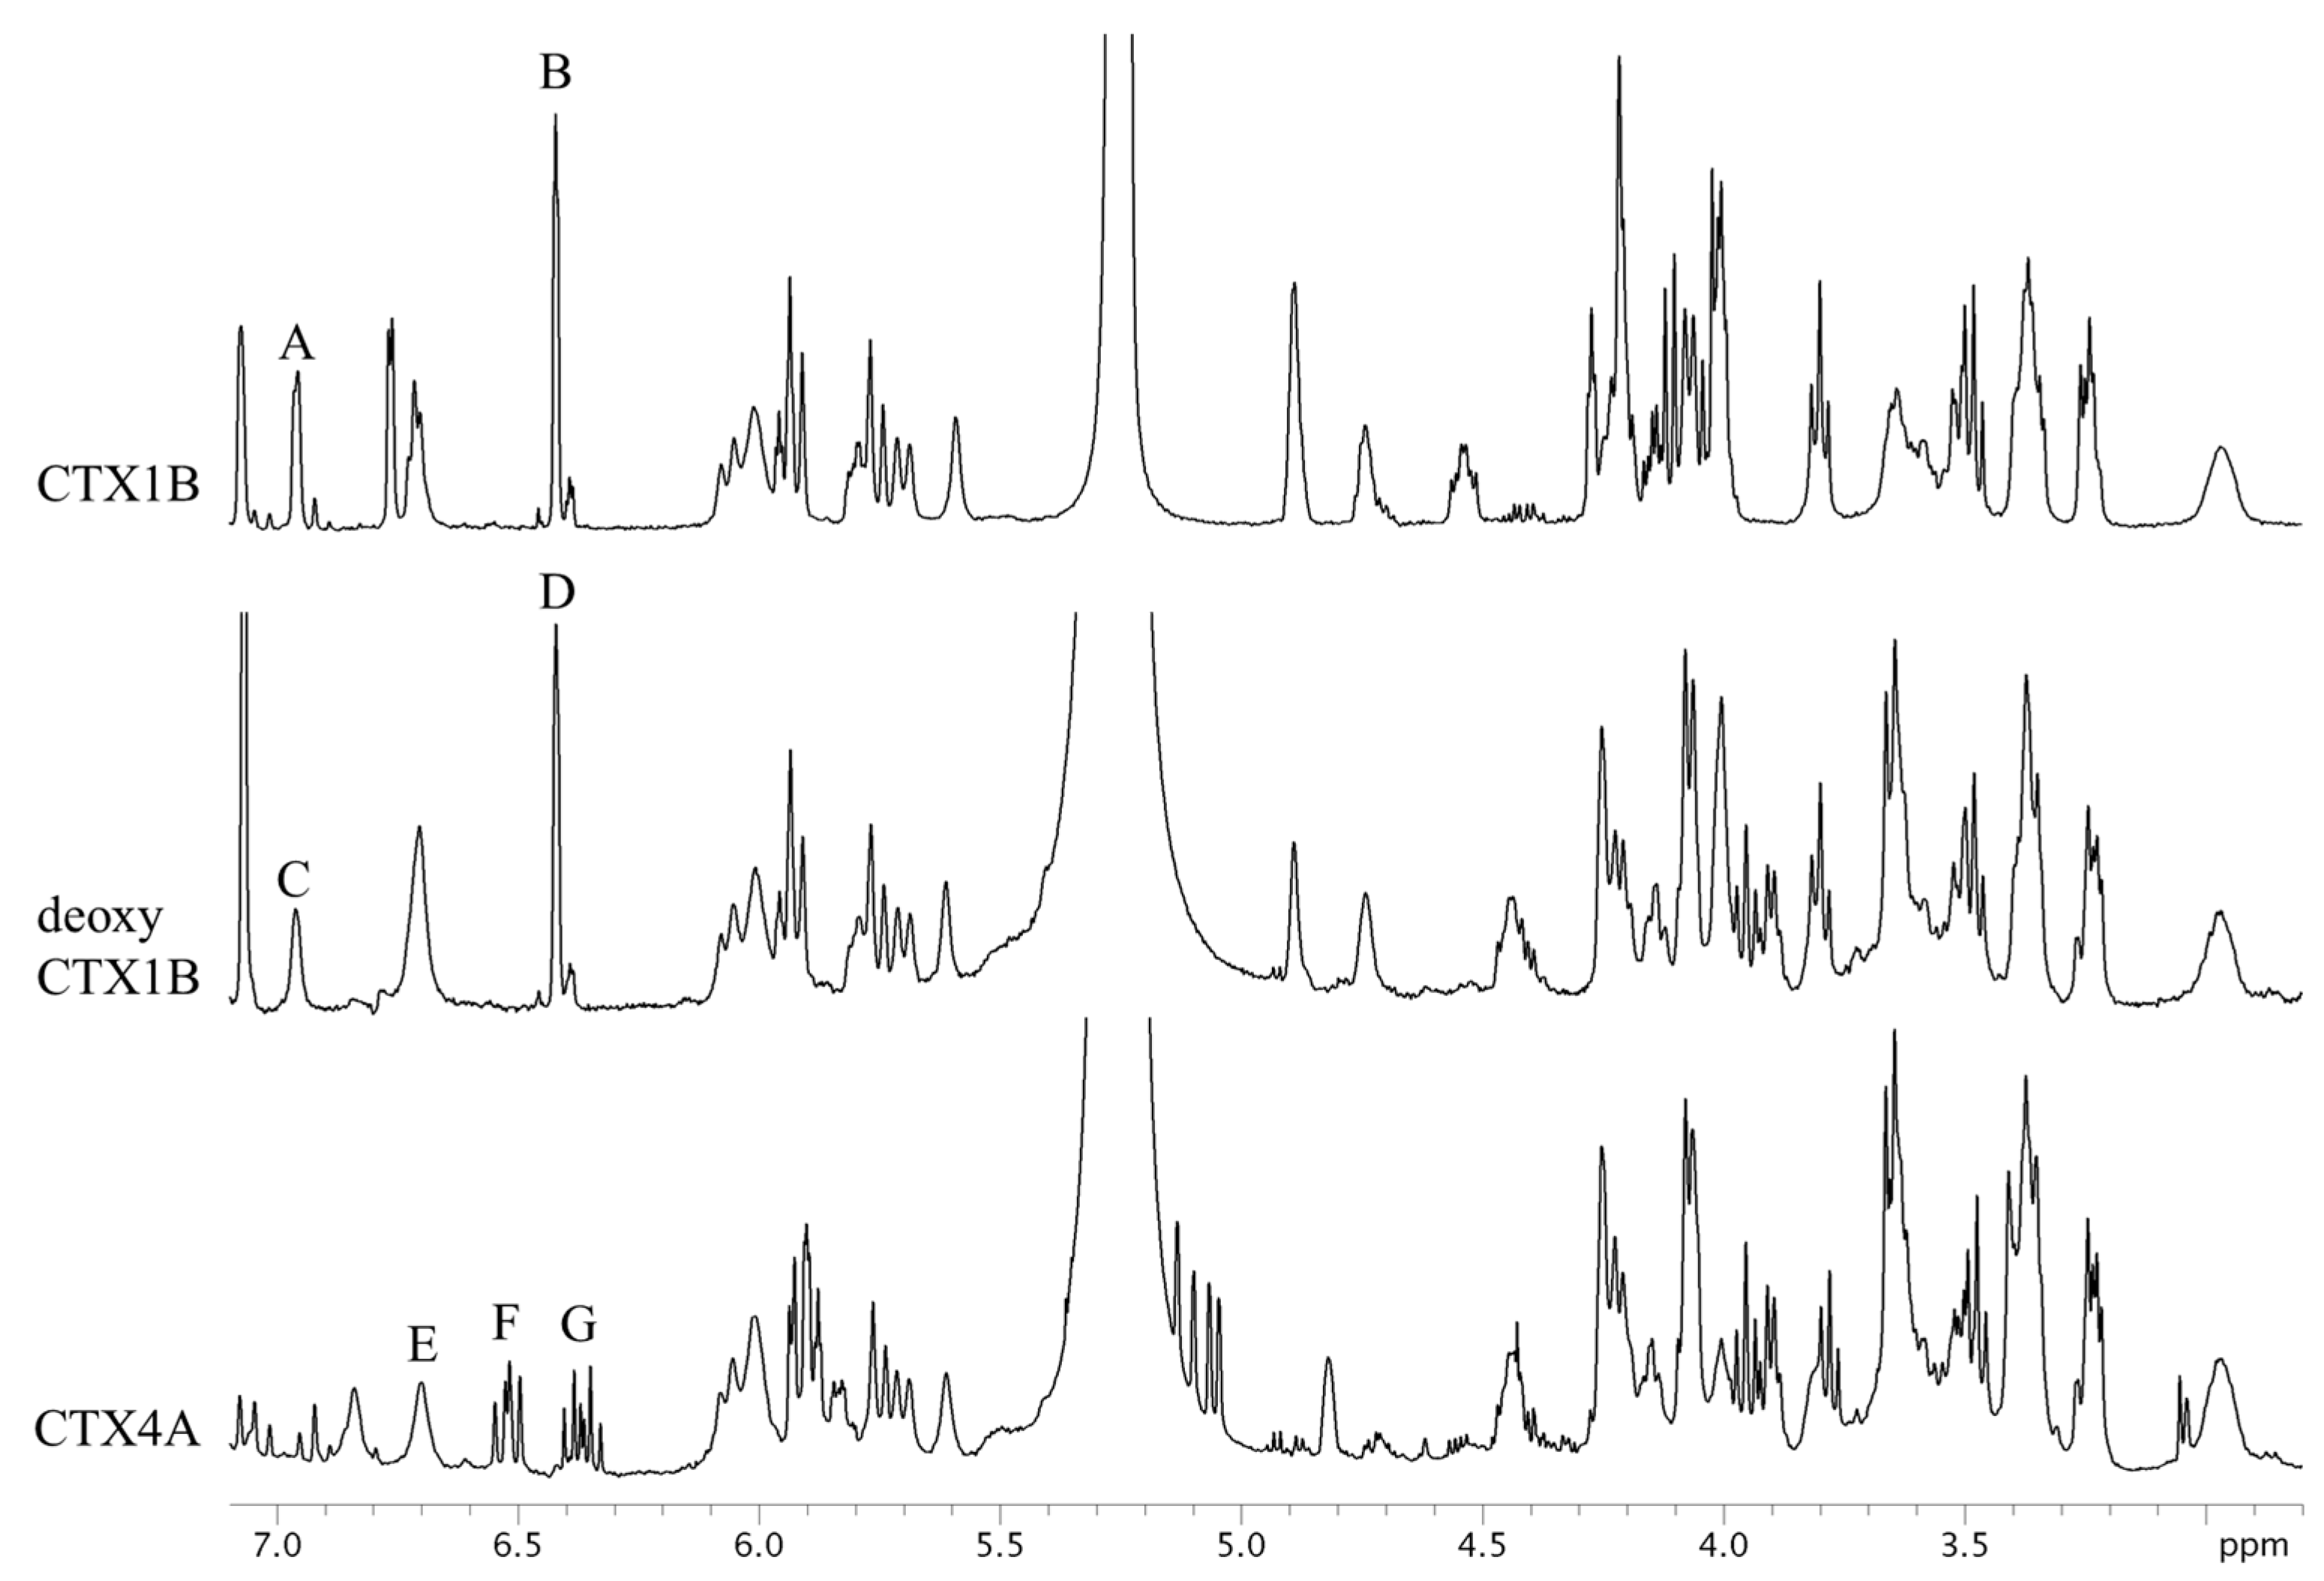
The 1H-NMR spectra of CTX1B, epideoxyCTX1B, and CTX4A are shown in Figure 3. The signals, though congested, were assignable based on the reference [9,10]. Apparently, the signals suitable for quantitative use are limited to a few arising from the protons of olefins and hydroxyls. They are moderately well separated from the congested signals of the protons on the skeletal structures. The separation between the olefin and hydroxyl proton signals was best achieved by measuring at 5 °C. The signals B and D, characteristic to the 3-butene-diol side-chain of the CTX1B and epideoxyCTX1B, feature narrow line widths and sufficient intensity to make them suitable for calculation. Calculations based on these signals placed the content at 0.14 mg (0.2% RSD) for CTX1B and 0.06 mg (0.5% RSD) for epideoxyCTX1B. Similarly, signals A and C, arising from 2-OH located in the lower-magnetic field, had narrow line widths and adequate intensity. The CTX content calculated therefrom was almost a complete match with those from the aforementioned signals B and D. The accuracy of the quantification was thus supported (Table 1). The protons that produced signals A, B, C, and D do not belong to the polyether rings but reside on the side chains. Unlike the protons on the cyclic rings, the protons on the side-chain are less susceptible to the conformational changes of the skeletal rings and, therefore, the broadening of the signals is reduced. The characteristic multiplet signals, F and G, arising from the 1,3-diene of the side chain in CTX4A also feature narrow line widths suitable for the CTX4A quantification. However, the multiple line shape resulted in low signal intensity and inevitably led to a large dispersion of the quantitative value (0.07 mg; 2.3% RSD), as compared with the value obtained on an equivalent concentration of epideoxyCTX1B (0.06 mg; 0.5% RSD).
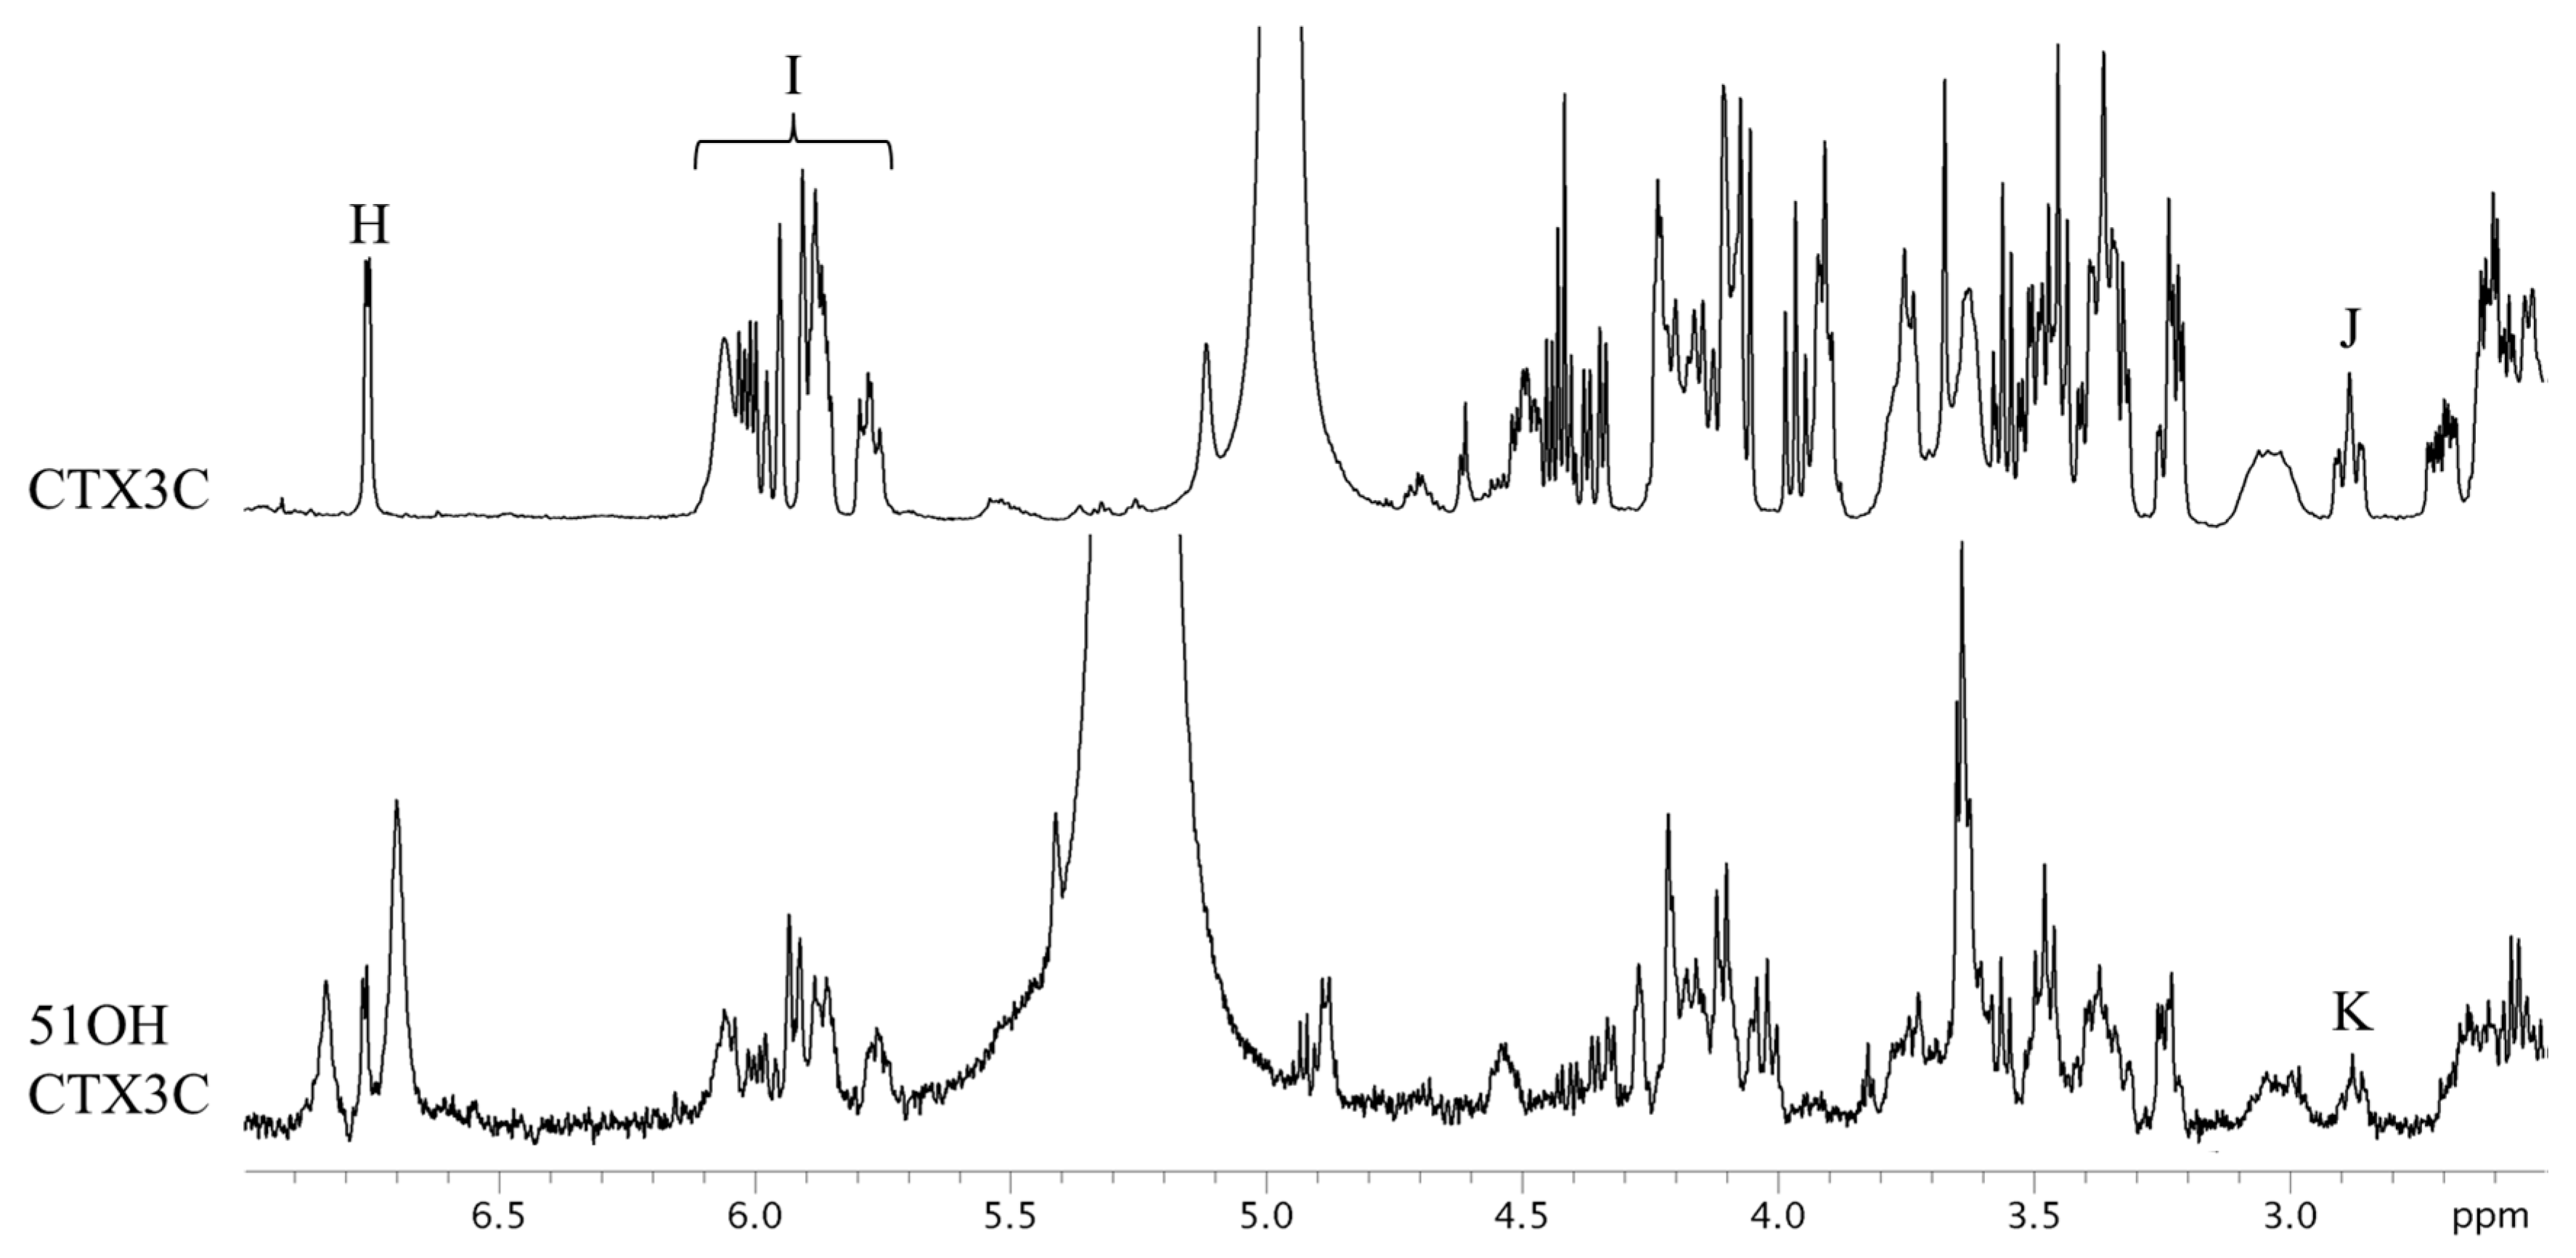
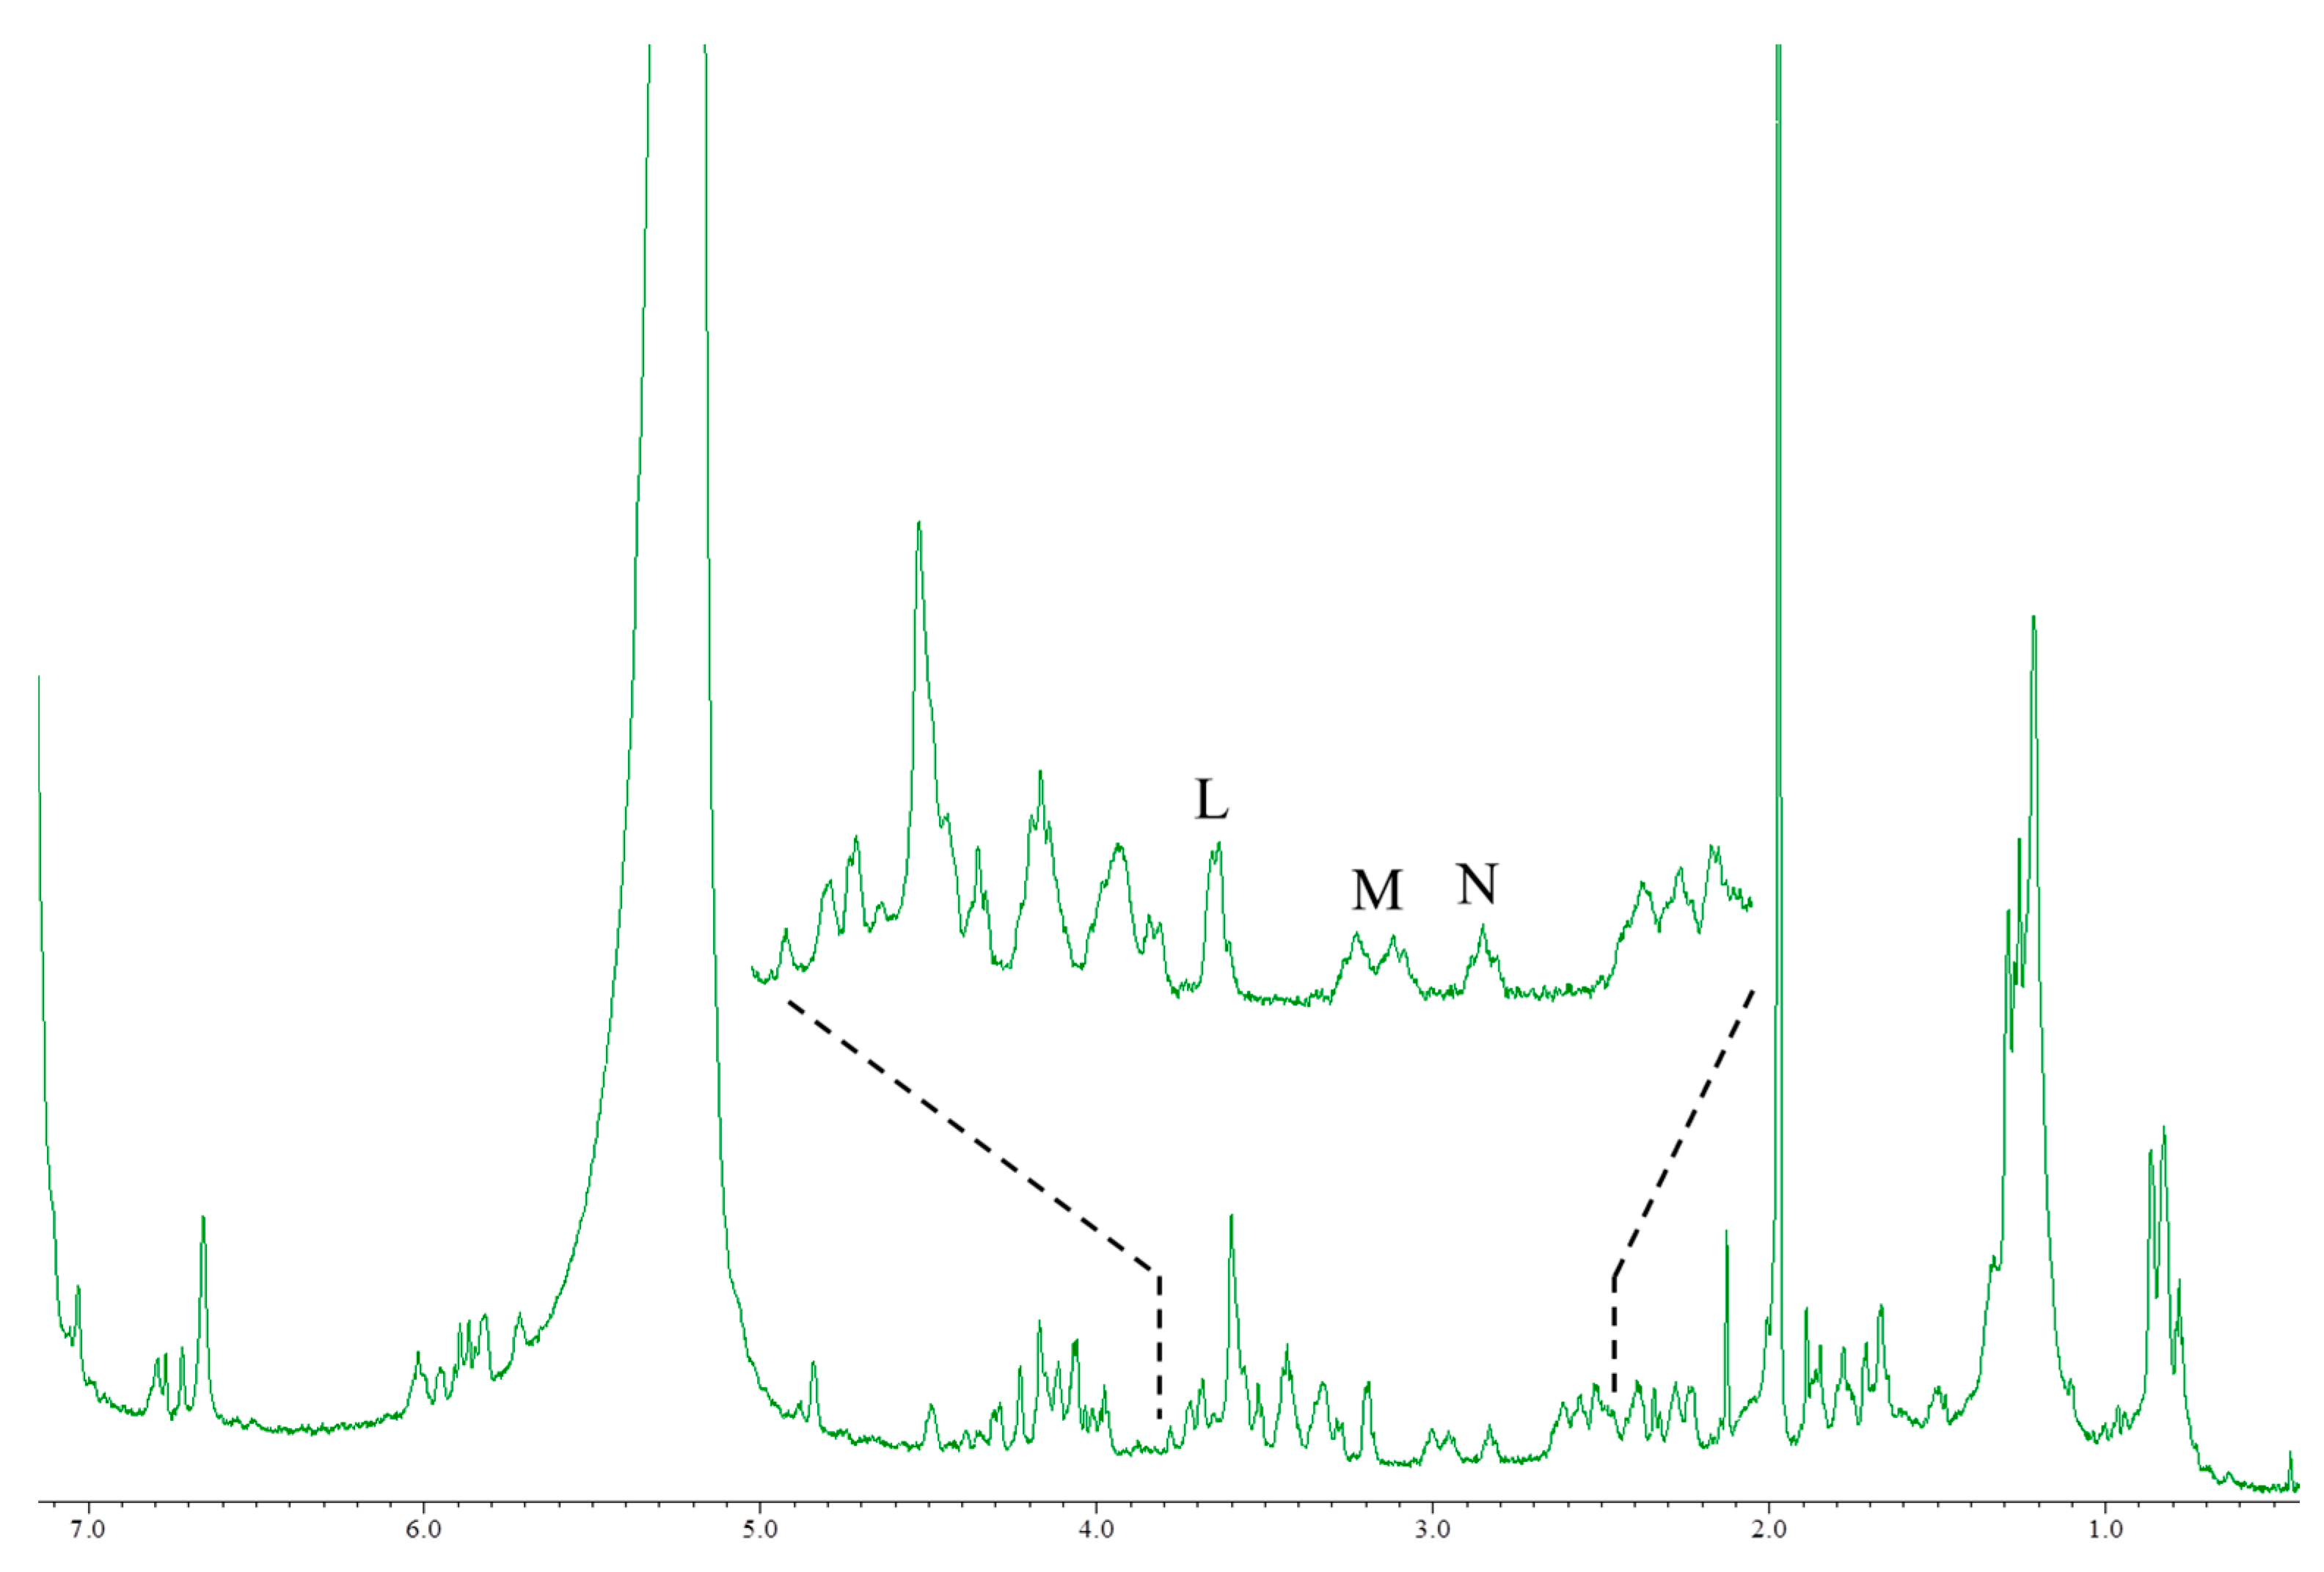
CTX3C and 51OHCTX3C lack the side chain useful for the quantification of the aforementioned CTXs. All the protons were tested for suitability for quantitative determination (Table 2). The CTX3C content was calculated to be 0.41 mg (0.9% RSD) using the signal H (44-OH), as shown in Figure 4. The hydrogen-bond formation of hydroxyl protons gave rise to a wide variety of line shapes. Nevertheless, the signals were narrow and sufficiently strong and produced values more accurate than those obtained from other signals (I and J). Since the 44-OH signal of 51OHCTX3C was observed to have significant overlaps with impurities, the calculation was performed using the methylene proton signals K (H-17) positioned at 2.9 ppm. The amount of 51OHCTX3C was calculated to be 0.013 mg (1.5% RSD), but we concluded that the 500-MHz NMR instrument does not provide enough sensitivity to the small sample of only one-tenth the quantity of CTX1B. Therefore, we carried out measurements using an 800-MHz NMR instrument equipped with a cryogenically-cooled probe. The quantities of 51OHCTX3C could be determined down to 0.011 mg using the amplified signals L (H-38, 42), M (H-22, 25), and N (H-17), as shown in Figure 5.
3. Discussion
Since ciguatera fish poisoning is the largest category of food poisoning of natural etiology, it has stimulated scientists to test and propose various testing methods. The use of anti-toxin antibodies faces problems arising from the abundance of structurally variant congeners. The functional assay based on the specific binding of the toxins to the voltage-dependent sodium channel uses a radio-active ligand, which requires strict regulatory control. The function based cytotoxicity assay provides the highest sensitivity. However, the practical merit of the method awaits future validation on various fish species. The rapid progress in LC/MS analysis promises its potential due to its sensitivity and accuracy. In all analytical methods, including LC/MS, the use of a reliable standard is imperative. Nevertheless, the preparation of CTXs standards is a great challenge for two reasons. First, the availability of CTXs is extremely limited because most CTXs are the metabolites of fish and unavailable in algal cultures. The second problem is related to the technology itself. Containing 82 to 86 protons, CTXs produce congested and partially overlapped NMR signals. Many flexible rings in the structure allow multiple conformers that lead to the broadening of signals. Despite these difficulties, the qNMR method successfully achieved the quantification of CTX1B, epideoxyCTX1B, CTX4A, CTX3C, and 51OHCTX3C by choosing the proper signals. The olefinic protons arising from side chains were preferred to those on the polyether rings to avoid broadened signals, enabling quantification down to 0.06 mg (deoxyCTX1B) with high accuracy. The absence of the side-chain in CTX3C and its analogues made us newly select other protons. After vigorous testing of every signal, we found the signals arising from 44-OH and H-17 to possess the necessary quality for qNMR. The quantity of 51OHCTX3C amounted to only 1/40 of CTX3C, which was too small to produce valid signals on a 500-MHz instrument. The high field 800-MHz NMR instrument equipped with a cryogenically-cooled probe could quantify CTXs down to 0.01 mg. CTXs thus quantified are planned to be used as standards in LC/MS measurements.
After the measurement of the NMR spectra, each CTX reference standard solution was individually prepared by diluting the CTX test solution with methanol. The CTX reference standard solution was dispensed in small aliquots into small glass vials, and the solvent was removed by a drying operation. To prevent the nonspecific adsorption of CTXs onto the glass wall surface, a very small amount of ethanol was added to each vial.
4. Materials and Methods
4.1. Materials
CTX1B, CTX3C, CTX4A, eipdeoxyCTX1B, and C51OHCTX3C used in previous structure-works were used. NMR test tubes with 5 mm outer diameters were purchased from Kusano Science Co. (Tokyo, Japan). Pyridine-d5 (99.8% deuterium content) was obtained from Merck KGaA (Darmstadt, Germany), and the CRM,1,4-bis(trimethylsilyl)benzene-d4 (1,4-BTMSB-d4, purity 99.8%, expanded uncertainty was 0.5%, k = 2), was from Wako Pure Chemical Industries, Ltd. (Osaka, Japan).
4.2. Apparatus
The experimental set up was composed of a semi-micro balance (AG285 or MS205DU, Mettler-Toledo, Greifensee, Switzerland), an ultra-micro balance (MSE2.7S, Sartorius AG, Göttingen, Germany), and an NMR spectrometer equipped with a Varian 5-mm indirect probe (Varian NMR System 500, Varian Technologies, Palo Alto, CA, USA).
4.3. Determination of the Residual Proton Content in Pyridine-d5
Accurately weighed 1,4-BTMSB-d4 CRM (1.0197–1.5668 mg) was mixed with pyridine-d5 (0.77421–0.80378 g) to afford test solutions of 1,4-BTMSB-d4 CRM (N = 5). The accurate quantity of pyridine-d5 was pre-determined by weighing the ampule before and after taking out pyridine-d5. The residual protons of pyridine-d5 were quantified by comparing the signal intensity with that of CRM.
4.4. Preparation of Test Solutions of CTX
CTX1B was dissolved in an ampule of pyridine-d5 to afford test solutions of CTX1B. The accurate amount of pyridine-d5 (0.79830 g) used for the test solution was determined by weighing with a semi-micro balance. The other CTXs were dissolved in 1 mL of pyridine-d5 to afford test solutions of CTX. The accurate amount of pyridine-d5 (1.04616–1.05397 g) used for each test solution was determined by weighing with a semi-micro balance. A 600 µL portion of the test solution was transferred into a NMR test tube for the measurement of the 1H-NMR spectrum.
4.5. 1H-NMR Measurements
The relaxation delay was set at six times the longest relaxation time (T1) of the pyridine signals to recover over 99% of z-magnetization [7]; T1 was pre-determined by an inversion-recovery test. The following settings were used for the qNMR experiments: irradiation frequency, 499.87 MHz; acquisition time, 4 s; relaxation delay, 60 s; probe temperature, 5 or 25 °C; spectral width, 40 ppm; FID data points, 161,290; number of scans, eight to 2560; spinning, off; dummy scans, two times; 13C decoupling, MPF8; pulse angle, 90°; pulse width, 10.4 µs.
4.6. Data Processing
The data was processed with VnmrJ software ver. 2.3, supplied by the manufacturer (Varian Technologies, Palo Alto, CA, USA). Fourier transformation was performed on 262,144 data points without using window functions. All proton chemical shifts were referenced to a residual proton signal at positions 2 and 6 in pyridine-d5 at 8.765 ppm. The phase of all spectra was collected manually while observing a spectral line shape. The baseline of spectra was adjusted horizontality, and each signal area ratio was calculated by software functions. An integration range was individually optimized based on the line width of the signals and the space between the signals. The spectra were integrated using the spectral bucketing technique with 0.002-ppm-sized buckets [11]. The area ratio of each signal was calculated by adding all buckets larger than the buckets arising from the baseline (noise level; Figure 6).
4.7. Calculation of CTXs Content
The quantity of CTXs was calculated by 1H-NMR experiments using the residual proton signal of pyridine-d5 as the internal standard, based on the following Equation (2):
where ValueA is the quantity of CTX (weight); IA is the area ratio of each individual signal arising from CTX; IIS is the area ratio of the residual proton of pyridine-d5; NIS is the number of protons of the residual proton of pyridine-d5; NA is the number of protons of CTX; MA is the mole weight of CTX; MIS is the mole weight of the residual proton of pyridine-d5; WIS is the weight of pyridine-d5; and QIS is the quantity of the residual proton of pyridine-d5.
5. Conclusions
Five ciguatoxins represented in fish from the Pacific were quantified by 1H-NMR to be used in a quantitative analysis of ciguateric fish by LC/MS. Pyridine-d5 with predetermined residual protons was used to prepare test solutions and to exploit the residual protons as the inner standard. The following protons were selected for quantitation: CTX1B and epideoxyCTX1B, the olefinic protons on the side-chain; CTX3C, the 44-OH proton and all olefinic protons; 51OHCTX3C, 17-CH, 22-CH, 25-CH, 38-CH, and 42-CH; CTX4A, the olefinic protons of the side-chain and 47-OH. Quantification was possible with samples ranging from 0.01 to 0.4 mg. The conventional use of non-volatile reference material was avoided by the use of residual protons in the solvent of the test solution.
The CTXs’ reference standard was dispensed in small aliquots into small glass vials, and the solvent was removed by a drying operation. To prevent the nonspecific adsorption of CTXs onto the glass wall surface, a very small amount of ethanol was added to each vial.
Acknowledgments
Naoki Sugimoto of the National Institute of Health Sciences kindly allowed us to use the 800-MHz NMR instrument equipped with a cryogenically-cooled probe for the measurement of 51OHCTX3C. His colleague, Kyoko Ishizuki, and Hiroaki Utsumi of JEOL RESONANCE Inc., helped us obtain the NMR spectra used for the quantification of 51OHCTX3C. We deeply thank everyone for their cooperation. The isolation and purification of the toxins were assisted by many colleagues and students, while one of the authors, T.Y., was in Tohoku University. Special thanks go to R. Bagnis and A.-M. Legrand of the Institute Louis Malarde, French Polynesia, for their collaboration in toxin purification.
Author Contributions
T.K. and T.Y. conceived and designed the experiments; T.Y. prepared all toxins; T.K. performed the measurements and data analysis; T.K. and T.Y. wrote the paper.
Conflict of interest
The authors declare no conflicts of interest.
References
- Yasumoto, T. The chemistry and biological function of natural marine toxins. Chem. Rec. 2001, 1, 228–242. [Google Scholar] [CrossRef] [PubMed]
- Yasumoto, T. Chemistry, etiology, and food chain dynamics of marine toxins. Proc. Jpn. Acad. Ser. B 2005, 81, 43–51. [Google Scholar] [CrossRef]
- Yasumoto, T.; Inoue, A.; Bagnis, R.; Garcon, M. Ecological survey on a dinoflagellate possibly responsible for the induction of ciguatera. Bull. Jpn. Soc. Sci. Fish. 1979, 45, 395–399. [Google Scholar] [CrossRef]
- Yogi, K.; Oshiro, N.; Inafuku, Y.; Hirama, M.; Yasumoto, T. Detailed LC-MS/MS analysis of ciguatoxins revealing distinct regional and species characteristics in fish and causative alga from the Pacific. Anal. Chem. 2011, 83, 8886–8891. [Google Scholar] [CrossRef] [PubMed]
- Ikehara, T.; Kuniyoshi, K.; Oshiro, N.; Yasumoto, T. Biooxidation of ciguatoxins leads to species-specific toxin profiles. Toxins 2017, 9, 205. [Google Scholar] [CrossRef] [PubMed]
- U.S. Food and Drug Administration. Fish and Fishery Products Hazards and Control Guidance, 4th ed. Available online: http://www:fda.gov/food/guidanceregulation/guidancedocumentsregulatoryinformation/seafood/ucm2018426.htm (accessed on 15 January 2014).
- Saito, T.; Nakaie, S.; Kinoshita, M.; Ihara, T.; Kinugasa, S.; Nomura, A.; Maeda, T. Practical guide for accurate quantitative solution state NMR analysis. Metrologia 2004, 41, 213–218. [Google Scholar] [CrossRef]
- Saito, T.; Ihara, T.; Koike, M.; Kinugasa, S.; Fujimine, Y.; Nose, K.; Hirai, T. A new traceability scheme for the development of international system-traceable persistent organic pollutant reference materials by quantitative nuclear magnetic resonance. Accred. Qual. Assur. 2009, 14, 79–86. [Google Scholar] [CrossRef]
- Murata, M.; Legrand, A.M.; Ishibashi, Y.; Fukui, M.; Yasumoto, T. Structures and configurations of ciguatoxin from the moray eel Gymnothorax javanicus and its likely precursor from the dinoflagellate Gambierdiscus toxicus. J. Am. Chem. Soc. 1990, 112, 4380–4386. [Google Scholar] [CrossRef]
- Satake, M.; Murata, M.; Yasumoto, T. The structure of CTX3C, a ciguatoxin congener isolated from cultured Gambierdiscus toxicus. Tetrahedron Lett. 1993, 34, 1975–1978. [Google Scholar] [CrossRef]
- Kato, T.; Saito, M.; Nagae, M.; Fujita, K.; Watai, M.; Igarashi, T.; Yasumoto, T.; Inagaki, M. Absolute quantification of lipophilic shellfish toxins by quantitative nuclear magnetic resonance using removable internal reference substance with SI traceability. Anal. Sci. 2016, 32, 729–734. [Google Scholar] [CrossRef] [PubMed]
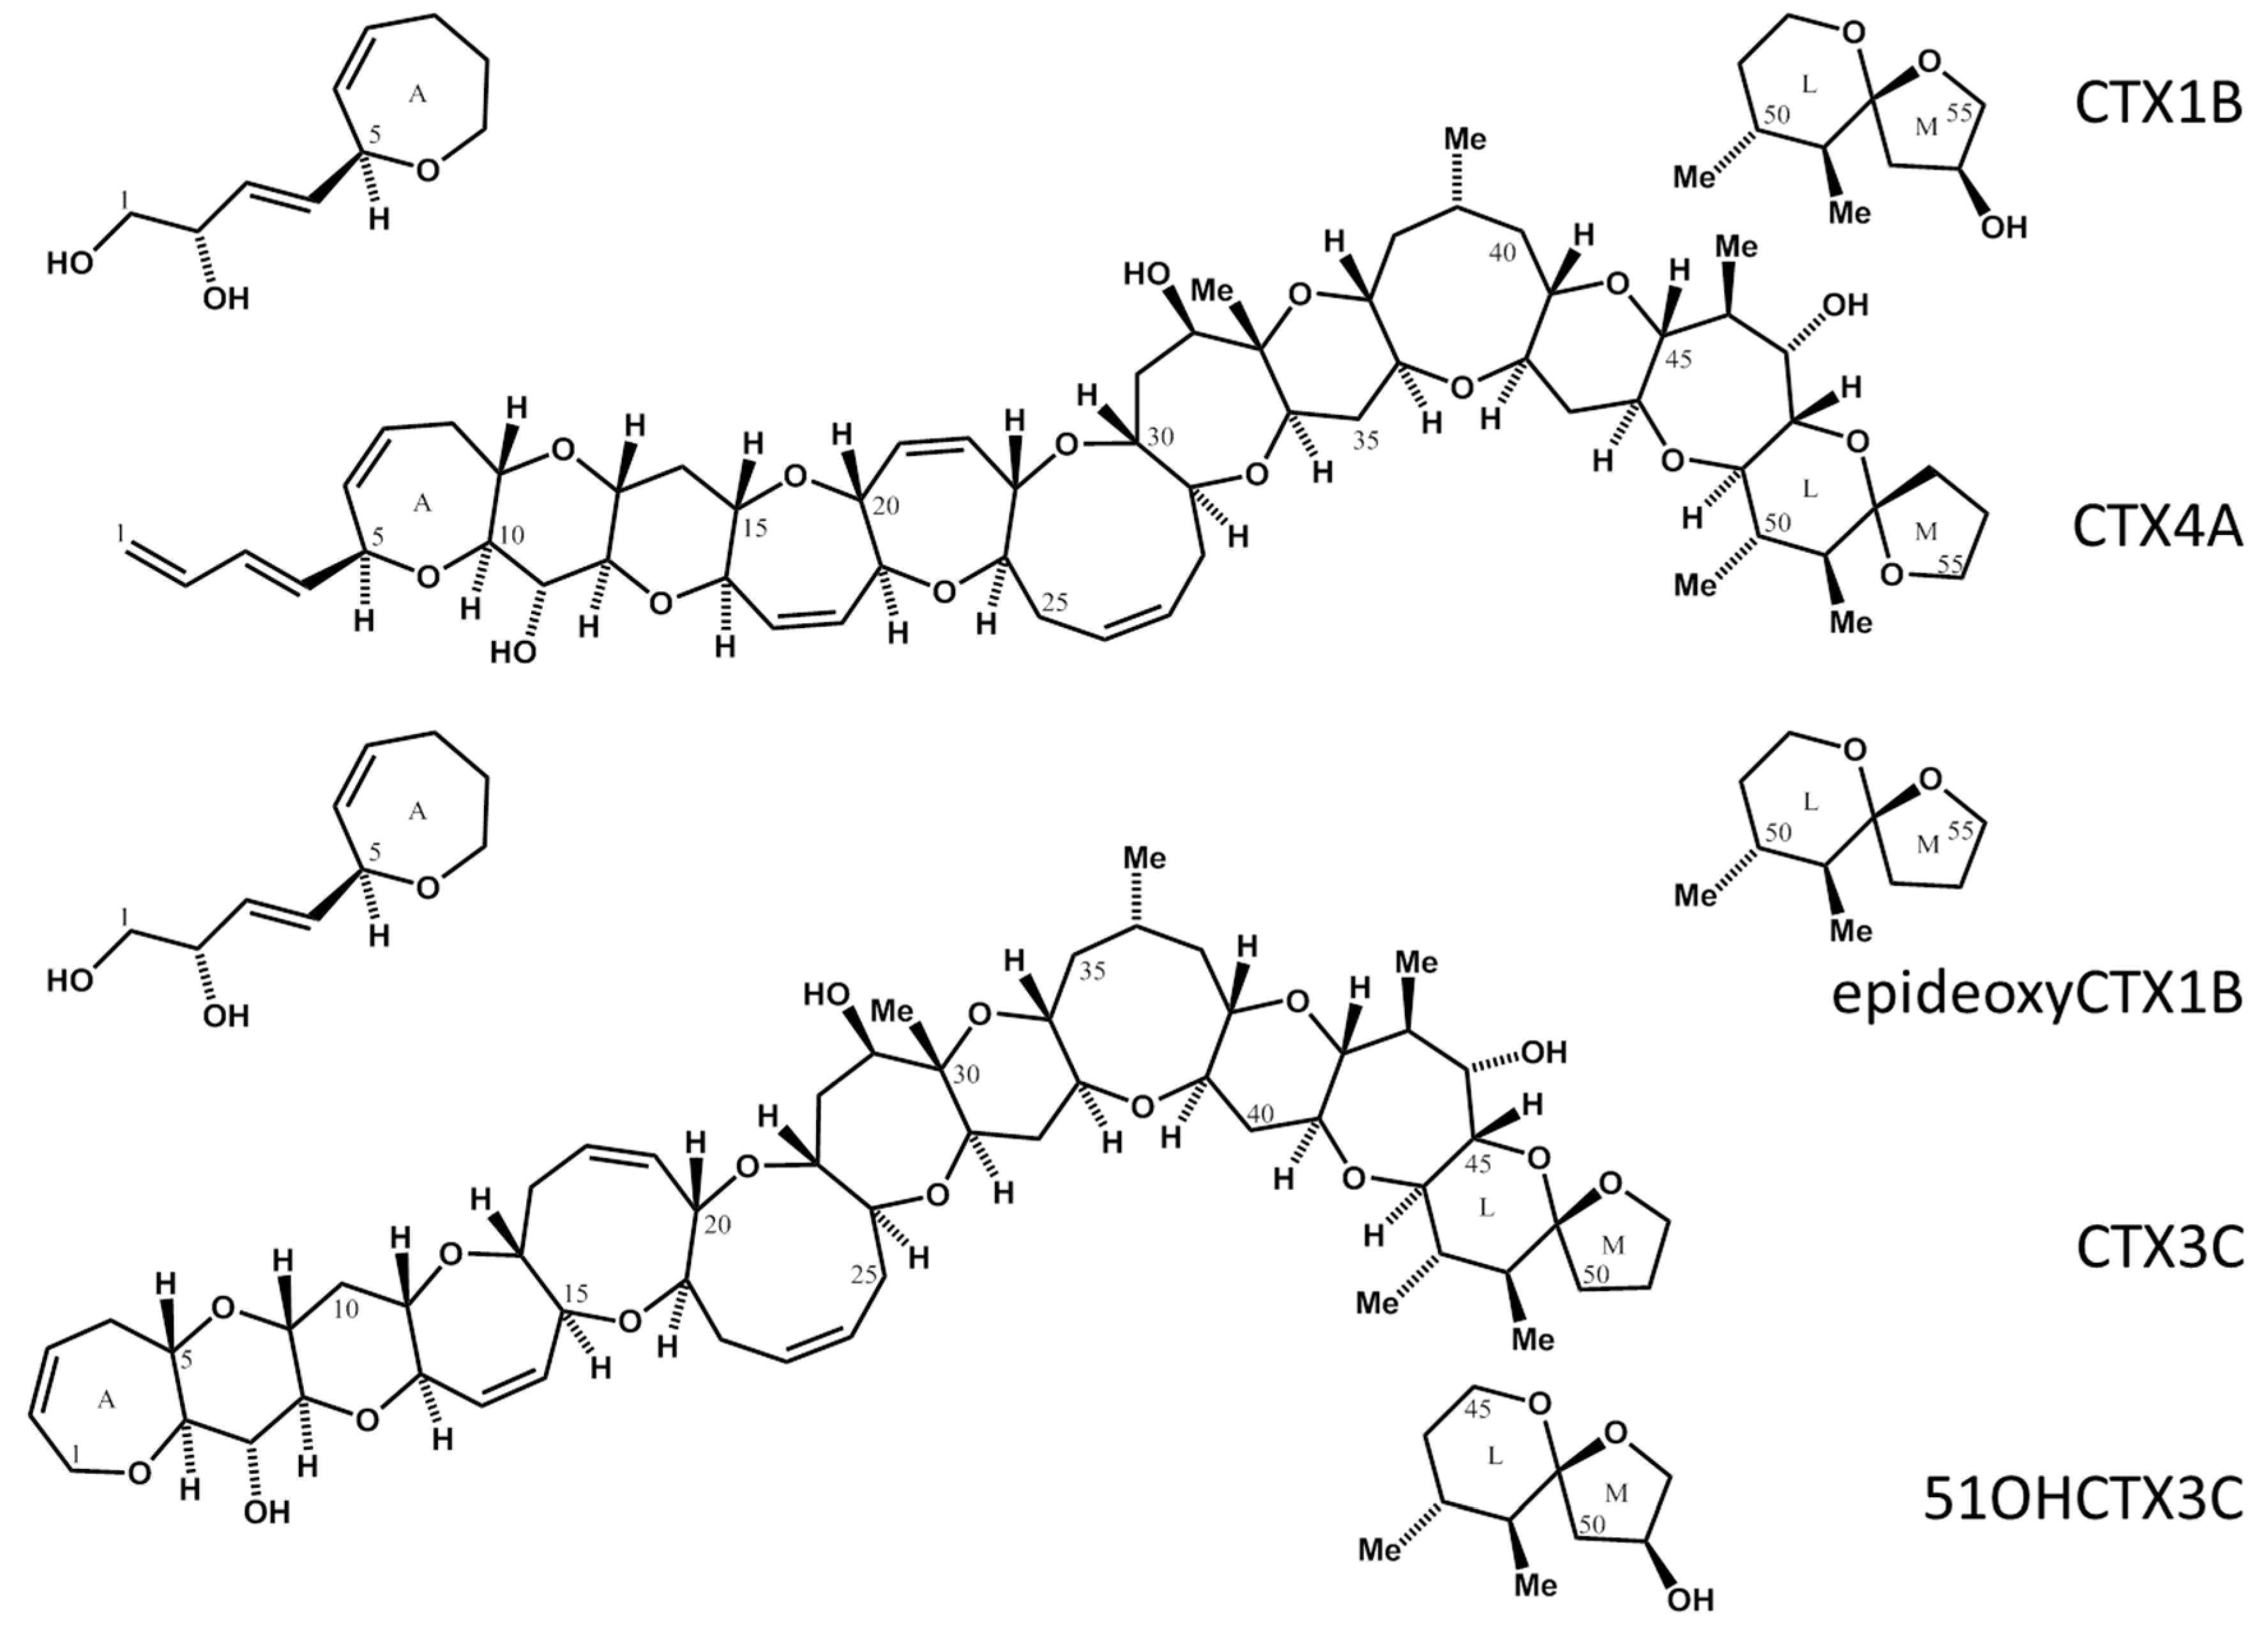
Figure 1.
Structure of CTXs. CTX1B, Chemical Formula: C60H86O19, Molecular Weight: 1111.31; deoxyCTX1B, Chemical Formula: C60H86O18, Molecular Weight: 1095.31; CTX3C, Chemical Formula: C57H82O16, Molecular Weight: 1023.25; 51OHCTX3C, Chemical Formula: C57H82O17, Molecular Weight: 1039.25; CTX4A, Chemical Formula: C60H84O16, Molecular Weight: 1061.2994.

Figure 2.
Scheme for the indirect determination of CTX and for keeping the traceability to International System of Units (SI) using qNMR by employing volatile substances as the internal standard. The upper spectrum exhibits the residual proton signals of pyridine-d5, and an internal standard signal of 1,4-BTMSB-d4. The lower spectrum exhibits signals of CTX and an internal standard signal of residual proton. The signal intensity of the residual proton contained in the CTXs/pyridine-d5 solution was approximately 30 when the signal of 1,4-BTMSB-d4 was taken as 100.
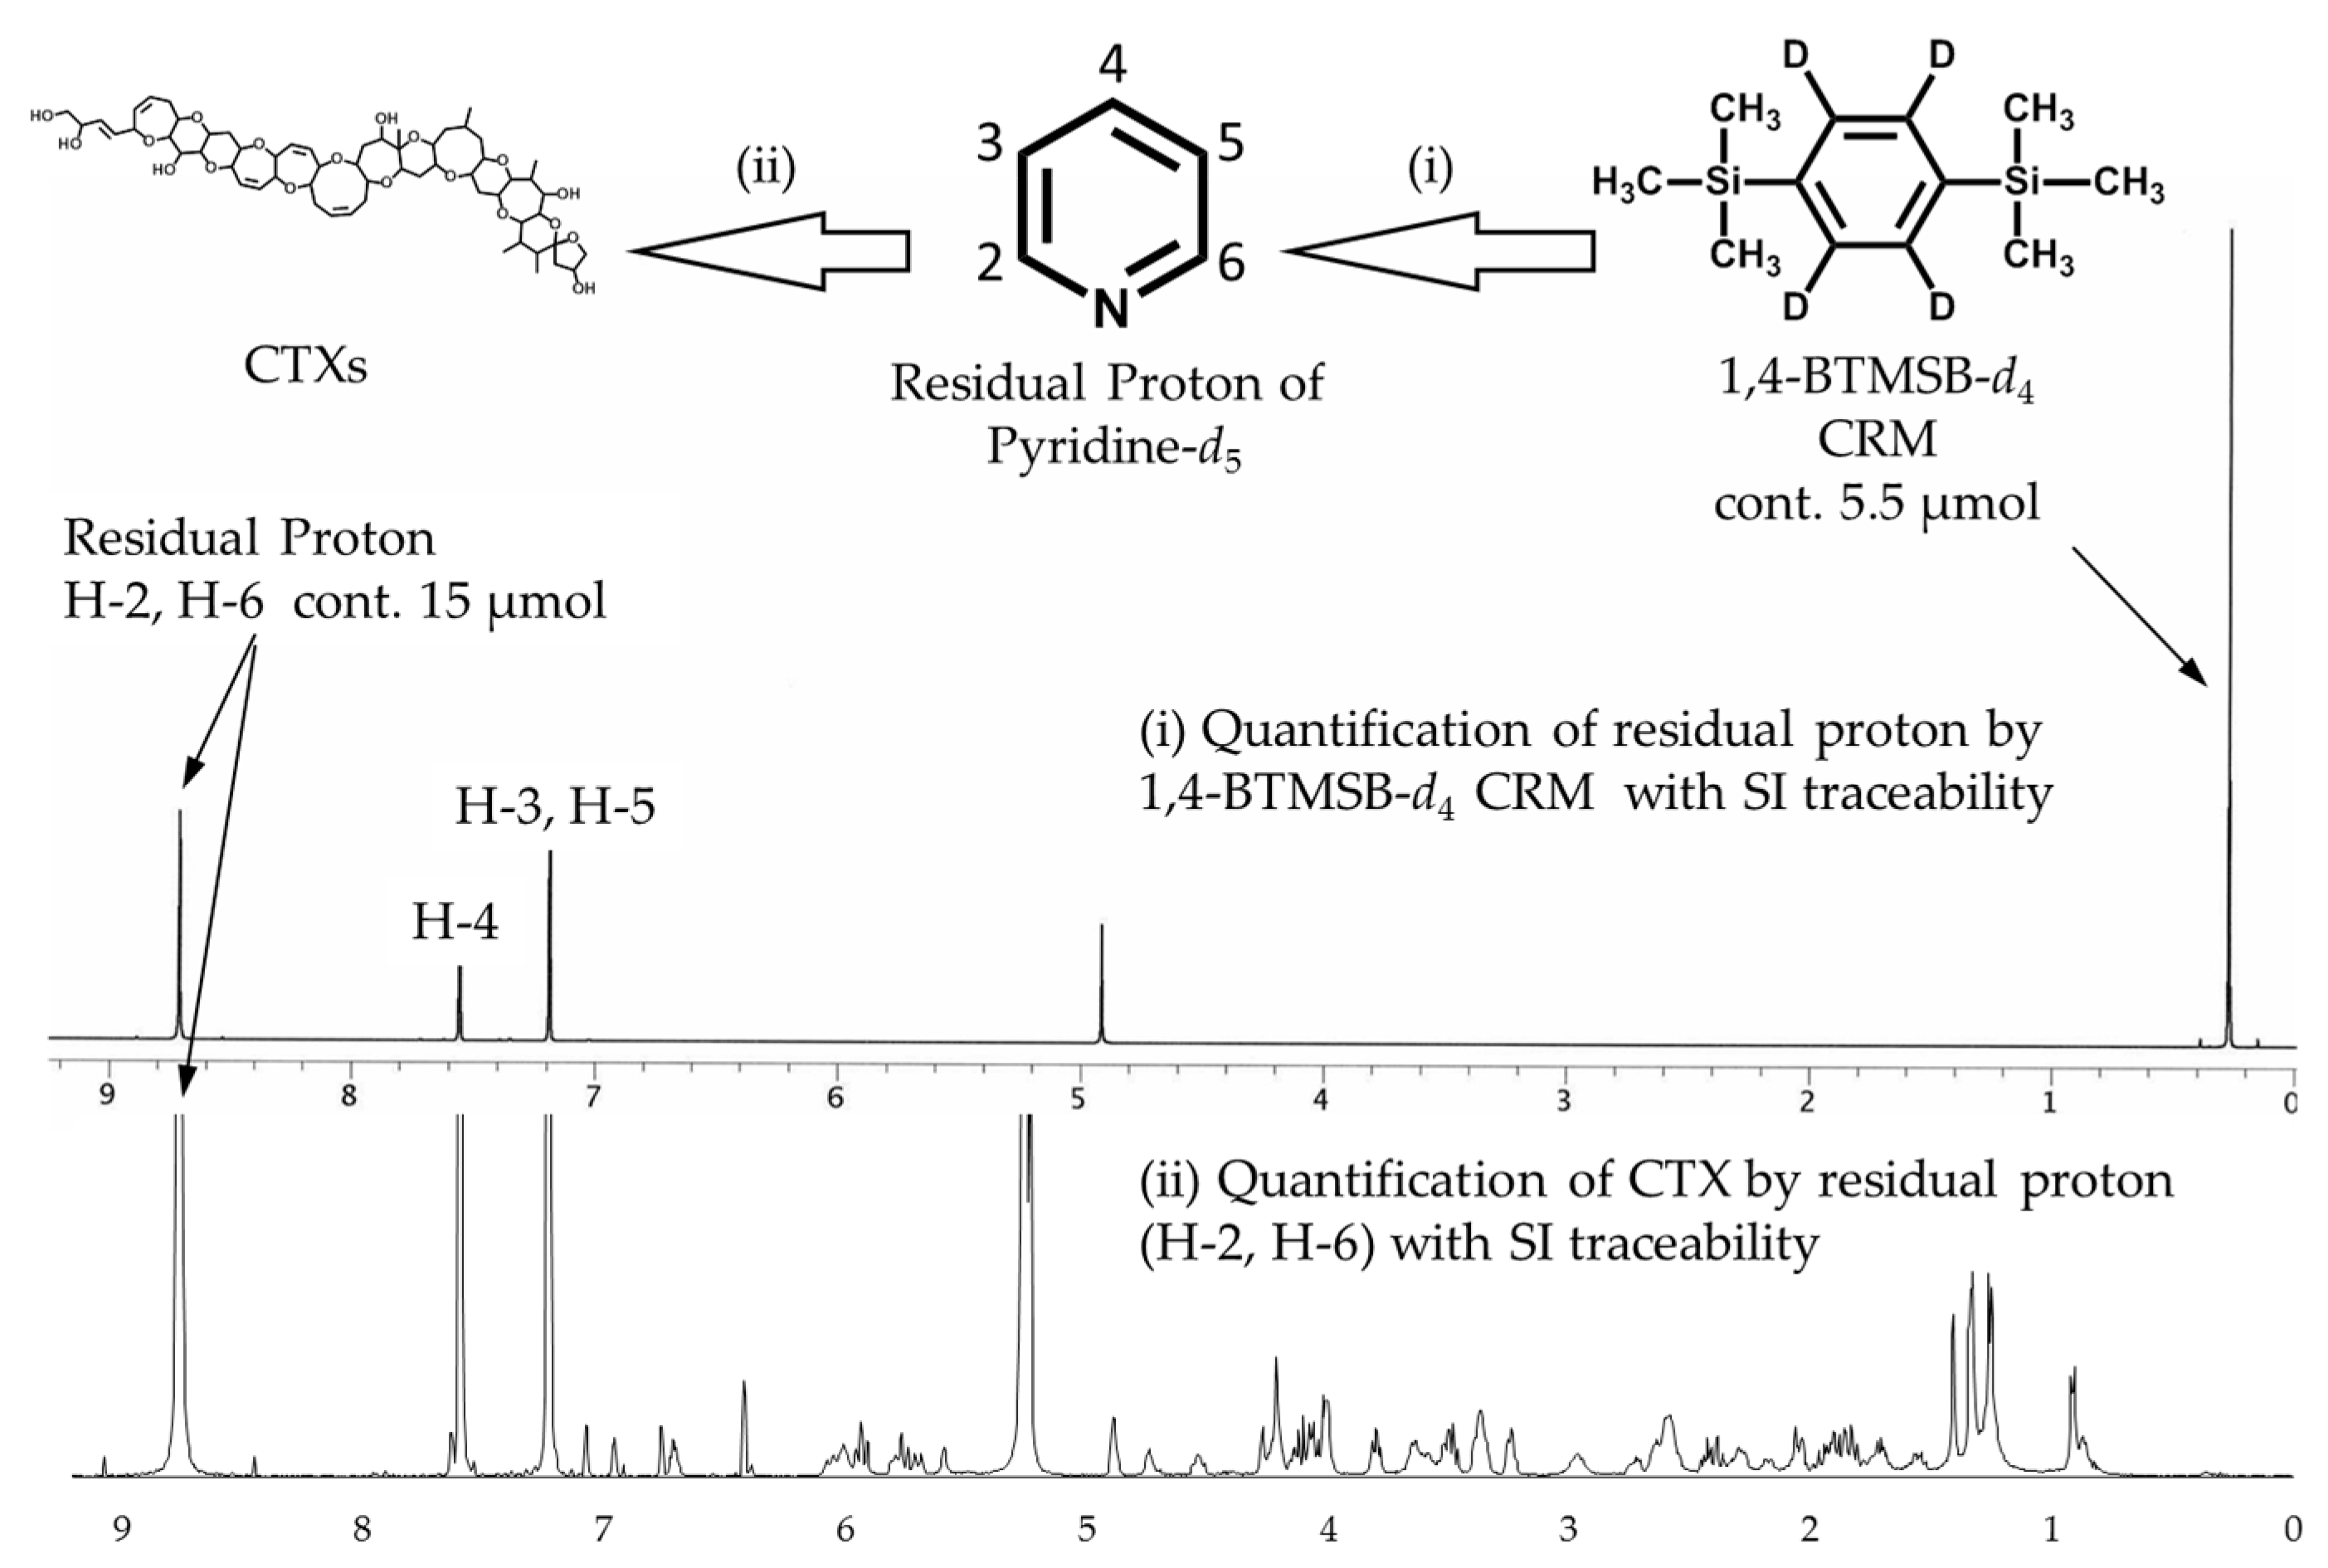
Figure 3.
The 1H-NMR spectra of CTX1B, epideoxyCTX1B, and CTX4A. The parameters and conditions for the measurements are set as follows: CTX1B, instrument; Varian NMR System 500; data point, 65,536; pre scans, two times; number of scans, 512 times; relaxation delay, 60 s; temperature, 5 °C; acquisition time, 4 s. For epideoxyCTX1B; instrument, Varian NMR System 500; data point, 65,536; pre scans, two times; number of scans, 2048 times; relaxation delay, 60 s; temperature, 5 °C; acquisition time, 4 s. For CTX4A; instrument, Varian NMR System 500; data point, 65,536; pre scans, two times; number of scans, 3072 times; relaxation delay, 60 s; temperature, 5 °C; acquisition time, 4 s.

Figure 4.
The 1H-NMR spectra of CTX3C and 51OHCTX3C. The parameters and conditions for the measurements are given below. CTX3C: Instrument, Varian NMR System 500; data point, 65,536; pre scans, two times; number of scans, 512 times; Relaxation delay, 60 s; temperature, 25 °C; Acquisition time, 4 s. 51OHCTX3C: Instrument, Varian NMR System 500; data point, 65,536; pre scans, two times; number of scans, 1280 times; Relaxation delay, 60 s; temperature, 5 °C; Acquisition time, 4 s.

Figure 5.
The 1H-NMR spectrum of 51OHCTX3C using high magnetic field NMR. Instrument, JNM-ECA800 with cryogenically cooled probe (Jeol Ltd., Tokyo, Japan); irradiation frequency, 800.14 MHz; data point, 65,536; pre scans, 32 times; number of scans, 512 times; Relaxation delay, 56.7 s; temperature, 5 °C; Acquisition time, 3.3 s.

Figure 6.
Signal integration using the spectral bucketing technique. All spectra were integrated as 0.002-ppm-sized buckets. The area ratio of each signal was calculated by adding all buckets larger than the buckets arising from the baseline. Baseline correction of all spectra was performed by using a software function before performing the integration processing. The area ratio of the baseline bucket is desirably close to zero after software baseline correction. If the baseline bucket had a relatively large area ratio, a correction was made by subtracting the area from all buckets to serve as a more precise baseline correction.


Table 1.
The quantities of CTX1B, deoxyCTX1B, and CTX4A.
| Compounds | Signals | Assign of Signals | S/N | Signal Intensity | Quantitative Value (mg) |
|---|---|---|---|---|---|
| CTX1B | A | Hydroxyl group 2 | 28 | - | 0.1374 ± 0.0012 |
| B | Olefin 3, 4 | 68 | 0.25 | 0.1381 ± 0.0003 | |
| deoxyCTX1B | C | Hydroxyl group 2 | 11 | - | 0.0590 ± 0.0017 |
| D | Olefin 3, 4 | 48 | 0.11 | 0.0586 ± 0.0003 | |
| CTX4A | E | Hydroxyl group 47 | 14 | - | 0.0832 ± 0.0007 |
| F | 1,3-diene 3 | 20 | 0.075 | 0.0794 ± 0.0018 | |
| G | 1,3-diene 2 | 20 | - | 0.0743 ± 0.0017 |
The quantitative values were calculated using signals A to G in Figure 3. The signal intensity was expressed as a signal of 1,4-BTMSB-d4 as 100. Signals B of CTX1B, D of deoxyCTX1B, and F and G of CTX4A were used for the final quantification.
Table 2.
The quantities of CTX3C and 51OHCTX3C.
| Compounds | Signals | Assign of Signals | S/N | Signal Intensity | Quantitative Value (mg) |
|---|---|---|---|---|---|
| CTX3C | H | Hydroxyl group 44 | 81 | 0.40 | 0.4060 ± 0.0038 |
| I | Olefin 2, 3, 13, 14, 18, 19, 23, 24 | - | - | 0.4408 ± 0.0018 | |
| J | 17-H | 37 | - | 0.4243 ± 0.0067 | |
| 51OHCTX3C | K | 17-H | <10 | 0.013 | 0.0134 ± 0.0002 |
| L | 38, 42-H | 25 | - | 0.01089 | |
| M | 22, 25-H | 10 | - | 0.01230 | |
| N | 17-H | 10 | - | 0.01085 |
© 2017 by the authors. Licensee MDPI, Basel, Switzerland. This article is an open access article distributed under the terms and conditions of the Creative Commons Attribution (CC BY) license (http://creativecommons.org/licenses/by/4.0/).
Share and Cite
MDPI and ACS Style
Kato, T.; Yasumoto, T. Quantification of Representative Ciguatoxins in the Pacific Using Quantitative Nuclear Magnetic Resonance Spectroscopy. Mar. Drugs 2017, 15, 309. https://doi.org/10.3390/md15100309
AMA Style
Kato T, Yasumoto T. Quantification of Representative Ciguatoxins in the Pacific Using Quantitative Nuclear Magnetic Resonance Spectroscopy. Marine Drugs. 2017; 15(10):309. https://doi.org/10.3390/md15100309
Chicago/Turabian StyleKato, Tsuyoshi, and Takeshi Yasumoto. 2017. "Quantification of Representative Ciguatoxins in the Pacific Using Quantitative Nuclear Magnetic Resonance Spectroscopy" Marine Drugs 15, no. 10: 309. https://doi.org/10.3390/md15100309
Note that from the first issue of 2016, this journal uses article numbers instead of page numbers. See further details here.