Article

Differential Effects of Domoic Acid and E. coli Lipopolysaccharide on Tumor Necrosis Factor-α, Transforming Growth Factor-β1 and Matrix Metalloproteinase-9 Release by Rat Neonatal Microglia: Evaluation of the Direct Activation Hypothesis

1
Department of Pharmacology, Chicago College of Osteopathic Medicine, Midwestern University, 555 31st Street, Downers Grove, Illinois 60515, USA
2
Department of Pharmacology, Chicago College of Osteopathic Medicine, Midwestern University, 555 31st Street, Downers Grove, Illinois 60515, USA
3
Department of Pharmacology, Chicago College of Osteopathic Medicine, Midwestern University, 555 31st Street, Downers Grove, Illinois 60515, USA
4
Department of Pharmacology, Chicago College of Osteopathic Medicine, Midwestern University, 555 31st Street, Downers Grove, Illinois 60515, USA
5
Department of Pharmacology, Chicago College of Osteopathic Medicine, Midwestern University, 555 31st Street, Downers Grove, Illinois 60515, USA
6
Abbott Laboratories, Abbott Park, Illinois 60064, USA
7
GlaxoSmithKline Pharmaceuticals, Department of Cardiovascular Pharmacology, King of Prussia, Pennsylvania 19406, USA
8
Harbor Branch Oceanographic Institution, Division of Biomedical Marine Research, 5600 US 1 North, Fort Pierce, FL 34946, USA
*
Author to whom correspondence should be addressed.
Mar. Drugs 2007, 5(3), 113-135; https://doi.org/10.3390/md503113
Submission received: 24 August 2007 / Accepted: 20 September 2007 / Published: 24 September 2007
(This article belongs to the Special Issue Marine Toxins)

Abstract

:
The excitatory amino acid domoic acid is the causative agent of amnesic shellfish poisoning in humans. The in vitro effects of domoic acid on rat neonatal brain microglia were compared with E. coli lipopolysaccharide (LPS), a known activator of microglia mediator release over a 4 to 24 hour observation period. LPS [3 ng/mL] but not domoic acid [1mM] stimulated a statistically significant increase in TNF-α mRNA and protein generation. Furthermore, both LPS and domoic acid did not significantly affect TGF-β1 gene expression and protein release. Finally, an in vitro exposure of microglia to LPS resulted in statistically significant MMP-9 expression and release, thus extending and confirming our previous observations. However, in contrast, no statistically significant increase in MMP-9 expression and release was observed after domoic acid treatment. Taken together our observations do not support the hypothesis that a short term (4 to 24 hours) in vitro exposure to domoic acid, at a concentration toxic to neuronal cells, activates rat neonatal microglia and the concomitant release of the pro-inflammatory mediators tumor necrosis factor-α (TNF-α) and matrix metalloproteinases-9 (MMP-9), as well as the anti-inflammatory cytokine transforming growth factor β1 (TGF-β1).

1. Introduction

Cells of hematopoietic origin that migrate into the developing brain during late embryonic, fetal or postnatal stages, have been shown to transform into microglia cells as they populate the brain [1,2]. It is currently thought that microglia are normally quiescent (resting), but that they can become activated in response to the presence of bacteria, viruses or central nervous system injury, upregulating cell surface activation antigens and releasing both pro-inflammatory and anti-inflammatory mediators [3,4].
In vivo as well as in vitro administration of lipopolysaccharide (LPS), a major component of Gram-negative bacteria which binds to the CD14 receptor, has been shown to potently activate adult and neonatal rat microglia (for review see Ref. [4]), resulting in the release of pro- and anti-inflammatory products, which include cytokines like TNF-α [5,6] and TGF-β1 [7,8] as well as the protease MMP-9 [5, 9]. These mediators have been implicated in sublethal and lethal neuronal and glial injury [10] and neuronal degeneration [4,11,12] as well as repair [2,13].
Exposure to the marine toxin domoic acid, an excitotoxic amino acid structurally similar to kainic acid and the neurotransmitter glutamic acid, has been shown to cause amnesic shellfish poisoning in humans, a condition that has led to death in some cases [14]. Currently, the Center for Food Safety and Applied Nutrition, U.S. Food and Drug Administration, includes amnesic shellfish poisoning as one of the “… five recognized fish poisoning syndromes in the United States…”, together with paralytic, neurotoxic, diarrhetic, and ciguatera fish poisoning ( http://www.cfsan.fda.gov/~comm/haccp4f.html) [15]. Behavioral toxicity studies have confirmed that domoic acid is a potent neurotoxin in newborn rats, at doses far lower than in adult animals [16,17,18]. Even though hippocampal pyramidal neurons, mossy fiber terminals [19,20] and astrocytes [21] appear to be targeted in vivo by domoic acid , recently we hypothesized that brain microglia may be involved in the neurotoxicity to domoic acid [22].
The possibility that domoic acid might activate neonatal microglia, both in vitro and in vivo, was suggested by the observation that kainic acid, a domoic acid and glutamate analog that upregulated the microglia scavenger receptor mRNA [23], induced tissue plasminogen activator release [24]. The activation of the ionotropic AMPA glutamate GluR4 subunit, which is expressed by activated microglia following transient forebrain ischemia in vivo [25], has been proposed as a possible explanation for these observations. Thus, because the GluR4 subunit of the AMPA glutamate receptor has affinity for domoic acid [26], and we have observed its presence on microglia [27], we hypothesized that domoic acid might activate neonatal microglia in vitro [22].
The purpose of this investigation was to continue the study of our working hypothesis [22], by extending the in vitro exposure of microglia to domoic acid [1mM], a concentration toxic to neuronal cells [27], and determining if it would activate microglia and affect both gene expression and release of pro- and anti-inflammatory microglia products TNF-α [5,6], MMP-9 [5,9], and TGF-β1 [7,8], in a time-dependent manner. Our present study provides experimental evidence that in contrast to LPS [3-10ng/mL] in vitro, which we have shown stimulates TNF-α and MMP-9 release from microglia [5,27], a 4 to 24 hour in vitro exposure to domoic acid [1mM] does not appear to activate neonatal rat microglia and the concomitant expression and release of pro- and anti-inflammatory mediators TNF-α, MMP-9, and TGF-β1.

2. Results and Discussion

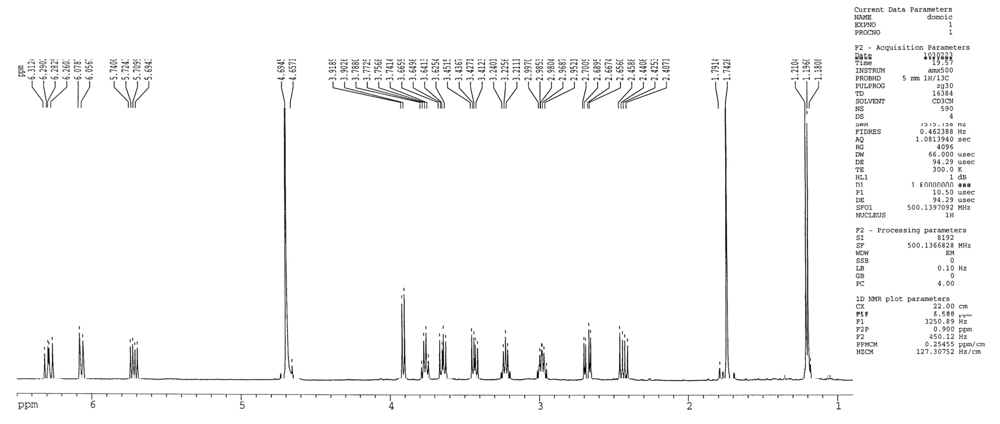
2.1 Determination of domoic acid by nuclear magnetic resonance

As described in Experimental, the stability of the stock solution of domoic acid (12.5 mM) used in the experiments was determined by nuclear magnetic resonance (NMR).
As shown in Figure 1, the proton NMR spectrum of the sample was consistent with the expected NMR pattern for a pure sample of domoic acid. The proton NMR spectrum showed a methyl doublet at 1.19 ppm, an olefinic methyl singlet at 1.74 ppm, three olefinic signals corresponding to the 1,1,4-trisubstituted butadiene system at 6.29 (dd), 6.06 (d) and 5.71 (dd) ppm, four methine signals at 3.91 (d), 3.76 (ddd), 3.22 (dq) and 2.98 (m) ppm, and four signals for two methylene groups at 3.64 (dd), 3.43 (dd), 2.67 (dd) and 2.43 (dd) ppm. The spectrum did not show other additional signals corresponding to any domoic acid degradation compounds. These data confirmed the presence of pure domoic acid in the sample which was analyzed and which was used in the experiments described herein.

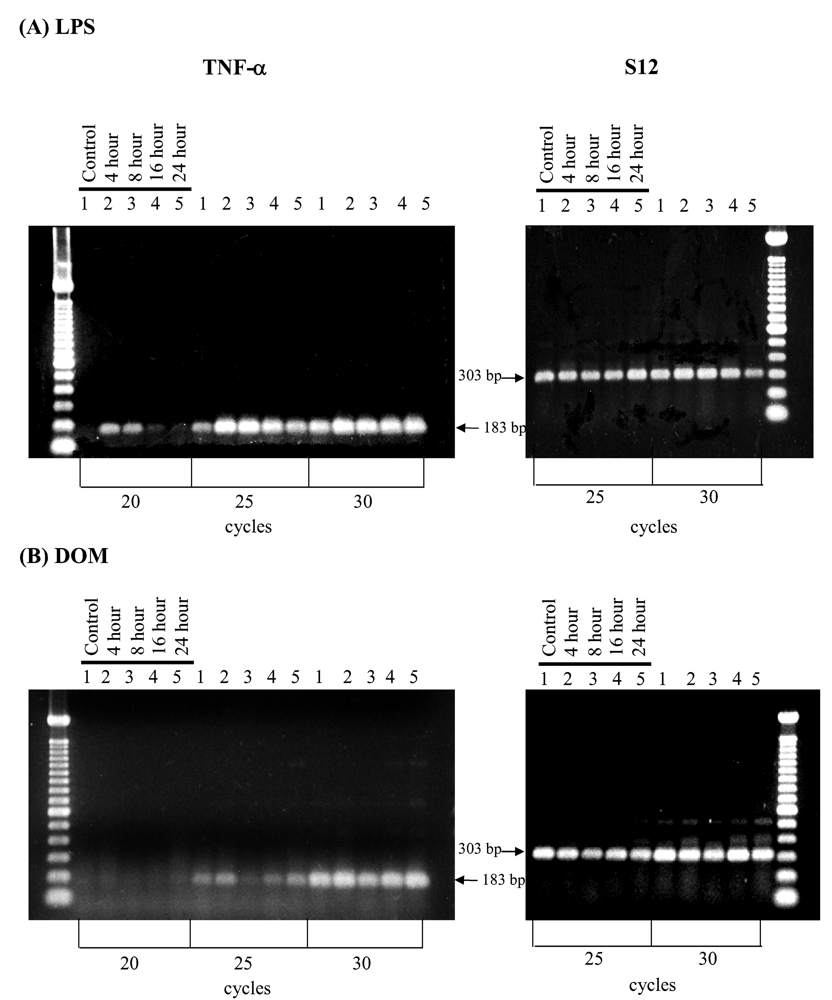
2.2 Effect of LPS and domoic acid on TNF-α mRNA expression by rat neonatal microglia

We have previously reported that in vitro stimulation of microglia with LPS [10ng/mL] will result in TNF-α mRNA expression [27]. As shown in Figure 2A, while untreated (control) microglia did not express TNF-α, stimulation with LPS [3 ng/ml] resulted in a time-dependent increase in TNF-α mRNA expression relative to controls as determined by semi-quantitative RT-PCR within the linear range of amplification (25 cycles) after 4 hours. In contrast, as shown in Figure 2B, domoic acid [1mM] induced only minor changes in TNF-α mRNA expression at the 4 hour time point.
Furthermore, as shown in Figure 3, LPS [3 ng/mL] induced statistically significant levels of TNF-α expression: 1.77±0.3 and 1.78±0.2 fold increase relative to controls by 4 and 8 hours, respectively, P< 0.05, and then a progressive decline to 1.54±0.14 and 1.27±0.18 fold increase relative to controls by 16 and 24 hours, respectively, P>0.05. Noteworthy was the observation that TNF-α expression at 4 hours was lower than that we reported with LPS [10 ng/mL] previously [27]. In contrast, as shown in Figure 3, domoic acid [1mM] induced only minor non-statistically significant changes in levels of TNF-α expression relative to controls: 1.22±0.1 fold by 4 hours, then a decrease to 0.94±0.02 fold and 1.01±0.05 fold by 8 and 16 hours, respectively, while slightly increasing to 1.37±0.25 fold by 24 hours.

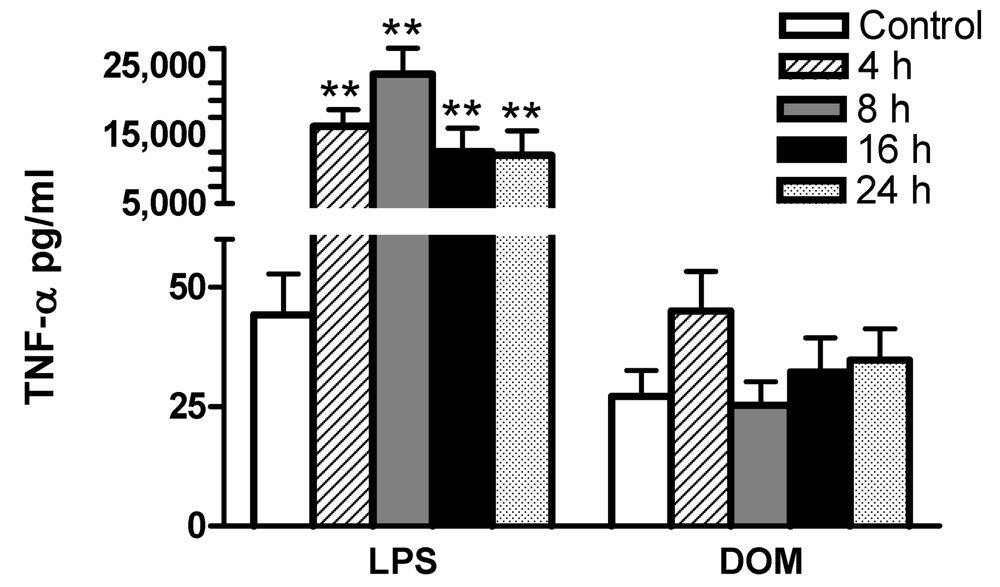
2.3 Effect of LPS and domoic acid on TNF-α release by rat neonatal microglia

We have shown that in vitro stimulation of microglia with LPS will lead to TNF-α generation [5,27]. In order to determine whether a 4 to 24 hour stimulation of microglia with LPS [3 ng/mL] or domoic acid [1mM] leads to TNF-α protein secretion, cell-free media from the same cell culture dishes containing microglia used for TNF-α mRNA analysis shown in Figure 2 and 3, were assayed for TNF-α release with an ultrasensitive rat-specific ELISA (See Experimental). As shown in Figure 4, LPS [3 ng/mL] stimulated statistically significant TNF-α release: at 4, 8, 16 and 24 hours TNF-α levels were 16,242 ± 2,417, 23,792 ± 3739, 12,503 ± 3,446, 12,025±3,517 pg/mL (n=4), respectively, vs. 44.2 ± 8.6 pg/mL (untreated controls, n=9), P < 0.01. In contrast, TNF-α levels in the culture media in domoic acid [1mM]-treated microglia remained unchanged, although a non-statistically significant 66% increase of immunoreactive TNF-α release was observed at 4 hours: 45 ± 8.36 pg/mL (domoic acid-treated, n=6) vs. 27 ± 5.4 pg/mL ( untreated controls, n=9) , P > 0.05. Interestingly, as shown in Figure 2B and Figure 3, 4 hours after domoic acid treatment of microglia, a slightly elevated though non-statistically significant increase in TNF-α mRNA expression was observed.

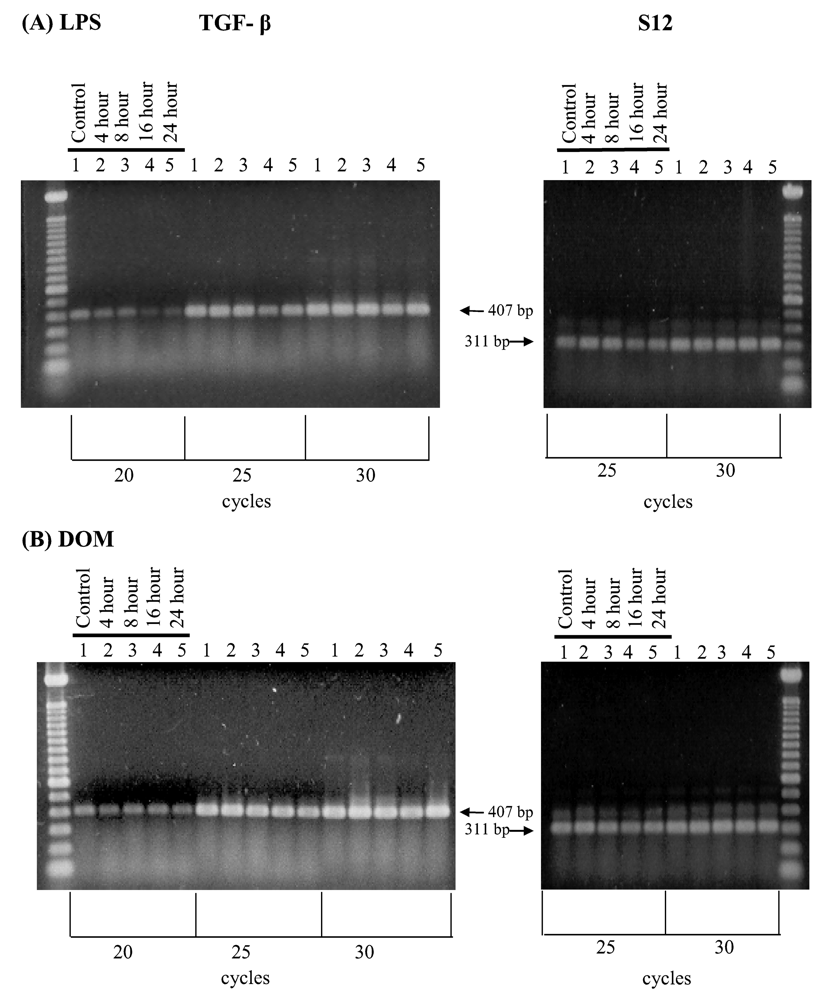
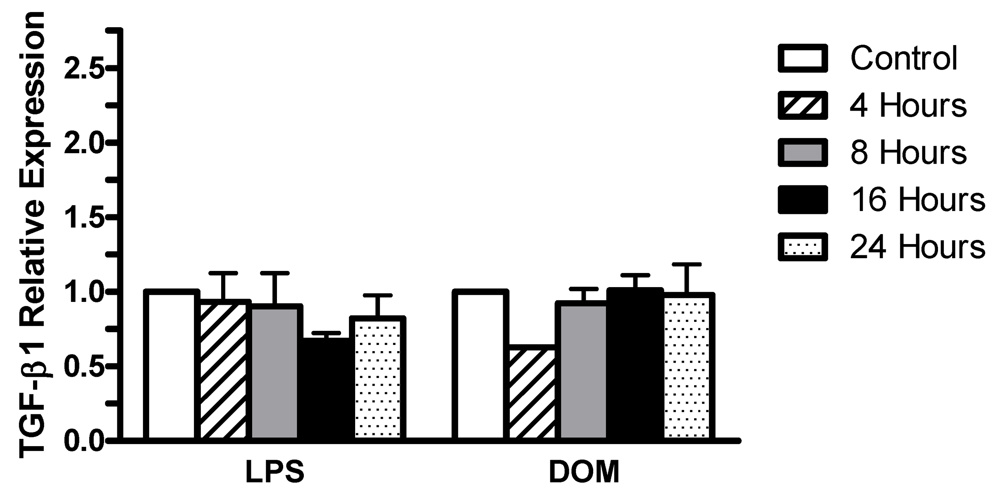
2.4 Effect of LPS and domoic acid on TGF-β1 mRNA expression by rat neonatal microglia

Activation of microglia has been shown to cause the release of the anti-inflammatory cytokine TGF-β1 [7,8]. As shown in Figure 5A, untreated (control) microglia showed constitutive TGF-β1 mRNA expression. Interestingly, stimulation of microglia with LPS [3 ng/ml] resulted in a time-dependent decrease in TGF-β1 mRNA expression relative to controls as determined by semi-quantitative RT-PCR within the linear range of amplification (25 cycles). In contrast, as shown in Figure 5B, domoic acid [1mM] did not appear to affect basal TGF-β1 mRNA expression as determined by semi-quantitative RT-PCR over the linear range of amplification (25 cycles).
Furthermore, as shown in Figure 6, LPS [3 ng/mL] induced non-statistically significant alterations in TGF-β1 expression levels relative to controls which were 0.931±0.19 fold by 4 hours, 0.901±0.22 fold by 8 hours, then slightly decreasing to 0.671±0.05 fold by 16 hours, and returning to near control levels (0.821±0.15 fold) by 24 hours. Similarly, domoic acid [1mM] induced non-statistically significant alterations in levels of TGF-β1 expression which were 0.625 fold by 4 hours (n=1) and 0.923±0.09, 1.01±0.1 fold and 0.977±0.206 fold by 8, 16 and 24 hours, respectively.

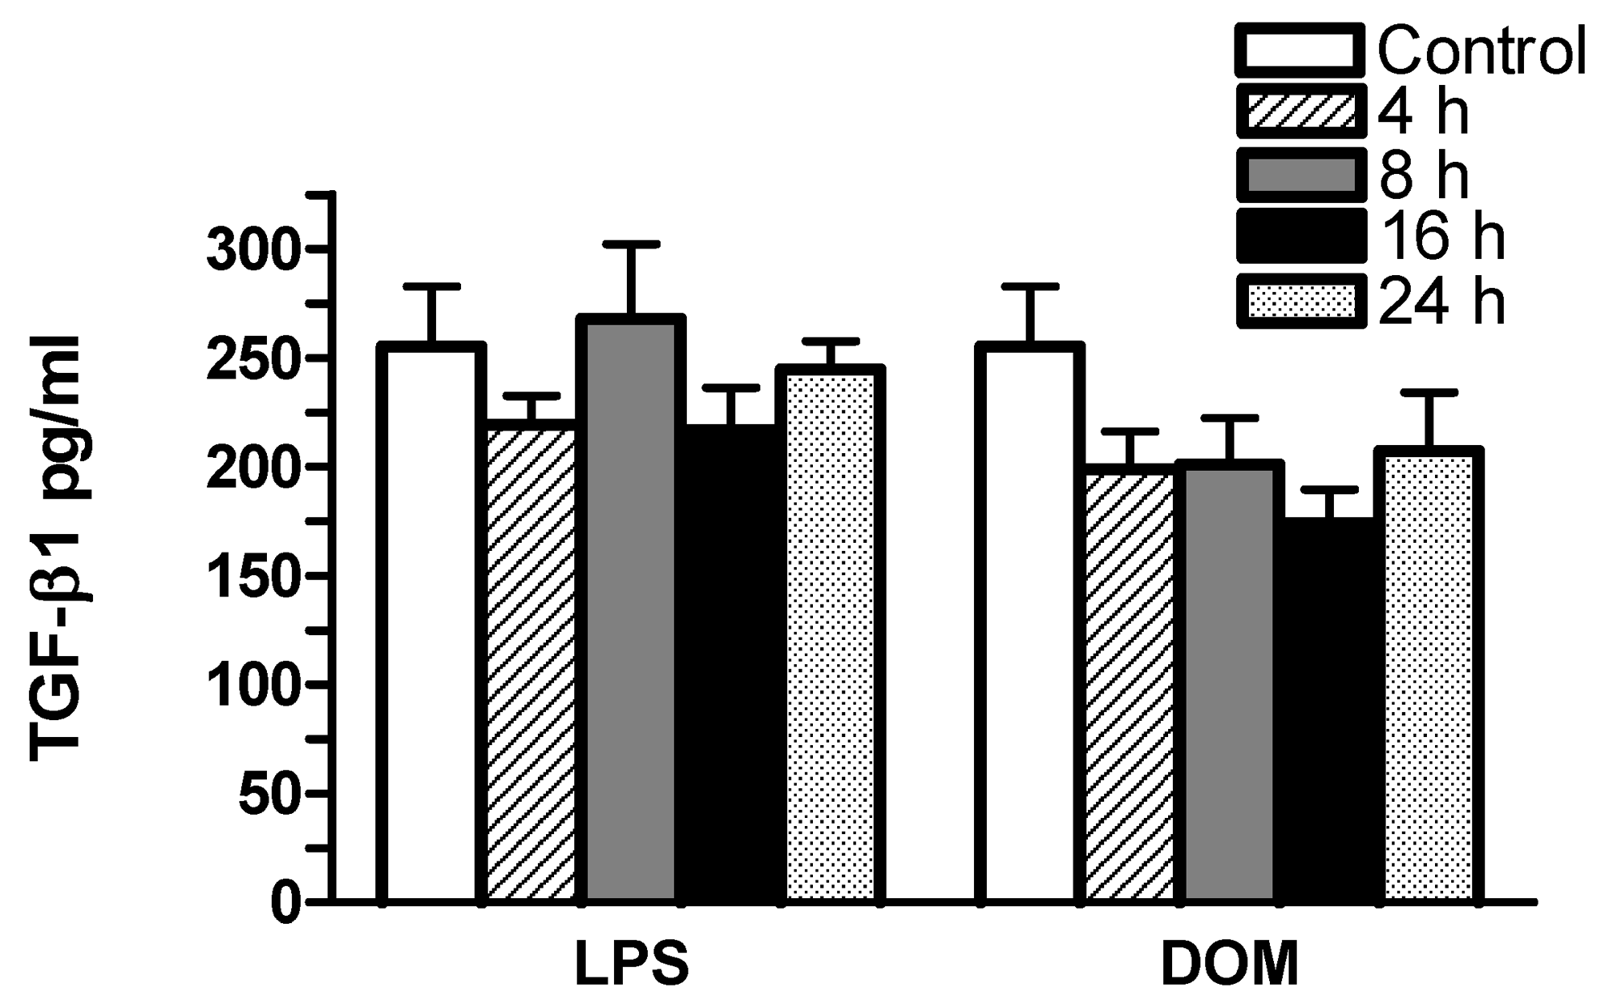
2.5 Effect of LPS and domoic acid on TGF-β1 release by rat neonatal microglia

In order to determine whether a 4 to 24 hour stimulation of microglia with domoic acid [1mM] or LPS [3 ng/mL] in vitro caused TGF-β1 protein release, the cell-free media from the same cell culture dishes containing microglia used for TGF-β1 mRNA analysis shown in Figures 5 and 6 were assayed with a rat-specific ELISA (see Experimental). As shown in Figure 7, in LPS [3 ng/mL]-treated microglia TGF-β1 levels remained unchanged: by 4, 8, 16 and 24 hours TGF-β1 levels were 219.4 ± 13.3, 267 ± 34.4, 216 ± 19.4, 244 ± 13.0 pg/mL (n=5), respectively vs. 255.3 ± 27.3 pg/mL (untreated controls, n=5), P > 0.05. Similarly, in domoic acid [1mM]-treated microglia although TGF-β1 levels appeared to decrease after 4, 8, 16 and 24 hours, the differences were non-statistically significant: 198 ± 17, 201 ± 21.4, 173 ± 15.7, 207 ± 27 pg/mL (n=6), respectively, vs. 255.3 ± 27.3 pg/mL (untreated controls, n=5), P > 0.05.

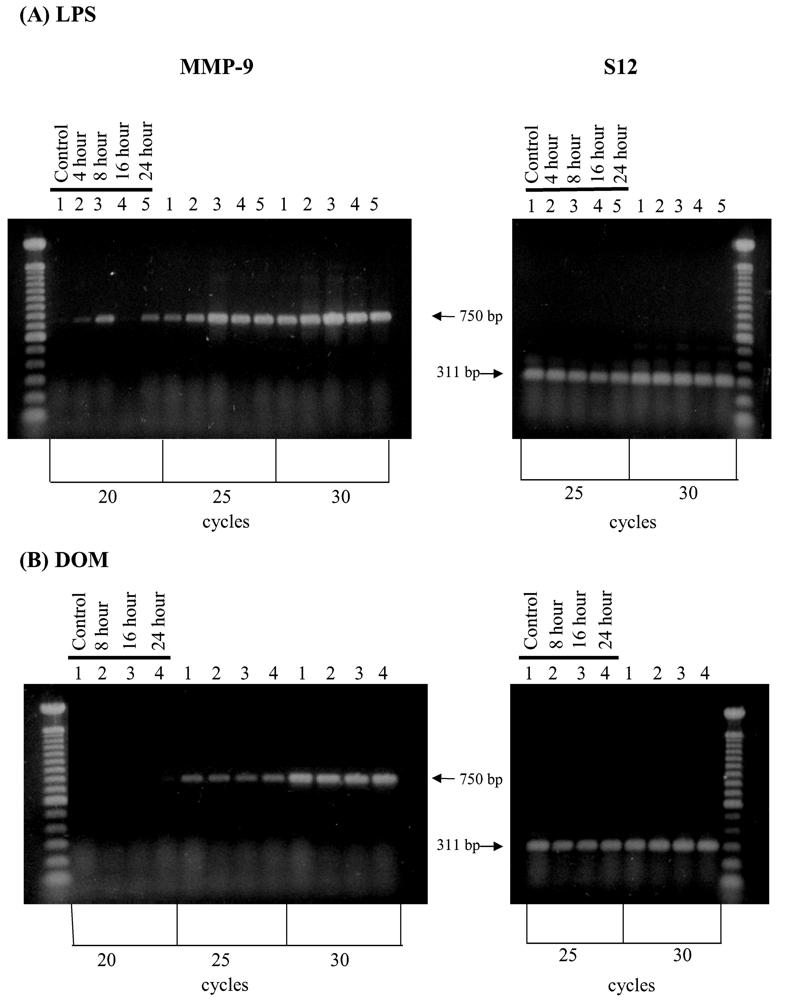
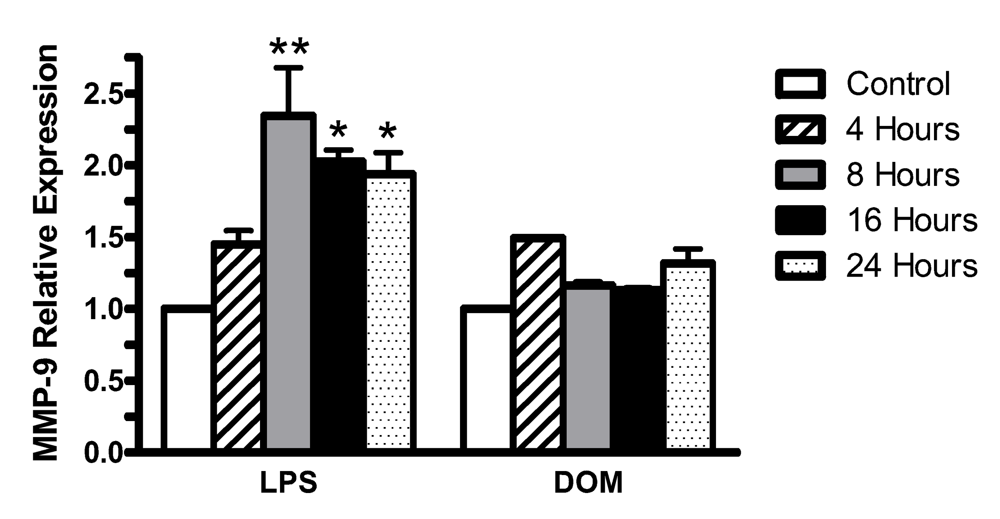
2.6. Effect of LPS and domoic acid on MMP-9 mRNA expression by rat neonatal microglia

Stimulation of microglia has been shown to cause increased expression of the pro-inflammatory MMP-9 [9,27]. As shown in Figure 8A, stimulation of microglia with LPS [3 ng/ml] in vitro resulted in a time-dependent increase in MMP-9 mRNA expression relative to controls as determined by semi-quantitative RT-PCR at the linear range of amplification (25 cycles) that was clearly visible by 4 hours. In contrast, as shown in Figure 8B, domoic acid [1mM] did not induce significant changes in MMP-9 mRNA expression as determined by semi-quantitative RT-PCR over the linear range of amplification (25 cycles).
Furthermore, as shown in Figure 9, LPS [3ng/mL] induced a statistically significant increase in the level of MMP-9 expression relative to controls beyond 4 hours (1.45±0.09 fold, P>0.05): 2.34±0.33 fold by 8 hours (P<0.01), and remained significantly elevated at 2.02±0.08 fold and 1.94±0.15 fold at 16 and 24 hours (P<0.05), respectively. In contrast, domoic acid[1 mM] induced non-statistically significant changes in the relative levels of MMP-9 expression: 1.49 fold by 4 hours(n=1), 1.16±0.02 and 1.13±0.02 fold at 8 and 16 hours, respectively, and then a slight increase to 1.31±0.1 fold by 24 hours.

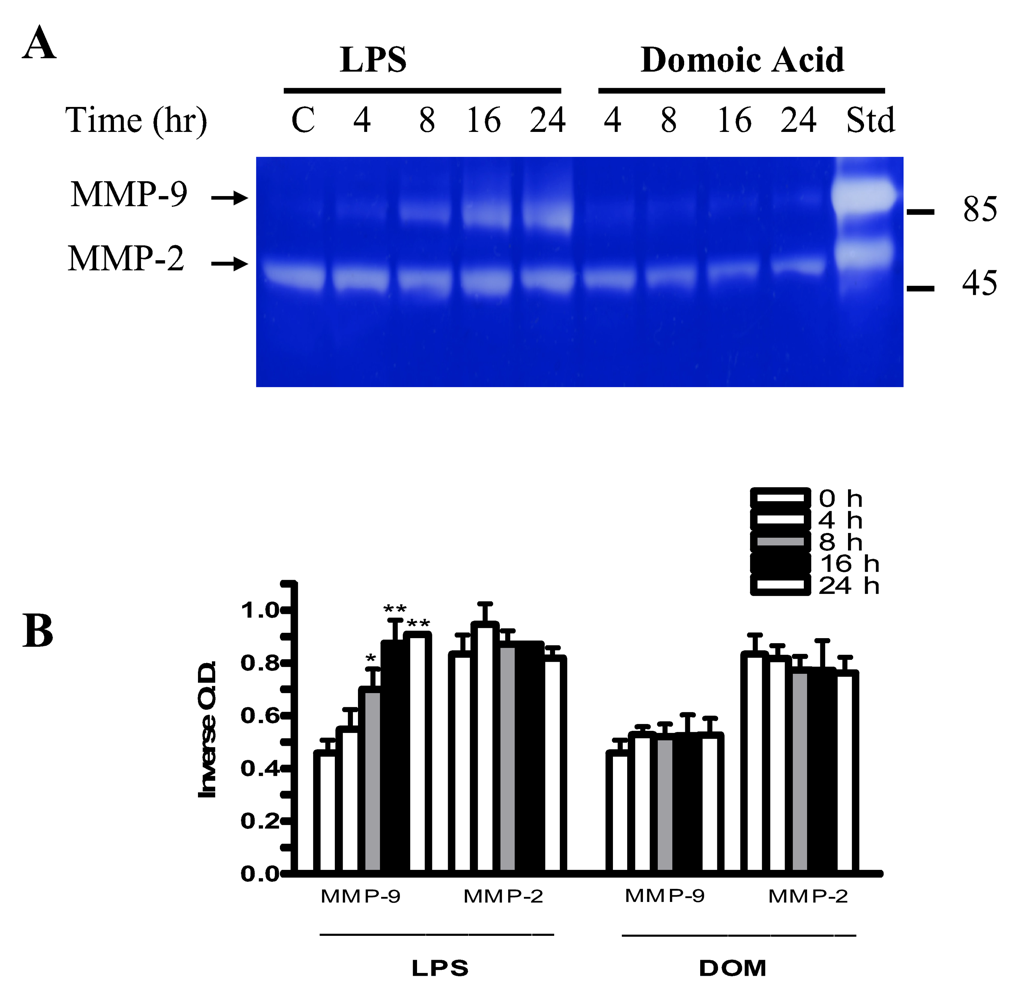
2.7 Effect of LPS and domoic acid on MMP-2 and MMP-9 release by rat neonatal microglia

We have shown that a stimulation of microglia with LPS in vitro will lead to MMP-9 release [5,27]. In order to determine whether a 4 to 24 hour stimulation of microglia with LPS [3 ng/mL] or domoic acid [1mM] leads to MMP-2 and MMP-9 secretion, cell-free media from the same cell culture dishes containing microglia used for MMP-9 mRNA analysis shown in Figures 8 and 9, were assayed for MMP-2 and MMP-9 release as described in Experimental. As shown in Figure 10, a statistically significant increase in MMP-9 release was observed 8, 16 and 24 hours after microglia were stimulated with LPS [3 ng/mL]. MMP-9 inverse optical density levels for 8, 16 and 24 hours were 0.69 ± 0.05, 0.874 ± 0.06, 0.91 ± 0.0005 (LPS-treated, n=2), respectively, vs. 0.46 ± 0.03 (untreated controls, n=2), P< 0.05 (8 hours) and P < 0.01(16 and 24 hours). In contrast to LPS, MMP-9 levels in the tissue culture media in domoic acid-treated microglia remained unchanged 4, 8, 16 and 24 hours after domoic acid treatment. Neither LPS nor domoic acid had a significant effect on MMP-2 release over the 24 hour-observation period.

3. Discussion

While the excitotoxicity of domoic acid to adult neuronal tissue in humans, rats, mice and monkeys is well documented (for review see Ref [22]), there is also a growing literature supporting the notion that the neonatal period is particularly sensitive [16,17,18] perhaps because the blood-brain barrier is incomplete [28]. Furthermore, because the GluR4 subunit of the AMPA glutamate receptor has affinity for domoic acid [26,29,30], is activated in rat microglia in vivo [25] and we have observed its presence on rat neonatal microglia in vitro [27], we hypothesized that domoic acid might putatively activate neonatal microglia in vitro and lead to concomitant mediator release [22]. Thus, the purpose of this investigation was to continue testing our hypothesis [22,27], and determine whether extending the in vitro exposure to domoic acid would affect both gene expression and concomitant release of the pro-inflammatory TNF-α [5, 6] and MMP-9 [5, 9], as well as the anti-inflammatory cytokine TGF-β1 [7, 8].
Similar to our previous study [27], and prior to conducting the in vitro studies with rat neonatal microglia, we considered it necessary to ascertain the chemical stability of domoic acid. The proton NMR spectrum of the domoic acid stock used for the experiments described herein was consistent with the expected proton NMR pattern for pure domoic acid, with no evidence of degraded compounds, thus confirming the chemical stability of domoic acid in the aqueous solutions frozen to –80°C and which were thawed prior to experiments described herein. Interestingly, our observations complement reports on domoic acid’s stability in saline solutions [31]. Having determined that our domoic acid preparation was stable and undegraded, we then investigated whether a 4 to 24 hour exposure to 1 mM domoic acid in vitro would activate rat neonatal microglia pro-inflammatory or anti-inflammatory mediator expression and release or perhaps both.
The significance and contribution of the cytokine TNF-α to the pathogenesis of inflammatory CNS disorders in vivo has been studied extensively because this cytokine has been hypothesized to mediate myelin and oligodendrocyte damage in vitro [10] and perhaps may be involved in several central nervous system pathologies [4,32,33]. Microglia are a source of TNF-α in the brain, an observation first reported more than two decades ago [6]. Because E. coli LPS triggers rat neonatal microglia TNF-α gene expression and subsequent protein release in vitro [5,34,27] in both a concentration- and time-dependent manner, LPS was used as a positive control of microglia activation in all our experiments. In our prior study, we reported that a 1 to 6 hour in vitro exposure of rat neonatal microglia to LPS [10 ng/mL] resulted in both a statistically significant increase of TNF-α gene expression and protein release [27]. In contrast, domoic acid [1 mM] induced a non-statistically significant rise in TNF-α expression and a statistically significant increase (p<0.01) of immunoreactive TNF-α protein by 4 hours [27]. In the current study, the in vitro exposure of rat microglia to both LPS [3ng/mL] and domoic acid [1mM] was extended from 4 to 24 hours. Interestingly, although extending the in vitro exposure of microglia to 3 ng/mL LPS, rather than 10 ng/mL as in our previous study [27], resulted in both a statistically significant increase in TNF-α gene expression and TNF-α protein release, treatment of microglia in vitro with domoic acid [1mM] from 4 to 24 hour, did not lead to statistically significant enhancement of TNF-α gene expression and TNF-α protein release. Taken together, our current and previous observations [27] suggest that future studies might perhaps benefit from the use of more sensitive methods to investigate both TNF-α expression and TNF-α protein release when both are low, as is the case in domoic acid-treated microglia: real-time PCR techniques would enable the determination of the kinetics of low levels of TNF-α expression [35]; while similarly, immuno-PCR would support an analysis of TNF-α release at the femtomolar range [36]. These proposed studies might be of considerable significance because picogram levels of TNF-α release have been observed after stimulation of rat neonatal microglia with kainic acid, a domoic acid and glutamate analog [37]. In summary, and similar to our previous observations [27], direct interaction of the marine toxin domoic acid with microglia in vitro does not appear to activate significant expression and release of the pro-inflammatory cytokine TNF-α, an observation that would appear to differ with the effect of kainic acid, also a glutamate analog, on TNF-α release by microglia [37]. Interestingly our current observations support data that suggest that neuronal death caused by excitatory amino acids does not require the pro-inflammatory cytokine TNF-α [38].
Transforming growth factor-betas (TGF-betas) are pleiotropic cytokines involved in development and maintenance of the nervous system, that may exert potent neuroprotective effects [39]. In vivo studies have documented that TGF-β1 mediates neuroprotection against excitotoxic injury [40], a finding that contrasts with TGF-β1 “opposite” effects on excitotoxic injury in vitro [41]. Although in vivo TGF-β1 mRNA increased in microglial cells of the hippocampus in response to kainic acid-induced neurodegeneration [42], and in vitro activation of microglia and TNF-α release have been shown to mediate the generation of TGF-β1 [7,8], no studies to our knowledge have investigated the in vitro effect of kainic acid or domoic acid on brain microglia TGF-β1 gene expression and protein release. In the current study, the in vitro exposure of rat microglia to both LPS and domoic acid had no statistically significant effect on both TGF-β1 gene expression and protein release over a 24 hour observation period, an observation that appears to be in agreement with recent observations with human microglia [43]. It would thus appear from our experiments that even though microglia released increased amounts of pro-inflammatory TNF-α when exposed to LPS [3 ng/mL] stimulation, these increased levels of TNF-α did not alter the expression or release of TGF-β1 within the 4 to 24 hours observation period we used in the in vitro protocols of our study. Our current results, do not support the notion that direct interaction of the marine excitotoxin domoic acid [1mM] with microglia in vitro leads to the generation of the anti-inflammatory cytokine TGF-β1. Our findings however do not preclude the possibility that similar experimental conditions may have affected expression and/or release of additional anti-inflammatory cytokines released by microglia, eg. IL-10 [44]. These studies are currently underway in our laboratory.
Proteases such as MMP-9 [5, 9] have been implicated in sublethal and lethal neuronal and glial injury in vivo in the CNS [45]. Activation of rat neonatal microglia and release of MMPs after LPS treatment in vitro [5] may involve TNF-α [46,47]. While in our previous study we did not investigate MMP gene expression, we did report that a 1 to 6 hour in vitro exposure of rat neonatal microglia to both LPS [10 ng/mL] and domoic acid [1 mM] resulted in a statistically significant increase of MMP-9 protein release [27], although the magnitude of MMP-9 release after domoic acid treatment was much smaller. In the current study, the in vitro exposure of rat microglia to both LPS [3ng/mL] and domoic acid [1mM] was extended from 4 to 24 hours. Interestingly, the in vitro exposure of microglia to 3 ng/ml LPS, rather than 10 ng/ml as used in our prior study [27], still resulted in statistically significant MMP-9 release which remained elevated up to 24 hours (P<0.01), thus extending and confirming our previous observations. However, in contrast to our earlier report [27], no significant increase in MMP-9 release over the 24 hour observation period was observed after domoic acid treatment. Interestingly, concomitant MMP-9 gene expression was statistically significant from 8 to 24 hours after exposure to LPS, but not after microglia cells were exposed to domoic acid. Thus, our current observations, do not appear to provide support to the hypothesis that direct interaction of the marine toxin domoic acid with microglia in vitro leads to the time-dependent generation of the pro-inflammatory matrix metalloproteinase MMP-9.
In summary, in our experiments the effect of a 4 to 24 hour in vitro exposure to domoic acid on rat neonatal microglia activation and concomitant TNF-α, MMP-9 and TGF-β1 gene expression and protein release was clearly distinct in its magnitude from that observed after exposure to E. Coli LPS, an agent involved in endotoxic shock and other central nervous pathologies [4]. Even though our present study was limited to the study of the short term effect (4 to 24 hours) of an in vitro exposure of brain neonatal microglia to domoic acid, it provides experimental evidence that domoic acid [1mM] which we observed was toxic to neuronal cells [27], does not appear to trigger a significant activation of rat neonatal microglia and concomitant gene expression and release of the pro-inflammatory mediators TNF-α and MMP-9, as well as the anti-inflammatory cytokine TGF-β1. Our observations however do not exclude the possibility that increased levels of TNF-α, MMP-9 or TGF-β1 may be generated by neonatal rat microglia as a result of either, (1) a synergistic interaction between domoic acid and subtoxic concentrations of excitatory amino acids, a combination that has been shown to increase the neurotoxicity of domoic acid to primary cultures of cerebellar neurons [48], or (2), a further increase in the time of in vitro exposure to domoic acid, suggested by the observation that domoic acid activates rat microglia several days after in vivo administration [49] perhaps as a result of the neuronal toxicity [50] of this marine toxin. A complete understanding of the potential neurotoxic and/or neuroprotective effects of TNF-α, MMP-9 or TGF-β1, as well as other cytokines [51] and metalloproteinases [52] which we have recently shown rat microglia may release upon LPS or domoic acid treatment, will ultimately lead to a better understanding of domoic acid’s pathophysiological effects on human microglia. This concept is supported by the established fact that glutamate receptors are highly conserved between mammals [29].

4. Experimental

4.1. Reagents

LPS B (Escherichia coli 026:B6) was obtained from Difco Laboratories (Detroit, MI); crystalline lyophilized domoic acid was purchased from Diagnostics Chemicals Ltd. (Oxford, CT) and was dissolved in LPS-free water obtained from GIBCO-BRL (Grand Island, NY) to prepare a 12.5 mM stock [53] and stored at –80°C. Dulbecco's modified Eagle medium (DMEM) with high glucose (4,500 mg/l), Hank’s balanced salt solution (HBSS), penicillin (P), streptomycin (S), trypsin (0.25%)-EDTA [1mM] and trypan blue were purchased from GIBCO-BRL (Grand Island, NY); certified heat-inactivated fetal bovine serum (FBS) was obtained from Hyclone (Logan, UT). A LPS stock of 1 mg/ml was prepared in a 0.9% sodium chloride non pyrogenic solution from Baxter Healthcare Corp. (Toronto, ONT, Canada) and then diluted with DMEM plus 10% FBS plus P and S to the appropriate concentration used in our experiments. Both the LPS stock solution [3 ng/ml] and dilutions were stored at −80 °C, thawed prior to each experiment and discarded after use.

4.2. LPS containment

To inactivate extraneous LPS, all glassware and metal spatulas were baked for 4 hours at 180°C. Sterile and LPS-free 75-and 162-cm2 vented cell culture flasks, 24-well flat-bottom culture clusters, 96-well cell culture clusters and disposable serological pipettes were purchased from Costar Corporation (Cambridge, MA), while polystyrene cell culture dishes (60 x 15 mm) were obtained from Corning Glass Works (Corning, NY). Sterile and pyrogen-free Eppendorf Biopur pipette tips were purchased from Brinkmann Instruments, Inc. (Westbury, NY).

4.3. Nuclear magnetic resonance spectrometry of domoic acid

The presence of undegraded domoic acid in the stock solution (12.5 mM) was confirmed by nuclear magnetic resonance (NMR) spectrometry prior to the experiments. NMR was performed in the Division of Biomedical Marine Research, Harbor Branch Oceanographic Institution, Fort Pierce, Florida. Two control samples were combined and freeze-dried yielding a white residue (750 mg). A portion of the white residue (1.0 mg) was re-dissolved in 0.5 ml of D2O for NMR studies. The proton NMR spectrum was measured on a Bruker AMX-500 instrument and chemical shifts were referenced to sodium-3-trimethylpropionate-d4 (TSP) signal observed at 4.69 ppm.

4.4. Isolation and culture of rat neonatal microglia

All experiments were performed with adherence to the National Institutes of Health guidelines on the use of experimental animals and with protocols approved by Midwestern University's Research and Animal Care Committee. To isolate rat neonatal microglia, cerebral cortices of 1–2 day-old Sprague-Dawley rats purchased from Harlan (Indianapolis, IN) were surgically removed and placed in cold DMEM + 120 U/ml P and 12 μg/ml S, the meninges carefully removed, and brain tissue minced and dissociated with trypsin-EDTA at 36°C for 3–5 min. The mixed glial cell suspension was plated in either 75- or 162-cm2 vented cell culture flasks with DMEM medium supplemented with 10% FBS + 120 U/ml P + 12 μg/ml S and grown in a humidified 5% CO2 incubator at 36°C for 12–14 days. On day 14 and every week thereafter, microglia were detached using an orbital shaker (150 rpm, 0.5 hours, 36°C, 5% CO2), centrifuged (400 x g, 25 min, 4°C), and microglia number and viability assessed by trypan blue exclusion. Microglia were characterized as described earlier [5]. Depending on the particular experimental protocol (see below), microglia averaging > than 95% viability were plated in either 60 mm x 15 mm polystyrene cell culture dishes, 96-well cell culture clusters, or 24-well cell culture clusters, with DMEM supplemented with 10% FBS + 120 U/ml P + 12 μg/ml S, and placed in a humidified 5% CO2 incubator at 36°C 18–24 hours prior to the experiments.

4.5. Experimental protocol to determine the effect of domoic acid and LPS on rat neonatal microglia TNF-α, TGF-β1 and MMP-9

To study the time-dependent effects of domoic acid and LPS on TNF-α, TGF-β1 and MMP-9, rat neonatal microglia (2.8–5 x 10⁶ cells/60 mm x 15 mm polystyrene cell culture dish) were treated with (1) domoic acid [1mM], (2) LPS-free water used as a vehicle for domoic acid or (3) LPS [3 ng/ml] in a final volume of 3 ml of DMEM supplemented with 10% FBS + 120 U/ml P + 12 μg/ml S and incubated in a humidified 5% CO2 incubator at 36°C for 4, 8, 16 and 24 h. Upon termination of the experiments, rat neonatal microglia were processed for RNA isolation and RT-PCR and the cell-free supernatants from each culture dish were assayed for TNF-α, TGF-β1 and MMP-9 (see below).

4.6. Experimental protocol to determine the effect of domoic acid and LPS on rat neonatal microglia TNF- α, TGF-β1 and MMP-9 expression: RNA isolation and semiquantitative RT-PCR analysis

Total rat neonatal microglia RNA was isolated after treatment with either LPS or domoic acid for 4, 8, 16 and 24 hours with TRI reagent purchased from Molecular Research Center, Inc. (Cincinnati, OH). The RT-PCR was performed in the same sample tube using gene-specific primers obtained from IDT (Coralville, IA), as described below, and the Superscript one-step kit obtained from Gibco-BRL (Grand Island, NY). Briefly, first strand cDNA was made using 0.25 μg of RNA, Superscript II H-reverse transcriptase, antisense gene-specific primers and conditions of 30 min at 50 °C. Samples were denatured at 94 °C for 2 min , and PCR was performed for various cycle numbers to ensure linear amplification. The PCR cycling conditions consisted of a denaturation step at 94 °C for 30 s, an annealing step at 54 °C (S12), 60 °C (TNF-α), 61 °C (MMP-9), and 58.5 °C (TGF-β1), an extension step at 72 °C for 1 min, and a final extension step at 72 °C for 10 min. The 50 μl samples contained 0.2 mM of each dNTP, 1.2 mM magnesium sulfate, Platinum® taq DNA polymerase, and 0.2 μM of each gene specific primer. The primers for rat TNF-α, were as previously described and generate a 181 bp cDNA product [27]. The sequences of the primers for rat TGF-β1 (GenBank accession number NM_021578) are sense (bp 785 – 808) 5’-ATA CAG GGC TTT CGC TTC AGT GCT-3’ and antisense (bp 1168 – 1191) 5’-CCC GGG TTG TGT TGG TTG TAG AGG-3’ and generate a 407 bp cDNA product. The rat MMP-9 (GenBank accession number NM_031055) primer sequences are sense (bp 509 – 528) 5’-AGT TTG GTG TCG CGG AGC AC-3’ and antisense (bp 1243 – 1262) 5’-TAC ATG AGC GCT TCC GGC AC-3’ and generate a 750 bp cDNA product. The primers for rat constitutively expressed ribosomal S12, are sense:5’-ACG TCA ACA CTG CTC TAC A-3’ and antisense:5’-CTT TGC CAT AGT CCT TAA C-3’ and generate a 303 bp cDNA product as previously described [54]. Controls for RT-PCR included samples without the enzyme reverse transcriptase and samples without template. The PCR reactions were analyzed by electrophoresis using 1.5 % agarose gels, visualized with SYBR® Gold nucleic acid staining (Molecular Probes; Eugene, OR), photographed, scanned and digitized with the UN-SCAN-IT™ gel automated digitizing system from Silk Scientific (Orem, UT). The relative amounts of TNF-α expression as determined by RT-PCR were normalized to S12 levels using methods similar to those previously described by others [55].

4.7. Assays for TNF-α and TGF-β1

Immunoreactive TNF-α and TGF-β1 in cell-free media supernates was determined using rat-specific ELISAs purchased from Biosource International (Camarillo, CA) with a detection limit of 0.7 pg/ml (TNF-α) and 15.6 pg/mL (TGF-β1). Results are expressed as pg/ml.

4.8. SDS-PAGE gelatinase zymography for MMP-2 and MMP-9 analysis

Following incubation with LPS or domoic acid, MMP expression was analyzed in the harvested media of cultured rat neonatal microglia. As the rat neonatal microglia cultures were normalized for cell number, equal volumes of harvested media obtained from each condition were analyzed. Briefly, 10 μl of each sample were electrophoresed at 4°C and under non-denaturing conditions using a 10% polyacrylamide gel containing 0.05% gelatin. The gels were incubated for 1 hour in a 2.5% Triton X-100 solution and then washed twice with water (20 min each). The gels were then incubated for 24 hours at 37°C in 50 mM Tris-HCl buffer, pH 7.4, containing 5 mM CaCl2. A duplicate negative control gel was incubated as described above but in 50 mM Tris-HCl, pH 7.4 containing 10 mM EDTA instead of CaCl2. The gels were fixed for 1 hour in 40% methanol /7% acetic acid and then stained in Coomassie Blue Solution (Sigma), followed by destaining in 10% methanol, 7% acetic acid. MMP activity was visualized as clear bands against a blue background. Gelatin-containing zymograms are typically used to detect MMP-2 (72 kDa) and MMP-9 (92 kDa) and their identification is based on molecular weight. Relative clearing of each sample was quantitated by determining the inverse optical density units using the NIH Image software package (version 1.60). Values are represented as the mean ± SE and are presented as inverse optical density. The value corresponding to background, a region of equal area as that used to measure the cleared bands and of a lane in which no sample was loaded, was subtracted from each sample value.

4.9. Statistical analysis of the data

Data were analyzed with PrismR software package (GraphPad, San Diego, CA.) and SPSS version 15 (SPSS Inc., Chicago, IL.). One way analysis of variance followed by either the LSD (Figure 3) or Dunnett's post hoc procedure was performed on all sets of data. LPS or domoic acid-treated groups were compared with the vehicle-treated group, shown as 0 or control in the corresponding figures. Differences were considered statistically significant at p<0.05 and reported in each figure legend.

Acknowledgments

This publication was made possible by grant number R15 ES 12654-01 from the National Institute of Environmental Health Sciences, NIH. Its contents are solely the responsibility of the authors and do not necessarily represent the official view of the NIEHS, NIH. Valuable support by Midwestern University’s animal facility and library staff as well as the excellent secretarial assistance of Mrs. Victoria Sears is gratefully acknowledged.
  • Samples Availability: Available from the authors.

References

  1. Dheen, ST; Kaur, C; Ling, EA. Microglial activation and its implications in the brain diseases. Curr Med Chem 2007, 14(11), 1189–1197. [Google Scholar]
  2. Town, T; Nikolic, V; Tan, J. The microglial "activation" continuum: from innate to adaptive responses. J Neuroinflammation 2005, 2, 24. [Google Scholar]
  3. Gehrmann, J; Matsumoto, Y; Kreutzberg, GW. Microglia: intrinsic immuneffector cell of the brain. Brain Res Brain Res Rev 1995, 20(3), 269–287. [Google Scholar]
  4. Mayer, AMS. Therapeutic implications of microglia activation by lipopolysaccharide and reactive oxygen species generation in septic shock and central nervous system pathologies: a review. Medicina (B Aires) 1998, 58(4), 377–385. [Google Scholar]
  5. Mayer, AMS; Oh, S; Ramsey, KH; Jacobson, PB; Glaser, KB; Romanic, AM. Escherichia coli lipopolysaccharide potentiation and inhibition of rat neonatal microglia superoxide anion generation: correlation with prior lactic dehydrogenase, nitric oxide, tumor necrosis factor-alpha, thromboxane B2, and metalloprotease release. SHOCK 1999, 11(3), 180–186. [Google Scholar]
  6. Sawada, M; Kondo, N; Suzumura, A; Marunouchi, T. Production of tumor necrosis factor-alpha by microglia and astrocytes in culture. Brain Res 1989, 491(2), 394–397. [Google Scholar]
  7. Chao, CC; Hu, S; Sheng, WS; Tsang, M; Peterson, PK. Tumor necrosis factor-alpha mediates the release of bioactive transforming growth factor-beta in murine microglial cell cultures. Clin Immunol Immunopathol 1995, 77(3), 358–365. [Google Scholar]
  8. Constam, DB; Philipp, J; Malipiero, UV; ten Dijke, P; Schachner, M; Fontana, A. Differential expression of transforming growth factor-beta 1, -beta 2, and -beta 3 by glioblastoma cells, astrocytes, and microglia. J Immunol 1992, 148(5), 1404–1410. [Google Scholar]
  9. Gottschall, PE; Yu, X; Bing, B. Increased production of gelatinase B (matrix metalloproteinase-9) and interleukin-6 by activated rat microglia in culture. J Neurosci Res 1995, 42(3), 335–342. [Google Scholar]
  10. Selmaj, KW; Raine, CS. Tumor necrosis factor mediates myelin and oligodendrocyte damage in vitro. Ann Neurol 1988, 23(4), 339–346. [Google Scholar]
  11. Banati, RB; Gehrmann, J; Schubert, P; Kreutzberg, GW. Cytotoxicity of microglia. GLIA 1993, 7(1), 111–118. [Google Scholar]
  12. Kreutzberg, GW. Microglia: a sensor for pathological events in the CNS. Trends Neurosci 1996, 19(8), 312–318. [Google Scholar]
  13. Aloisi, F. Immune function of microglia. GLIA 2001, 36(2), 165–179. [Google Scholar]
  14. Teitelbaum, JS; Zatorre, RJ; Carpenter, S; Gendron, D; Evans, AC; Gjedde, A; Cashman, NR. Neurologic sequelae of domoic acid intoxication due to the ingestion of contaminated mussels [see comments]. N Engl J Med 1990, 322(25), 1781–1787. [Google Scholar]
  15. Iverson, F; Truelove, J. Toxicology and seafood toxins: domoic acid. Nat Toxins 1994, 2(5), 334–339. [Google Scholar]
  16. Xi, D; Peng, YG; Ramsdell, JS. Domoic acid is a potent neurotoxin to neonatal rats. Nat Toxins 1997, 5(2), 74–79. [Google Scholar]
  17. Doucette, TA; Strain, SM; Allen, GV; Ryan, CL; Tasker, RA. Comparative behavioural toxicity of domoic acid and kainic acid in neonatal rats. Neurotoxicol Teratol 2000, 22(6), 863–869. [Google Scholar]
  18. Wang, GJ; Schmued, LC; Andrews, AM; Scallet, AC; Slikker, W, Jr; Binienda, Z. Systemic administration of domoic acid-induced spinal cord lesions in neonatal rats. J Spinal Cord Med 2000, 23(1), 31–39. [Google Scholar]
  19. Peng, YG; Ramsdell, JS. Brain Fos induction is a sensitive biomarker for the lowest observed neuroexcitatory effects of domoic acid. Fundam Appl Toxicol 1996, 31(2), 162–168. [Google Scholar]
  20. Scallet, AC; Binienda, Z; Caputo, FA; Hall, S; Paule, MG; Rountree, RL; Schmued, L; Sobotka, T; Slikker, W. , Jr. Domoic acid-treated cynomolgus monkeys (M. fascicularis): effects of dose on hippocampal neuronal and terminal degeneration. Brain Res 1993, 627(2), 307–313. [Google Scholar]
  21. Ross, IA; Johnson, W; Sapienza, PP; Kim, CS. Effects of the seafood toxin domoic acid on glutamate uptake by rat astrocytes. Food Chem Toxicol 2000, 38(11), 1005–1011. [Google Scholar]
  22. Mayer, AMS. The marine toxin domoic acid may affect the developing brain by activation of neonatal brain microglia and subsequent neurotoxic mediator generation. Med Hypotheses 2000, 54(5), 837–841. [Google Scholar]
  23. Grewal, RP; Yoshida, T; Finch, CE; Morgan, TE. Scavenger receptor mRNAs in rat brain microglia are induced by kainic acid lesioning and by cytokines. Neuroreport 1997, 8(5), 1077–1081. [Google Scholar]
  24. Rogove, AD; Tsirka, SE. Neurotoxic responses by microglia elicited by excitotoxic injury in the mouse hippocampus. Curr Biol 1997, 8, 19–25. [Google Scholar]
  25. Gottlieb, M; Matute, C. Expression of ionotropic glutamate receptor subunits in glial cells of the hippocampal CA1 area following transient forebrain ischemia. J Cereb Blood Flow Metab 1997, 17(3), 290–300. [Google Scholar]
  26. Hampson, DR; Huang, XP; Wells, JW; Walter, JA; Wright, JL. Interaction of domoic acid and several derivatives with kainic acid and AMPA binding sites in rat brain. Eur J Pharmacol 1992, 218(1), 1–8. [Google Scholar]
  27. Mayer, AMS; Hall, M; Fay, MJ; Lamar, P; Pearson, C; Prozialeck, WC; Lehmann, VK; Jacobson, PB; Romanic, AM; Uz, T; Manev, H. Effect of a short-term in vitro exposure to the marine toxin domoic acid on viability, tumor necrosis factor-alpha, matrix metalloproteinase-9 and superoxide anion release by rat neonatal microglia. BMC Pharmacol 2001, 1(1), 7. [Google Scholar] [Green Version]
  28. al-Sarraf, H; Preston, JE; Segal, MB. Changes in the kinetics of the acidic amino acid brain and CSF uptake during development in the rat. Brain Res Dev Brain Res 1997, 102(1), 127–134. [Google Scholar]
  29. Hollmann, M; Heinemann, S. Cloned glutamate receptors. Annu Rev Neurosci 1994, 17, 31–108. [Google Scholar]
  30. Lerma, J. Kainate receptors: an interplay between excitatory and inhibitory synapses. FEBS Lett 1998, 430(1–2), 100–104. [Google Scholar]
  31. Johannessen, JN. Stability of domoic acid in saline dosing solutions. J AOAC Int 2000, 83(2), 411–412. [Google Scholar]
  32. Sanders, P; De, KJ. Janus faces of microglia in multiple sclerosis. Brain Res Rev 2007, 54(2), 274–285. [Google Scholar]
  33. Campbell, IL. Cytokine-mediated inflammation and signaling in the intact central nervous system. Prog Brain Res 2001, 132, 481–498. [Google Scholar]
  34. Bhat, NR; Zhang, P; Lee, JC; Hogan, EL. Extracellular signal-regulated kinase and p38 subgroups of mitogen- activated protein kinases regulate inducible nitric oxide synthase and tumor necrosis factor-alpha gene expression in endotoxin-stimulated primary glial cultures. J Neurosci 1998, 18(5), 1633–1641. [Google Scholar]
  35. Wen, LL; Chiu, CT; Huang, YN; Chang, CF; Wang, JY. Rapid glia expression and release of proinflammatory cytokines in experimental Klebsiella pneumoniae meningoencephalitis. Exp Neurol 2007, 205(1), 270–278. [Google Scholar]
  36. Sanna, PP; Weiss, F; Samson, ME; Bloom, FE; Pich, EM. Rapid induction of tumor necrosis factor alpha in the cerebrospinal fluid after intracerebroventricular injection of lipopolysaccharide revealed by a sensitive capture immuno-PCR assay. Proc Natl Acad Sci U S A 1995, 92(1), 272–275. [Google Scholar]
  37. Noda, M; Nakanishi, H; Nabekura, J; Akaike, N. AMPA-kainate subtypes of glutamate receptor in rat cerebral microglia. J Neurosci 2000, 20(1), 251–258. [Google Scholar]
  38. de Bock, F; Derijard, B; Dornand, J; Bockaert, J; Rondouin, G. The neuronal death induced by endotoxic shock but not that induced by excitatory amino acids requires TNF-alpha. Eur J Neurosci 1998, 10(10), 3107–3114. [Google Scholar]
  39. Konig, HG; Kogel, D; Rami, A; Prehn, JH. TGF-{beta}1 activates two distinct type I receptors in neurons: implications for neuronal NF-{kappa}B signaling. J Cell Biol 2005, 168(7), 1077–1086. [Google Scholar]
  40. Boche, D; Cunningham, C; Gauldie, J; Perry, VH. Transforming growth factor-beta 1-mediated neuroprotection against excitotoxic injury in vivo. J Cereb Blood Flow Metab 2003, 23(10), 1174–1182. [Google Scholar]
  41. Prehn, JH; Miller, RJ. Opposite effects of TGF-beta 1 on rapidly- and slowly-triggered excitotoxic injury. Neuropharmacology 1996, 35(3), 249–256. [Google Scholar]
  42. Morgan, TE; Nichols, NR; Pasinetti, GM; Finch, CE. TGF-beta 1 mRNA increases in macrophage/microglial cells of the hippocampus in response to deafferentation and kainic acid-induced neurodegeneration. Exp Neurol 1993, 120(2), 291–301. [Google Scholar]
  43. Franciosi, S; Choi, HB; Kim, SU; McLarnon, JG. IL-8 enhancement of amyloid-beta (Abeta 1-42)-induced expression and production of pro-inflammatory cytokines and COX-2 in cultured human microglia. J Neuroimmunol 2005, 159(1–2), 66–74. [Google Scholar]
  44. Mizuno, T; Sawada, M; Marunouchi, T; Suzumura, A. Production of interleukin-10 by mouse glial cells in culture. Biochem Biophys Res Commun 1994, 205(3), 1907–1915. [Google Scholar]
  45. Lukes, A; Mun-Bryce, S; Lukes, M; Rosenberg, GA. Extracellular matrix degradation by metalloproteinases and central nervous system diseases. Mol Neurobiol 1999, 19(3), 267–284. [Google Scholar]
  46. Watanabe, H; Nakanishi, I; Yamashita, K; Hayakawa, T; Okada, Y. Matrix metalloproteinase-9 (92 kDa gelatinase/type IV collagenase) from U937 monoblastoid cells: correlation with cellular invasion. J Cell Sci 1993, 104 Pt 4, 991–999. [Google Scholar]
  47. Rosenberg, GA; Estrada, EY; Dencoff, JE; Stetler-Stevenson, WG. Tumor necrosis factor-alpha-induced gelatinase B causes delayed opening of the blood-brain barrier: an expanded therapeutic window. Brain Res 1995, 703(1–2), 151–155. [Google Scholar]
  48. Novelli, A; Kispert, J; Fernandez-Sanchez, MT; Torreblanca, A; Zitko, V. Domoic acid-containing toxic mussels produce neurotoxicity in neuronal cultures through a synergism between excitatory amino acids. Brain Res 1992, 577(1), 41–48. [Google Scholar]
  49. Appel, NM; Rapoport, SI; O'Callaghan, JP; Bell, JM; Freed, LM. Sequelae of parenteral domoic acid administration in rats: comparison of effects on different metabolic markers in brain. Brain Res 1997, 754(1–2), 55–64. [Google Scholar]
  50. Mayer, AMS; Carlson, LA; Braddock, MT; McCulloch, PF. Hippocampal C-Fos expression and microglia accumulation in rats exposed to the marine toxin domoic acid. The Toxicologist 2007, 96(1), 364. [Google Scholar]
  51. Mayer, AMS; Hall, ML; Fay, MJ; Romanic, AM. Cytokine gene expression in rat microglia exposed to the marine toxin domoic acid. The Toxicologist 2005, 84(S-1), 293. [Google Scholar]
  52. Mayer, AMS; Hall, ML; Fay, MJ; Romanic, AM. cDNA array analysis of matrix metalloproteinase gene expression in rat microglia exposed to the marine toxin domoic acid. The Toxicologist 2004, 46(3), 94. [Google Scholar]
  53. Falk, M; Seto, PF; Walter, JA. Solubility of domoic acid in water and in non-aqueous solvents. Canadian Journal of Chemistry 1991, 69, 1740–1744. [Google Scholar]
  54. Ren, L. Lipopolysaccharide-induced expression of IP-10 mRNA in rat brain and in cultured rat astrocytes and microglia. Brain Res Mol Brain Res 1998, 59(2), 256–263. [Google Scholar]
  55. Lyn, D; Liu, X; Bennett, NA; Emmett, NL. Gene expression profile in mouse myocardium after ischemia. Physiol Genomics 2000, 2 (3), 93–100. [Google Scholar]
Figure 1. Proton nuclear magnetic resonance spectrum of domoic acid (DOM).
Marinedrugs 05 00113 g001
Figure 2. RT-PCR analysis of TNF-α gene expression in rat neonatal microglia after in vitro treatment with LPS or DOM. Neonatal rat brain microglia (2.8–5.0 x 10⁶ cells/culture dish) were treated with (A) LPS [3 ng/mL] or (B) DOM [1mM] for 4 to 24 hours as described in Experimental. Amplification of TNF-α and S12 mRNAs shows the predicted cDNA size after separation on a 1.5 % agarose gel and visualization by SYBRR Gold nucleic acid staining. The S12 ribosomal RNA gene product was amplified for 25 and 30 cycles and demonstrated equal loading of the gels. Quantification of the TNF-α product was done after 25 cycles, where mRNA expression was observed to be in the linear range. The figure depicts one of two similar experiments.
Marinedrugs 05 00113 g002
Figure 3. Time-dependent TNF-α gene expression levels in rat neonatal microglia after in vitro treatment with LPS or DOM. Levels of gene expression were quantified as described in Experimental, and were normalized to S12 ribosomal RNA. Relative expression levels were calculated by dividing the experimental level at each time point by the level observed in the control. Expression is relative to steady-state levels in control (1.00). Data (relative expression level) is expressed as mean α SE of 2 independent experiments. *P < 0.05 vs. vehicle control.
Marinedrugs 05 00113 g003
Figure 4. Time-dependent effect of LPS and DOM on rat neonatal microglia TNF-α release. Rat neonatal microglia (2.8–5.0 x 10⁶ cells/culture dish) were treated with LPS [3 ng/mL] or DOM [1mM] for 4 to 24 hours. TNF-α was determined as described in Experimental. Data (pg/mL) show the mean ± SE of 4–9 independent experiments. ** P < 0.01 vs. vehicle control.
Marinedrugs 05 00113 g004
Figure 5. RT-PCR analysis of TGF-β1 gene expression in rat neonatal microglia after in vitro treatment with LPS or DOM. Rat neonatal microglia (2.8–5.0 x 10⁶ cells/culture dish) were treated with (A) LPS [3 ng/mL] or (B) DOM [1mM] for 4 to 24 hours as described in Experimental. Amplification of TGF-β1 and S12 mRNAs showed the predicted cDNA size after separation on a 1.5 % agarose gel and visualization by SYBRR Gold nucleic acid staining. The S12 ribosomal RNA gene product was amplified for 25 and 30 cycles and demonstrated equal loading of the gels. Quantification of the TGF-β1 product was done after 20 cycles shown to be in the linear range. The figure depicts one of two similar experiments.
Marinedrugs 05 00113 g005
Figure 6. Time-dependent TGF-β1 gene expression levels in rat neonatal microglia after in vitro treatment with LPS or DOM. Levels of gene expression were quantified as described in Experimental and were normalized to S12 ribosomal RNA. Relative expression levels were calculated by dividing the experimental level at each time point by the level observed in the control. Expression is relative to steady-state levels in control (1.00). Data (relative expression level) is expressed as mean ± SE of 2 independent experiments.
Marinedrugs 05 00113 g006
Figure 7. The time-dependent effect of LPS and DOM on rat neonatal microglia TGF-β1 release. Rat neonatal microglia (2.8–5.0 x 10⁶ cells/culture dish) were treated with LPS [3 ng/mL] or DOM [1mM] for 4 to 24 hours. TGF-β1 was determined as described in Experimental. Data (pg/mL) are expressed as mean ± SE of 5–6 independent experiments.
Marinedrugs 05 00113 g007
Figure 8. RT-PCR analysis of MMP-9 gene expression in rat neonatal microglia after in vitro treatment with LPS or DOM. Rat neonatal microglia (2.8–5.0 x 10⁶ cells/culture dish) were treated with (A) LPS [3 ng/mL] or (B) DOM [1mM] for 4 to 24 hours as described in Experimental. Amplification of MMP-9 and S12 mRNAs showed the predicted cDNA size after separation on a 1.5 % agarose gel and visualization by SYBRR Gold nucleic acid staining. The S12 ribosomal RNA gene product was amplified for 25 and 30 cycles and demonstrated equal loading of the gels. Quantification of the MMP-9 product was done after 25 cycles shown to be in the linear range. The figure depicts one of two similar experiments.
Marinedrugs 05 00113 g008
Figure 9. Time-dependent MMP-9 gene expression levels in rat neonatal microglia after in vitro treatment with LPS or DOM. Levels of gene expression were quantified as described in Experimental and were normalized to S12 ribosomal RNA. Relative expression levels were calculated by dividing the experimental level at each time point by the level observed in the control. Expression is relative to steady-state levels in control (1.00). Data (relative expression level) is expressed as mean ± SE of 2 independent experiments. *p < 0.05 or **p < 0.01 vs. vehicle control.
Marinedrugs 05 00113 g009
Figure 10. The time-course of MMP-2 and MMP-9 expression in rat neonatal microglia cultured in the presence of LPS or DOM. MMP-2 and MMP-9 were determined as described in Experimental. (A) SDS-PAGE zymography, (B) bargraph depicting the quantitated results. Rat neonatal microglia (2.8–5 x 10⁶ cells/culture dish) were treated with LPS [3 ng/ml] or DOM [1 mM] for 4 to 24 hours. Data (inverse O.D. units) are expressed as mean ± SE of 2 independent experiments. *p < 0.05 or **p < 0.01 vs. vehicle control.
Marinedrugs 05 00113 g010

List of abbreviations

AMPA
α-amino-3-hydroxy-5-methyl-4-isoxazole propionic acid
DMEM
Dulbecco's modified Eagle medium
DOM
domoic acid
FBS
fetal bovine serum certified
FCC
ferricytochrome c type III
HBSS
Hank’s balanced salt solution
LPS
lipopolysaccharide
MMP-9
matrix metalloproteinase-9
P
penicillin
PBS
phosphate buffered saline
PMA
phorbol 12-myristate 13-acetate
RT-PCR
reverse transcriptase polymerase chain reaction
S
streptomycin
SE
standard error of the mean
SOD
superoxide dismutase
TGF-β1
transforming growth factor β1
TNF-α
tumor necrosis factor

