Acute and Subacute Effects of Urban Air Pollution on Cardiopulmonary Emergencies and Mortality: Time Series Studies in Austrian Cities


Abstract
:1. Introduction
2. Study Population and Methods
3. Results

| (A) NO2 | Graz 1990–2005 | Linz 1990–2007 | Linz 2000–2007 | Vienna 2000–2004 |
| Arithm. mean | 35.7 | 39.4 | 34.6 | 23.0 |
| Std. dev. | 17.0 | 13.3 | 13.1 | 10.7 |
| Median | 31.9 | 38.4 | 32.8 | 21.3 |
| 5th percentile | 15.1 | 20.6 | 16.5 | 9.0 |
| 25th percentile | 24.1 | 30.1 | 26.0 | 14.9 |
| 75th percentile | 43.3 | 47.2 | 41.1 | 29.1 |
| 95th percentile | 68.5 | 62.2 | 58.0 | 43.0 |
| (B) TSP | Graz 1990–2005 | Linz 1990–2007 | Linz 2000–2007 | Vienna 2000–2004 |
| Arithm. mean | 45.8 | - | - | 30.6 |
| Std. dev. | 26.8 | - | - | 16.1 |
| Median | 38.8 | - | - | 27 |
| 5th percentile | 16.6 | - | - | 12 |
| 25th percentile | 27.4 | - | - | 19 |
| 75th percentile | 56.5 | - | - | 39 |
| 95th percentile | 100.2 | - | - | 61 |
| (C) PM10 | Graz 1990–2005 | Linz 1990–2007 | Linz 2000–2007 | Vienna 2000–2004 |
| Arithm. mean | 34.0 | 38.1 | 33.31 | 30.2 |
| Std. dev. | 19.3 | 26.6 | 12.9 | 19.0 |
| Median | 29.1 | 31.9 | 28.2 | 25.6 |
| 5th percentile | 12.4 | 11.1 | 10.5 | 9 |
| 25th percentile | 20.7 | 20.4 | 18.4 | 16.8 |
| 75th percentile | 42.0 | 48.3 | 42.8 | 39.0 |
| 95th percentile | 73.4 | 85.8 | 73.8 | 66.8 |
| (D) PM2.5 | Graz 1990–2005 | Linz 1990–2007 | Linz 2000–2007 | Vienna 2000–2004 |
| Arithm. mean | - | 22.4 | 20.5 | 16.3 |
| Std. dev. | - | 15.0 | 12.9 | 10.5 |
| Median | - | 18.8 | 17.1 | 13.7 |
| 5th percentile | - | 7.1 | 7.1 | 5 |
| 25th percentile | - | 12.5 | 11.7 | 8.9 |
| 75th percentile | - | 27.9 | 25.6 | 20.6 |
| 95th percentile | - | 49.3 | 45.9 | 36.2 |
| (E) End-points | Graz 1990–2005 | Linz 1990–2007 | Linz 2000–2007 | Vienna 2000–2004 |
| Total deaths | 6.9 | 5.6 | 5.4 | 43.9 |
| Cardivasc. | 3.6 | 2.6 | 2.4 | 23.2 |
| Respiratory | 0.3 | 0.4 | 0.4 | 2.3 |
| Ambulance calls | - | - | 15.7 | - |
| Method | GAM | GAM | Case cross-over | GAM |


| Lag 0 day | Lag 1 day | Lag 2 days | |
|---|---|---|---|
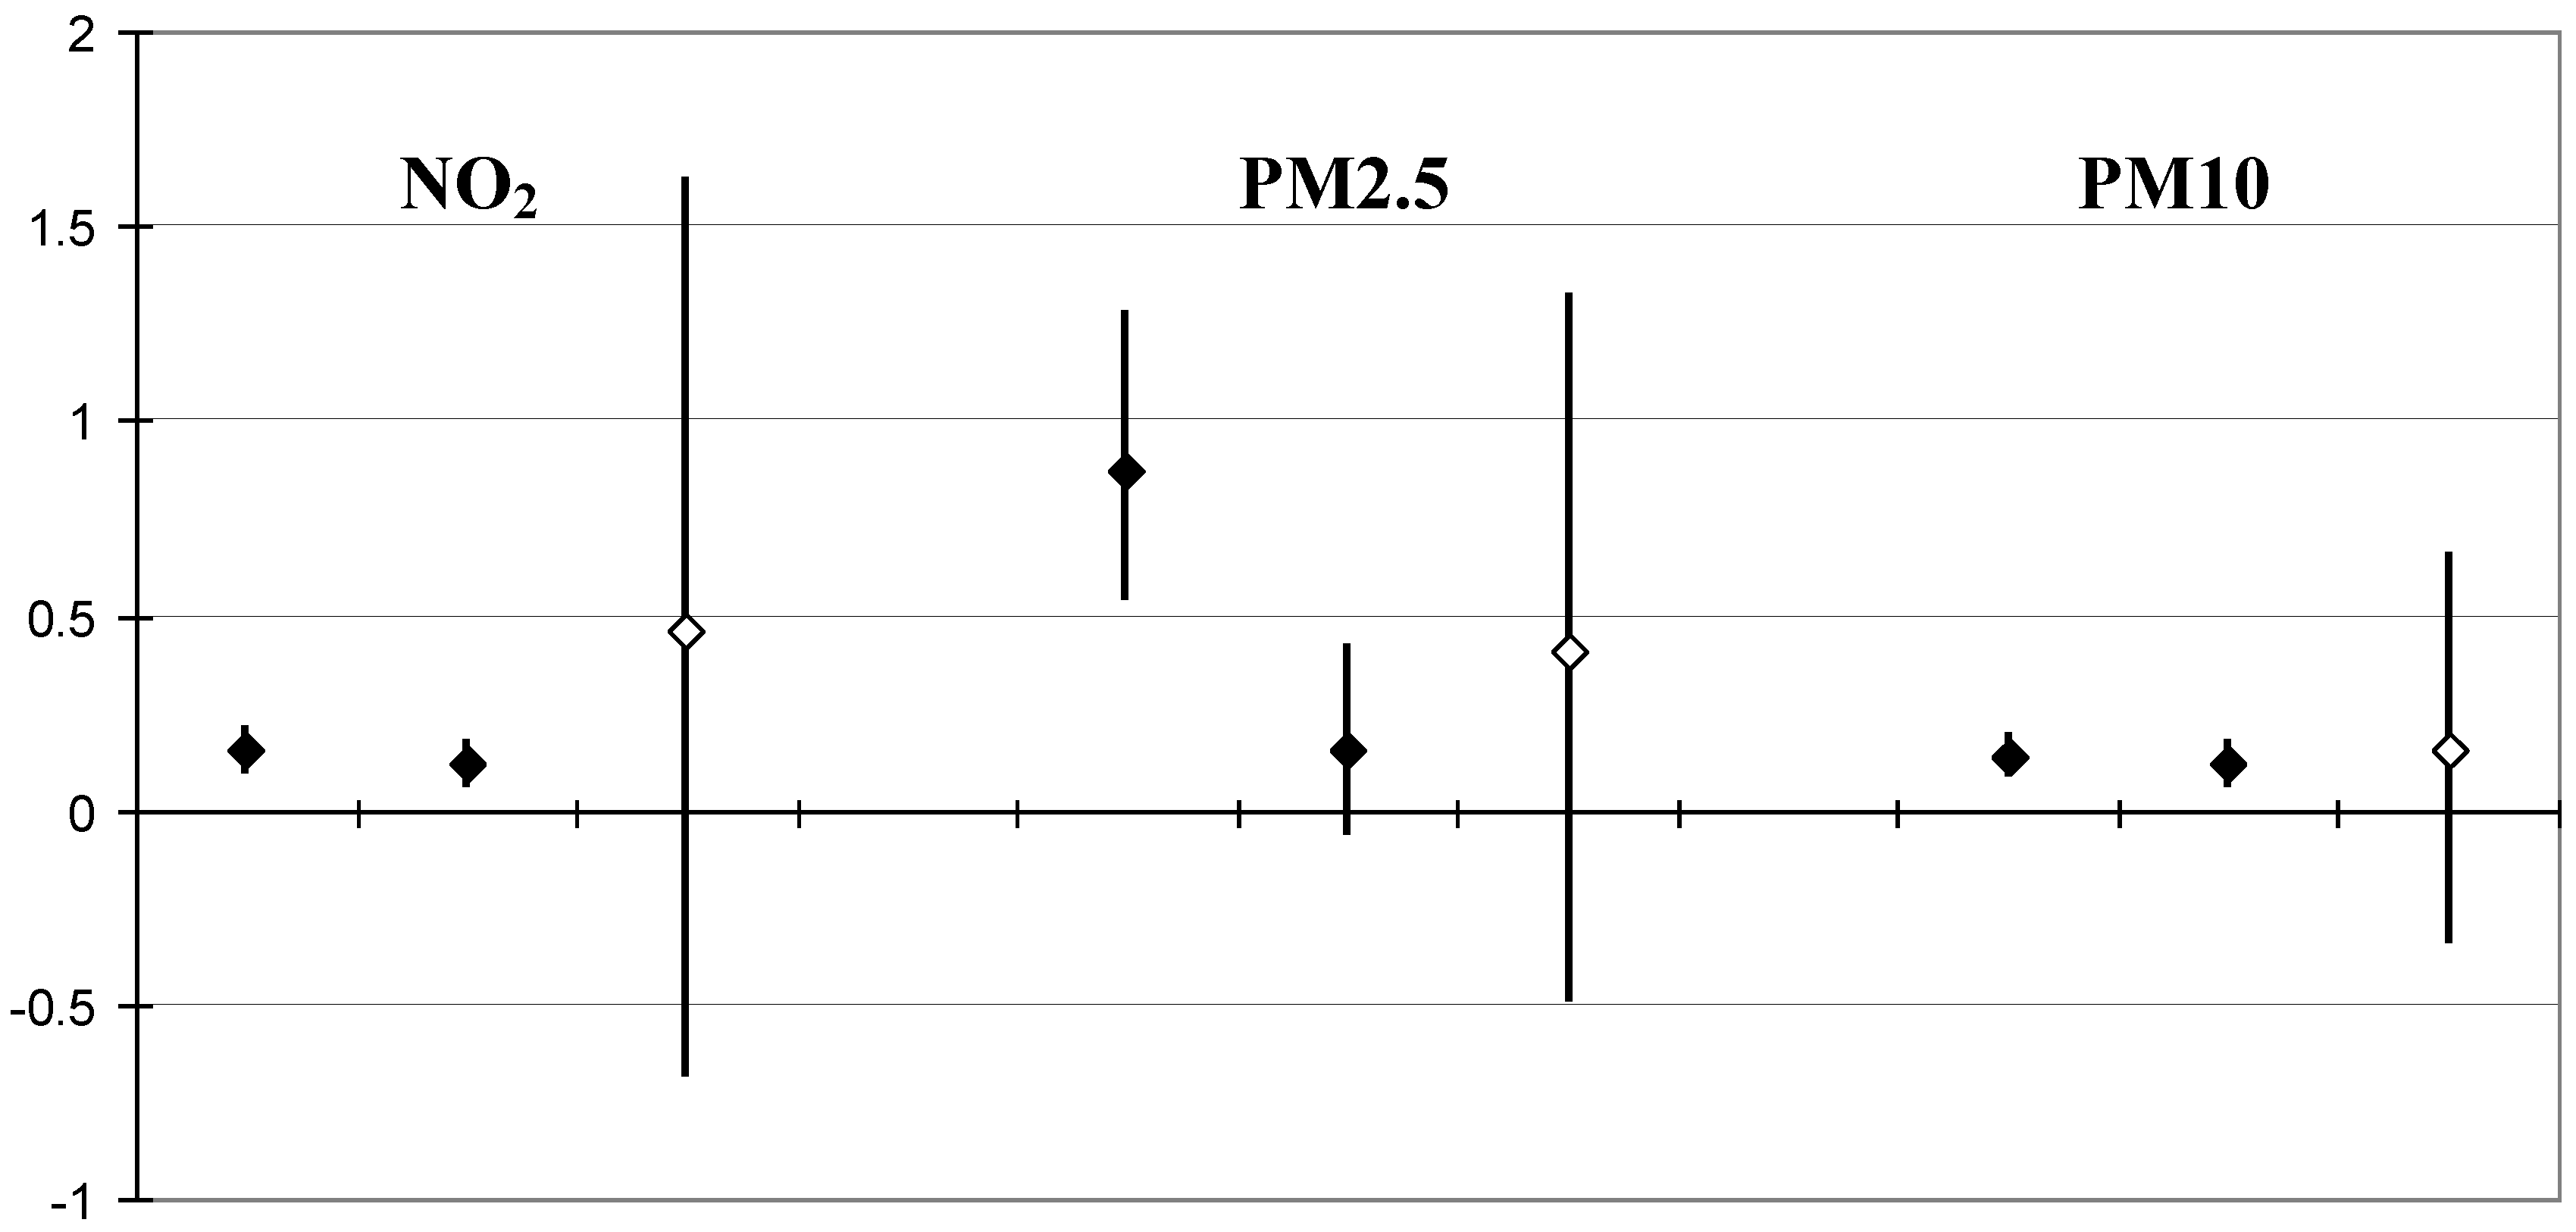
| NO2 | |||
| All cardiopulmonary | 2.0 (0.8; 3.2) | −3.5 (−4.6; −2.4) | - |
| Cardiovascular | 1.2 (−0.4; 2.8) | −4.2 (−5.7; −2.6) | −1.0 (−2.5; 0.6) |
| Respiratory | 2.3 (−0.5; 5.1) | −3.2 (−5.9; −0.6) | 0.3 (−2.4; 3.0) |
| Unclear cause | 3.4 (1.2; 5.6) | −3.2 (−5.3; −1.0) | −0.1 (−2.3; 2.1) |
| PM2.5 | |||
| All cardiopulmonary | 6.1 (4.3; 7.8) | 0.1 (−1.4; 1.7) | |
| Cardiovascular | 7.1 (4.7; 9.4) | 0.3 (−1.8; 2.4) | 2.5 (0.3; 4.7) |
| Respiratory | 2.1 (−2.1; 6.3) | −1.6; −5.2; 2.0) | 1.0 (−2.7; 4.7) |
| Unclear cause | 3.7 (0.4; 7.0) | 0.4 (−2.5; 3.4) | 3.4 (0.3; 6.4) |
| PM10 | |||
| All cardiopulmonary | 1.7 (1.0; 2.3) | 0.0 (−0.6; 0.6) | |
| Cardiovascular | 1.3 (0.9; 2.6) | −0.5 (−0.9; 0.7) | 0.5 (0.1; 1.8) |
| Respiratory | 2.7 (1.2; 4.2) | 1.3 (−0.1; 2.7) | 1.0 (−0.4; 2.5) |
| Unclear cause | 1.6 (0.9; 3.3) | 0.0 (−0.7; 1.6) | 0.9 (0.2; 2.5) |
4. Discussion

5. Conclusions
Acknowledgments
Conflicts of Interest
References
- Samoli, E.; Analitis, A.; Touloumi, G.; Schwartz, J.; Anderson, H.R.; Sunyer, J.; Bisanti, L.; Zmirou, D.; Vonk, J.M.; Pekkanen, J.; et al. Estimating the exposure-response relationships between particulate matter and mortality within the APHEA multicity project. Environ. Health Perspect. 2005, 113, 88–95. [Google Scholar]
- Lambrechtsen, J.; Gerke, O.; Egstrup, K.; Sand, N.P.; Nørgaard, B.L.; Petersen, H.; Mickley, H.; Diederichsen, A.C. The relation between coronary artery calcification in asymptomatic subjects and both traditional risk factors and living in the city centre: A DanRisk substudy. J. Intern. Med. 2012, 271, 444–450. [Google Scholar] [CrossRef]
- Naess, O.; Nafstad, P.; Aamodt, G.; Claussen, B.; Rosland, P. Relation between concentration of air pollution and cause-specific mortality: Four-year exposures to nitrogen dioxide and particulate matter pollutants in 470 neighborhoods in Oslo, Norway. Am. J. Epidemiol. 2007, 165, 435–443. [Google Scholar]
- Nafstad, P.; Haheim, L.L.; Wisloff, T.; Gram, F.; Oftedal, B.; Holme, I.; Hjermann, I.; Leren, P. Urban air pollution and mortality in a cohort of Norwegian Men. Environ. Health Perspect. 2004, 112, 610–615. [Google Scholar] [CrossRef]
- Chen, R.; Samoli, E.; Wong, C.M.; Huang, W.; Wang, Z.; Chen, B.; Kan, H.; CAPES Collaborative Group. Associations between short-term exposure to nitrogen dioxide and mortality in 17 Chinese cities: The China Air Pollution and Health Effects Study (CAPES). Environ. Int. 2012, 45, 32–38. [Google Scholar] [CrossRef]
- Lenters, V.; Uiterwaal, C.S.; Beelen, R.; Bots, M.L.; Fischer, P.; Brunekreef, B.; Hoek, G. Long-term exposure to air pollution and vascular damage in young adults. Epidemiology 2010, 21, 512–520. [Google Scholar] [CrossRef]
- HEI (Health Effects Institute), Revised Analyses of Time-Series Studies of Air Pollution and Health; MA Health Effects Institute: Boston, MA, USA, 2003.
- HEI (Health Effects Institute), Traffic-Related Air Pollution. A Critical Review of the Literature on Emissions, Exposure, and Health Effects; Special Report 17; MA Health Effects Institute: Boston, MA, USA, 2010.
- Samoli, E.; Peng, R.; Ramsay, T.; Pipikou, M.; Touloumi, G.; Dominici, F.; Burnett, R.; Cohen, A.; Krewski, D.; Samet, J.; Katsouyanni, K. Acute effects of ambient particulate matter on mortality in Europe and North America: Results from the APHENA study. Environ. Health Perspect. 2008, 116, 1480–1486. [Google Scholar] [CrossRef]
- Samoli, E.; Touloumi, G.; Zanobetti, A.; Le Tertre, A.; Shindler, C.; Atkinson, R.; Vonk, J.; Rossi, G.; Saez, M.; Rabczenko, D.; et al. Investigating the dose-response relation between air pollution and total mortality in the APHEA-2 multicity project. Occup. Environ. Med. 2003, 60, 977–982. [Google Scholar] [CrossRef]
- Neuberger, M.; Rabczenko, D.; Moshammer, H. Extended effects of air pollution on cardiopulmonary mortality in Vienna. Atmos. Environ. 2007, 41, 8549–8556. [Google Scholar] [CrossRef]
- Neuberger, M.; Schimek, M.G.; Horak, F.; Moshammer, H.; Kundi, M.; Frischer, T.; Gomiscek, B.; Puxbaum, H.; Hauck, H.; AUPHEP-Team. Acute effects of particulate matter on respiratory diseases, symptoms and functions. Epidemiological results of AUPHEP. Atmos. Environ. 2004, 38, 3971–3981. [Google Scholar] [CrossRef]
- Neuberger, M.; Schimek, M.G.; Moshammer, H.; Hauck, H.; Kofler, W. Fine particulates and hospital admissions in Graz, Linz, and Vienna. Atemw. Lungenkrht. 2008, 34, 387–390. (in German). [Google Scholar] [CrossRef]
- Almbauer, R.; Pucher, K.; Sturm, P.J. Air quality modeling for the city of Graz. Meteorol. Atmos. Environ. 2005, 57, 31–42. [Google Scholar] [CrossRef]
- Hauck, H.; Berner, A.; Frischer, T.; Gomiscek, B.; Kundi, M.; Neuberger, M.; Puxbaum, H.; Preining, O.; AUPHEP-Team. Austrian project on health effects of particulates—General overview. Atmos. Environ. 2004, 38, 3905–3915. [Google Scholar] [CrossRef]
- Spangl, W.; Nagl, C. Annual Report of Air Quality Measurements in Austria 2010; (in German). Environment Agency Austria: Vienna, Austria, 2011; pp. 48–53. [Google Scholar]
- Winquist, A.; Klein, M.; Tolbert, P.; Sarnat, S. Power estimation using simulations for air pollution time-series studies. Environ. Health 2012, 11. [Google Scholar] [CrossRef]
- Statistik Austria, Demographic Yearbook 2008; (in German). Statistik Austria: Vienna, Austria, 2009.
- Cakmak, S.; Dales, R.E.; Rubio, M.A.; Vidal, C.B. The risk of dying on days of higher air pollution among the socially disadvantaged elderly. Environ. Res. 2011, 111, 388–393. [Google Scholar] [CrossRef]
- Baccini, M.; Biggeri, A.; Lagazio, C.; Lertxundi, A.; Saez, M. Parametric and semi-parametric approaches in the analysis of short-term effects of air pollution on health. Comput. Statist. Data Anal. 2007, 51, 4324–4336. [Google Scholar] [CrossRef]
- Akaike, H. Information theory as an extension of the maximum likelihood principle. In Proceedings of the Second International Symposium on Information Theory; Petrov, B.N., Csaki, B.F., Eds.; Akademiai Kiado: Budapest, Hungary, 1973; pp. 267–281. [Google Scholar]
- Gasparrini, A.; Armstrong, B. Time series analysis on the health effects of temperature: Advancements and limitations. Environ. Res. 2010, 110, 633–638. [Google Scholar] [CrossRef]
- Goldberg, M.S.; Gasparrini, A.; Armstrong, B.; Valois, M.-F. The short-term influence of temperature on daily mortality in the temperate climate of Montreal, Canada. Environ. Res. 2011, 111, 853–860. [Google Scholar] [CrossRef]
- Carracedo-Martínez, E.; Taracido, M.; Tobias, A.; Saez, M.; Figueiras, A. Case-Crossover Analysis of Air Pollution Health Effects: A Systematic Review of Methodology and Application. Environ. Health Perspect. 2010, 181, 1173–1182. [Google Scholar]
- Schwartz, J. The effects of particulate air pollution on daily deaths: A multi-city case crossover analysis. Occup. Environ. Med. 2004, 61, 956–961. [Google Scholar] [CrossRef]
- Schwartz, J. How sensitive is the association between ozone and daily deaths to control for temperature? Am. J. Respir. Crit. Care Med. 2005, 171, 627–631. [Google Scholar] [CrossRef]
- Zanobetti, A.; Schwartz, J. Air pollution and emergency admissions in Boston, MA. J. Epidemiol. Community Health 2006, 60, 890–895. [Google Scholar]
- Scheers, H.; Mwalili, S.M.; Faes, C.; Fierens, F.; Nemery, B.; Nawrot, T.S. Does air pollution trigger infant mortality in Western Europe? A case-crossover study. Environ. Health Perspect. 2011, 119, 1017–1022. [Google Scholar] [CrossRef] [Green Version]
- Zheng, S.; Wang, M.; Wang, S.; Tao, Y.; Shang, K. Short-Term Effects of Gaseous Pollutants and Particulate Matter on Daily Hospital Admissions for Cardio-Cerebrovascular Disease in Lanzhou: Evidence from a Heavily Polluted City in China. Int. J. Environ. Res. Public Health 2013, 10, 462–477. [Google Scholar] [CrossRef]
- Zhang, F.; Li, L.; Krafft, T.; Lv, J.; Wang, W.; Pei, D. Study on the Association between Ambient Air Pollution and Daily Cardiovascular and Respiratory Mortality in an Urban District of Beijing. Int. J. Environ. Res. Public Health 2011, 8, 2109–2123. [Google Scholar] [CrossRef]
- Allen, R.W.; Davies, H.; Cohen, M.A.; Mallach, G.; Kaufman, J.D.; Adar, S.D. The spatial relationship between traffic-generated air pollution and noise in 2 US cities. Env. Res. 2009, 109, 334–342. [Google Scholar] [CrossRef]
- Klimont, J.; Kytir, J.; Leitner, B. Austrian Health Survey 2006/2007; (in German). Statistik Austria: Vienna, Austria, 2007. [Google Scholar]
- Ballester, F.; Medina, S.; Boldo, E.; Goodman, P.; Neuberger, M.; Iñiguez, C.; Künzli, N. Reducing ambient levels of fine particulates could substantially improve health: A mortality impact assessment for 26 European cities. J. Epidemiol. Community Health 2008, 62, 98–105. [Google Scholar] [CrossRef]
- WHO (World Health Organisation), Air Quality Guidelines for Particulate Matter, Ozone, Nitrogen Dioxide and Sulfur Dioxide—Global Update 2005—Summary of Risk Assessment; World Health Organisation: Geneva, Switzerland, 2006.
- Giechaskiel, B.; Mamakos, A.; Andersson, J.; Dilara, P.; Martini, G.; Schindler, W.; Bergmann, A. Measurement of Automotive Nonvolatile Particle Number Emissions within the European Legislative Framework: A Review. Aerosol Sci. Technol. 2012, 46, 719–749. [Google Scholar] [CrossRef]
- Kurz, C.; Sturm, P. Examination of the NO2 and PM10 Contamination in the Urban Area of Linz; (in German). Graz University of Technology: Graz, Austria, 2011. [Google Scholar]
- Kreindl, J.; Hager, W. Air Quality Data in 2010; Report 2/2011; (in German). Municipality of Linz, Environmental & Technical Center: Linz, Austria, 2011. [Google Scholar]
- Öttl, D. Modelling. Primary PM10 Concentrations for the City of Graz, Austria; Air Quality Department of Styria: Graz, Austria, 2008. [Google Scholar]
- Gehring, U.; Heinrich, J.; Kramer, U.; Grote, V.; Hochadel, M.; Sugiri, D.; Kraft, M.; Rauchfuss, K.; Eberwein, H.G.; Wichmann, H.E. Long-Term Exposure to Ambient Air Pollution and Cardiopulmonary Mortality in Women. Epidemiology 2006, 17, 545–551. [Google Scholar] [CrossRef]
- Hoek, G.; Brunekreef, B.; Goldbohm, S.; Fischer, P.; van den Brandt, P.A. Association between mortality and indicators of traffic-related air pollution in the Netherlands: A cohort study. Lancet 2002, 360, 1203–1209. [Google Scholar]
- Rosenbloom, J.I.; Wilker, E.H.; Mukamal, K.J.; Schwartz, J.; Mittleman, M.J. Residential proximity to major roadway and 10-Year all-cause mortality after myocardial infarction. Circulation 2012, 125, 2197–2203. [Google Scholar]
- Bluhm, G.; Eriksson, C. Cardiovascular effects of environmental noise: Research in Sweden. Noise Health 2011, 13, 212–216. [Google Scholar] [CrossRef]
- Goodman, P.G.; Dockery, D.W.; Clancy, L. Cause-specific mortality and the extended effects of particulate pollution and temperature exposure. Environ. Health Perspect. 2004, 112, 179–185. [Google Scholar] [CrossRef]
- Moshammer, H.; Hutter, H.-P.; Kundi, M. Which metric of ambient ozone to predict daily mortality? Atmos. Environ. 2013, 65, 171–176. [Google Scholar] [CrossRef]
- Kurz, C.; Orthofer, R.; Sturm, P.; Kaiser, A.; Uhrner, U.; Reifeltshammer, R. Projection of the air quality in Vienna between 2005 and 2020 for NO2 and PM10. In Proceedings of the 8th International Conference on Air Quality, Athens, Greece, 19-23 March 2012; p. 104.
- Dons, E.; Panis, L.I.; Van Poppel, M.; Theunis, J.; Wets, G. Personal exposure to Black Carbon in transport microenvironments. Atmos. Environ. 2012, 55, 392–398. [Google Scholar] [CrossRef]
- Janssen, N.A.H.; Gerlofs-Nijland, M.E.; Lanki, T.; Salonen, R.O.; Cassee, F.; Hoek, G. Health Effects of Black Carbon; WHO Regional Office for Europe: Copenhagen, Denmark, 2012. [Google Scholar]
- Wang, Y.; Hopke, P.K.; Chalupa, D.C.; Utell, M.J. Long-term study of urban ultrafine particles and other pollutants. Atmos. Environ. 2011, 45, 7672–7680. [Google Scholar] [CrossRef]
Supplemental Materials
| (A) Vienna | Lag 0–1 day | Lag 0–7 days | Lag 0–14 days |
|---|---|---|---|
| NO2 | |||
| All deaths | 0.8 (0.0; 1.6) | 2.1 (0.8; 3.5) | 2.9 (1.6; 4.1) |
| Cardiovascular | 0.7 (−0.4; 1.8) | 3.1 (1.2; 5.0) | 4.6 (2.9; 6.3) |
| Ischemic heart | 0.4 (−1.2; 1.9) | 2.8 (0.3; 5.3) | 4.5 (2.4; 6.6) |
| Other heart | 1.6 (−1.1; 4.5) | 4.6 (0.4; 9.1) | 3.9 (0.4; 7.6) |
| Cerebrovascular | 1.0 (−1.7; 3.9) | 2.4 (−1.8; 6.7) | 4.4 (0.8; 8.2) |
| Respiratory | 2.3 (−0.6; 5.2) | 5.7 (1.1; 10.6) | 6.7 (2.7; 10.8) |
| COPD | 1.9 (−2.4; 6.4) | 9.9 (3.0; 17.3) | 8.9 (3.0; 15.2) |
| TSP | |||
| All deaths | 0.3 (−0.3; 0.9) | 0.9 (−0.0; 1.9) | 0.8 (0.0; 1.6) |
| Cardiovascular | 0.3 (−0.5; 1.2) | 1.6 (0.3; 3.0) | 1.7 (0.7; 2.8) |
| Ischemic heart | 0.8 (−0.4; 2.1) | 2.6 (0.8; 4.5) | 3.4 (1.9; 4.9) |
| Other heart | 0.3 (−1.8; 2.4) | 0.9 (−2.2; 4.1) | −1.3 (−3.7; 1.2) |
| Cerebrovascular | 0.1 (−2.0; 2.3) | 0.9 (−2.3; 4.1) | 1.7 (−0.9; 4.3) |
| Respiratory | 2.3 (0.0; 4.7) | 3.7 (0.1; 7.4) | 2.7 (−0.1; 5.6) |
| COPD | 3.6 (0.2; 7.1) | 8.5 (3.1; 14.2) | 5.0 (0.7; 9.4) |
| PM2.5 | |||
| All deaths | 0.5 (−0.6; 1.5) | 1.8 (−0.0; 3.7) | 2.6 (1.1; 4.1) |
| Cardiovascular | 0.4 (−1.0; 1.8) | 2.7 (0.3; 5.2) | 3.8 (1.9; 5.8) |
| Ischemic heart | 1.0 (−1.0; 3.1) | 3.8 (0.6; 7.1) | 5.5 (3.0; 8.1) |
| Other heart | 0.9 (−2.6; 4.6) | 3.0 (−2.2; 8.5) | 1.5 (−2.5; 5.7) |
| Cerebrovascular | 0.4 (−3.2; 4.1) | 2.7 (−2.7; 8.4) | 4.9 (0.7; 9.3) |
| Respiratory | 3.9 (0.1; 7.8) | 7.0 (0.9; 13.4) | 6.4 (1.9; 11.2) |
| COPD | 6.4 (0.6; 12.5) | 14.0 (4.9; 24.0) | 9.0 (1.9; 16.6) |
| PM10 | |||
| All deaths | 0.2 (−0.4; 0.7) | 0.9 (−0.1; 1.9) | 1.2 (0.4; 2.1) |
| Cardiovascular | −0.2 (−0.6; 1.0) | 1.4 (0.1; 2.8) | 2.0 (0.9; 3.1) |
| Ischemic heart | 0.4 (−0.7; 1.6) | 2.1 (0.4; 3.9) | 3.2 (1.8; 4.6) |
| Other heart | 0.4 (−1.5; 2.4) | 1.3 (−1.6; 4.3) | −0.1 (−2.4; 2.2) |
| Cerebrovascular | 0.3 (−1.6; 2.4) | 1.4 (−1.6; 4.4) | 2.6 (0.3; 5.0) |
| Respiratory | 2.1 (0.0; 4.2) | 3.5 (0.1; 6.9) | 3.0 (0.5; 5.5) |
| COPD | 3.5 (0.4; 6.7) | 7.9 (3.0; 12.9) | 5.1 (1.3; 9.1) |
| (B) Graz | Lag 0–1 day | Lag 0–7 days | Lag 0–14 days |
| NO2 | |||
| All deaths | 1.2 (0.3; 2.2) | 2.0 (1.2; 2.9) | 2.6 (2.0; 3.1) |
| 65+ | 1.6 (−0.6; 3.8) | 2.0 (1.1; 2.9) | 1.9 (1.3; 2.5) |
| Before 65 | 1.2 (0.1; 2.3) | 2.6 (0.7; 4.5) | 2.5 (1.2; 3.9) |
| Male | 1.3 (0; 2.7) | 2.4 (1.2; 3.7) | 3.2 (2.3; 4.1) |
| Female | 1.1 (−0.2; 2.4) | 1.8 (0.7; 2.9) | 2.1 (1.3; 2.9) |
| Cardiovascular | 0.3 (−1.1; 1.7) | 1.9 (0.7; 3.0) | 2.4 (1.6; 3.2) |
| Ischemic heart | 0.5 (−1.6; 2.7) | 2.9 (1.1; 4.8) | 4.0 (2.7; 5.4) |
| COPD | 7.8 (2.2; 13.7) | 10.8 (5.9; 16.0) | 13.9 (10.3; 17.5) |
| Respiratory | 6.2 (1.7; 11.0) | 8.1 (4.1; 12.2) | 12.3 (9.5; 15.2) |
| TSP | |||
| All deaths | 0.9 (0.4; 1.5) | 1.2 (0.7; 1.7) | 1.2 (0.9; 1.5) |
| 65+ | 1.1 (−0.1; 2.3) | 1.2 (0.7; 1.7) | 0.1 (−0.3; 0.4) |
| Before 65 | 0.9 (0.3; 1.5) | 1.4 (0.3; 2.4) | 0.9 (0.2; 1.6) |
| Male | 1.1 (0.3; 1.9) | 1.5 (0.8; 2.2) | 1.5 (1.1; 2.0) |
| Female | 0.8 (0; 1.5) | 1.1 (0.5; 1.7) | 1.1 (0.6; 1.5) |
| Cardiovascular | 1.2 (0.5; 2.0) | 1.9 (1.2; 2.5) | 0.9 (0.4; 1.3) |
| Ischemic heart | 1.3 (0.1; 2.6) | 2.6 (1.5; 3.6) | 3.1 (2.4; 3.8) |
| COPD | 2.9 (−0.1; 6.0) | 3.7 (0.9; 6.4) | 4.0 (2.1; 5.9) |
| Respiratory | 1.9 (−0.6; 4.5) | 2.4 (0.2; 4.7) | 3.7 (2.2; 5.3) |
| PM10 | |||
| All deaths | 1.3 (0.5; 2.1) | 1.5 (0.9; 2.2) | 1.6 (1.1; 2.0) |
| 65+ | 1.3 (−0.4; 3.1) | 1.5 (0.8; 2.2) | 0.3 (−0,1; 0.8) |
| Before 65 | 1.3 (0.4; 2.2) | 1.8 (0.4; 3.3) | 1.5 (0.5; 2.5) |
| Male | 1.4 (0.2; 2.5) | 1.8 (0.8; 2.8) | 2.0 (1.4; 2.7) |
| Female | 1.2 (0.1; 2.3) | 1.5 (0.6; 2.3) | 1.3 (0.8; 1.9) |
| Cardiovascular | 1.6 (0.6; 2.7) | 2.5 (1.6; 3.4) | 1.0 (0.4; 1.7) |
| Ischemic heart | 2.0 (0.2; 3.8) | 3.7 (2.3; 5.2) | 4.3 (3.2; 5.3) |
| COPD | 3.5 (−0.8; 7.9) | 4.3 (0.6; 8.2) | 4.6 (2.1; 7.2) |
| Respiratory | 2.8 (−0.8; 6.4) | 3.4 (0.4; 6.5) | 5.6 (3.5; 7.8) |
| (C) Linz | Lag 0–1 day | Lag 0–7 days | Lag 0–14 days |
| NO2 | |||
| All deaths | 0.5 (−0.7; 1.6) | 2.0 (1.1; 3.0) | 1.5 (0.9; 2.2) |
| Cardiovascular | 0.1 (−1.5; 1.7) | 2.3 (0.9; 3.7) | 2.4 (1.5; 3.4) |
| Ischemic heart | 1.0 (−1.4; 3.4) | 3.8 (1.7; 5.9) | 2.5 (1.0; 3.9) |
| COPD | 1.1 (−4.1; 6.7) | 1.1 (−3.6; 6.0) | 1.5 (0.8; 2.3) |
| Respiratory | 1.9 (−2.3; 6.3) | 2.4 (−1.1; 6.0) | 2.5 (1.5; 3.5) |
| 65 + | 0.4 (−0.9; 1.7) | 2.0 (0.9; 3.1) | 1.5 (0.7; 2.2) |
| Male | 1.2 (−0.3; 2.7) | 2.0 (0.6; 3.4) | 1.8 (0.8; 2.8) |
| Female | 0.0 (1.5; 1.5) | 1.9 (0.6; 3.1) | 1.9 (1.0; 2.8) |
| PM2.5 | |||
| All deaths | 0.4 (−0.5; 1.3) | 0.8 (0.1; 1.6) | 1.2 (0.7; 1.7) |
| Cardiovascular | 0.5 (−0.7; 5.9) | 1.8 (0.7; 2.9) | 3.3 (2.5; 4.1) |
| Ischemic heart | 0.6 (−1.4; 2.6) | 2.1 (0.4; 3.8) | 2.0 (0.9; 3.2) |
| COPD | 1.3 (−2.9; 5.6) | 0.3 (−3.5; 4.4) | 1.3 (0.8; 1.9) |
| Respiratory | 2.5 (−0.7; 5.9) | 2.1 (−0.8; 5.0) | 3.6 (2.8; 4.3) |
| 65 + | 0.7 (−0.4; 1.7) | 1.2 (0.3; 2.0) | 1.4 (0.9; 2.0) |
| Male | 0.4 (−0.8; 1.6) | 0.5 (−0.6; 1.6) | 0.8 (0.1; 1.6) |
| Female | 0.0 (−1.2; 1.2) | 0.6 (−0.4; 1.7) | 0.7 (0.0; 1.4) |
| PM10 | |||
| All deaths | 0.2 (−0.3; 0.7) | 0.4 (0.0; 0.9) | 0.6 (0.4; 0.9) |
| Cardiovascular | 0.3 (−0.4; 1.0) | 1.1 (0.5; 1.7) | 2.0 (1.5; 2.4) |
| Ischemic heart | 0.4 (−0.7; 1.5) | 1.3 (0.4; 2.3) | 1.3 (0.7; 2.0) |
| COPD | 0.4 (−2.0; 2.8) | 0.0 (−2.2; 2.2) | 0.8 (0.5; 1.1) |
| Respiratory | 1.1 (−0.8; 2.9) | 1.0 (−0.6; 2.6) | 2.1 (1.7; 2.5) |
| 65 + | 0.3 (−0.3; 0.8) | 0.7 (0.2; 1.1) | 0.9 (0.6; 1.2) |
| Male | 0.1 (−0.6; 0.8) | 0.2 (−0.4; 0.8) | 0.3 (−0.1; 0.7) |
| Female | 0.1 (−0.5; 0.8) | 0.6 (0.0; 1.2) | 0.7 (0.4; 1.1) |

© 2013 by the authors; licensee MDPI, Basel, Switzerland. This article is an open access article distributed under the terms and conditions of the Creative Commons Attribution license (http://creativecommons.org/licenses/by/3.0/).
Share and Cite
Neuberger, M.; Moshammer, H.; Rabczenko, D. Acute and Subacute Effects of Urban Air Pollution on Cardiopulmonary Emergencies and Mortality: Time Series Studies in Austrian Cities. Int. J. Environ. Res. Public Health 2013, 10, 4728-4751. https://doi.org/10.3390/ijerph10104728
Neuberger M, Moshammer H, Rabczenko D. Acute and Subacute Effects of Urban Air Pollution on Cardiopulmonary Emergencies and Mortality: Time Series Studies in Austrian Cities. International Journal of Environmental Research and Public Health. 2013; 10(10):4728-4751. https://doi.org/10.3390/ijerph10104728
Chicago/Turabian StyleNeuberger, Manfred, Hanns Moshammer, and Daniel Rabczenko. 2013. "Acute and Subacute Effects of Urban Air Pollution on Cardiopulmonary Emergencies and Mortality: Time Series Studies in Austrian Cities" International Journal of Environmental Research and Public Health 10, no. 10: 4728-4751. https://doi.org/10.3390/ijerph10104728