Indoor and Outdoor Monitoring of Volatile Organic Compounds in School Buildings: Indicators Based on Health Risk Assessment to Single out Critical Issues

 ,
,
Abstract
:1. Introduction
2. Experimental Section
2.1. Sampling Sites

| Monitored sites | Kind of school | Description |
|---|---|---|
| School 1 | Middle school | Located in a central area |
| Surrounded by residential and commercial buildings | ||
| Proximity to a trafficated road | ||
| Use of interactive whiteboards | ||
| School 2 | Middle school | Located in a suburban area |
| Surrounded by residential and buildings | ||
| Use of blackboard with chalk | ||
| School 3 | Middle school | Located in a suburban area |
| Surrounded by residential buildings and fallow fields | ||
| Presence of a garden | ||
| Use of blackboard with chalk | ||
| School 4 | Middle school | Located in a suburban area |
| Surrounded by residential buildings | ||
| Presence of a garden | ||
| Use of blackboard with chalk | ||
| School 5 | Elementary school | Located in a central area |
| Surrounded by residential and commercial buildings | ||
| Proximity to a trafficated road | ||
| Use of interactive whiteboards | ||
| School 6 | Elementary school | Located in a central area |
| Surrounded by residential and commercial buildings | ||
| Proximity to a trafficated road | ||
| Use of blackboard with chalk | ||
| School 7 | Elementary school | Located in a suburban area |
| Surrounded by residential and commercial buildings | ||
| Use of blackboard with chalk | ||
| School 8 | Elementary school | Located in a suburban area |
| Surrounded by residential and commercial buildings | ||
| Use of blackboard with chalk |
2.2. Sampling and Analytical Method
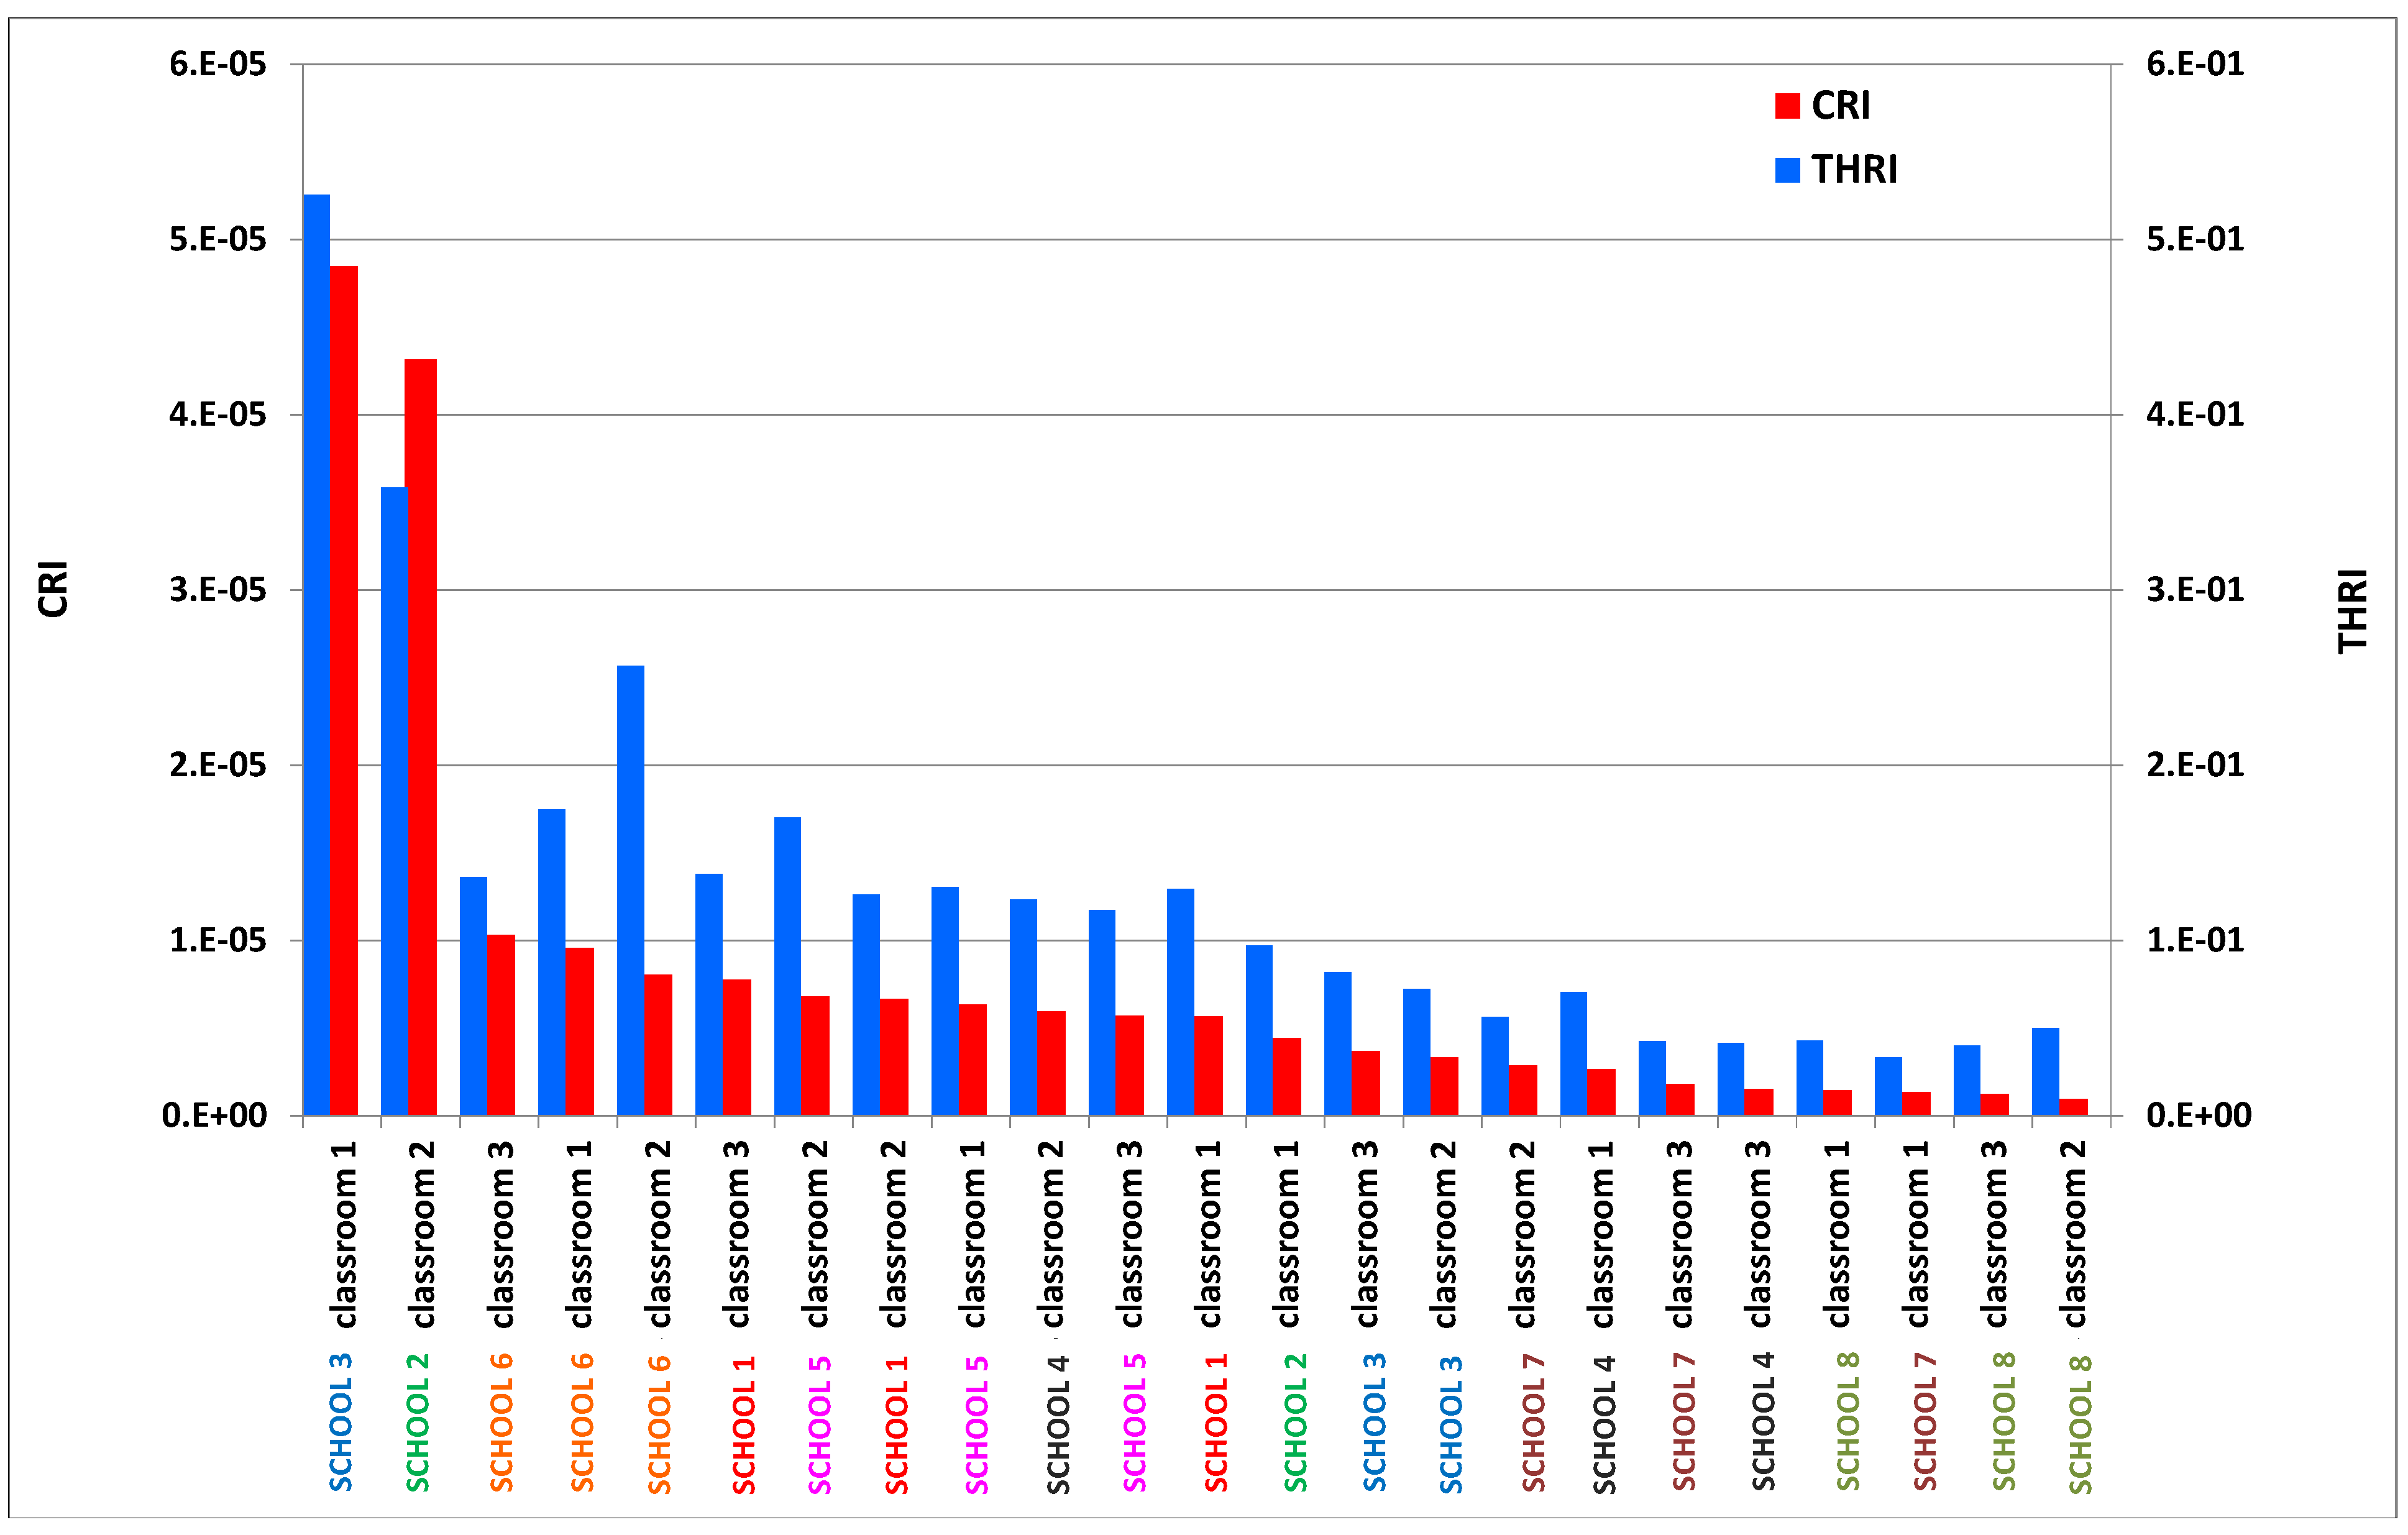
2.3. Integrated Indicators for IAQ Based on Health Risk Assessment
2.3.1. IAQ Cancer Risk Indicator (CRI)
| Compound | UNIT RISK (µg/m3) | SOURCE |
|---|---|---|
| Benzene | 7.80*10-6 | IRIS |
| Ethyl-benzene | 2.50*10-6 | CALEPA |
| 1,4-Dichlorobenzene | 1.10*10-5 | CALEPA |
| Tetrachloroethylene | 2.60*10-7 | IRIS |
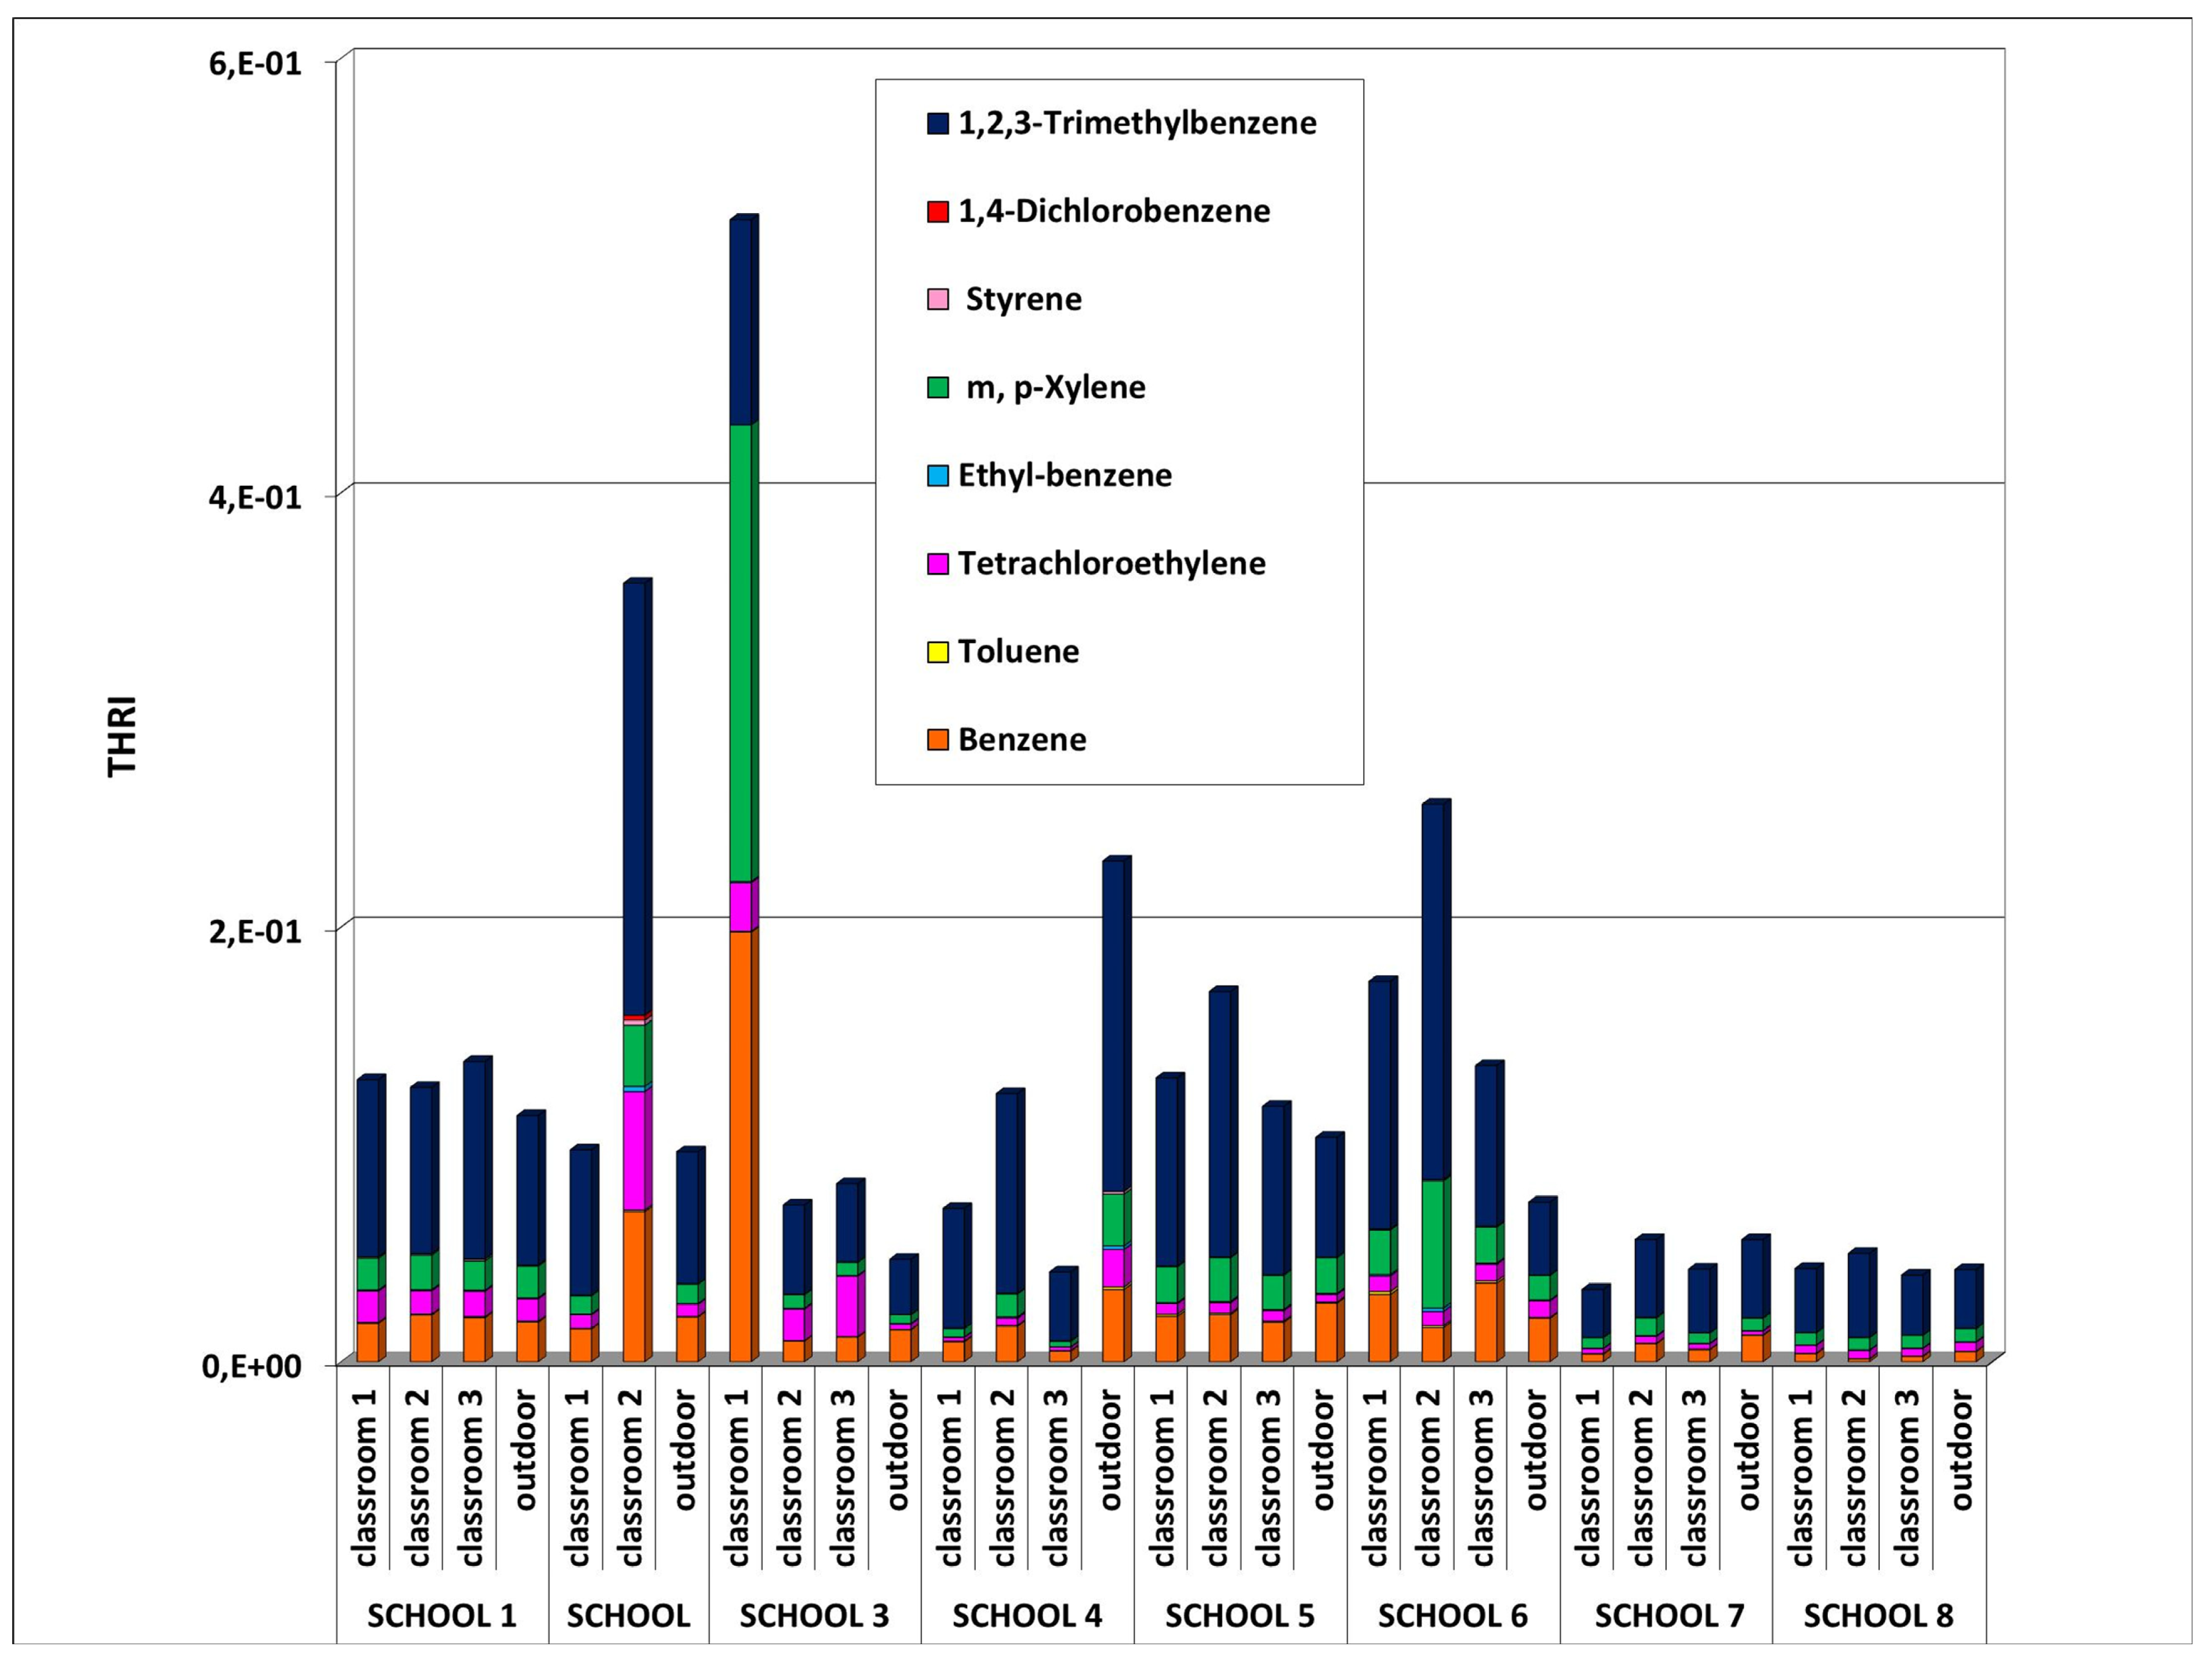
2.3.2. IAQ Total Hazard Ratio Indicator (THRI)
| Compound | REFERENCE CONCENTRATION (µg/m3) | SOURCE |
|---|---|---|
| Benzene | 30 | IRIS |
| Toluene | 5,000 | IRIS |
| Tetrachloroethylene | 40 | IRIS |
| Ethyl-benzene | 1,000 | IRIS |
| m-Xylene | 100 | IRIS |
| Styrene | 1,000 | IRIS |
| 1,4-Dichlorobenzene | 800 | IRIS |
| 1,2,3-Trimethylbenzene | 5,000 | PPRTV |
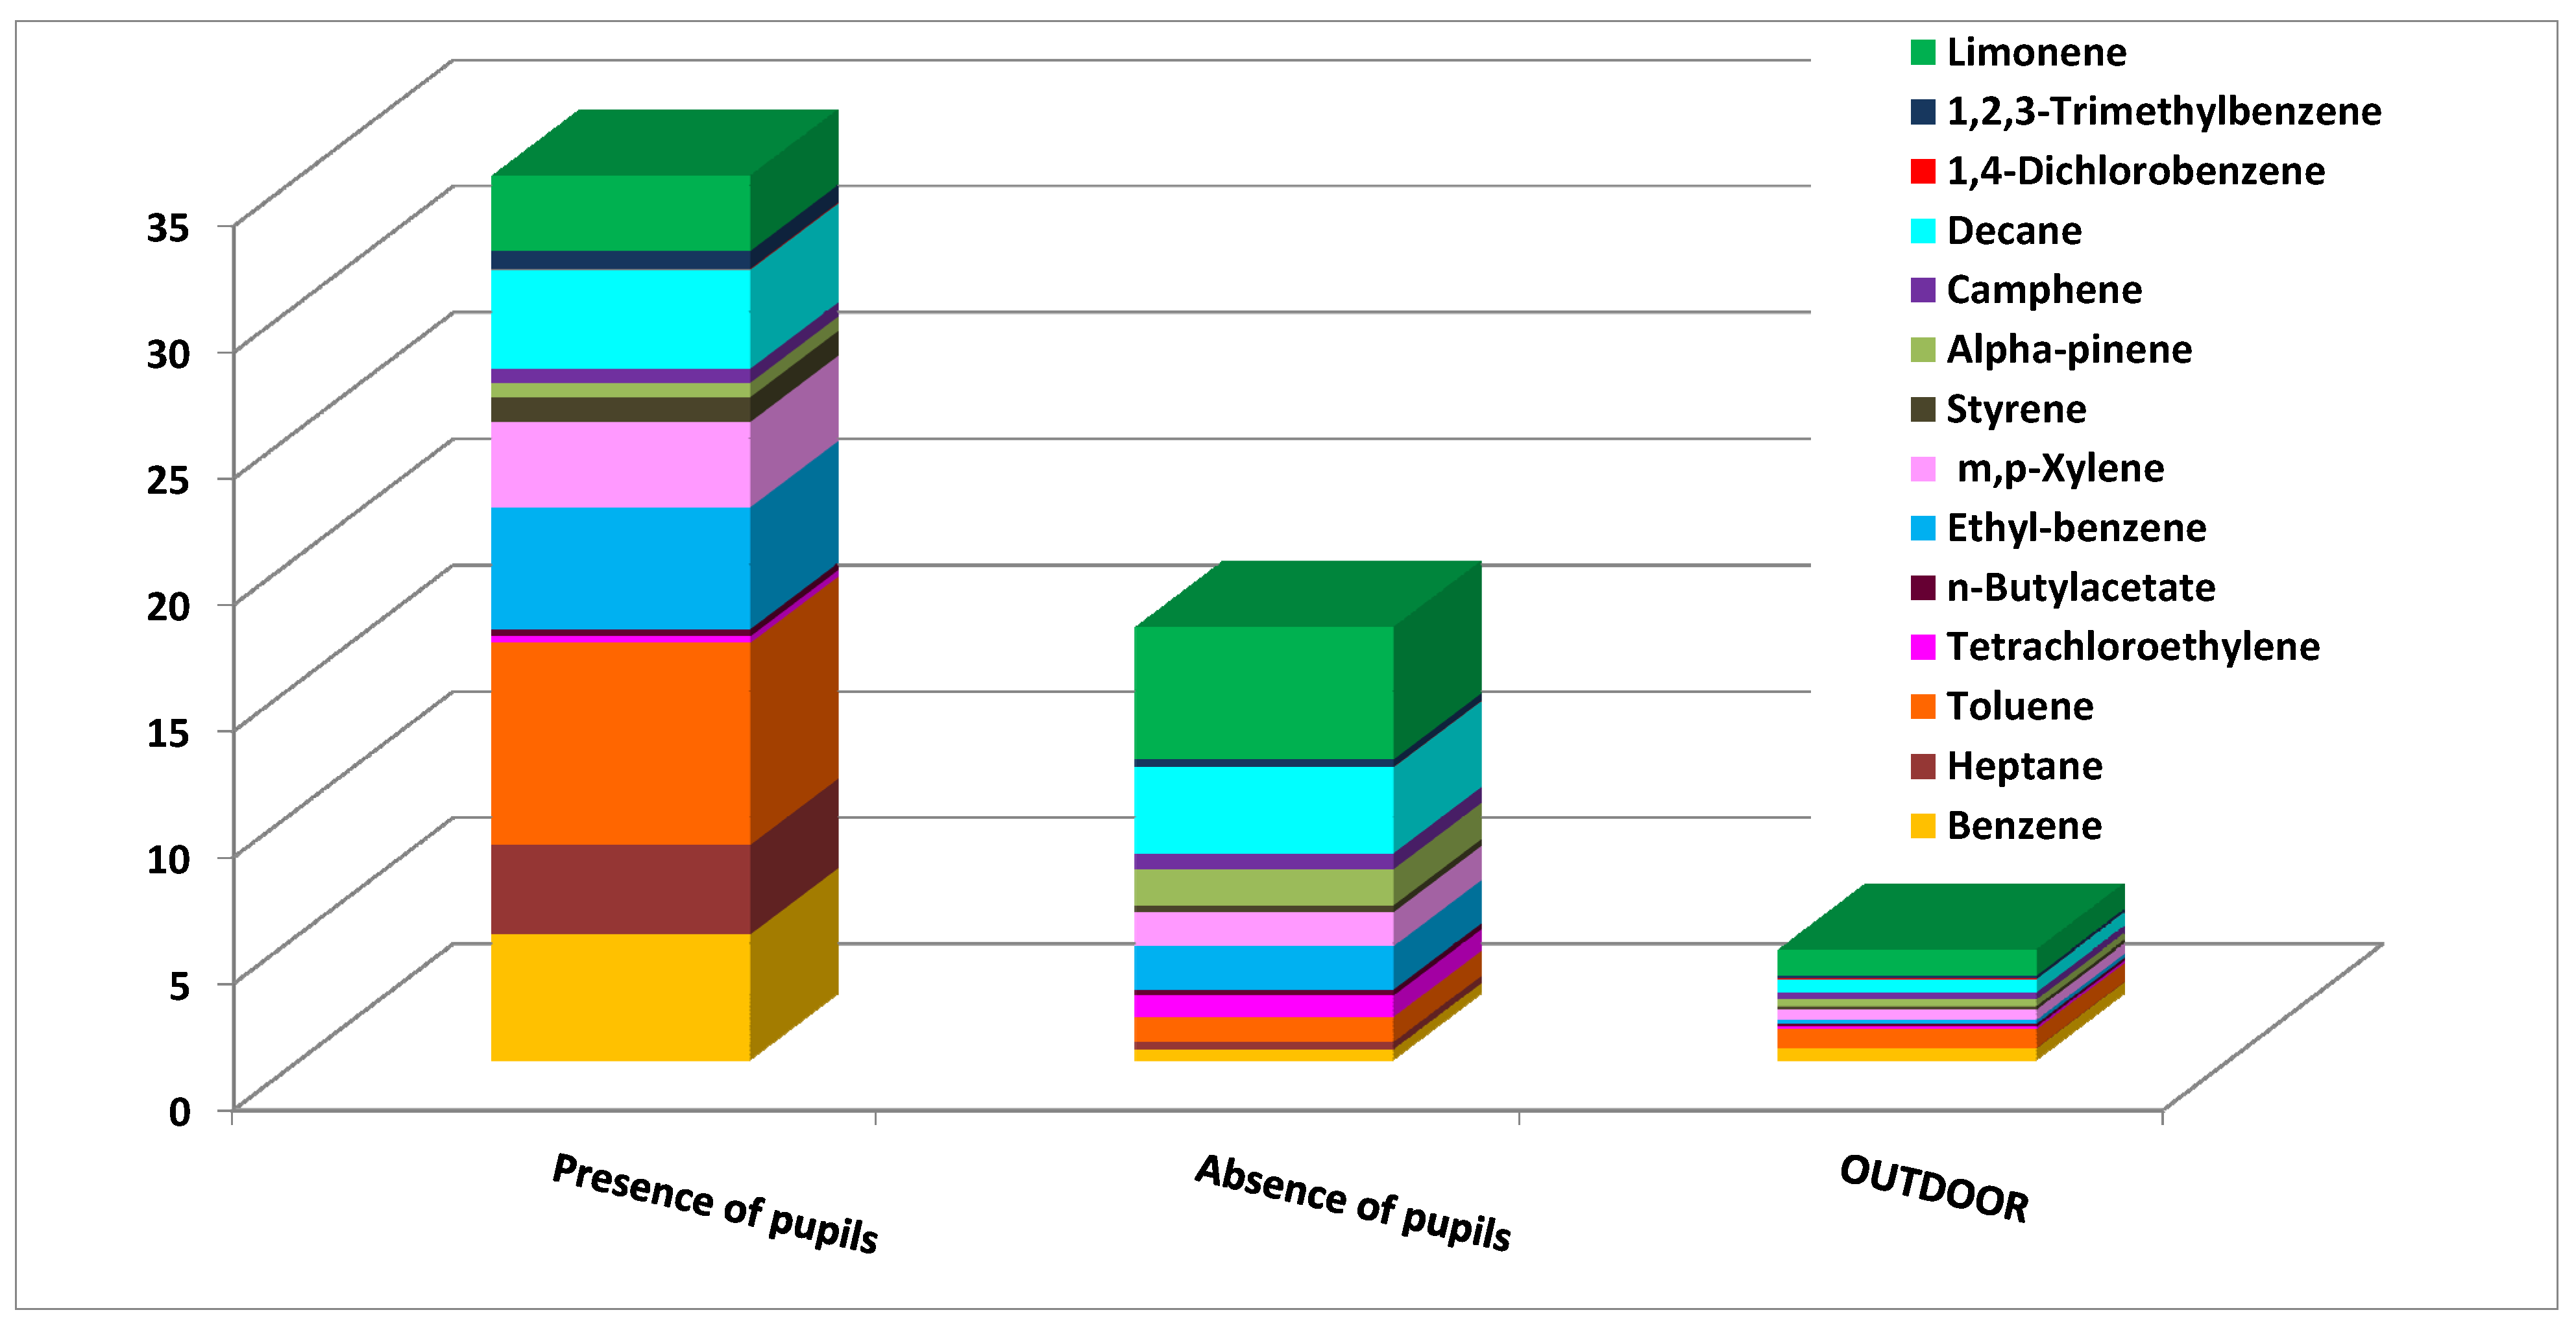
3. Results and Discussion
| Compounds | Concentration µg/m3 | |||||||||||||||||||||||
|---|---|---|---|---|---|---|---|---|---|---|---|---|---|---|---|---|---|---|---|---|---|---|---|---|
| School 1 | School 2 | School 3 | School 4 | School 5 | School 6 | School 7 | School 8 | |||||||||||||||||
| Indoor | Outdoor | Indoor | Outdoor | Indoor | Outdoor | Indoor | Outdoor | Indoor | Outdoor | Indoor | Outdoor | Indoor | Outdoor | Indoor | Outdoor | |||||||||
| Min | Max | Min | Max | Min | Max | Min | Max | Min | Max | Min | Max | Min | Max | Min | Max | |||||||||
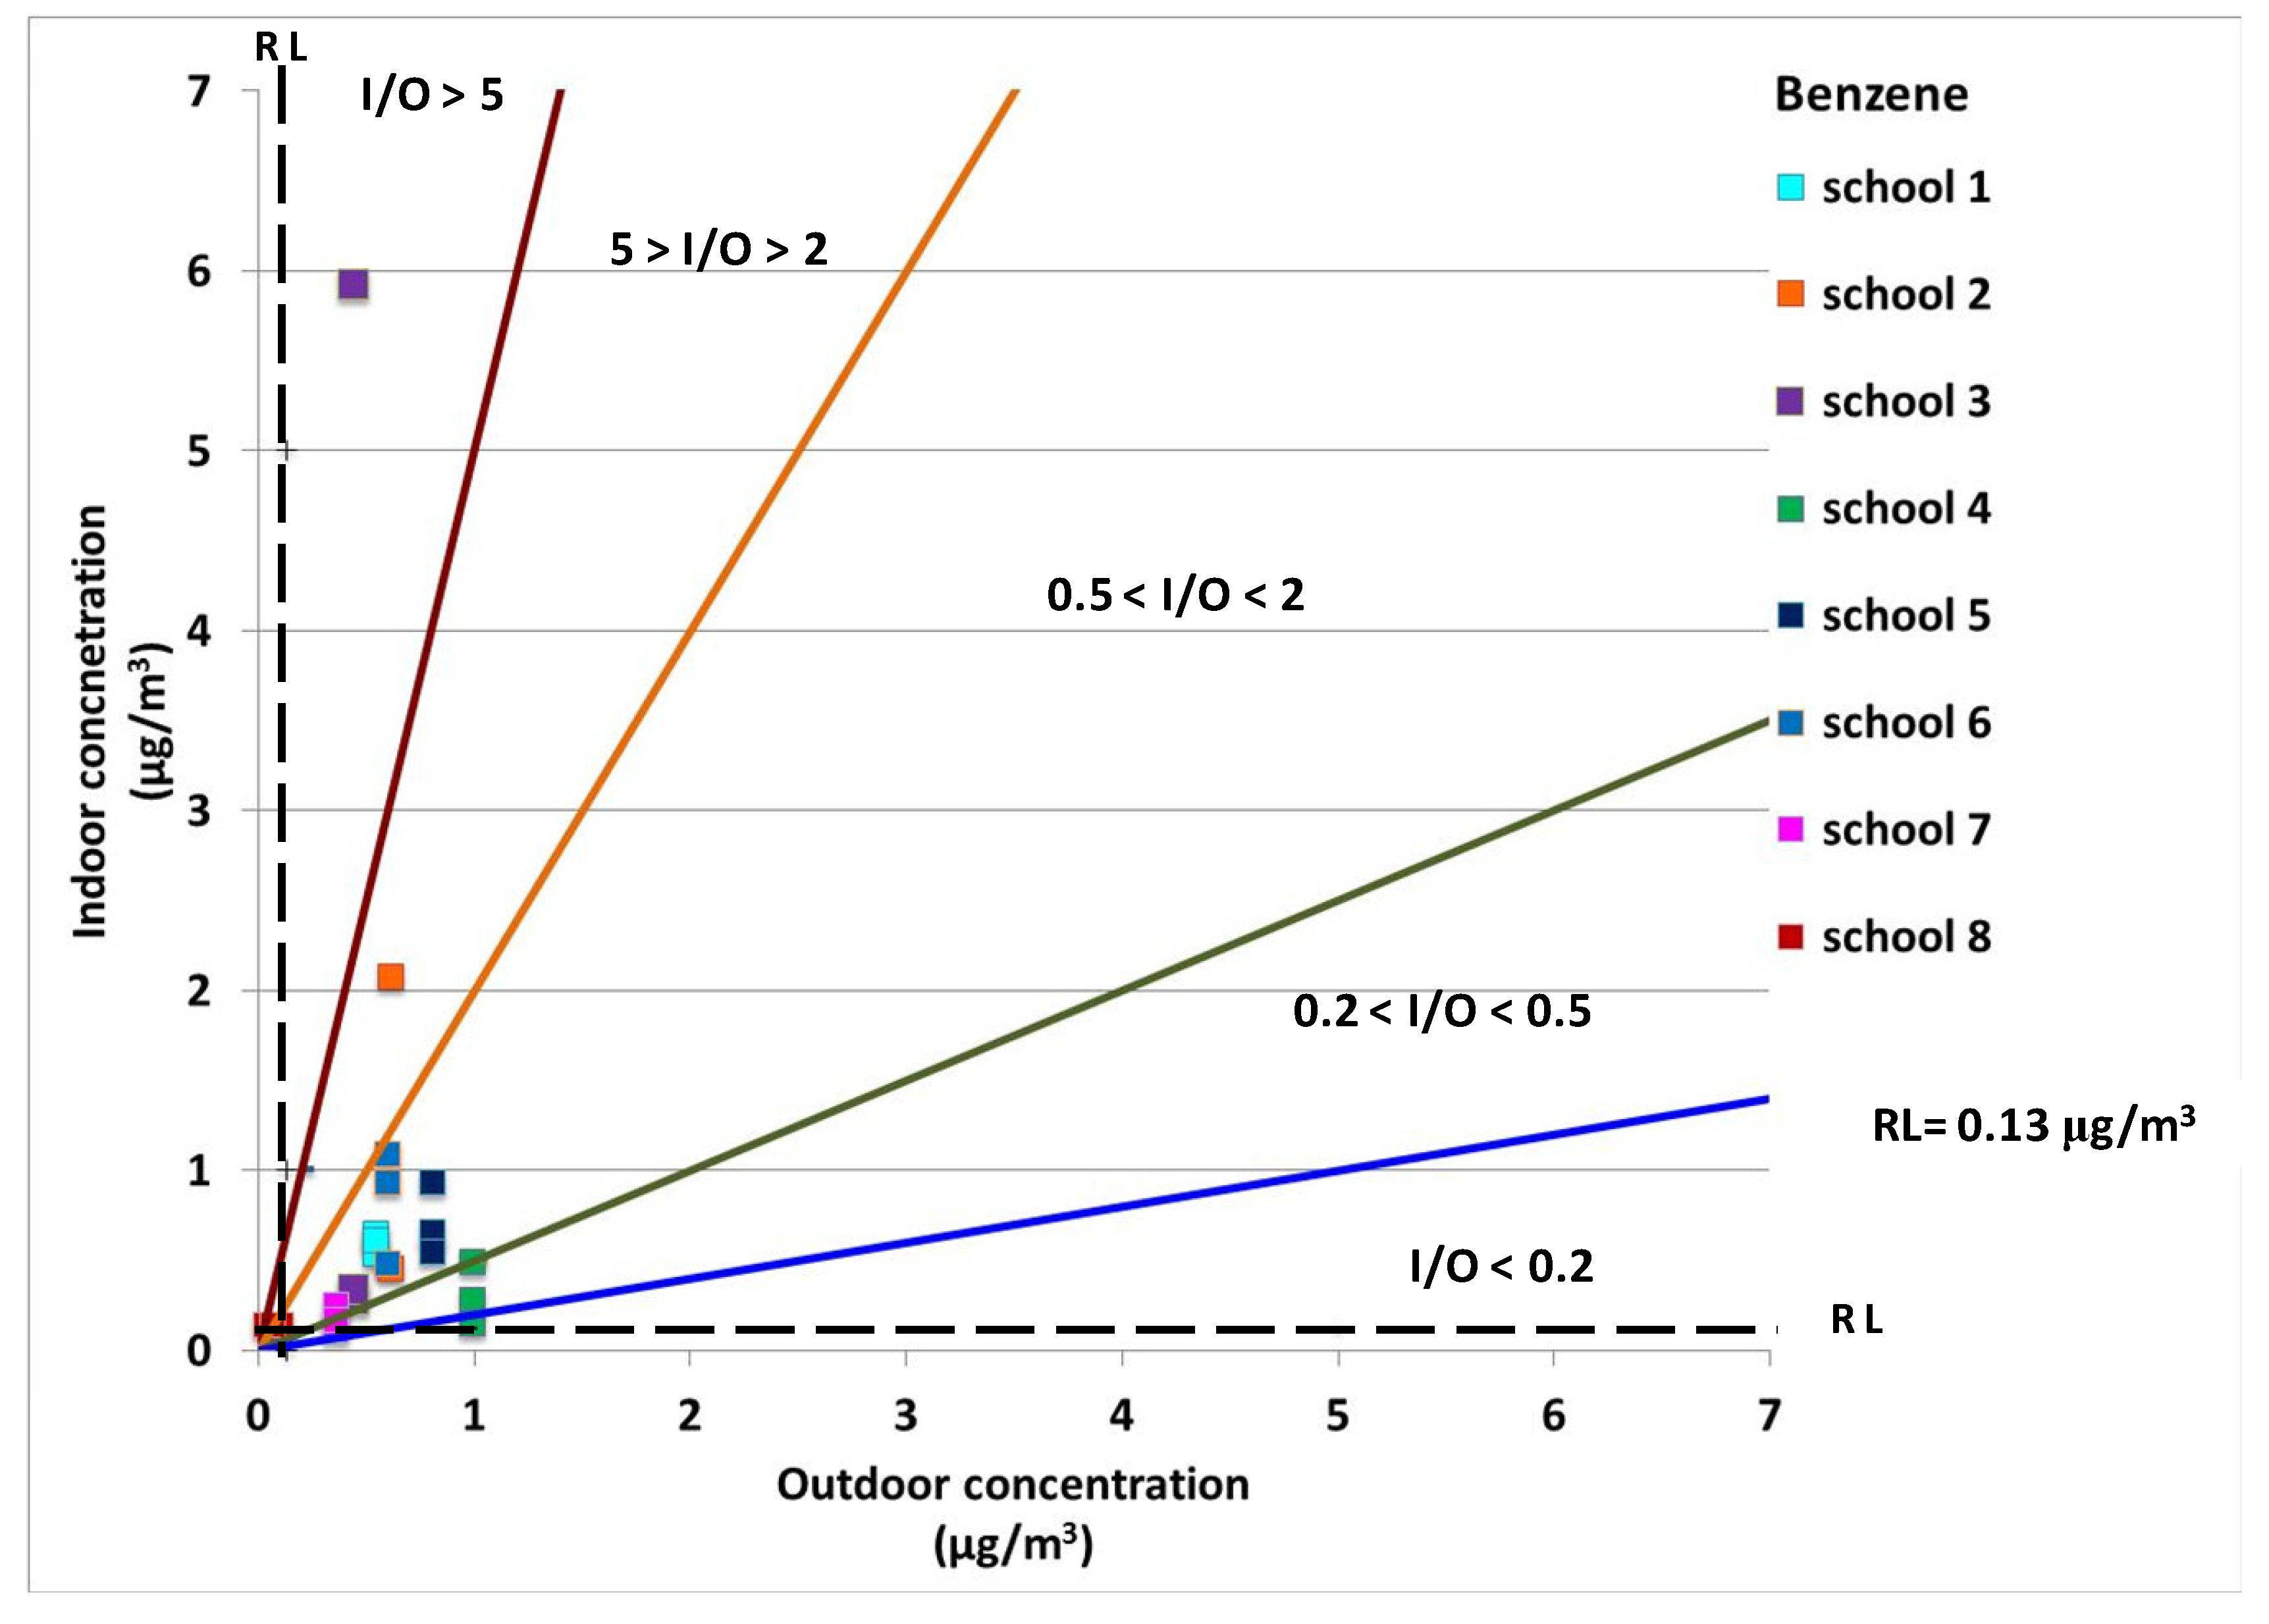
| Benzene | 0.53 | 0.65 | 0.55 | 0.45 | 2.07 | 0.62 | 0.29 | 5.93 | 0.44 | 0.15 | 0.49 | 1.00 | 0.55 | 0.65 | 0.81 | 0.47 | 1.09 | 0.60 | 0.11 | 0.25 | 0.37 | 0.04 | 0.11 | 0.14 |
| Heptane | 0.47 | 1.46 | 0.14 | 0.86 | 4.58 | 0.07 | 0.21 | 3.22 | 0.02 | 0.11 | 0.17 | 0.42 | 0.33 | 3.13 | 0.16 | 0.38 | 5.36 | 0.10 | 0.32 | 0.89 | 0.09 | 0.05 | 0.06 | 0.10 |
| Toluene | 1.88 | 2.26 | 2.06 | 1.16 | 3.70 | 1.29 | 1.08 | 1.72 | 0.73 | 1.33 | 1.54 | 5.62 | 2.55 | 4.84 | 2.47 | 4.12 | 6.81 | 1.63 | 0.73 | 0.97 | 0.73 | 0.83 | 0.86 | 0.83 |
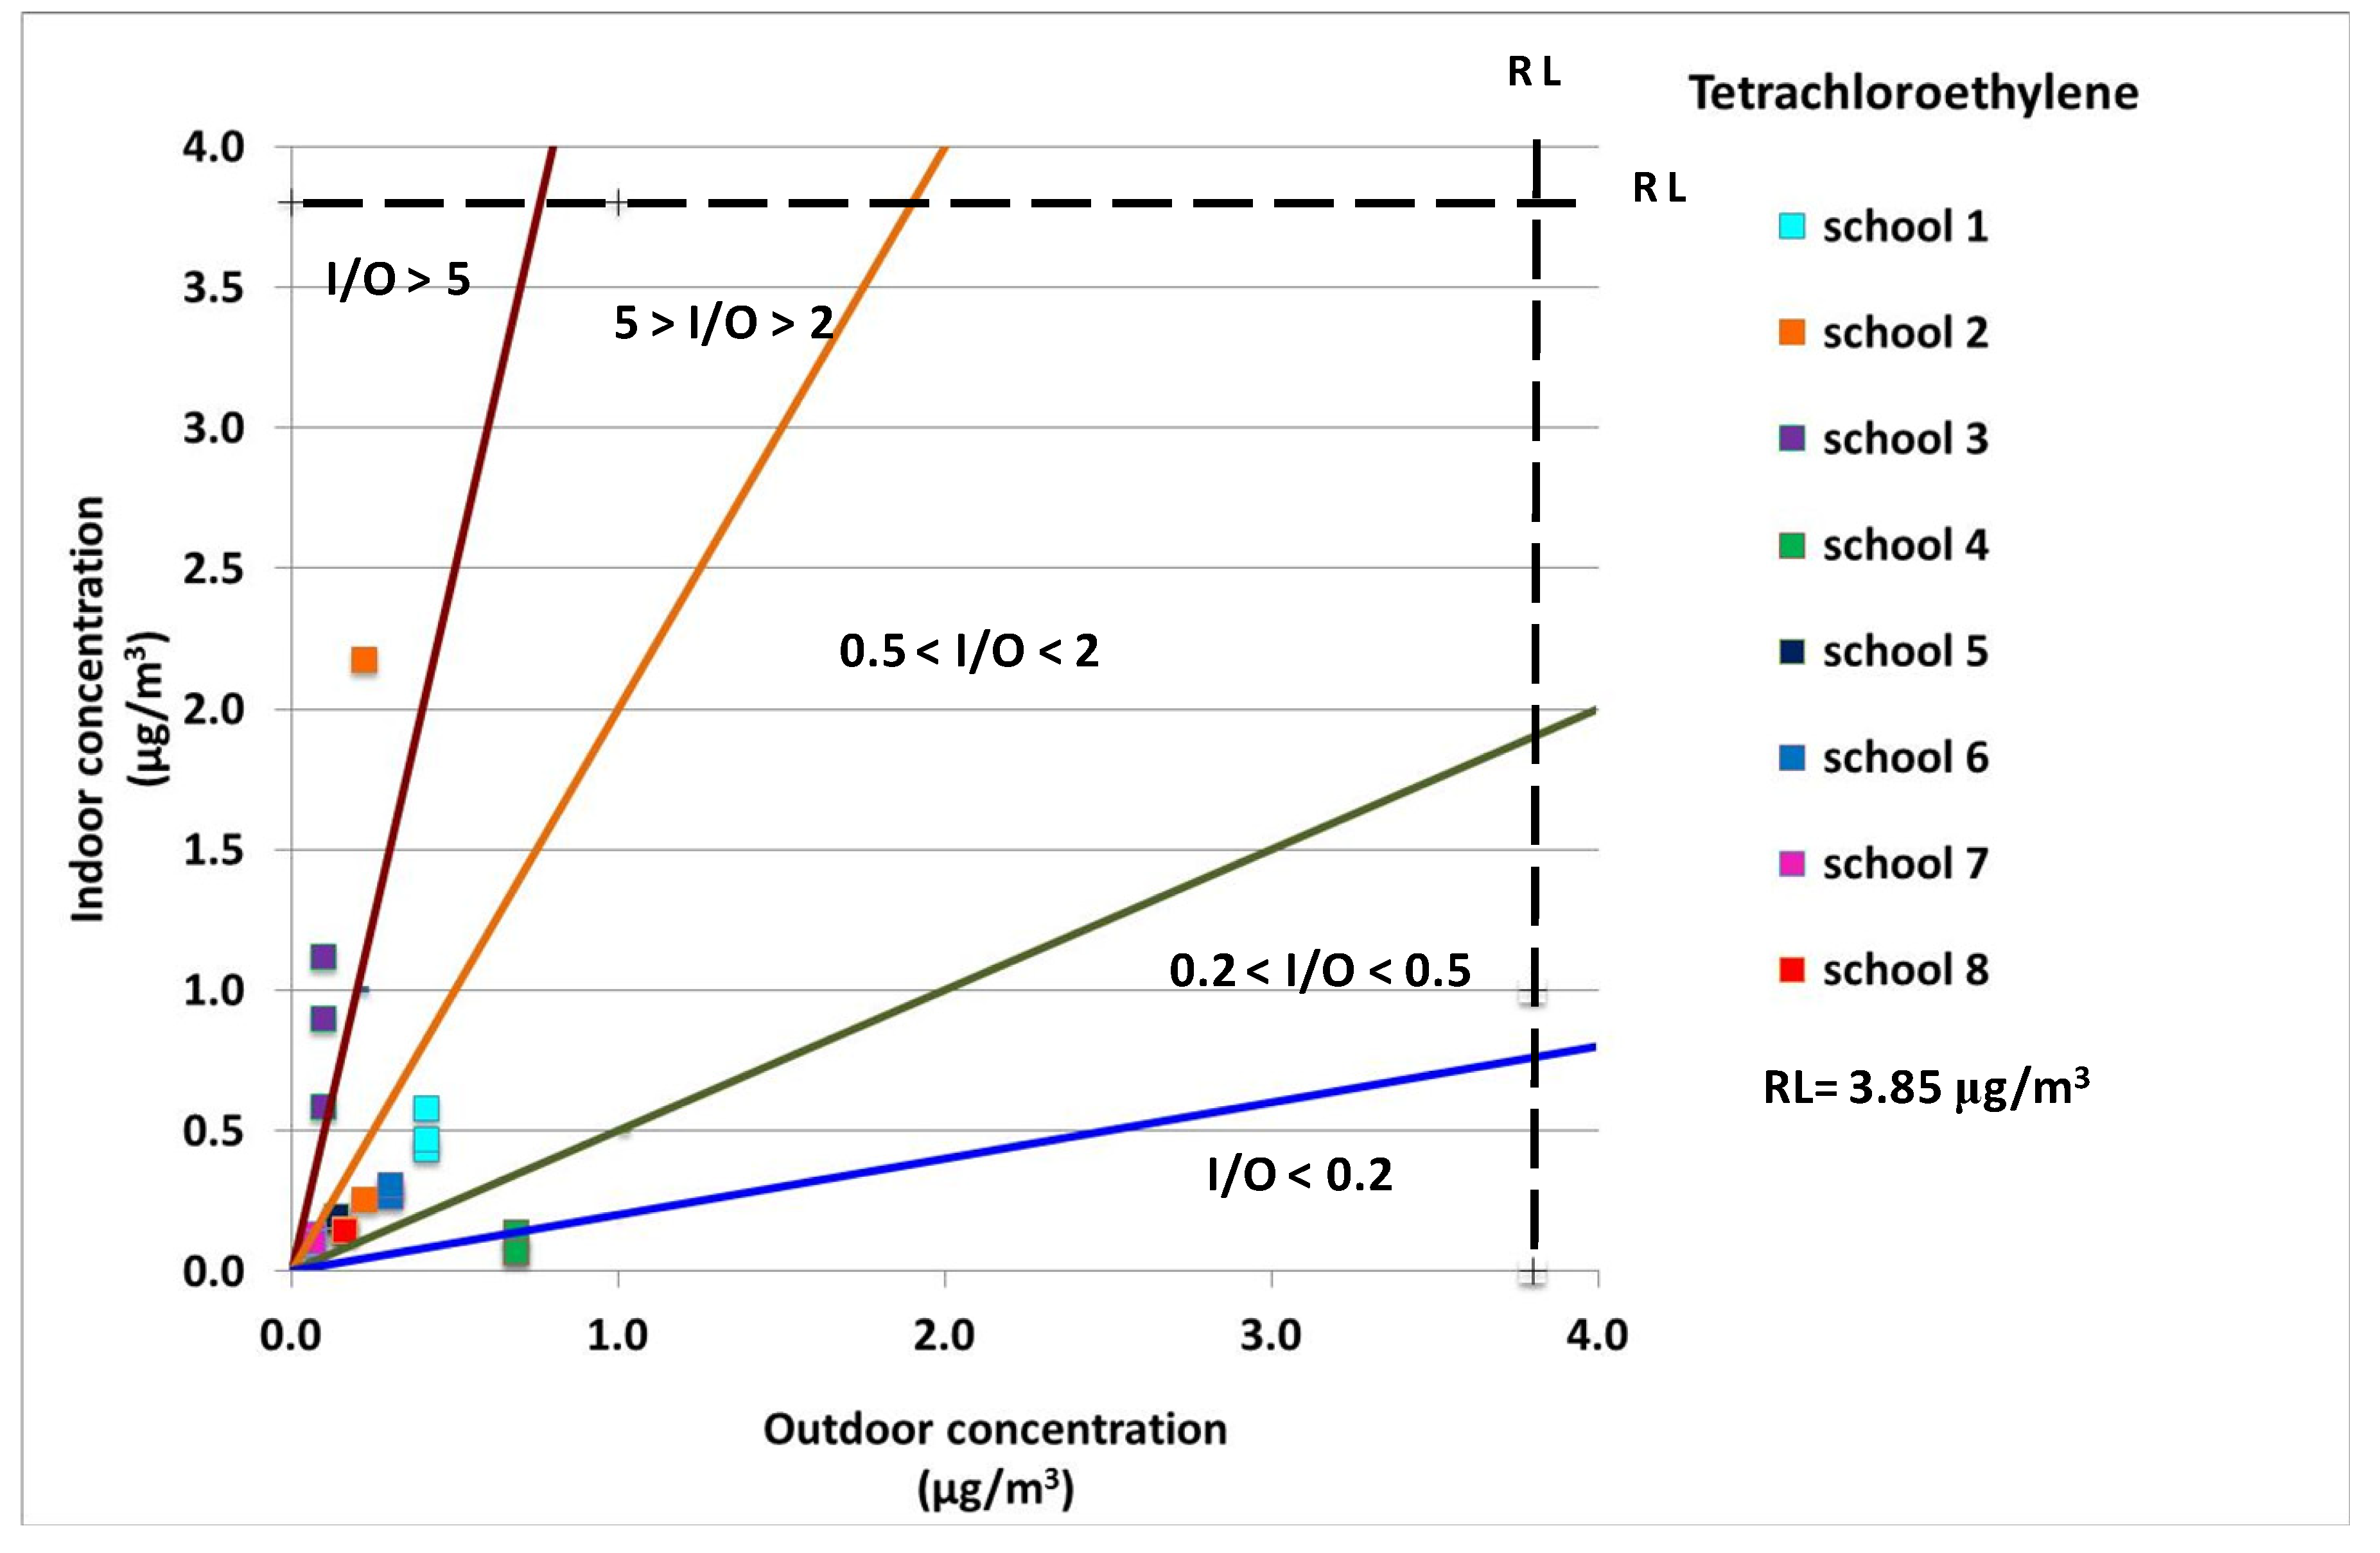
| Tetrachloroethylene | 0.43 | 0.58 | 0.41 | 0.25 | 2.17 | 0.23 | 0.58 | 1.11 | 0.10 | 0.07 | 0.13 | 0.69 | 0.19 | 0.19 | 0.14 | 0.26 | 0.31 | 0.31 | 0.09 | 0.13 | 0.07 | 0.14 | 0.15 | 0.17 |
| n-Butylacetate | 0.55 | 0.86 | 0.52 | 0.32 | 2.60 | 0.18 | 0.36 | 0.39 | 0.12 | 0.26 | 0.39 | 2.23 | 0.85 | 1.08 | 0.98 | 0.48 | 0.70 | 0.59 | 0.19 | 0.29 | 0.11 | 0.19 | 1.01 | 0.12 |
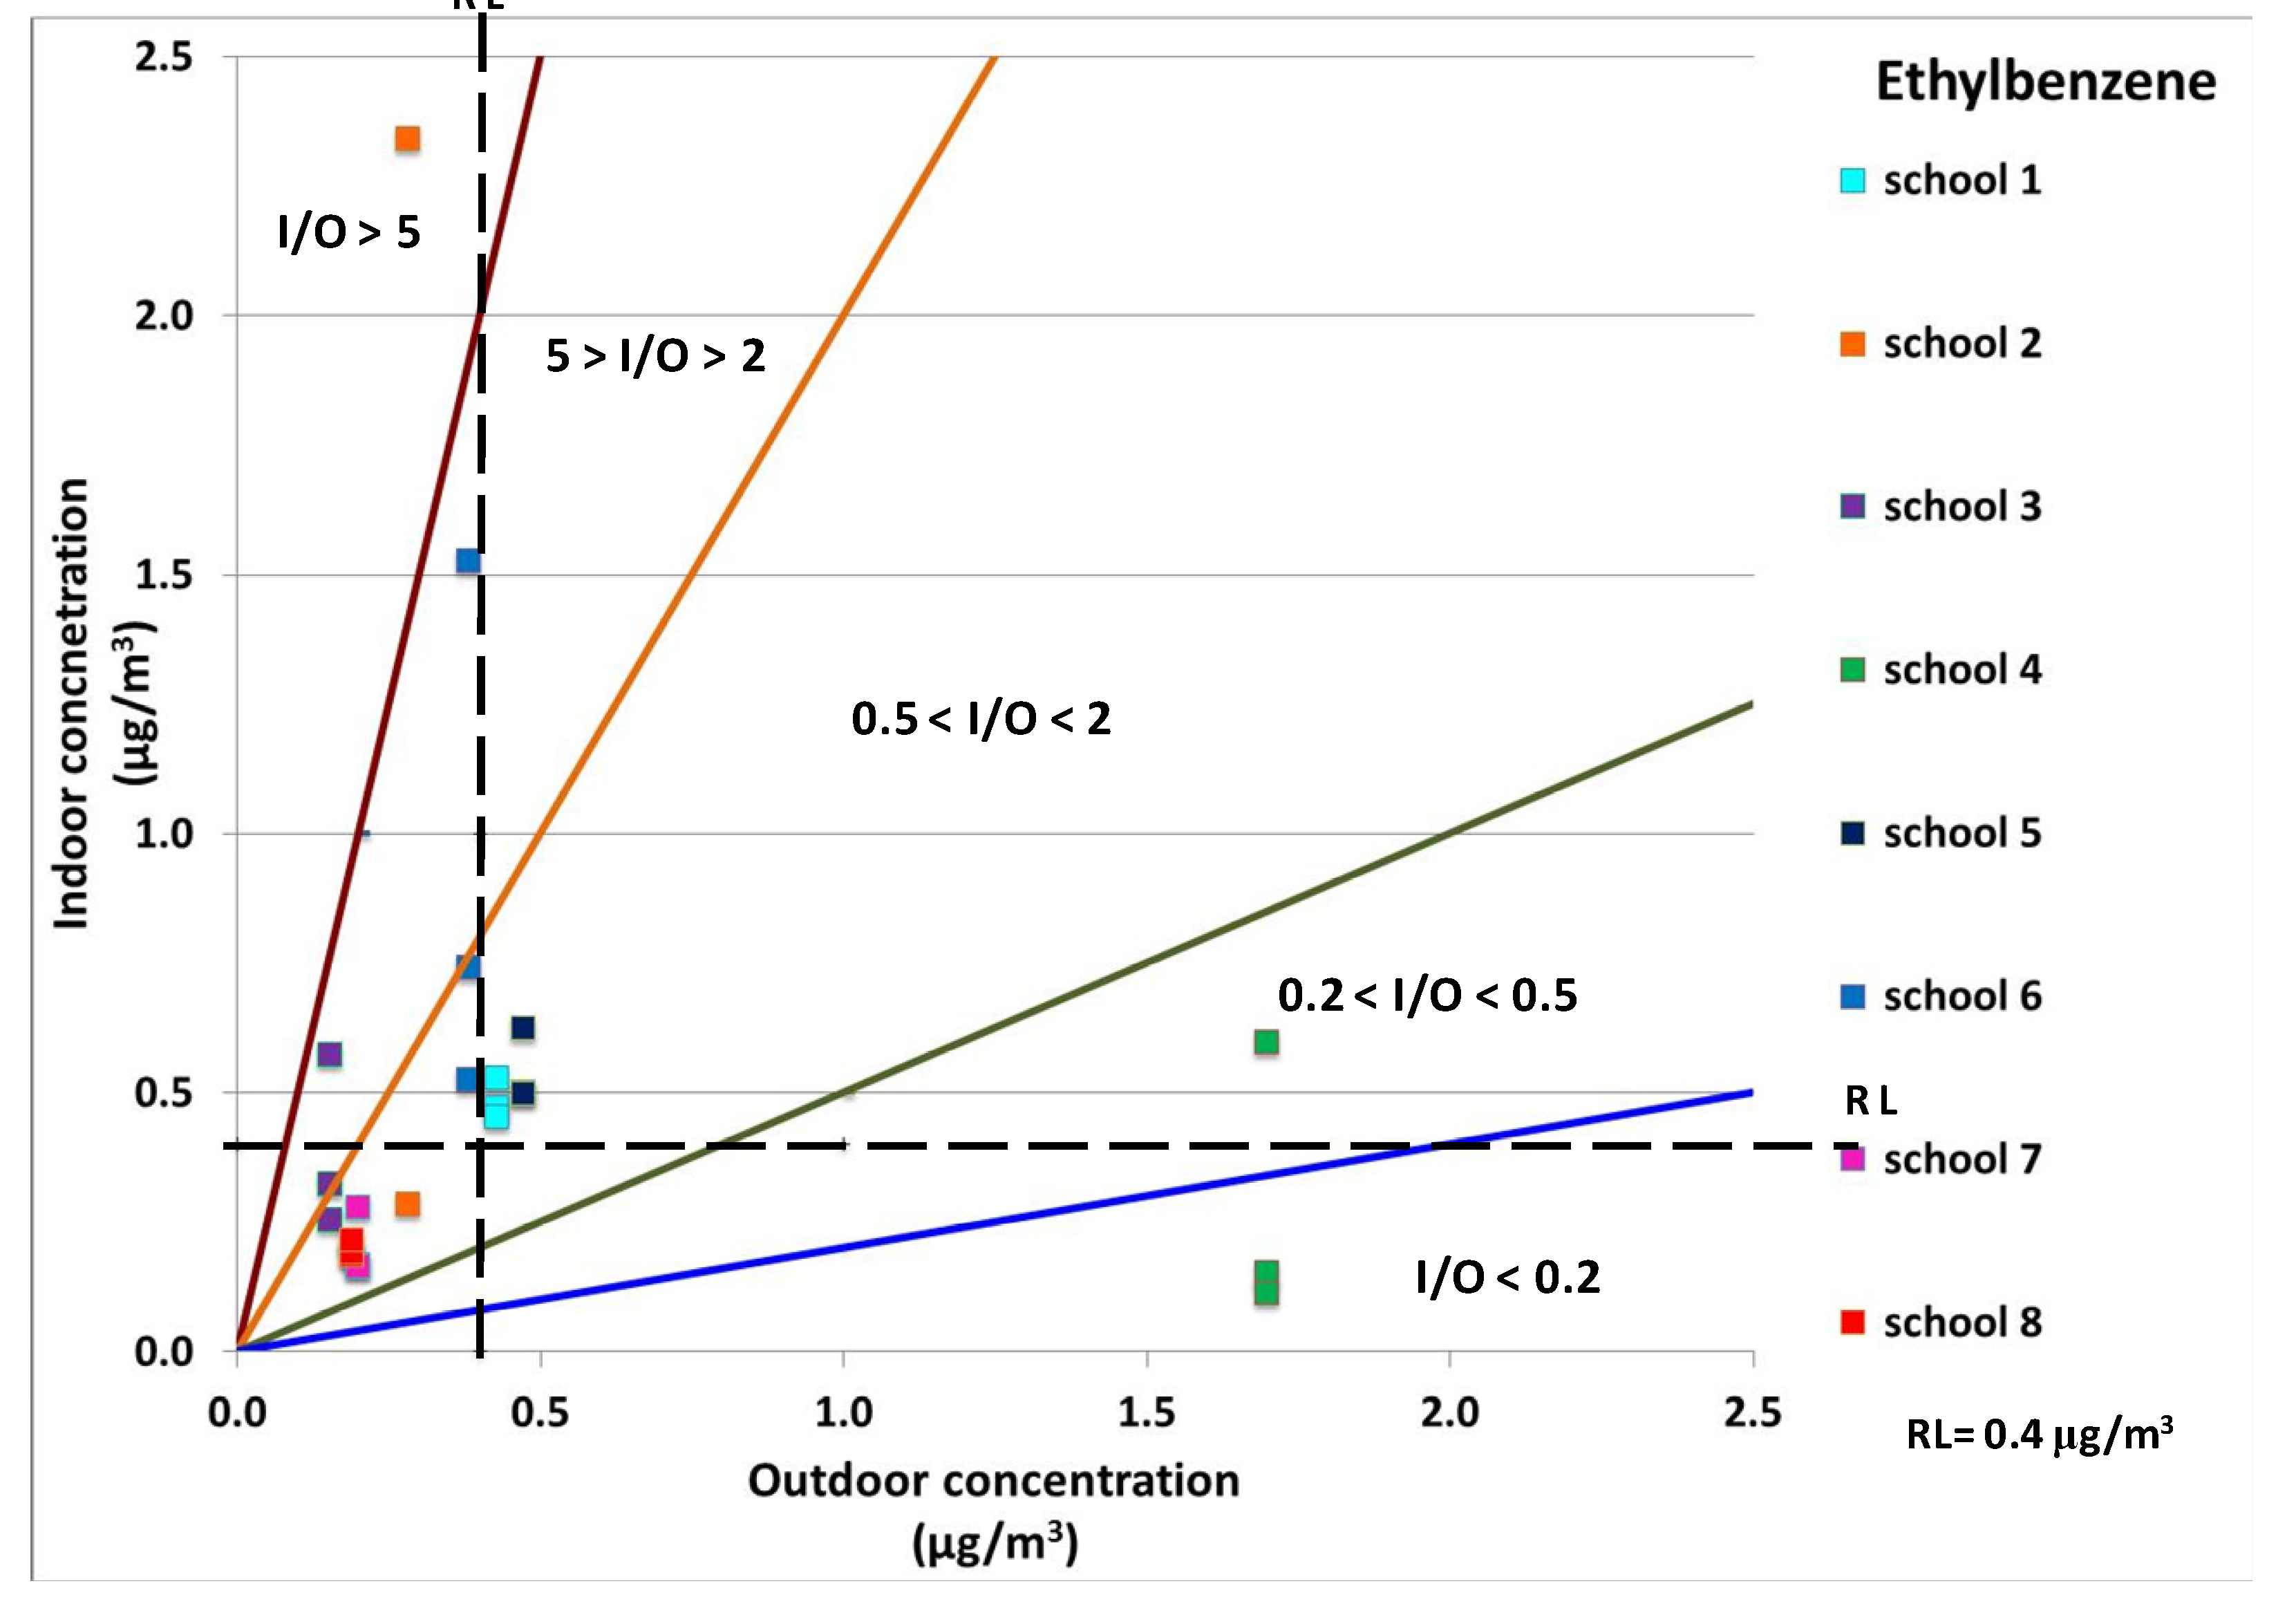
| Ethyl-benzene | 0.45 | 0.53 | 0.43 | 0.28 | 2.34 | 0.28 | 0.26 | 0.57 | 0.15 | 0.11 | 0.60 | 1.70 | 0.50 | 0.62 | 0.47 | 0.53 | 1.53 | 0.38 | 0.16 | 0.28 | 0.20 | 0.19 | 0.22 | 0.19 |
| m,p-Xylene | 1.34 | 1.59 | 1.46 | 0.84 | 2.82 | 0.89 | 0.60 | 21.03 | 0.41 | 0.25 | 1.05 | 2.38 | 1.58 | 2.01 | 1.65 | 1.66 | 5.84 | 1.13 | 0.48 | 0.82 | 0.57 | 0.56 | 0.59 | 0.60 |
| Styrene | 0.62 | 0.83 | 0.45 | 0.22 | 2.26 | 0.21 | <0.05 * | 0.24 | 0.14 | 0.18 | 0.39 | 1.26 | 0.27 | 0.35 | 0.18 | 0.32 | 0.59 | 0.26 | 0.12 | 0.24 | 0.16 | 0.12 | 0.14 | 0.12 |
| Alpha-pinene | 6.55 | 34.18 | <0.03 * | 1.67 | 8.26 | 2.89 | 0.85 | 1.87 | 0.27 | 1.38 | 8.60 | 3.08 | 0.92 | 1.21 | 0.23 | 0.56 | 5.14 | <0.03 * | 1.13 | 4.05 | 0.34 | 0.37 | 2.29 | 0.72 |
| Camphene | 2.26 | 3.05 | 15.22 | 1.30 | 9.17 | 0.51 | 0.54 | 0.85 | 0.29 | 1.89 | 4.42 | 3.62 | 0.92 | 3.01 | 0.12 | 1.06 | 2.67 | 0.04 | 8.99 | 11.03 | 0.68 | 0.79 | 1.85 | 1.32 |
| Decane | 2.10 | 3.83 | 2.81 | 0.82 | 1.63 | 1.61 | 1.13 | 3.69 | 0.52 | 1.32 | 5.86 | 4.74 | 3.25 | 4.04 | 0.38 | 1.28 | 1.92 | 0.38 | 0.40 | 2.91 | 0.43 | 0.28 | 0.90 | 0.50 |
| 1,4-Dichlorobenzene | 0.02 | 0.16 | 0.01 | 0.01 | 1.87 | 0.02 | 0.01 | 0.05 | 0.01 | 0.01 | 0.05 | 0.07 | 0.01 | 0.01 | 0.01 | 0.04 | 0.04 | 0.03 | 0.01 | 0.02 | 0.01 | 0.01 | 0.01 | 0.01 |
| 1,2,3-Trimethylbenzene | 0.38 | 0.45 | 0.34 | 0.33 | 0.99 | 0.30 | 0.18 | 0.47 | 0.13 | 0.28 | 0.46 | 0.76 | 0.39 | 61.00 | 0.27 | 0.37 | 0.86 | 0.17 | 0.11 | 0.18 | 0.18 | 0.14 | 19.00 | 0.14 |
| Limonene | 11.11 | 25.42 | 32.15 | 9.42 | 10.73 | 10.25 | 3.67 | 4.63 | 1.03 | 6.08 | 8.60 | 10.51 | 2.51 | 4.01 | 0.36 | 2.24 | 4.79 | 0.08 | 4.21 | 6.10 | 1.22 | 1.30 | 2.62 | 1.01 |
| Compounds | School 1 | School 2 | School 3 | School 4 | School 5 | School 6 | School 7 | School 8 | |||||||||||||||
|---|---|---|---|---|---|---|---|---|---|---|---|---|---|---|---|---|---|---|---|---|---|---|---|
| classroom 1 | classroom 2 | classroom 3 | classroom 1 | classroom 2 | classroom 1 | classroom 2 | classroom 3 | classroom 1 | classroom 2 | classroom 3 | classroom 1 | classroom 2 | classroom 3 | classroom 1 | classroom 2 | classroom 3 | classroom 1 | classroom 2 | classroom 3 | classroom 1 | classroom 2 | classroom 3 | |
| Benzene | 1.0 | 1.2 | 1.1 | 0.7 | 3.4 | 13.4 | 0.6 | 0.8 | 0.3 | 0.5 | 0.1 | 0.8 | 0.8 | 0.7 | 1.5 | 0.8 | 1.8 | 0.3 | 0.7 | 0.5 | 0.8 | 0.3 | 0.5 |
| Heptane | 8.4 | 3.4 | 10.7 | 12.9 | 69.1 | 157.4 | 83.3 | 10.2 | 0.4 | 0.3 | 0.3 | 3.4 | 20.0 | 2.1 | 53.9 | 4.2 | 3.8 | 3.6 | 9.9 | 4.5 | 0.6 | 0.5 | 0.6 |
| Toluene | 1.0 | 0.9 | 1.1 | 0.9 | 2.9 | 2.4 | 1.5 | 1.5 | 0.2 | 0.3 | 0.2 | 2.0 | 1.3 | 1.0 | 4.2 | 2.5 | 3.3 | 1.3 | 1.3 | 1.0 | 1.0 | 1.0 | 1.0 |
| Tetrachloroethylene | 1.4 | 1.0 | 1.1 | 1.1 | 9.6 | 8.9 | 5.8 | 11.0 | 0.1 | 0.2 | 0.1 | 1.4 | 1.4 | 1.4 | 0.9 | 0.9 | 1.0 | 1.3 | 1.8 | 1.4 | 0.9 | 0.9 | 0.8 |
| n-Butylacetate | 1.1 | 1.2 | 1.7 | 1.8 | 14.4 | 3.1 | 3.4 | 3.3 | 0.1 | 0.1 | 0.2 | 1.1 | 0.9 | 1.1 | 0.8 | 1.2 | 0.9 | 1.7 | 2.7 | 2.0 | 1.6 | 1.9 | 8.6 |
| Ethyl-benzene | 1.1 | 1.2 | 1.1 | 1.0 | 8.3 | 3.7 | 2.1 | 1.6 | 0.1 | 0.4 | 0.1 | 1.1 | 1.3 | 1.1 | 1.9 | 4.0 | 1.4 | 0.8 | 1.4 | 0.8 | 1.0 | 1.0 | 1.1 |
| m-Xylene | 1.0 | 1.1 | 0.9 | 0.9 | 3.2 | 51.7 | 1.5 | 1.5 | 0.2 | 0.4 | 0.1 | 1.0 | 1.2 | 1.0 | 1.8 | 5.2 | 1.5 | 0.9 | 1.4 | 0.8 | 0.9 | 0.9 | 1.0 |
| Styrene | 1.4 | 1.4 | 1.8 | 1.0 | 10.8 | n.d | 1.7 | 1.7 | 0.1 | 0.3 | 0.1 | 1.9 | 1.7 | 1.5 | 1.6 | 2.2 | 1.2 | 0.7 | 1.5 | 0.8 | 0.9 | 1.2 | 1.0 |
| Alpha-pinene | n.d | n.d | n.d | 0.6 | 2.9 | 3.2 | 7.0 | 4.1 | 2.8 | 0.8 | 0.4 | 4.7 | 4.0 | 5.2 | n.d | n.d | n.d | n.d | 11.8 | 3.3 | 1.6 | 3.2 | 0.5 |
| Camphene | 0.2 | 0.2 | 0.1 | 2.5 | 17.9 | 3.0 | 1.9 | 2.2 | 0.5 | 0.6 | 1.2 | 24.5 | 7.5 | 14.4 | 64.1 | 27.1 | 25.5 | 16.1 | 13.1 | 13.5 | 1.4 | 0.6 | 1.2 |
| Decane | 1.3 | 1.4 | 0.7 | 1.0 | 0.5 | 7.1 | 4.2 | 2.2 | 1.2 | 0.5 | 0.3 | 10.6 | 8.5 | 9.0 | 4.8 | 5.1 | 3.4 | 0.9 | 1.3 | 6.8 | 1.1 | 1.8 | 0.6 |
| 1,4-Dichlorobenzene | 2.0 | 1.8 | 19.0 | 0.7 | 120.7 | 5.8 | 1.3 | 0.9 | 0.1 | 0.7 | 0.1 | 1.1 | 0.9 | 1.2 | 1.4 | 1.6 | 1.7 | 0.6 | 1.7 | 0.6 | 1.1 | 2.3 | 1.4 |
| 1,2,3-Trimethylbenzene | 1.2 | 1.1 | 1.3 | 1.1 | 3.3 | 3.7 | 1.6 | 1.4 | 0.4 | 0.6 | 0.2 | 1.6 | 2.2 | 1.4 | 3.4 | 5.2 | 2.2 | 0.6 | 1.0 | 0.8 | 1.1 | 1.4 | 1.0 |
| Limonene | 0.8 | 0.5 | 0.3 | 1.0 | 0.9 | 4.5 | 4.0 | 3.6 | 0.7 | 0.6 | 0.8 | 11.2 | 10.4 | 7.0 | 63.3 | 29.6 | 36.5 | 5.0 | 3.4 | 3.6 | 1.3 | 2.6 | 1.3 |


4. Conclusions
Conflicts of Interest
References
- Faustman, E.M.; Silbernagel, S.M.; Fenske, R.A.; Burbacher, T.M.; Ponce, R.A. Mechanisms underlying children’s susceptibility to environmental toxicants. Environ. Health. Perspect. 2000, 108, 13–21. [Google Scholar]
- Mendell, J.M.; Health, G.A. Do indoor pollutants and thermal conditions in schools influence student performance? A critical review of the literature. Indoor Air 2005, 15, 27–52. [Google Scholar] [CrossRef]
- World Health Organization (WHO). Air Quality Guidelines—Global Update 2005. Available online: http://www.euro.who.int/__data/assets/pdf_file/0005/78638/E90038.pdf (accessed on 14 July 2013).
- World Health Organization (WHO). Principles for Evaluating Health Risks in Children Associated with Exposure to Chemicals. Available online: http://www.who.int/ipcs/publications/ehc/ehc237.pdf (accessed on 14 July 2013).
- Chithra, V.S.; Shiva Nagendra, S.M. Indoor air quality investigations in a naturally ventilated school building located close to an urban roadway in Chennai, India. Build. Environ. 2012, 54, 159–167. [Google Scholar] [CrossRef]
- Daisey, J.M.; Angell, W.J.; Apte, M.G. Indoor air quality, ventilation and health symptoms in schools: An analysis of existing information. Indoor Air 2003, 13, 53–64. [Google Scholar] [CrossRef]
- Shendell, D.G.; Prill, R.; Fisk, W.J.; Apte, M.G.; Blake, D.; Faulkner, D. Associations between classroom CO2 concentrations and student attendance in Washington and Idaho. Indoor Air 2004, 14, 333–341. [Google Scholar] [CrossRef]
- Van Dijken, F.; Van Bronswijk, J.E.M.H.; Sundell, J. Indoor environment and pupils’ health in primary schools. Build. Res. Inf. 2006, 34, 437–446. [Google Scholar] [CrossRef]
- Wargocki, P.; Wyon, D.P. The effects of outdoor air supply rate and supply air filter condition in classrooms on the performance of schoolwork by children (1257-RP). HVAC&R Res. 2007, 13, 165–191. [Google Scholar]
- Shaughnessy, R.J.; Haverinen-Shaughnessy, U.; Nevalainen, A.; Moschandreas, D. A preliminary study on the association between ventilation rates in classrooms and student performance. Indoor Air 2006, 16, 465–468. [Google Scholar]
- Clements-Croome, D.J.; Awbi, H.B.; Bakó-Biró, Z.; Kochhar, N.; Williams, M. Entilation rates in schools. Build. Environ. 2008, 43, 362–367. [Google Scholar] [CrossRef]
- Godwin, C.; Batterman, S. Indoor air quality in Michigan schools. Indoor Air 2007, 17, 109–121. [Google Scholar] [CrossRef]
- Federal Environment Agency UBA. Guidelines for Indoor Air Hygiene in School Buildings; Moriske, H.-J., Szewzyk, R., Eds.; KOMAG mbH: Berlin, Germany, 2008. Available online: http://www.gesundheitsamt-bw.de/MLS/Documents/Guidelines_Air_Quality_Schools_2008.pdf (accessed on 14 July 2013).
- Poupard, O.; Blondeau, P.; Iordache, V.; Allard, F. Statistical analysis of parameters influencing the relationship between outdoor and indoor air quality in schools. Atmos. Environ. 2005, 39, 2071–2080. [Google Scholar] [CrossRef]
- Sofuoglu, S.C.; Aslan, G.; Inal, F.; Sofuoglu, A. An assessment of indoor air concentrations and health risks of volatile organic compounds in three primary schools. Int. J. Hyg. Environ. Health 2011, 214, 38–46. [Google Scholar]
- Mølhave, L.; Bach, B.; Pedersen, O.F. Human reactions to low concentrations of volatile organic compounds. Environ. Int. 1986, 12, 167–175. [Google Scholar] [CrossRef]
- Hodgson, M.J.; Frohlinger, J.; Permar, E.; Tidwell, C.; Traven, N.D.; Olenchock, S.A.; Karpf, M. Symptoms and micro-environmental measures in non-problem buildings. J. Occup. Med. 1991, 33, 527–533. [Google Scholar]
- Bartlett, K.H.; Kennedy, S.M.; Brauer, M.; Netten, C.V.; Dill, B. Evaluation and determinants of airborne bacterial concentrations in school classrooms. J. Occup. Environ. Hyg. 2004, 1, 639–647. [Google Scholar] [CrossRef]
- Ramachandran, G.; Adgate, J.L.; Banerjee, S.; Church, T.R.; Jones, D.; Fredrickson, A.; Sexton, K. Indoor air quality in two urban elementary schools-measurements of airborne Fungi, Carpet Allergens, CO2, temperature, and relative humidy. J. Occup. Environ. Hyg. 2005, 2, 553–566. [Google Scholar] [CrossRef]
- Lee, S.C.; Chang, M. Indoor air quality investigations at five classrooms. Indoor Air 1999, 9, 134–138. [Google Scholar]
- Scheff, P.A.; Paulius, V.K.; Curtis, L.; Conroy, L.M. Indoor air quality in a middle school, part II: Development of emission factors for particulate matter and bioaerosols. Appl. Occup. Environ. Hyg. 2000, 15, 835–842. [Google Scholar] [CrossRef]
- Scheff, P.A.; Paulius, V.K.; Curtis, L.; Conroy, L.M. Indoor air quality in a middle school, part I: Use of CO2 as a tracer for effective ventilation. Appl. Occup. Environ. Hyg. 2000, 15, 824–834. [Google Scholar] [CrossRef]
- Blondeau, P.; Iordache, V.; Poupard, O.; Genin, D.; Allard, F. Relationship between outdoor and indoor air quality in eight French schools. Indoor Air 2005, 15, 2–12. [Google Scholar] [CrossRef]
- Liu, Y.-S.; Chen, R.; Shen, X.-X.; Mao, X.-L. Wintertime indoor air levels of PM10, PM2.5 and PM1 at public places and their contributions to TSP. Environ. Int. 2004, 30, 189–197. [Google Scholar] [CrossRef]
- Fromme, H.; Lahrz, T.; Hainisch, A.; Oddoy, A.; Piloty, M.; Rüde, H. Elemental carbon and respirable particulate matter in the indoor air of apartments and nursery schools and ambient air in Berlin (Germany). Indoor Air 2005, 15, 335–341. [Google Scholar] [CrossRef]
- Heudorf, U.; Neitzert, V.; Spark, J. Particulate matter and carbon dioxide in classrooms. Int. J. Hyg. Environ. Health 2009, 212, 45–55. [Google Scholar] [CrossRef]
- Molnár, P.; Bellander, T.; Sällsten, G.; Boman, J. Indoor and outdoor concentrations of PM2.5 trace elements at homes, preschools and schools in Stockholm, Sweden. J. Environ. Monit. 2007, 9, 348–357. [Google Scholar] [CrossRef]
- Stranger, M.; Potgieter-Vermaak, S.S.; Grieken, V.R. Characterization of indoor air quality in primary schools in Antwerp, Belgium. Indoor Air 2008, 18, 454–463. [Google Scholar] [CrossRef]
- Oeder, S.; Dietrich, S.; Weichenmeier, I.; Schober, W.; Pusch, G.; Jörres, R.A.; Schierl, R.; Nowak, D.; Fromme, H.; Behrendt, H.; Buters, J.T. Toxicity and elemental composition of particulate matter from outdoor and indoor air of elementary schools in Munich, Germany. Indoor Air 2012, 22, 148–158. [Google Scholar] [CrossRef]
- UNI EN ISO 16000-1:2006. Indoor Air—Part 1: General Aspects of Sampling Strategy.
- UNI EN ISO 16000-5:2007. Indoor Air—Part 5: Sampling Strategy for Volatile Organic Compounds (VOCs).
- Bruno, P.; Caputi, M.; Caselli, M.; de Gennaro, G.; de Rienzo, M. Reliability of a BTEX radial diffusive sampler for thermal desorption. Atmos. Environ. 2005, 39, 1347–1355. [Google Scholar]
- Bruno, P.; Caselli, M.; de Gennaro, G.; Iacobellis, S.; Tutino, M. Monitoring of volatile organic compounds in non-residential indoor environments. Indoor Air 2008, 18, 250–256. [Google Scholar] [CrossRef]
- UNI EN ISO 16017-2:2007. Indoor, Ambient and Workplace Air—Sampling and Analysis of Volatile Organic Compounds by Sorbent Tube/Thermal Desorption/Capillary Gas Chromatography—Part 2: Diffusive Sampling.
- Radiello. Available online: http://www.radiello.com/english/index_en.htmlS (accessed on 13 July 2013).
- IRIS, Integrated Risk Information System. Available online: http://cfpub.epa.gov/ncea/iris/index.cfm?fuseaction=iris.showSubstanceList (accessed on 13 July 2013).
- California Environmental Protection Agency (CalEPA). Available online: http://www.oehha.ca.gov/air/allrels.html (accessed on 13 July 2013).
- Bruno, P.; Caselli, M.; de Gennaro, G.; Scolletta, L.; Trizio, L.; Tutino, M. Assessment of the impact produced by the traffic source on VOC level in the urban area of Canosa di Puglia (Italy). Water Air Soil Pollut. 2008, 193, 37–50. [Google Scholar]
- Caselli, M.; de Gennaro, G.; Marzocca, A.; Trizio, L.; Tutino, M. Assessment of the impact of the vehicular traffic on BTEX concentration in ring roads in urban areas of Bari (Italy). Chemosphere 2010, 81, 306–311. [Google Scholar] [CrossRef]
- EPA. Provisional Peer Reviewed Toxicity Values for Superfund (PPRTV). Available online: http://hhpprtv.ornl.gov/ (accessed on 13 July 2013).
- Ramírez, N.; Cuadras, A.; Rovira, E.; Borrull, F.; Marcé, R.M. Chronic risk assessment of exposure to volatile organic compounds in the atmosphere near the largest Mediterranean industrial site. Environ. Int. 2012, 39, 200–209. [Google Scholar] [CrossRef]
- Scorecard’s Data Sources—GoodGuide. Available online: http://scorecard.goodguide.com/about/txt/data.html (accessed on 12 July 2013).
- Nazaroff, W.W.; Weschler, C.J. Cleaning products and air fresheners: Exposure to primary and secondary air pollutants. Atmo. Environ. 2004, 38, 2841–2865. [Google Scholar] [CrossRef]
- Mendell, M.J. Indoor residential chemical emissions as risk factors for respiratory and allergic effects in children. Indoor Air. 2007, 17, 259–277. [Google Scholar] [CrossRef]
© 2013 by the authors; licensee MDPI, Basel, Switzerland. This article is an open access article distributed under the terms and conditions of the Creative Commons Attribution license (http://creativecommons.org/licenses/by/3.0/).
Share and Cite
De Gennaro, G.; Farella, G.; Marzocca, A.; Mazzone, A.; Tutino, M. Indoor and Outdoor Monitoring of Volatile Organic Compounds in School Buildings: Indicators Based on Health Risk Assessment to Single out Critical Issues. Int. J. Environ. Res. Public Health 2013, 10, 6273-6291. https://doi.org/10.3390/ijerph10126273
De Gennaro G, Farella G, Marzocca A, Mazzone A, Tutino M. Indoor and Outdoor Monitoring of Volatile Organic Compounds in School Buildings: Indicators Based on Health Risk Assessment to Single out Critical Issues. International Journal of Environmental Research and Public Health. 2013; 10(12):6273-6291. https://doi.org/10.3390/ijerph10126273
Chicago/Turabian StyleDe Gennaro, Gianluigi, Genoveffa Farella, Annalisa Marzocca, Antonio Mazzone, and Maria Tutino. 2013. "Indoor and Outdoor Monitoring of Volatile Organic Compounds in School Buildings: Indicators Based on Health Risk Assessment to Single out Critical Issues" International Journal of Environmental Research and Public Health 10, no. 12: 6273-6291. https://doi.org/10.3390/ijerph10126273