Pure and Social Disparities in Distribution of Dentists: A Cross-Sectional Province-Based Study in Iran

Abstract
:1. Introduction
2. Method and Materials
2.1. Study Setting
2.2. Data Sources and Variables
2.3. Disparity Measures
2.3.1. Pure Disparities
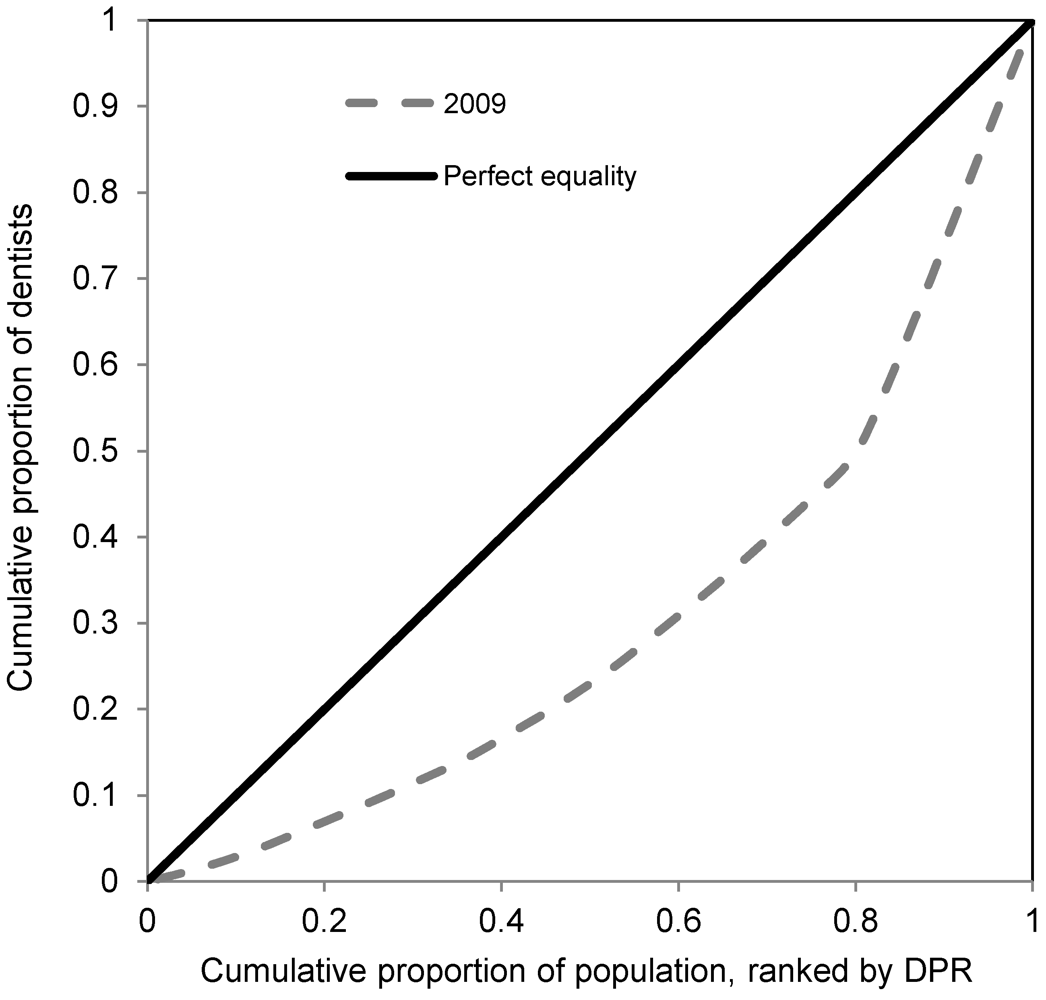
2.3.1.1. Lorenz Curve and Gini Coefficient

2.3.1.2. Index of Dissimilarity (ID)

2.3.1.3. Gaswirth Index of Disparity (GID)

2.3.2. Social Disparities
Relative Index of Inequality (RII)
2.4. Data Analysis
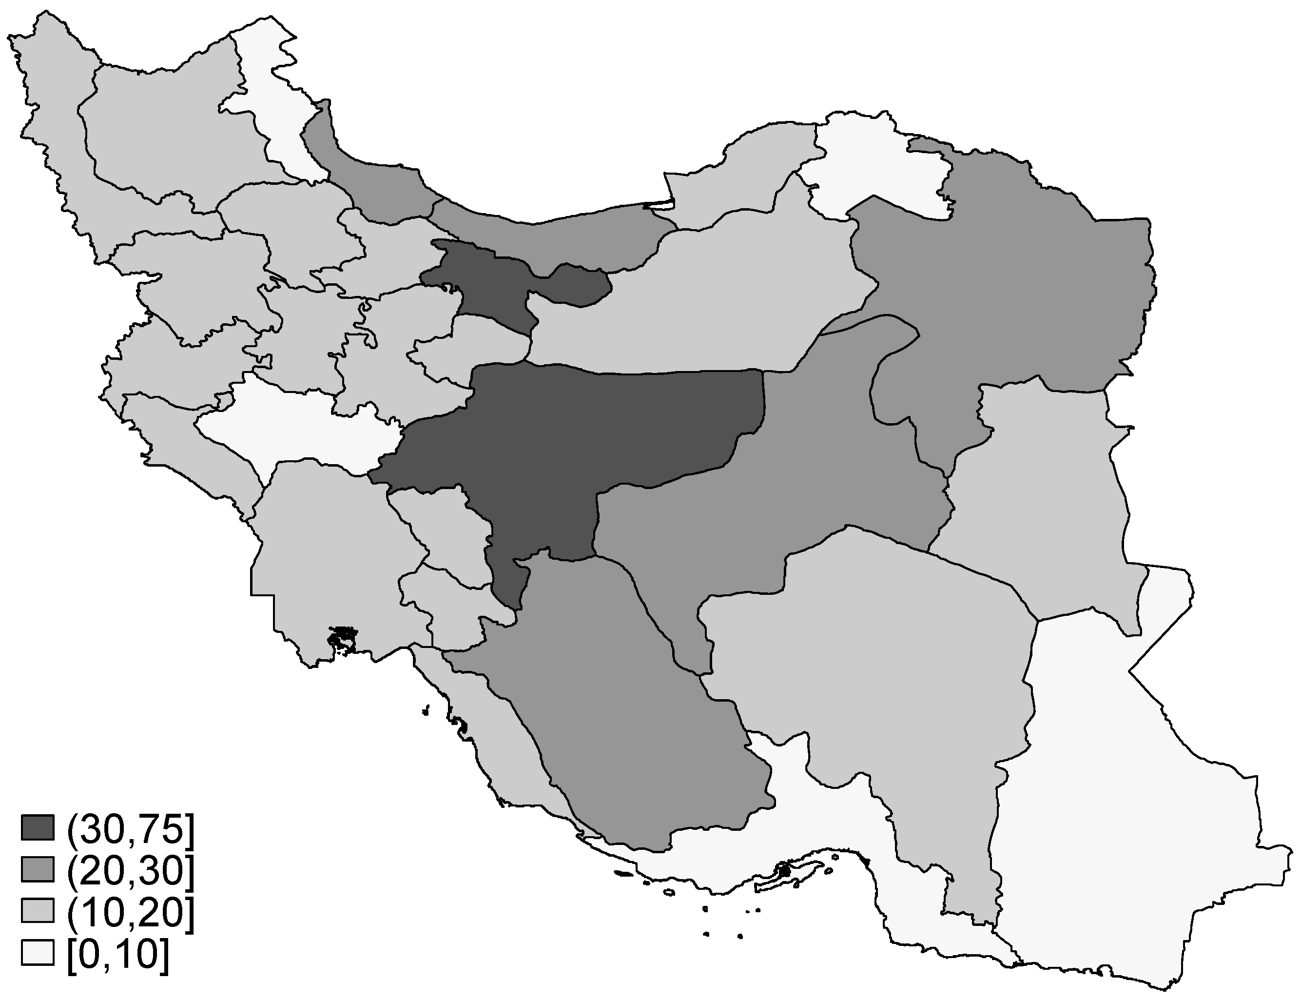
3. Results

| Disparity measure | Total sample | Sample excluding Tehran |
|---|---|---|
| Gini coefficient | 0.39 | 0.23 |
| Index of Dissimilarity (%) | 30.48 | 17.64 |
| Gaswirth index of disparity | 1.55 | 0.84 |
| Relative index of inequality | 3.82 (1.91–7.64) | 2.12 (1.39–3.24) |
| Adjusted relative index of inequality * | 2.13 (1.01–4.48) | 1.48 (0.90–2.43) |
| Province | Number of dentists | Changes based on index of dissimilarity | Increases based on gaswirth index of disparity |
|---|---|---|---|
| Ardebil | 103 | +251 | +802 |
| Bushehr | 111 | +146 | +545 |
| Chaharmahal Bakhtiari | 105 | +144 | +532 |
| East Azerbaijan | 717 | +320 | +1,932 |
| Fars | 1,156 | +91 | +2,031 |
| Gilan | 534 | +149 | +1,211 |
| Golestan | 270 | +200 | +931 |
| Hamedan | 252 | +237 | +998 |
| Hormozgan | 129 | +280 | +917 |
| Ilam | 103 | +54 | +299 |
| Isfahan | 1,536 | −233 | +1,793 |
| Kerman | 459 | +310 | +1,506 |
| Kermanshah | 245 | +296 | +1,138 |
| Khuzestan | 530 | +715 | +2,649 |
| Kohkiluye & Boyerahmad | 118 | +67 | +354 |
| Kordestan | 182 | +233 | +879 |
| Lorestan | 169 | +328 | +1,100 |
| Markazi | 169 | +217 | +817 |
| Mazandaran | 745 | +89 | +1,386 |
| Northern Khorasan | 57 | +180 | +547 |
| Qazvin | 197 | +131 | +641 |
| Qom | 141 | +161 | +630 |
| Khorasan Razavi | 1,355 | +268 | +2,792 |
| Semnan | 104 | +64 | +326 |
| Sistan & Baluchestan | 188 | +530 | +1,647 |
| Southern Khorasan | 67 | +117 | +404 |
| Tehran | 9,778 | −5,950 | 0 |
| West Azerbaijan | 386 | +447 | +1,743 |
| Yazd | 296 | −9 | +436 |
| Zanjan | 113 | +165 | +597 |
| Variable | DPR | HDI | TXH | NFXH | Urbanization |
|---|---|---|---|---|---|
| DPR | |||||
| HDI | 0.61 *** | ||||
| TXH | 0.64 *** | 0.62 *** | |||
| NFXH | 0.70 *** | 0.54 ** | 0.78 *** | ||
| Urbanization | 0.57 *** | 0.69 *** | 0.52 ** | 0.54 *** | |
| Unemployment | 0.02 | −0.09 | 0.22 | 0.10 | 0.02 |
4. Discussion
5. Conclusions
Conflict of interest
References
- Petersen, P.E. Global policy for improvement of oral health in the 21st century—Implications to oral health research of World Health Assembly 2007, World health organization. Community Dent. Oral Epidemiol. 2009, 37, 1–8. [Google Scholar] [CrossRef]
- Eaton, K.A. Global oral public health—The current situation and recent developments. J. Publ. Health Pol. 2012, 33, 382–386. [Google Scholar] [CrossRef]
- Bagramian, R.A.; Garcia-Godoy, F.; Volpe, A.R. The global increase in dental caries. A pending public health crisis. Am. J. Dent. 2009, 22, 3–8. [Google Scholar]
- Petersen, P.E. The world oral health report 2003: Continuous improvement of oral health in the 21st century—The approach of the WHO global oral health programme. Community Dent. Oral Epidemiol. 2003, 31 (Suppl. 1), 3–23. [Google Scholar]
- Somkotra, T. Socioeconomic inequality in self-reported oral health status: The experience of Thailand after implementation of the universal coverage policy. Community Dent. Health 2011, 28, 136–142. [Google Scholar]
- Guarnizo-Herreno, C.C.; Wehby, G.L. Explaining racial/ethnic disparities in children’s dental health: A decomposition analysis. Am. J. Publ. Health 2012, 102, 859–866. [Google Scholar]
- Watt, R.; Sheiham, A. Inequalities in oral health: A review of the evidence and recommendations for action. Br. Dent. J. 1999, 187, 6–12. [Google Scholar]
- Do, L.G. Distribution of caries in children: Variations between and within populations. J. Dent. Res. 2012, 91, 536–543. [Google Scholar] [CrossRef]
- Olutola, B.G.; Ayo-Yusuf, O.A. Socio-environmental factors associated with self-rated oral health in south africa: A multilevel effects model. Int. J. Environ. Res. Public Health 2012, 9, 3465–3483. [Google Scholar] [CrossRef]
- Petersen, P.E.; Kjoller, M.; Christensen, L.B.; Krustrup, U. Changing dentate status of adults, use of dental health services, and achievement of national dental health goals in denmark by the year 2000. J. Publ. Health Dent. 2004, 64, 127–135. [Google Scholar] [CrossRef]
- Wall, T.P.; Vujicic, M.; Nasseh, K. Recent trends in the utilization of dental care in the United States. J. Dent. Educ. 2012, 76, 1020–1027. [Google Scholar]
- Somkotra, T. Experience of socioeconomic-related inequality in dental care utilization among Thai elderly under universal coverage. Geriatr. Gerontol. Int. 2013, 13, 298–306. [Google Scholar] [CrossRef]
- Hosseinpoor, A.R.; Itani, L.; Petersen, P.E. Socio-economic inequality in oral healthcare coverage: Results from the World Health Survey. J. Dent. Res. 2012, 91, 275–281. [Google Scholar] [CrossRef]
- Pakshir, H.R. Oral health in Iran. Int. Dent. J. 2004, 54, 367–372. [Google Scholar]
- Iran Medical Council. Available online: www.Irimc.Org (accessed on 20 May 2011).
- Sanjesh Organization. Available online: sanjesh.Org (accessed on 7 September 2012).
- Ahmad Kiadaliri, A.; Najafi, B.; Haghparast-Bidgoli, H. Geographic distribution of need and access to health care in rural population: An ecological study in Iran. Int. J. Equity Health 2011, 10, 39. [Google Scholar] [CrossRef]
- Rasanathan, K.; Montesinos, E.V.; Matheson, D.; Etienne, C.; Evans, T. Primary health care and the social determinants of health: Essential and complementary approaches for reducing inequities in health. J. Epidemiol. Community Health 2011, 65, 656–660. [Google Scholar] [CrossRef]
- CSDH, Closing the Gap in a Generation: Health Equity through Action on the Social Determinants of Health. Final Report of the Commission on Social Determinants of Health; World Health Organization: Geneva, Switzerland, 2008.
- Momeni, A.; Mardi, M.; Pieper, K. Caries prevalence and treatment needs of 12-year-old children in the islamic republic of Iran. Med. Princ. Pract. 2006, 15, 24–28. [Google Scholar] [CrossRef]
- Hessari, H.; Vehkalahti, M.M.; Eghbal, M.J.; Murtomaa, H.T. Oral health among 35- to 44-year-old Iranians. Med. Princ. Pract. 2007, 16, 280–285. [Google Scholar] [CrossRef]
- Hessari, H.; Vehkalahti, M.M.; Eghbal, M.J.; Samadzadeh, H.; Murtomaa, H.T. Oral health and treatment needs among 18-year-old Iranians. Med. Princ. Pract. 2008, 17, 302–307. [Google Scholar] [CrossRef]
- Bayat, F.; Vehkalahti, M.M.; Heikki, T.; Zafarmand, H.A. Dental attendance by insurance status among adults in tehran, Iran. Int. Dent. J. 2006, 56, 338–344. [Google Scholar] [CrossRef]
- Statistical Centre of Iran (SCI), Iran Statistical Yearbooks; Statistical Centre of Iran: Tehran, Iran, 2012.
- National Organization for Civil Registration. Available online: www.Sabteahval.Ir/en (accessed on 13 March 2012).
- President Deputy of Strategic Planning and Control. Available online: www.Spac.Ir/portal/home (accessed on 13 March 2012).
- Gravelle, H.; Sutton, M. Inequality in the geographical distribution of general practitioners in England and Wales 1974–1995. J. Health Serv. Res. Pol. 2001, 6, 6–13. [Google Scholar] [CrossRef]
- Mackenbach, J.P.; Kunst, A.E. Measuring the magnitude of socio-economic inequalities in health: An overview of available measures illustrated with two examples from Europe. Soc. Sci. Med. 1997, 44, 757–771. [Google Scholar] [CrossRef]
- Toyabe, S. Trend in geographic distribution of physicians in Japan. Int. J. Equity Health 2009, 8, 5. [Google Scholar] [CrossRef]
- Brown, M.C. Using Gini-style indices to evaluate the spatial patterns of health practitioners: Theoretical considerations and an application based on Alberta data. Soc. Sci. Med. 1994, 38, 1243–1256. [Google Scholar] [CrossRef]
- Wagstaff, A.; Paci, P.; van Doorslaer, E. On the measurement of inequalities in health. Soc. Sci. Med. 1991, 33, 545–557. [Google Scholar] [CrossRef]
- Gastwirth, J.L. A graphical summary of disparities in health care and related summary measures. J. Stat. Plan. Infer. 2007, 137, 1059–1065. [Google Scholar] [CrossRef]
- Bayat, F.; Vehkalahti, M.M.; Zafarmand, A.H.; Tala, H. Impact of insurance scheme on adults’ dental check-ups in a developing oral health care system. Eur. J. Dent. 2008, 2, 3–10. [Google Scholar]
- Leive, A.; Xu, K. Coping with the Out-of-Pocket Health Payments: Applications of Engel Curves and Two-Part Models in Six African Countries; World Health Organization: Geneva, Switzerland, 2007. [Google Scholar]
- WHO Global Atlas of the Health Workforce. Available online: www.who.int/globalatlas/autologin/ hrh_login.asp (accessed on 17 April 2013).
- Ravaghi, V.; Underwood, M.; Marinho, V.; Eldridge, S. Socioeconomic status and self-reported oral health in Iranian adolescents: The role of selected oral health behaviors and psychological factors. J. Publ. Health Dent. 2012, 72, 198–207. [Google Scholar] [CrossRef]
- Naghibi Sistani, M.M.; Yazdani, R.; Virtanen, J.; Pakdaman, A.; Murtomaa, H. Determinants of oral health: Does oral health literacy matter? ISRN Dent. 2013, 2013, 249591. [Google Scholar] [CrossRef]
- Manski, R.J.; Cooper, P.F. Dental care use: Does dental insurance truly make a difference in the US? Community Dent. Health 2007, 24, 205–212. [Google Scholar]
- Widstrom, E.; Seppala, T. Willingness and ability to pay for unexpected dental expenses by Finnish adults. BMC Oral Health 2012, 12, 35. [Google Scholar] [CrossRef]
- Vahid Dastjerdi, M.; Mahdian, M.; Vahid Dastjerdi, E.; Namdari, M. Study motives and career choices of Iranian medical and dental students. Acta Med. Iran. 2012, 50, 417–424. [Google Scholar]
- Steele, M.T.; Schwab, R.A.; McNamara, R.M.; Watson, W.A. Emergency medicine resident choice of practice location. Ann. Emerg. Med. 1998, 31, 351–357. [Google Scholar] [CrossRef]
- Seifer, S.D.; Vranizan, K.; Grumbach, K. Graduate medical education and physician practice location. Implications for physician workforce policy. JAMA 1995, 274, 685–691. [Google Scholar] [CrossRef]
- Kruger, E.; Tennant, M.; George, R. Application of geographic information systems to the analysis of private dental practices distribution in Western Australia. Rural Rem. Health 2011, 11, 1736. [Google Scholar]
- Okawa, Y.; Hirata, S.; Okada, M.; Ishii, T. Geographic distribution of dentists in Japan: 1980–2000. J. Publ. Health Dent. 2011, 71, 236–240. [Google Scholar]
- Haghparast Bidgoli, H.; Bogg, L.; Hasselberg, M. Pre-hospital trauma care resources for road traffic injuries in a middle-income country—A province based study on need and access in Iran. Injury 2011, 42, 879–884. [Google Scholar] [CrossRef]
- Shahabi M, T.S.; Maleki, M.R. The nurse and specialist physicians manpower distribution by population and its relationship with the number of beds at Iran’s public hospitals in 2001–2006. Health Manag. 2010, 13, 7–14. [Google Scholar]
- Kamppi, A.; Tanner, T.; Pakkila, J.; Patinen, P.; Jarvelin, M.R.; Tjaderhane, L.; Anttonen, V. Geographical distribution of dental caries prevalence and associated factors in young adults in Finland. Caries Res. 2013, 47, 346–354. [Google Scholar] [CrossRef]
- Cypriano, S.; Hoffmann, R.H.; de Sousa Mda, L.; Wada, R.S. Dental caries experience in 12-year-old schoolchildren in Southeastern Brazil. J. Appl. Oral Sci. 2008, 16, 286–292. [Google Scholar] [CrossRef]
© 2013 by the authors; licensee MDPI, Basel, Switzerland. This article is an open access article distributed under the terms and conditions of the Creative Commons Attribution license (http://creativecommons.org/licenses/by/3.0/).
Share and Cite
Kiadaliri, A.A.; Hosseinpour, R.; Haghparast-Bidgoli, H.; Gerdtham, U.-G. Pure and Social Disparities in Distribution of Dentists: A Cross-Sectional Province-Based Study in Iran. Int. J. Environ. Res. Public Health 2013, 10, 1882-1894. https://doi.org/10.3390/ijerph10051882
Kiadaliri AA, Hosseinpour R, Haghparast-Bidgoli H, Gerdtham U-G. Pure and Social Disparities in Distribution of Dentists: A Cross-Sectional Province-Based Study in Iran. International Journal of Environmental Research and Public Health. 2013; 10(5):1882-1894. https://doi.org/10.3390/ijerph10051882
Chicago/Turabian StyleKiadaliri, Aliasghar A., Reza Hosseinpour, Hassan Haghparast-Bidgoli, and Ulf-G Gerdtham. 2013. "Pure and Social Disparities in Distribution of Dentists: A Cross-Sectional Province-Based Study in Iran" International Journal of Environmental Research and Public Health 10, no. 5: 1882-1894. https://doi.org/10.3390/ijerph10051882