Study of Environmental Health Problems in Korea Using Integrated Environmental Health Indicators

Abstract
:1. Introduction
2. Methods and Materials
2.1. Selection of Indicators
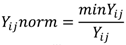
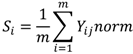
2.2. Calculation of Synthesized Measure
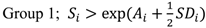
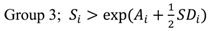
2.3. Classification of the Study Area into Three-Level Groups

2.4. Correlation Analysis between the Indicators
3. Results

| Category | Indicators |
|---|---|
| Environmental indicators (unit) | Emissions of SOx (ton/year) |
| Emissions of NOx (ton/year) | |
| Emissions of CO (ton/year) | |
| Emissions of NH3 (ton/year) | |
| Emissions of PM10 (ton/year) | |
| Emissions of TSP (ton/year) | |
| Emissions of VOC (ton/year) | |
| Concentration of NO2 (ppm) | |
| Concentration of O3 (ppm) | |
| Concentration of SO2 (ppm) | |
| Concentration of PM10 (ppm) | |
| Concentration of CO (ppm) | |
| Chemical fertilizer consumption (ton/year) | |
| Chemicals emission from non-point pollution source (kg/year) | |
| Night-soil generation by human (m3/day) † | |
| Night-soil generation by livestock (m3/day) ‡ | |
| Chemicals emission (kg/year) | |
| Generation of total wastes (ton/day) | |
| Health status indicators (ICD-10 code) | The age-standardized mortality rate of malignant neoplasm of stomach (C16); colon (C18); rectosigmoid junction (19); rectum (20); anus and anal canal (C21); trachea (C33); bronchus and lung (C34); breast (C50); cervix uteri (C55); leukemia (C91–C95) |
| The age-standardized mortality rate of diseases of the blood and blood-forming organs and certain disorders involving the immune mechanism (D50–D89) | |
| The age-standardized mortality rate of ischemic heart diseases (I20–I25) | |
| The mortality rate of chronic lower respiratory diseases (J40–J47) | |
| The age-standardized mortality rate of diseases of the skin and subcutaneous tissue (L00–L98) | |
| The age-standardized mortality rate of congenital malformations, deformations and chromosomal abnormalities (Q00–Q99) | |
| General infant mortality | |
| The proportion of births with low birth weight (<2,500 g) |
4. Discussion
| Category | Value | Indicator (unit) a | Mean (SD) | Min–Max |
|---|---|---|---|---|
| Environmental | Real | Emissions of SOx (ton/year) | 25,641.63 (22,951.95) | (1,147–77,690) |
| Emissions of NOx (ton/year) | 69,803.88 (46,166.69) | (10,419–190,844) | ||
| Emissions of CO (ton/year) | 47,267.72 (36,020.82) | (9,014.5–137,528) | ||
| Emissions of NH3 (ton/year) | 17,950.88 (15,546.91) | (1,539.5–47,928) | ||
| Emissions of PM10 (ton/year) | 6,529.78 (7,910.8) | (416–29,099.5) | ||
| Emissions of TSP (ton/year) | 9,878.97 (13,406.62) | (451–48,443.5) | ||
| Emissions of VOC (ton/year) | 54,203.03 (41,368.87) | (6,246–169,280) | ||
| Concentration of NO2 (ppm) | 0.0218438 (0.0059909) | (0.0135–0.0365) | ||
| Concentration of O3 (ppm) | 0.039375 (0.0388383) | (0.02–0.149) | ||
| Concentration of SO2 (ppm) | 0.0054688 (0.0013841) | (0.0025–0.008) | ||
| Concentration of PM10 (ppm) | 51.25 (5.4772256) | (42.5–61) | ||
| Concentration of CO (ppm) | 0.534375 (0.1011908) | (0.3–0.7) | ||
| Chemical fertilizer consumption (ton/year) | 29,268.53 (29,249.08) | (762.5–90670) | ||
| Chemicals emission from non-point pollution source (kg/year) | 9,721,611.31 (9,060,724.6) | (2,002,351–39,409,019) | ||
| Night-soil generation by human (m3/day) ‡ | 3,147.66 (3,621.71) | (728.5–13,611.5) | ||
| Night-soil generation by livestock (m3/day) § | 9,216.28 (10,233.14) | (8.5–30,976) | ||
| Chemicals emission (kg/year) | 2,978,523.06 (2,981,887.9) | (110.5–9,490,370) | ||
| Generation of total wastes (ton/day) | 22,361.19 (15,995.46) | (2,500.5–61,320) | ||
| Norm | Emissions of SOx (ton/year) | 0.17159 (0.25875) | (0.01476–1.00000) | |
| Emissions of NOx (ton/year) | 0.27602 (0.27969) | (0.05459–1.00000) | ||
| Emissions of CO (ton/year) | 0.29586 (0.22697) | (0.06555–1.00000) | ||
| Emissions of NH3 (ton/year) | 0.25661 (0.30088) | (0.03212–1.00000) | ||
| Emissions of PM10 (ton/year) | 0.23413 (0.28579) | (0.01430–1.00000) | ||
| Emissions of TSP (ton/year) | 0.22870 (0.29591) | (0.00931–1.00000) | ||
| Emissions of VOC (ton/year) | 0.22051 (0.23562) | (0.03690–1.00000) | ||
| Concentration of NO2 (ppm) | 0.65734 (0.16073) | (0.36986–1.00000) | ||
| Concentration of O3 (ppm) | 0.72548 (0.25091) | (0.13423–1.00000) | ||
| Concentration of SO2 (ppm) | 0.49226 (0.16138) | (0.31250–1.00000) | ||
| Concentration of PM10 (ppm) | 0.83810 (0.08869) | (0.69672–1.00000) | ||
| Concentration of CO (ppm) | 0.58575 (0.14194) | (0.42857–1.00000) | ||
| Chemical fertilizer consumption (ton/year) | 0.16371 (0.25237) | (0.00841–1.00000) | ||
| Chemicals emission from non-point pollution source (kg/year) | 0.34648 (0.24722) | (0.05081–1.00000) | ||
| Night-soil generation by human (m3/day) c | 0.42625 (0.25178) | (0.05352–1.00000) | ||
| Night-soil generation by livestock (m3/day) d | 0.07721 (0.24717) | (0.00027–1.00000) | ||
| Chemicals emission (kg/year) | 0.06263 (0.24996) | (0.00001–1.00000) | ||
| Generation of total wastes (ton/day) | 0.21284 (0.23699) | (0.04078–1.00000) | ||
| SE b | 0.34842 (0.15065) | (0.23278–0.78782) | ||
| Health status | Real | C16 (per 100,000) | 18.441 (1.956) | (14.300–21.600) |
| C33–C34 (per 100,000) | 26.359 (3.182) | (18.300–30.750) | ||
| D50–D89 (per 100,000) | 0.975 (0.224) | (0.650–1.600) | ||
| I20–I25 (per 100,000) | 22.253 (4.646) | (14.700–34.500) | ||
| J40–J47 (per 100,000) | 12.563 (2.571) | (8.000–15.850) | ||
| Norm | C16 (per 100,000) | 0.784 (0.088) | (0.662–1.000) | |
| C33–C34 | 0.706 (0.101) | (0.595–1.000) | ||
| D50–D89 | 0.695 (0.139) | (0.406–1.000) | ||
| I20–I25 | 0.686 (0.135) | (0.426–1.000) | ||
| J40–J47 | 0.667 (0.162) | (0.505–1.000) | ||
| SH b | 0.708 (0.107) | (0.568–0.995) |
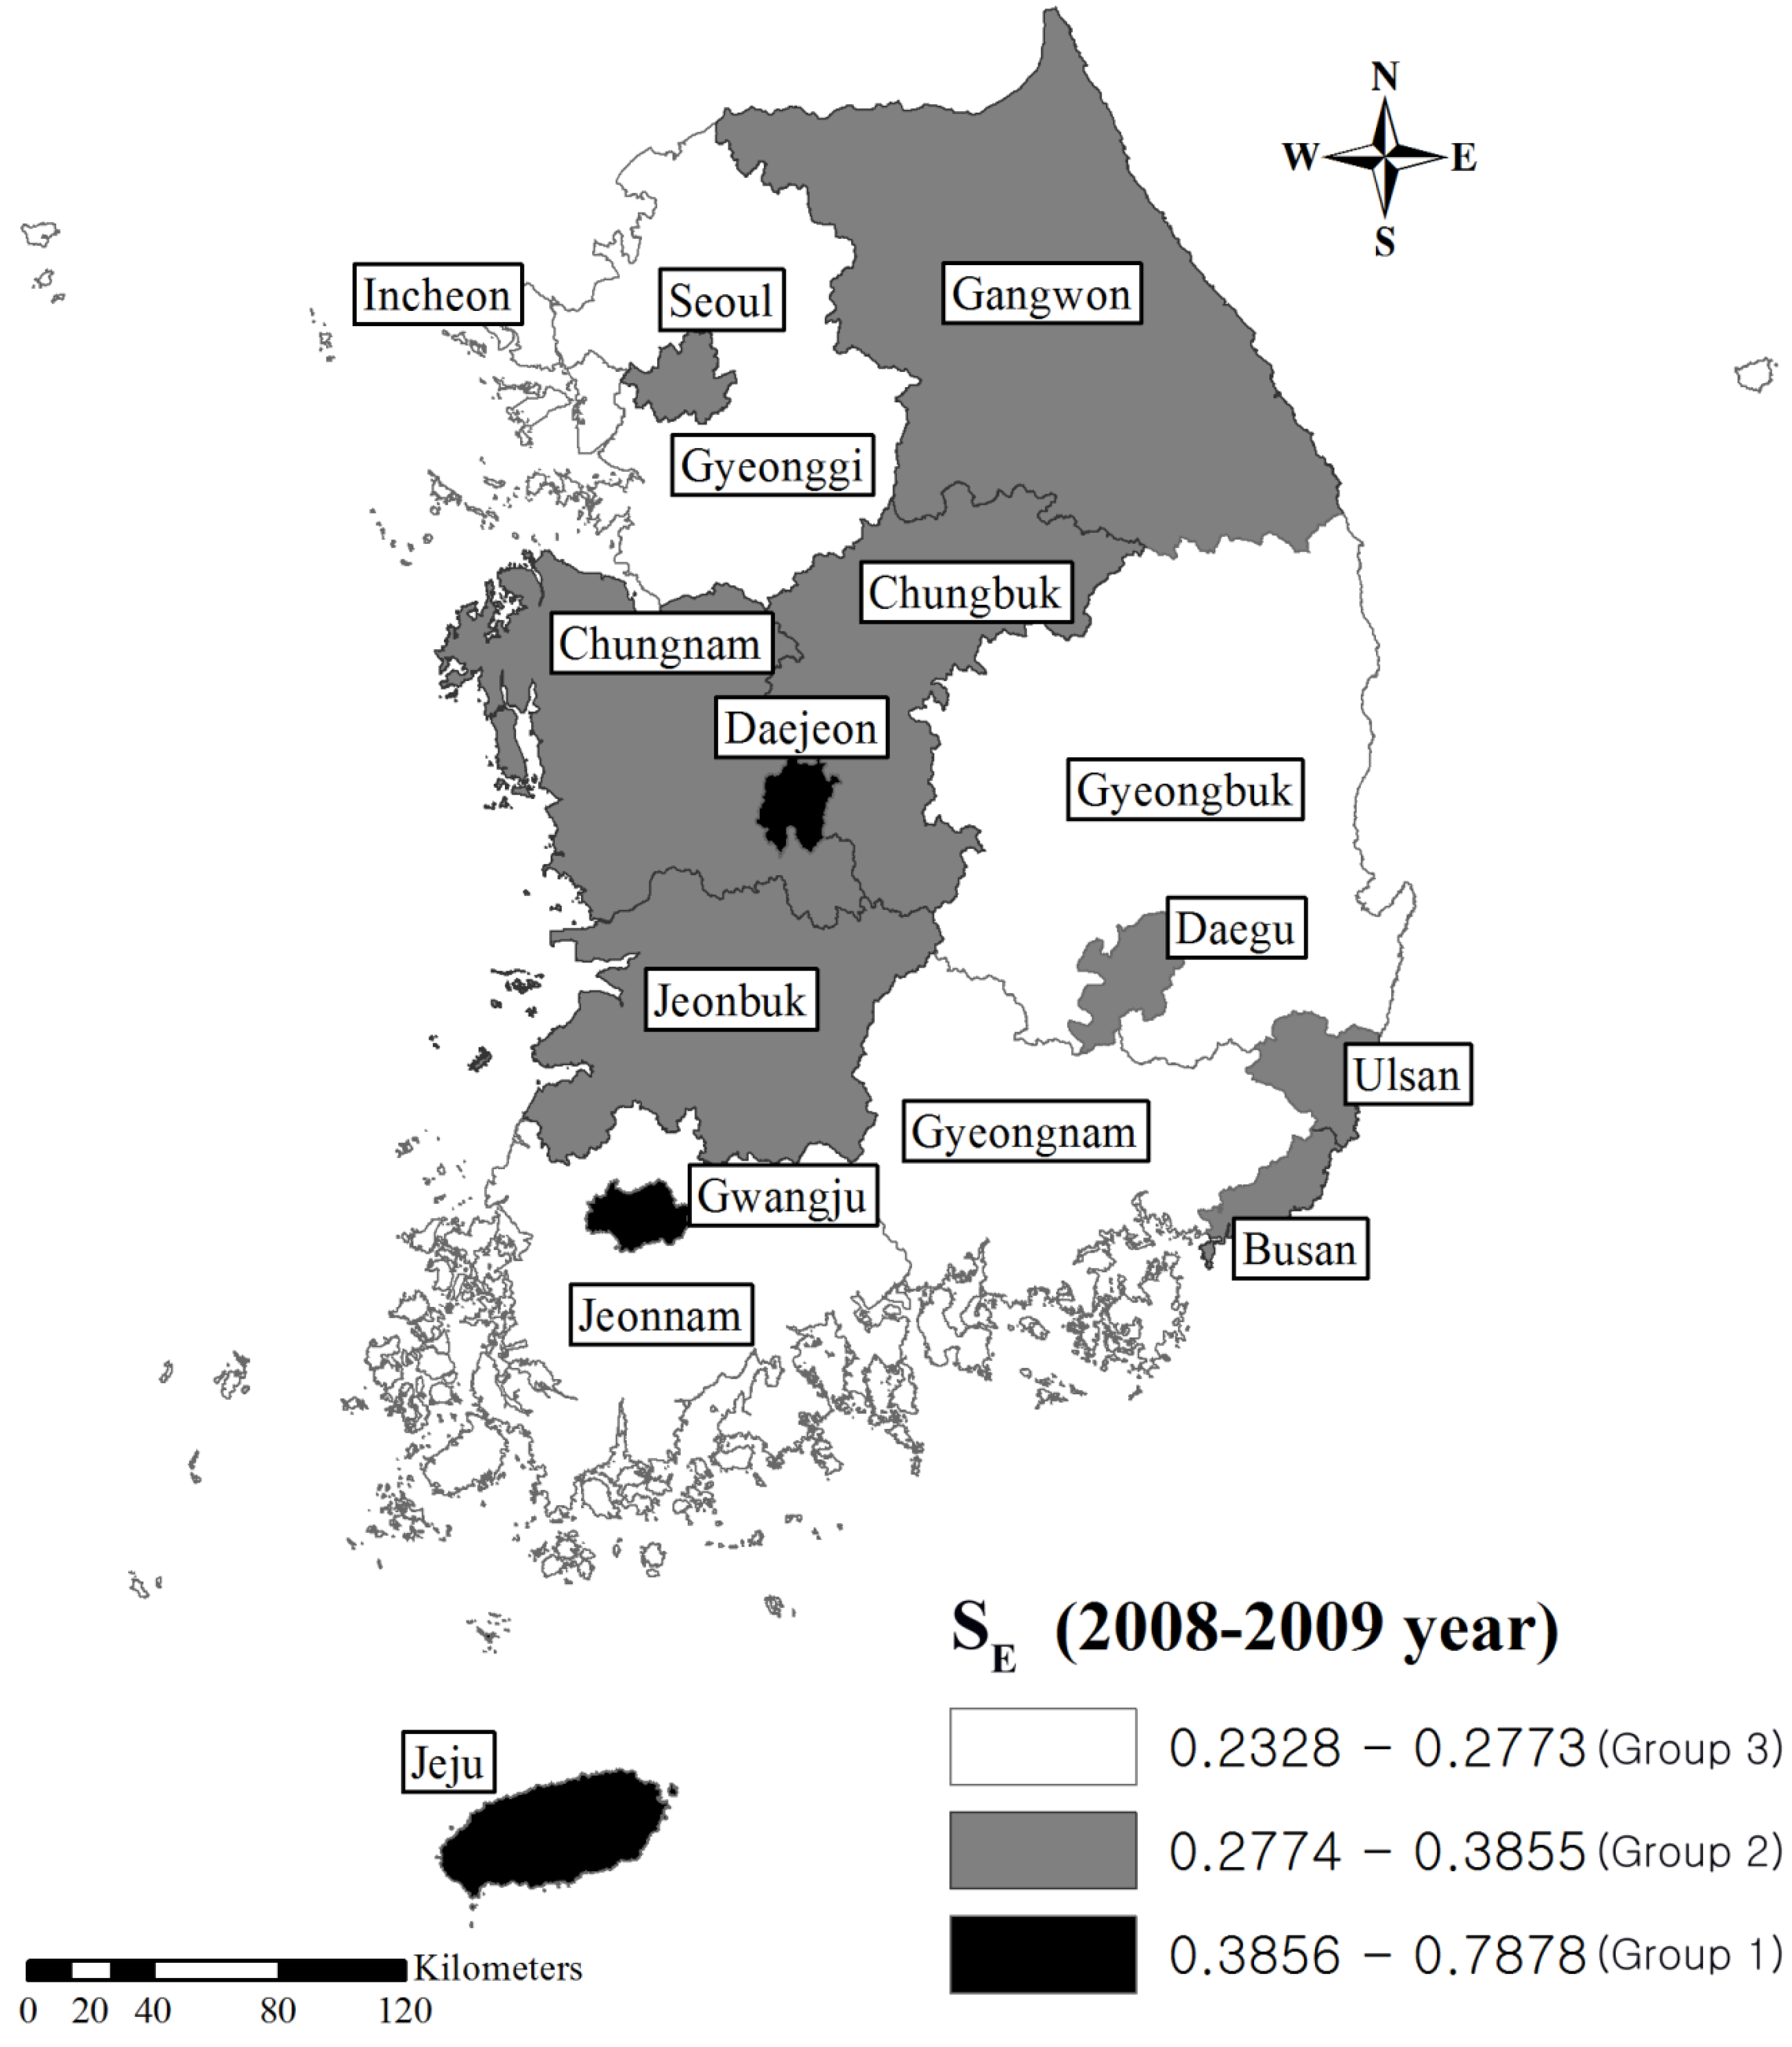
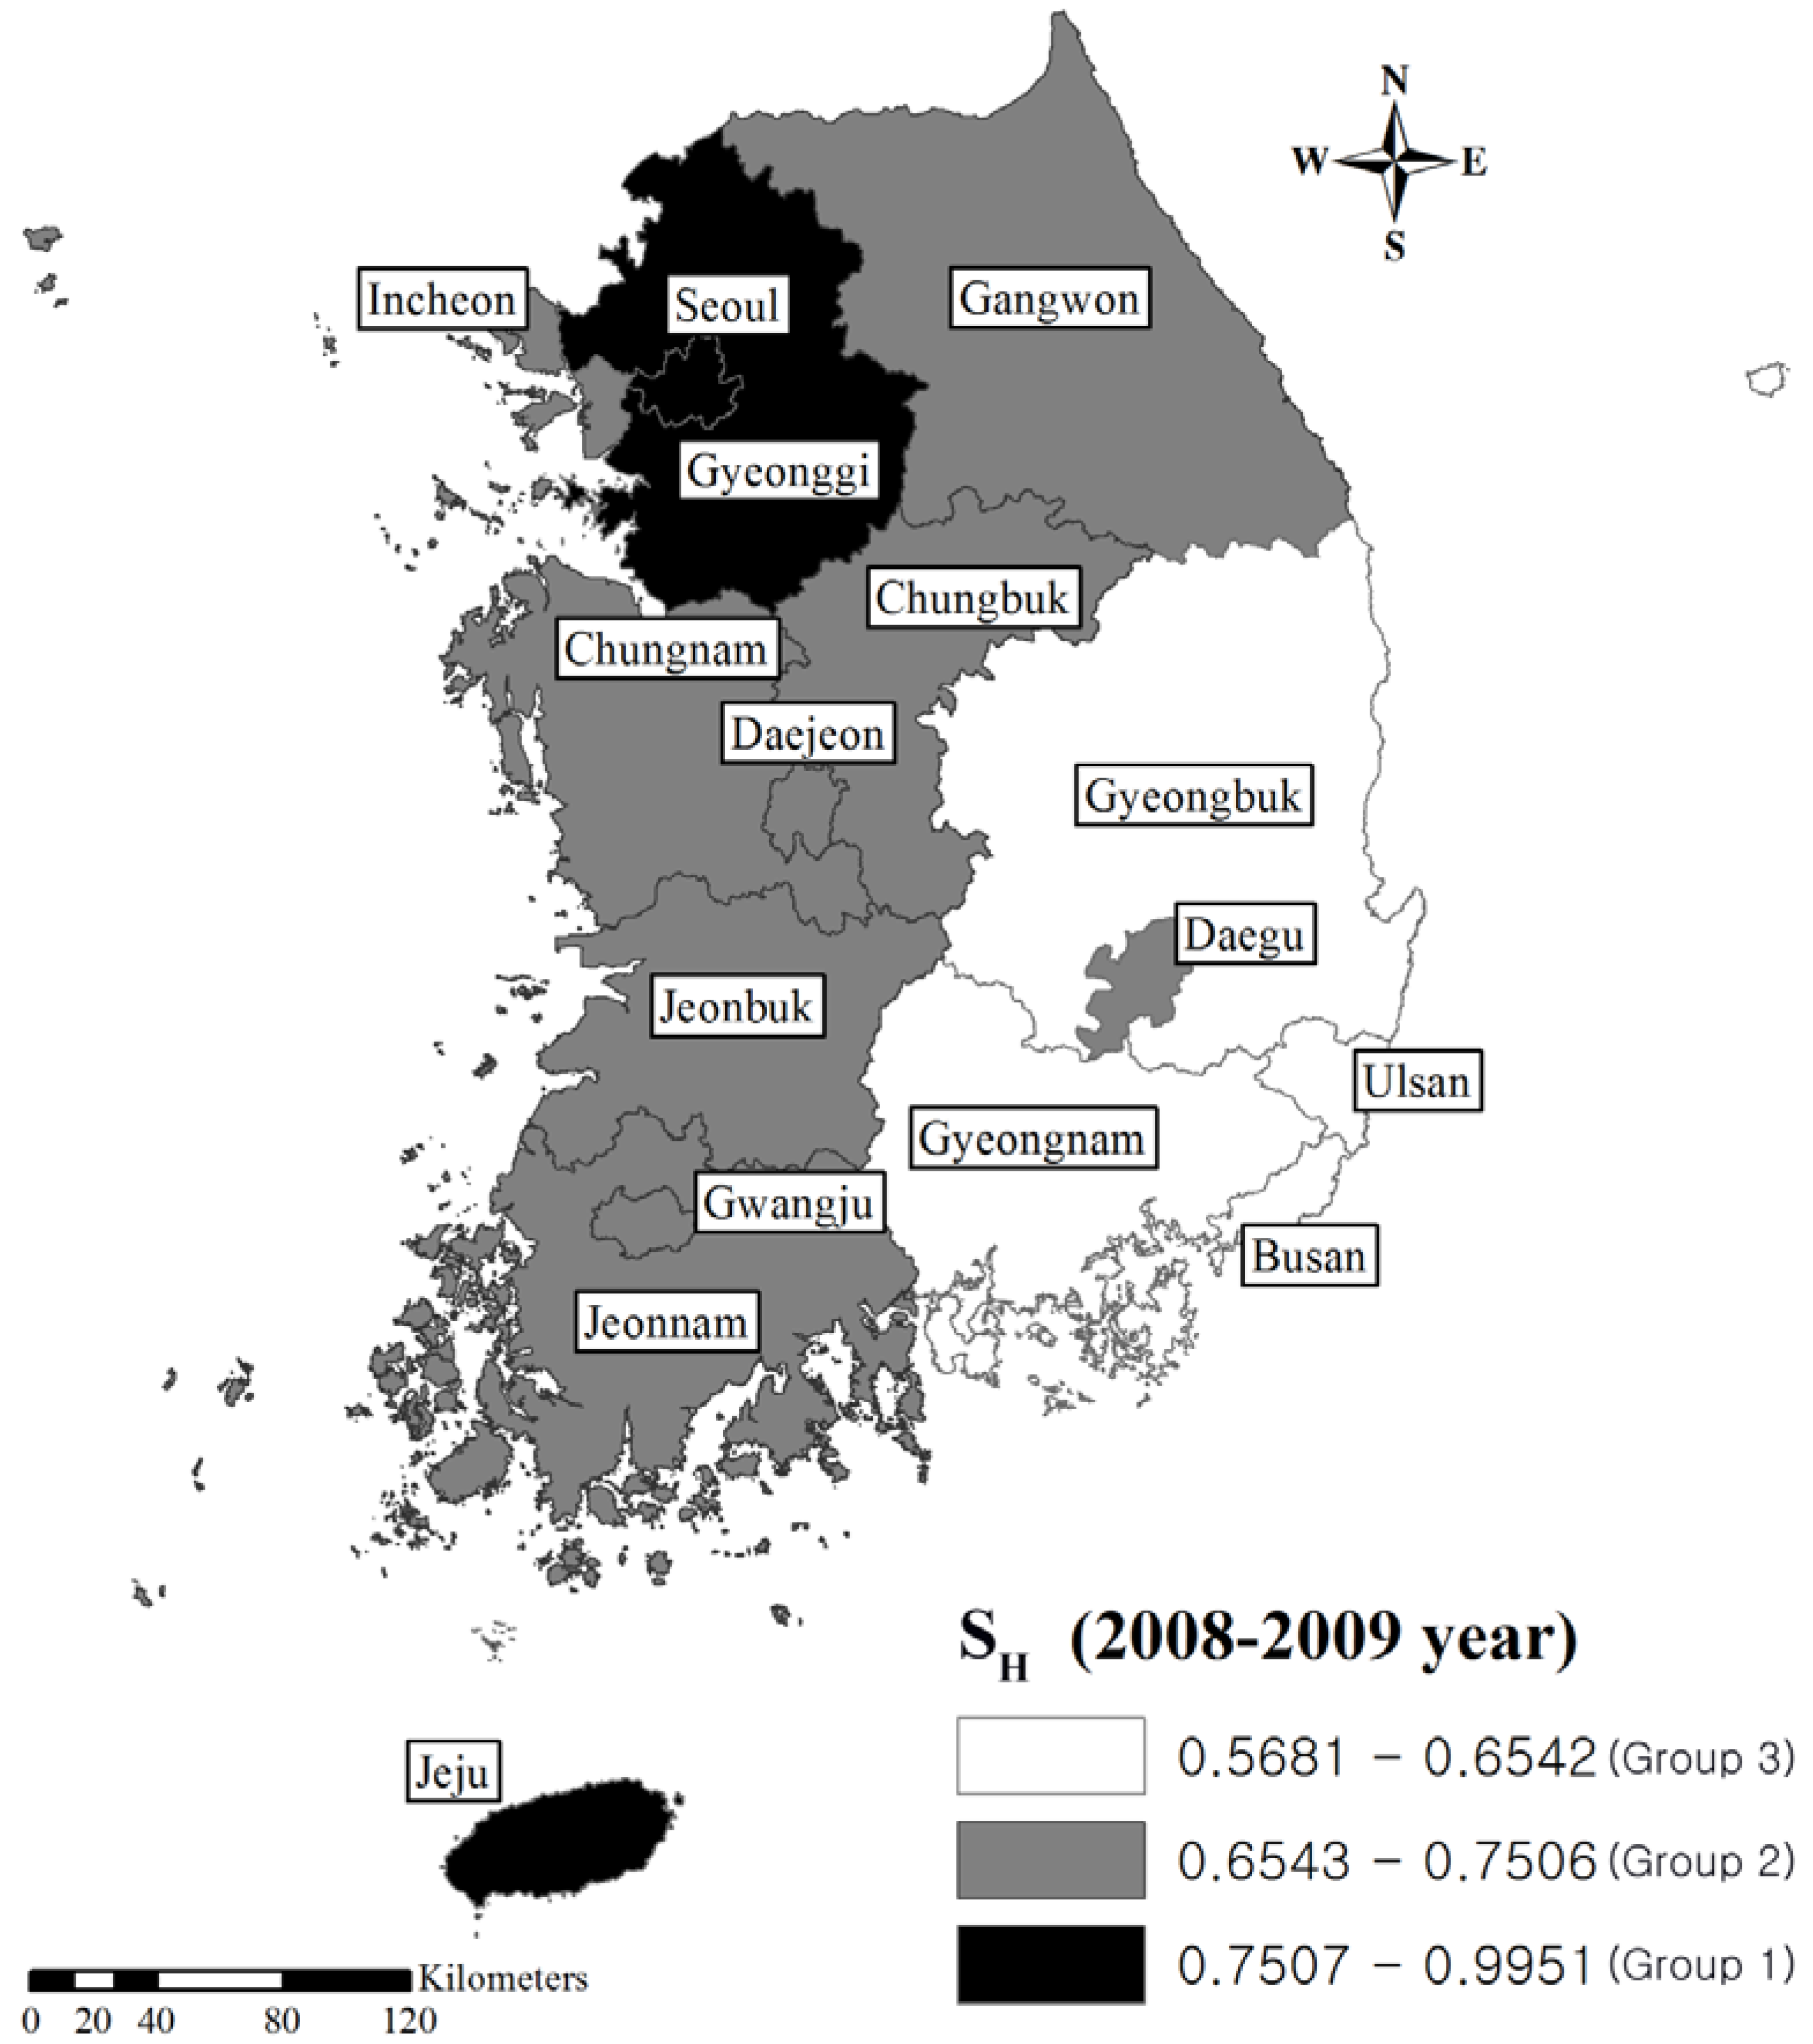
| Area | SE a | Rank of SE | SH a | Rank of SH |
|---|---|---|---|---|
| Jeju | 0.7878 | 1 | 0.9951 | 1 |
| Gwangju | 0.5831 | 2 | 0.7482 | 5 |
| Daejeon | 0.5127 | 3 | 0.7483 | 4 |
| Jeonbuk | 0.3319 | 4 | 0.6907 | 8 |
| Ulsan | 0.3177 | 5 | 0.6149 | 14 |
| Gangwon | 0.3057 | 6 | 0.6815 | 9 |
| Busan | 0.2987 | 7 | 0.5681 | 16 |
| Seoul | 0.2973 | 8 | 0.8609 | 2 |
| Daegu | 0.2964 | 9 | 0.6637 | 11 |
| Chungbuk | 0.2963 | 10 | 0.6573 | 12 |
| Chungnam | 0.2925 | 11 | 0.6784 | 10 |
| Incheon | 0.2697 | 12 | 0.6956 | 7 |
| Jeonnam | 0.2640 | 13 | 0.7167 | 6 |
| Gyeonggi | 0.2505 | 14 | 0.7902 | 3 |
| Gyeongbuk | 0.2374 | 15 | 0.5904 | 15 |
| Gyeongnam | 0.2328 | 16 | 0.6226 | 13 |
| SE a | SH a | |||
|---|---|---|---|---|
| Group | Area | Value of SE | Area | Value of SH |
| Group 1 | Jeju | 0.787821 | Jeju | 0.995122 |
| Gwangju | 0.583129 | Seoul | 0.860913 | |
| Daejeon | 0.512685 | Gyeonggi | 0.79016 | |
| Group 2 | Jeonbuk | 0.33188 | Gwangju | 0.748204 |
| Ulsan | 0.317726 | Daejeon | 0.748304 | |
| Gangwon | 0.305723 | Jeonbuk | 0.690734 | |
| Busan | 0.298713 | Gangwon | 0.681507 | |
| Seoul | 0.297323 | Daegu | 0.663668 | |
| Daegu | 0.296376 | Chungbuk | 0.657349 | |
| Chungbuk | 0.296334 | Chungnam | 0.678388 | |
| Chungnam | 0.29253 | Incheon | 0.695561 | |
| Jeonnam | 0.716714 | |||
| Group 3 | Incheon | 0.269708 | Ulsan | 0.614946 |
| Jeonnam | 0.263994 | Busan | 0.568061 | |
| Gyeonggi | 0.250511 | Gyeongbuk | 0.590358 | |
| Gyeongbuk | 0.237413 | Gyeongnam | 0.622618 | |
| Gyeongnam | 0.232778 | |||


| List of health status indicators (ICD-10) | r (95% CI) |
|---|---|
| Malignant neoplasm of stomach (C16) | 0.64 (0.19–0.86) |
| Malignant neoplasm of trachea, bronchus, and lung (C33–C34) b | 0.56 (0.07–0.82) |
| Diseases of the blood and blood-forming organs and certain disorders involving the immune mechanism (D50–D89) | 0.54 (0.04–0.81) |
| Ischemic heart diseases (I20–I25) | 0.59 (0.12–0.84) |
| Chronic lower respiratory diseases (J40–J47) b | 0.18 (−0.35–0.62) |
5. Conclusions
Acknowledgements
Conflict of Interest
References
- McKone, T.E.; Ryan, P.B.; Özkaynak, H. Exposure information in environmental health research: Current opportunities and future directions for particulate matter, ozone, and toxic air pollutants. J. Expo. Sci. Environ. Epidemiol. 2008, 19, 30–44. [Google Scholar] [CrossRef]
- Wcislo, E.; Dutkiewicz, T.; Konczalik, J. Indicator-based assessment of environmental hazards and health effects in the industrial cities of upper silesia, poland. Environ. Health Perspect. 2002, 110, 1133–1139. [Google Scholar] [CrossRef]
- Wills, J.T.; Briggs, D.J. Developing indicators for environment and health. World Health Stat. Q. 1995, 48, 155–163. [Google Scholar]
- Briggs, D.; Corvalán, C.; Nurminen, M. Linkage Methods for Environment and Health Analysis: General Guidelines; World Health Organisation (WHO): Geneva, Switzerland, 1996. [Google Scholar]
- Bell, M.L.; Cifuentes, L.A.; Davis, D.L.; Cushing, E.; Telles, A.G.; Gouveia, N. Environmental health indicators and a case study of air pollution in latin american cities. Environ. Res. 2011, 111, 57–66. [Google Scholar] [CrossRef]
- Corvalán, C.; Kjellström, T. Health and environment analysis for decision-making. In Linkage Methods for Environment and Health Analysis: General Guidelines; Briggs, D., Corvalán, C., Nurminen, M., Eds.; World Health Organisation (WHO): Geneva, Switzerland, 1996; pp. 1–18. [Google Scholar]
- Corvalán, C.; Briggs, D.; Kjellström, T. Development of environmental health indicators. In Linkage Methods for Environment and Health Analysis: General Guidelines; Briggs, D., Corvalán, C., Nurminen, M., Eds.; World Health Organisation (WHO): Geneva, Switzerland, 1996; pp. 19–54. [Google Scholar]
- World Health Organization Regional Office for Europe, Health and Environment in Europe: Progress Assessment/Who Regional Office for Europe; World Health Organisation (WHO): Geneva, Switzerland, 2010.
- EPA’s 2008 Report on the Environment; United States Environmental Protection Agency: Washington, DC, USA, 2009.
- Jong-Han, L. A Study of Evaluation Methods for Environmental Health in the Local Community(I); National Institute of Environmental Research: Inchon, Korea, 2008. [Google Scholar]
- Jong-Tae, L. A Study of Evaluation Methods for Environmental Health in the Local Community(II); National Institute of Environmental Research: Inchon, Korea, 2009. [Google Scholar]
- Chul, W.L.; Seung, J.W.; Sang, H.S.; Wook, H.C.; So, R.O.; Seung, D.Y. A Study on National Environmental Health Assessment with Environmental Health Indicators; National Institute of Environmental Research: Inchon, Korea, 2010. [Google Scholar]
- Jong-Tae, L. A Study of Review and Development Environmental Health Indicators; National Institute of Environmental Research: Inchon, Korea, 2010. [Google Scholar]
- Jong-Tae, L. A Study of Evaluation Methods for Environmental Health in the Local Community(III); National Institute of Environmental Research: Inchon, Korea, 2010. [Google Scholar]
- Kyung, H.P.; Jun, Y.C.; Woog, H.C.; Soon, W.J.; Seung, D.Y. A Study on National and Local Environmental Health Assessment(I); Ministry of Environment: Inchon, Korea, 2011; p. 38. [Google Scholar]
- Choong, H.P.; Jun, Y.C.; Young, M.L.; Bo-Eun, L.; Soon, W.J.; Seung, D.Y.; Kyunghee, C. A Study on National and Local Environmental Health Assessment(II); Ministry of Environment: Inchon, Korea, 2012. [Google Scholar]
- Briggs, D. Environmental pollution and the global burden of disease. Br. Med. Bull. 2003, 68, 1–24. [Google Scholar] [CrossRef]
- Corvalán, C.; Briggs, D.; Zielhuis, G. Rrequirements for successful environmental health decision-making. In Decision-Making in Environmental Health: From Evidence to Action; Corvalán, C., Briggs, D., Zielhuis, G., Eds.; Routledge: London, UK, 2000. [Google Scholar]
- Dutkiewicz, T.; Konczalik, J.; Murowaniecki, Z. Evaluation of regional environmental and health hazards by applying synthetic measures. Rev. Environ. Health 1998, 13, 111–130. [Google Scholar]
- Baert, K.; van Huffel, X.; Wilmart, O.; Jacxsens, L.; Berkvens, D.; Diricks, H.; Huyghebaert, A.; Uyttendaele, M. Measuring the safety of the food chain in belgium: Development of a barometer. Food Res. Int. 2011, 44, 940–950. [Google Scholar] [CrossRef]
- Zhou, P.; Ang, B.; Poh, K. Comparing aggregating methods for constructing the composite environmental index: An objective measure. Ecol. Econ. 2006, 59, 305–311. [Google Scholar] [CrossRef]
- Environmental Statistics Yearbook; The Ministry of Environment: Inchon, Korea, 2009.
- Environmental Statistics Yearbook; The Ministry of Environment: Inchon, Korea, 2010.
- Annual Report of Ambient Air Quality in Korea; The Ministry of Environment: Inchon, Korea, 2010.
- Annual Report of Ambient Air Quality in Korea; The Ministry of Environment: Inchon, Korea, 2009.
- Jina, H.; Hyo, M.K.; Jong, T.L. The study of relationships between proximity to an industry complex and blood lead levels and urinary cadmium levels. Korean Soc. Environ. Health 2012, 38, 95–104. [Google Scholar] [CrossRef]
- Chiu, H.F.; Tsai, S.S.; Chen, P.S.; Liao, Y.H.; Liou, S.H.; Wu, T.N.; Yang, C.Y. Traffic air pollution and risk of death from gastric cancer in taiwan: Petrol station density as an indicator of air pollutant exposure. J. Toxicol. Environ. Health 2011, 74, 1215–1224. [Google Scholar] [CrossRef]
- Sjödahl, K.; Jansson, C.; Bergdahl, I.A.; Adami, J.; Boffetta, P.; Lagergren, J. Airborne exposures and risk of gastric cancer: A prospective cohort study. Int. J. Cancer 2007, 120, 2013–2018. [Google Scholar] [CrossRef]
- Turner, M.C.; Krewski, D.; Pope, C.A.; Chen, Y.; Gapstur, S.M.; Thun, M.J. Long-term ambient fine particulate matter air pollution and lung cancer in a large cohort of never-smokers. Am. J. Respir. Crit. Care Med. 2011, 184, 1374–1381. [Google Scholar] [CrossRef]
- Nikolić, M.; Nikić, D.; Stanković, A. Effects of air pollution on red blood cells in children. Pol. J. Environ. Stud. 2008, 17, 267–271. [Google Scholar]
- Zanobetti, A.; Schwartz, J. The effect of particulate air pollution on emergency admissions for myocardial infarction: A multicity case-crossover analysis. Environ. Health Perspect. 2005, 113, 978–982. [Google Scholar] [CrossRef]
- Pope, C.A.; Burnett, R.T.; Thurston, G.D.; Thun, M.J.; Calle, E.E.; Krewski, D.; Godleski, J.J. Cardiovascular mortality and long-term exposure to particulate air pollution epidemiological evidence of general pathophysiological pathways of disease. Circulation 2004, 109, 71–77. [Google Scholar]
- Pope, C.A.; Muhlestein, J.B.; May, H.T.; Renlund, D.G.; Anderson, J.L.; Horne, B.D. Ischemic heart disease events triggered by short-term exposure to fine particulate air pollution. Circulation 2006, 114, 2443–2448. [Google Scholar] [CrossRef]
- Lindgren, A.; Stroh, E.; Montnémery, P.; Nihlén, U.; Jakobsson, K.; Axmon, A. Traffic-related air pollution associated with prevalence of asthma and copd/chronic bronchitis. A cross-sectional study in southern sweden. Int. J. Health Geogr. 2009, 8, 1–15. [Google Scholar] [CrossRef]
- Schikowski, T.; Sugiri, D.; Ranft, U.; Gehring, U.; Heinrich, J.; Wichmann, H.E.; Kramer, U. Long-term air pollution exposure and living close to busy roads are associated with copd in women. Respir. Res. 2005, 6, 152. [Google Scholar] [CrossRef]
- Li, J.; Lu, Y.; Shi, Y.; Wang, T.; Wang, G.; Luo, W.; Jiao, W.; Chen, C.; Yan, F. Environmental pollution by persistent toxic substances and health risk in an industrial area of china. J. Environ. Sci. 2011, 23, 1359–1367. [Google Scholar] [CrossRef]
- Deubelbeiss, U.; Gemperli, A.; Schindler, C.; Baty, F.; Brutsche, M.H. Prevalence of sarcoidosis in switzerland is associated with environmental factors. Eur. Respir. J. 2010, 35, 1088–1097. [Google Scholar] [CrossRef]
- Munda, G.; Nardo, M. On the methodological foundations of composite indicators used for ranking countries. J. Res. Centre Euro. Commun. 2003, 11, 1–19. [Google Scholar]
- Hope, C.; Parker, J.; Peake, S. A pilot environmental index for the UK in the 1980s. Energ. Pol. 1992, 20, 335–343. [Google Scholar] [CrossRef]
- Hollander, A.E.D.; Melse, J.M.; Lebret, E.; Kramers, P.G. An aggregate public health indicator to represent the impact of multiple environmental exposures. Epidemiology 1999, 10, 606–617. [Google Scholar]
- World Health Organization, Regional Office for Europe; Environmental Health Indicators: Development of a Methodology for the Who European Region; World Health Organisation (WHO) for Europe: Copenhagen, Denmark, 2000.
- Goldberg, M.S. On the interpretation of epidemiological studies of ambient air pollution. J. Expo. Sci. Environ. Epidemiol. 2007, 17, S66–S70. [Google Scholar] [CrossRef]
- Hambling, T.; Weinstein, P.; Slaney, D. A review of frameworks for developing environmental health indicators for climate change and health. Int. J. Environ. Res. Public Health 2011, 8, 2854–2875. [Google Scholar] [CrossRef]
- Brulle, R.J.; Pellow, D.N. Environmental justice: Human health and environmental inequalities. Annu. Rev. Public Health 2006, 27, 103–124. [Google Scholar] [CrossRef]
- Laurent, O.; Bard, D.; Filleul, L.; Segala, C. Effect of socioeconomic status on the relationship between atmospheric pollution and mortality. J. Epidemiol. Community Health 2007, 61, 665–675. [Google Scholar] [CrossRef]
© 2013 by the authors; licensee MDPI, Basel, Switzerland. This article is an open access article distributed under the terms and conditions of the Creative Commons Attribution license (http://creativecommons.org/licenses/by/3.0/).
Share and Cite
Heo, S.; Lee, J.-T. Study of Environmental Health Problems in Korea Using Integrated Environmental Health Indicators. Int. J. Environ. Res. Public Health 2013, 10, 3140-3156. https://doi.org/10.3390/ijerph10083140
Heo S, Lee J-T. Study of Environmental Health Problems in Korea Using Integrated Environmental Health Indicators. International Journal of Environmental Research and Public Health. 2013; 10(8):3140-3156. https://doi.org/10.3390/ijerph10083140
Chicago/Turabian StyleHeo, Seulkee, and Jong-Tae Lee. 2013. "Study of Environmental Health Problems in Korea Using Integrated Environmental Health Indicators" International Journal of Environmental Research and Public Health 10, no. 8: 3140-3156. https://doi.org/10.3390/ijerph10083140