Performance Evaluation of Public Non-Profit Hospitals Using a BP Artificial Neural Network: The Case of Hubei Province in China


Abstract
:1. Introduction
2. Methods
2.1. Data Collection
2.2. Establishing the Evaluation System
2.2.1. Indicator Selection
2.2.2. Tendency Treatment


 is the minimum value of indicator j for all of the evaluation subjects, and
  is the maximum value of indicator j for all of the evaluation subjects. If the best standard value was not provided, we used X ± S as the best value (e.g., the daily number of clinic patients for each doctor).
2.2.3. Weight Definition

 . In addition, pij ln pij is defined as 0 if pij = 0.
  .
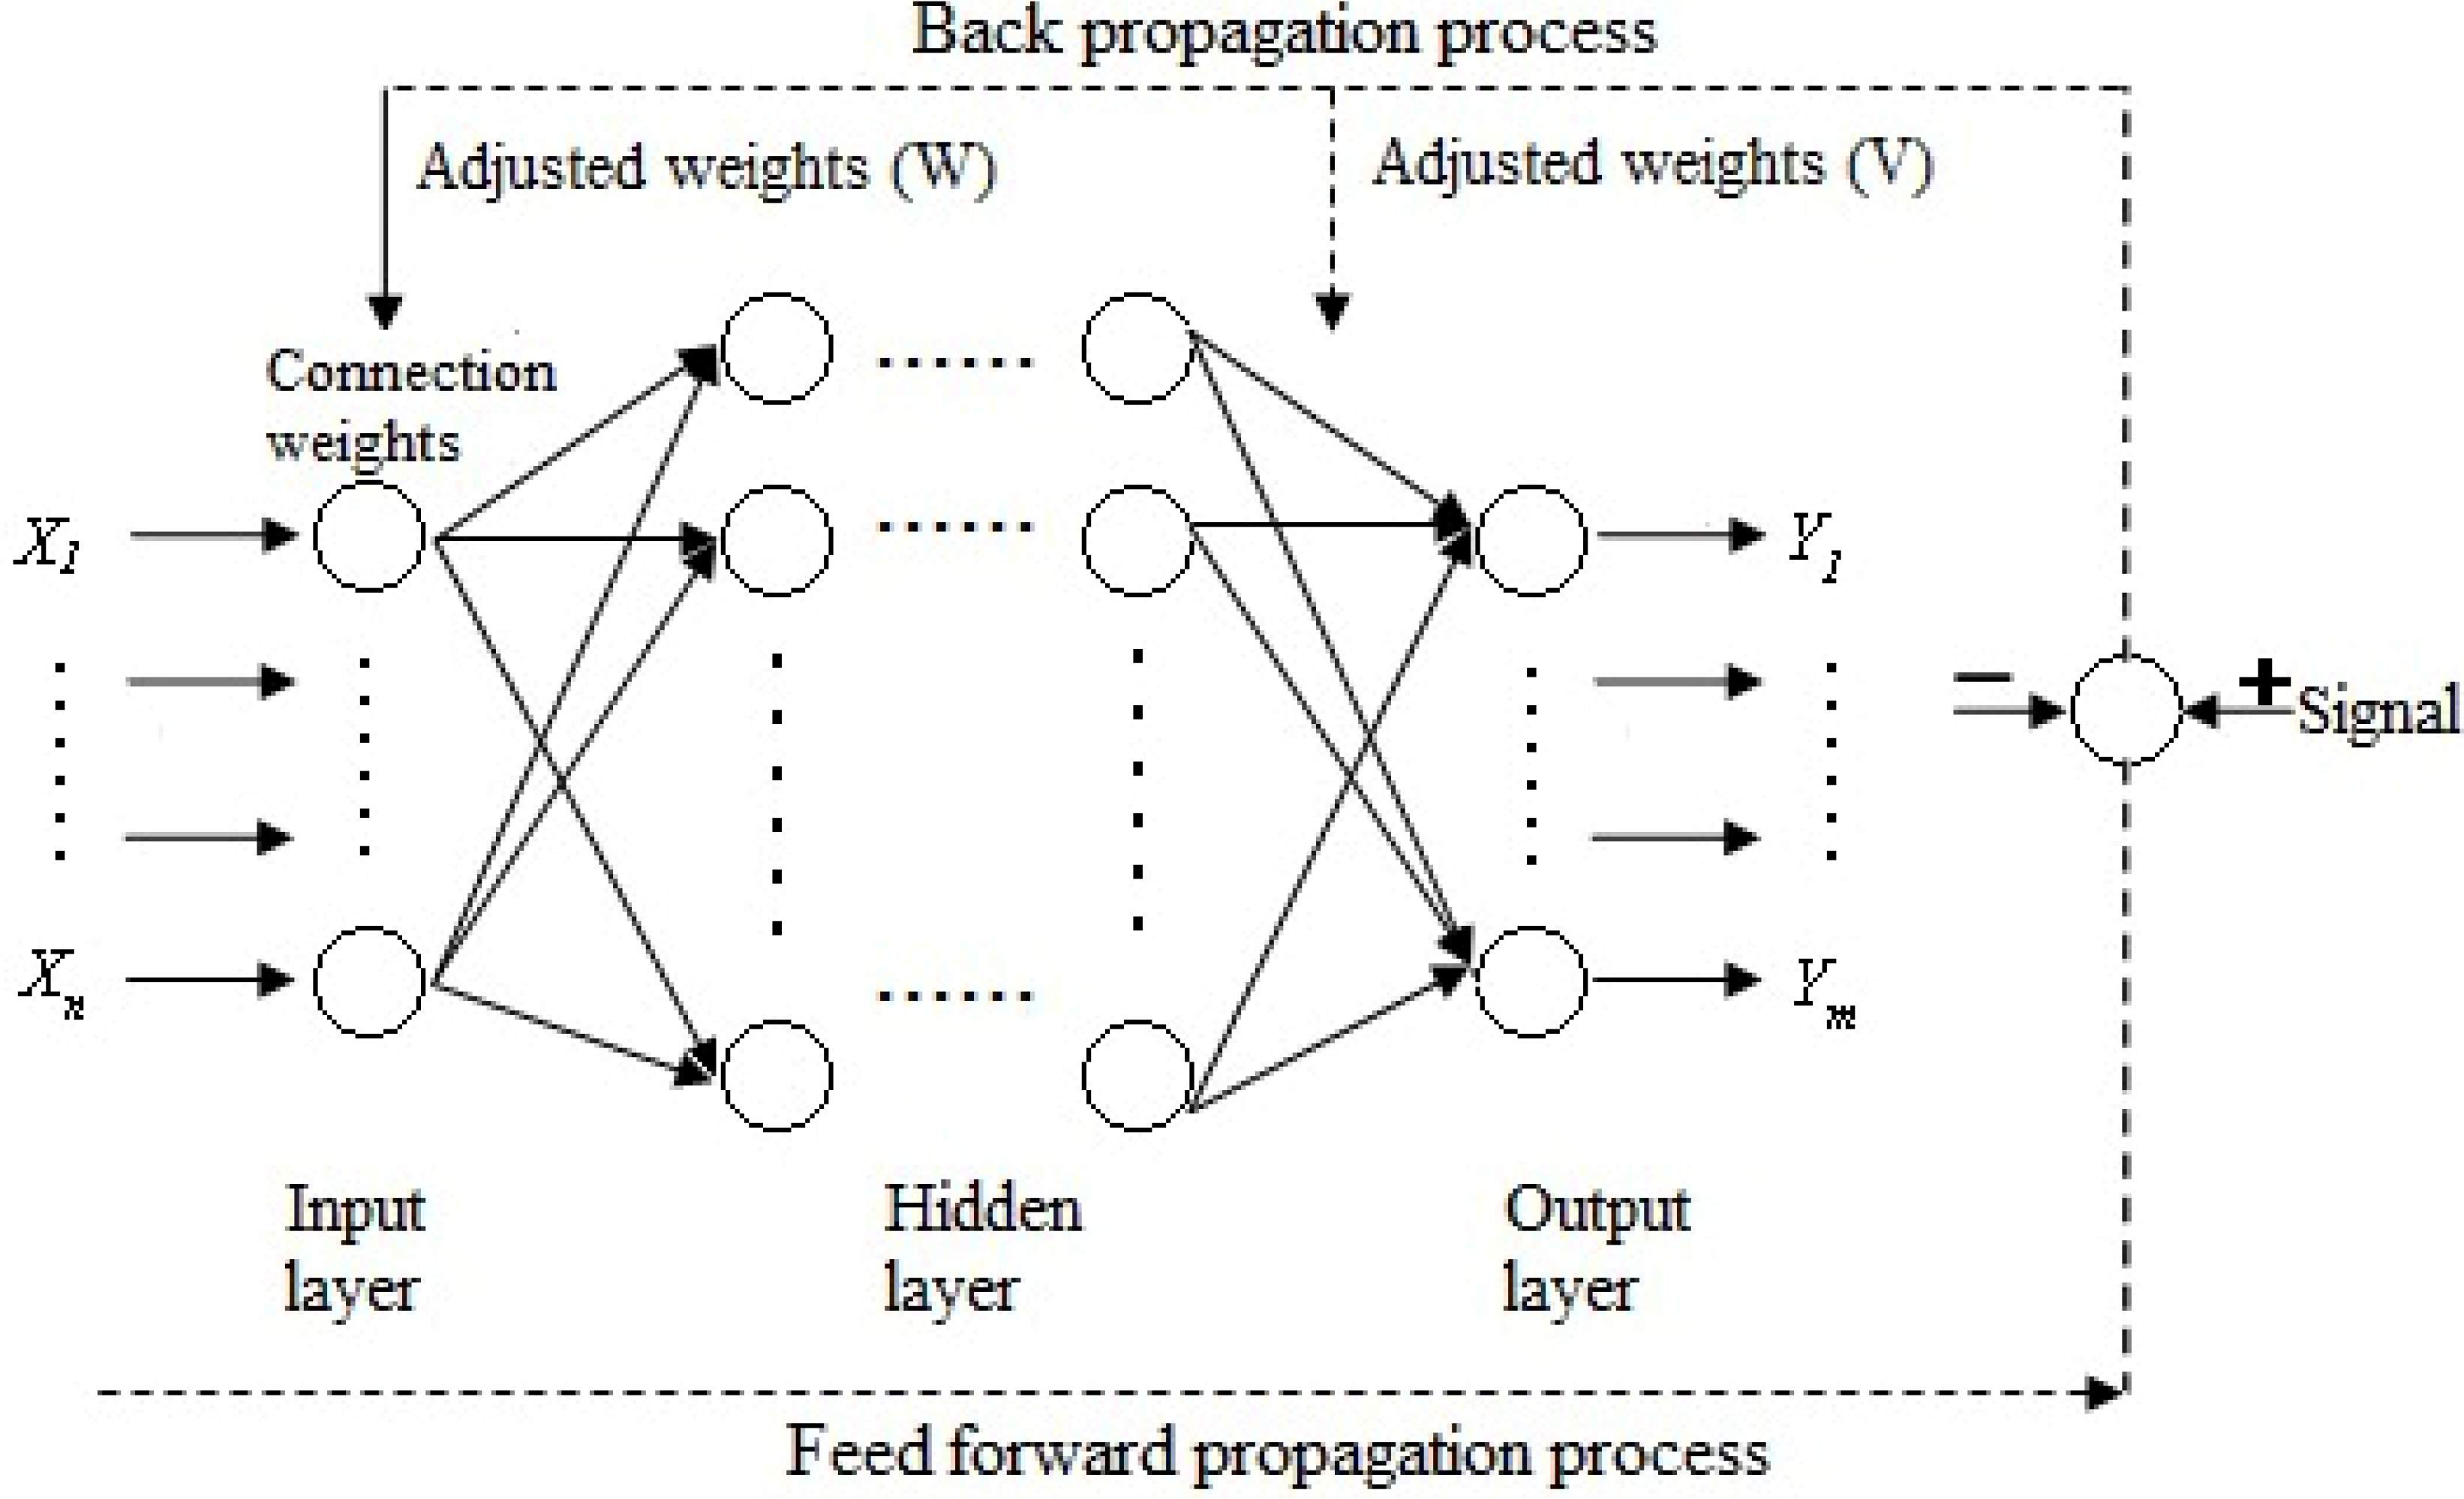
.2.3. Artificial Neural Networks


| Neuron number | R2 | RMSE | MAPE |
|---|---|---|---|
| 8 | 0.9647 | 0.0229 | 1.1064 |
| 9 | 0.9505 | 0.0266 | 1.4203 |
| 10 | 0.9783 | 0.0214 | 1.0858 |
| 11 | 0.9634 | 0.0258 | 1.4533 |
| 12 | 0.9753 | 0.0283 | 1.1695 |
| 13 | 0.9681 | 0.0238 | 0.9469 |
| 14 | 0.9473 | 0.0271 | 1.5162 |
| 15 | 0.9629 | 0.0249 | 0.9794 |
| 16 | 0.9548 | 0.0242 | 1.3341 |
| 17 | 0.9702 | 0.0221 | 1.0903 |
| Level 1 | Weight a | Level 2 | Weight a | Level 3,reference value | Weight b | Comprehensive weight | Index attribute |
|---|---|---|---|---|---|---|---|
| Input | 0.2 | Human Resources | 0.4 | Percentage of health technicians (%), ≥75% | 0.46 | 0.0365 | + |
| Doctors-nurses ratio, 1:2 | 0.54 | 0.0435 | 0 | ||||
| Equipment and facilities | 0.6 | Beds-nurses ratio, 1:0.4 | 0.39 | 0.0471 | 0 | ||
| Percentage of fixed assets in total assets (%) | 0.36 | 0.0437 | + | ||||
| Average number of open beds | 0.24 | 0.0293 | + | ||||
| Process | 0.15 | Nursing Management | 0.3 | The percentage of appropriate written nursing documents (%) | 0.54 | 0.0242 | + |
| Percentage of passing student in nurses’ training (%) | 0.46 | 0.0208 | + | ||||
| Physician management | 0.5 | Percentage of passing student in doctors’ training (%) | 0.25 | 0.0189 | + | ||
| Percentage of class A medical records in all medical records (%), ≥95% | 0.26 | 0.0193 | + | ||||
| The percentage of appropriate prescriptions (%) | 0.22 | 0.0162 | + | ||||
| Percentage of antibacterial prescription (%), 30–45% | 0.27 | 0.0205 | 0 | ||||
| Medical technology Management | 0.2 | Rate of CT inspection (%), ≥70% | 0.13 | 0.0039 | + | ||
| Rate of MRI inspection (%), ≥70% | 0.17 | 0.005 | + | ||||
| Rate of X-ray inspection (%), ≥70% | 0.17 | 0.0051 | + | ||||
| Clinical chemistry laboratory scoring | 0.18 | 0.0054 | + | ||||
| Hematology laboratory scoring | 0.11 | 0.0034 | + | ||||
| Immunology laboratory scoring | 0.12 | 0.0037 | + | ||||
| bacteriological laboratory scoring | 0.12 | 0.0035 | + | ||||
| Output | 0.45 | Quality | 0.4 | Therapeutic response rate (%) | 0.13 | 0.0234 | + |
| Proportion of inpatients diagnosed within 3 days (%) | 0.15 | 0.0273 | + | ||||
| Mortality (%) | 0.19 | 0.0349 | - | ||||
| Proportion of nurses with basic qualification (%), ≥90% | 0.12 | 0.0221 | + | ||||
| Success rate of rescue (%) | 0.13 | 0.0234 | |||||
| Incidence of nosocomial infection (%), ≤10% | 0.14 | 0.0251 | - | ||||
| Percentage of agreement between admission and discharge diagnoses (%), ≥95% | 0.13 | 0.0239 | + | ||||
| Efficiency | 0.25 | Medical institution bed utilization ratio (%), ≥90% | 0.19 | 0.0214 | + | ||
| Medical institution bed turnover ratio, ≥19 times per year | 0.29 | 0.0327 | + | ||||
| Daily number of clinic patients for each doctor | 0.19 | 0.0213 | 0 | ||||
| Daily number of hospitalization bed-days for each doctor | 0.16 | 0.0183 | 0 | ||||
| Average number of days in hospital, ≤15 days | 0.17 | 0.0187 | - | ||||
| Cost control | 0.15 | Average outpatient expenditures (Yuan) | 0.26 | 0.0176 | - | ||
| Average hospitalization expenditures (Yuan) | 0.25 | 0.0171 | - | ||||
| Average expenditures per bed per day (Yuan) | 0.23 | 0.0155 | - | ||||
| Percentage of medicine income of the total income, ≤45% | 0.26 | 0.0173 | - | ||||
| Financial balances | 0.2 | The asset-liability ratio (%) | 0.18 | 0.0165 | - | ||
| Percentage of expenditures in service revenue (Yuan) | 0.35 | 0.0314 | - | ||||
| Income generated by each staff member (Yuan) | 0.2 | 0.0181 | + | ||||
| Medical income per 100 Yuan of fixed assets (Yuan) | 0.27 | 0.024 | + | ||||
| Effect | 0.2 | Satisfaction | 0.35 | Patient satisfaction (%) | 1 | 0.07 | + |
| Medical Safety | 0.65 | Compensation as a percentage of total income (%) | 0.43 | 0.0554 | - | ||
| Medical accident rate per 10,000 inpatients | 0.57 | 0.0746 | - |
3. Results
| Hospital code | The 1st half of 2012 | |
|---|---|---|
| Ci | Rank | |
| H1 | 0.6436 | 2 |
| H2 | 0.6752 | 1 |
| H3 | 0.6369 | 3 |
| H4 | 0.6257 | 4 |
| H5 | 0.4945 | 9 |
| H6 | 0.4261 | 14 |
| H7 | 0.5101 | 7 |
| H8 | 0.4923 | 10 |
| H9 | 0.4913 | 11 |
| H10 | 0.4804 | 12 |
| H11 | 0.4996 | 8 |
| H12 | 0.5551 | 6 |
| H13 | 0.4621 | 13 |
| H14 | 0.5855 | 5 |

| Model | Public Hospital Performance |
|---|---|
| Structure | 41-10-1 |
| RMSE | 0.0392 |
| R2 | 0.9903 |
| Hospital code | Observed value | Prediction value | Absolute error | Relative error (%) |
|---|---|---|---|---|
| H1 | 0.6436 | 0.6377 | 0.0059 | 0.92 |
| H2 | 0.6752 | 0.6242 | 0.0510 | 7.55 |
| H3 | 0.6369 | 0.6225 | 0.0144 | 2.27 |
| H4 | 0.6257 | 0.5879 | 0.0378 | 6.03 |
| H5 | 0.4945 | 0.5405 | −0.0460 | 9.31 |
| H6 | 0.4261 | 0.4526 | −0.0265 | 6.22 |
| H7 | 0.5101 | 0.5374 | −0.0273 | 5.35 |
| H8 | 0.4923 | 0.5429 | −0.0506 | 10.29 |
| H9 | 0.4913 | 0.4674 | 0.0239 | 4.87 |
| H10 | 0.4804 | 0.5051 | −0.0247 | 5.15 |
| H11 | 0.4996 | 0.5619 | −0.0623 | 12.46 |
| H12 | 0.5551 | 0.5217 | 0.0334 | 6.01 |
| H13 | 0.4621 | 0.4817 | −0.0196 | 4.24 |
| H14 | 0.5855 | 0.6410 | −0.0555 | 9.47 |
4. Conclusions
Acknowledgments
Conflict of Interest
References
- Li, L.X.; Benton, W.C. Performance measurement criteria in health care organizations: Review and future research directions. Eur. J. Oper. Res. 1996, 93, 449–468. [Google Scholar] [CrossRef]
- Elizabeth, A.M.; Steven, M.A. Developing a clinical performance measure. Am. J. Prev. Med. 1998, 14, 14–21. [Google Scholar] [CrossRef]
- Maria, G.; Russell, M.; Peter, C.S. Assessing the performance of NHS hospital trusts: The role of “hard” and “soft” information. Health Policy 1999, 48, 119–134. [Google Scholar] [CrossRef]
- Tang, Y.H.; Xue, X.; Chen, J.C.; Jian, D.S.; Pan, L.J.; Qiu, F.; Cao, M.Q.; Wang, P.; Jiang, X.M.; Wang, J.J.; et al. The performance appraisal indicator system of public general hospitals based on balanced scorecard. Chin. Hosp. Manag. 2008, 28, 56–59. [Google Scholar]
- Cui, S.; Yang, J.L.; Li, Z.S.; Li, C.R. The study on performance evaluation of public hospital: The evaluation methods and indicator system. Chin. Health Econ. 2008, 27, 57–61. [Google Scholar]
- Wang, H.; Lin, Q.Y.; Xie, G. Discussion on establishment of key performance evaluation system for public hospital. Mod. Hosp. Manag. 2009, 5, 13–15. [Google Scholar]
- Wang, X.J. Theory and practice of KPI utility for hospital performance evaluation. Chin. J. Hosp. Adm. 2006, 6, 421–422. [Google Scholar]
- Zhao, J.S.; Li, L.; Zhu, Q. Study of using BSC for hospital management in China. Chin. Hosp. Manag. 2007, 27, 79–81. [Google Scholar]
- Ren, R. Theory and practice of hospital performance evaluation. Chin. Hosp. Manag. 2005, 25, 15–17. [Google Scholar]
- Wang, Y.L.; Zheng, J.G.; Wang, X. The summary of the domestic study on assessing knowledge management performance. J. Intell. 2010, 29, 93–97. [Google Scholar]
- Liang, J.; Jiang, W.; Li, X.H. An improvement on fuzzy comprehensive evaluation method and its use in urban traffic planning. J. Traffic Transp. Eng. 2002, 2, 68–72. [Google Scholar]
- Cao, M.X. Research on Grey Incidence Analysis Model and its Application. Master Thesis, Nanjing University of Aeronautics and Astronautics, Nanjing, China, January 2007. [Google Scholar]
- Wang, J.L.; Liu, S.F.; Qiu, G.H. Formation and application of a new grey incidence degree based on information aggregation. Syst. Eng. Electron. 2010, 32, 77–81. [Google Scholar]
- Wang, Z.X.; Dang, Y.G.; Cao, M.X. Weighted degree of grey incidence based on optimized entropy. Syst. Eng. Electron. 2010, 32, 774–783. [Google Scholar]
- Kuo, Y.M.; Liu, C.W.; Lin, K.H. Evaluation of the ability of an artificial neural network model to assess the variation of groundwater quality in an area of blackfoot disease in Taiwan. Water Res. 2004, 38, 148–158. [Google Scholar] [CrossRef]
- Patterson, D.W. Artificial Neural Networks; Prentice Hall: New York, NY, USA, 1996; pp. 10–25. [Google Scholar]
- Dayhoff, J.E.; Deleo, J.M. Artificial neural network: Opening the black box. Cancer 2001, 91, 1615–1635. [Google Scholar] [CrossRef]
- Green, M.; Bjork, J.; Forberg, J.; Ekelund, U.; Edenbrandt, L.; Ohlsson, M. Comparison between neural networks and multiple logistic regression to predict acute coronary syndrome in the emergency room. Artif. Intell. Med. 2006, 38, 305–318. [Google Scholar] [CrossRef]
- Abbod, M.F.; Catto, J.W.; Linkens, D.A.; Hamdy, F.C. Application of artificial intelligence to the management of urological cancer. J. Urol. 2007, 178, 1150–1156. [Google Scholar] [CrossRef]
- Cross, S.S.; Harrison, R.F.; Kennedy, R.L. Introduction to neural networks. Lancet 1995, 346, 1075–1079. [Google Scholar] [CrossRef]
- Hagan, M.T.; Demuth, H.B.; Beale, M. Neural Network Design, 1st ed.; PWS Publishing Co: Boston, MA, USA, 1996; pp. 134–157. [Google Scholar]
- Raoufy, M.R.; Vahdani, P.; Alavian, S.M.; Fekri, S.; Eftekhari, P.; Gharibzadeh, S. A novel method for diagnosing cirrhosis in patients with chronic hepatitis B: Artificial neural network approach. J. Med. Syst. 2011, 35, 121–126. [Google Scholar] [CrossRef]
- Dariani, S.; Keshavarz, M.; Parviz, M.; Raoufy, M.R.; Gharibzadeh, S. Modeling force-velocity relation in skeletal muscle isotonic contraction using an artificial neural network. Biosystems 2007, 90, 529–534. [Google Scholar] [CrossRef]
- Susan, M.G.; Peter, T.W.; Keong, L.; Timothy, W.B. The effect of location, strategy, and operations technology on hospital performance. J. Oper. Manag. 2002, 20, 63–75. [Google Scholar] [CrossRef]
- Anke, N.; Josiane, H.; Jean-Roger, L.G.; Eric, L. Measuring performance in health care: Case-mix adjustment by boosted decision trees. Artif. Intell. Med. 2004, 32, 97–113. [Google Scholar] [CrossRef]
- Berg, M.; Meijerink, Y.; Gras, M. Feasibility first: Developing public performance indicators on patient safety and clinical effectiveness for Dutch hospitals. Health Policy 2005, 75, 59–73. [Google Scholar] [CrossRef]
- Kovacst, J.M.; Malczewski, J.; Flores-Verdugo, F. Examining local ecological knowledge of hurricane impacts in a mangrove forest using an analytical hierarchy process (AHP) approach. J. Coast. Res. 2004, 20, 792–800. [Google Scholar]
- Zhang, R.Q.; Zhang, X.D.; Yang, J.Y.; Yuan, H. Wetland ecosystem stability evaluation by using Analytical Hierarchy Process (AHP) approach in Yinchuan Plain, China. Math. Comput. Model. 2013, 57, 366–374. [Google Scholar] [CrossRef]
- Mirvakili, S.M.; Faghihi, F.; Khalafi, H. Developing a computational tool for predicting physical parameters of a typical VVER-1000 core based on artificial neural network. Ann. Nuclear Energy 2012, 50, 82–93. [Google Scholar] [CrossRef]
- Zhe, W.; Fei, W.; Shi, S. Solar irradiance short-term prediction model based on BP neural network. Energy Procedia 2011, 12, 488–494. [Google Scholar] [CrossRef]
- Li, Z.; Luo, J.H.; Yang, S.Y. Forecasting box office revenue of movies with BP neural network. Expert Syst. Appl. 2009, 36, 6580–6587. [Google Scholar] [CrossRef]
- Wang, H.W. Partial Least-Squares Regression-Method and Applications; National Defence Industry Press: Beijing, China, 1999. [Google Scholar]
- Emilio, M.; Marco, B.; Elisa, R.; Marcello, L. Hydroxyl and acid number prediction in polyester resins by near infrared spectroscopy and artificial neural networks. Anal. Chim. Acta 2004, 511, 313–322. [Google Scholar] [CrossRef]
- Shi, F.; Wang, H.; Yu, L.; Hu, F. MATLAB Intelligence Algorithm: The 30 Cases, 1st ed.; Beijing University of Aeronautics and Astronautics Press: Beijing, China, 2011; pp. 237–245. [Google Scholar]
- Richard, L.; Mohammed, A.M.; David, S.; Richard, T. Use and misuse of process and outcome data in managing performance of acute medical care: Avoiding institutional stigma. Lancet 2004, 363, 1147–1154. [Google Scholar] [CrossRef]
© 2013 by the authors; licensee MDPI, Basel, Switzerland. This article is an open access article distributed under the terms and conditions of the Creative Commons Attribution license (http://creativecommons.org/licenses/by/3.0/).
Share and Cite
Li, C.; Yu, C. Performance Evaluation of Public Non-Profit Hospitals Using a BP Artificial Neural Network: The Case of Hubei Province in China. Int. J. Environ. Res. Public Health 2013, 10, 3619-3633. https://doi.org/10.3390/ijerph10083619
Li C, Yu C. Performance Evaluation of Public Non-Profit Hospitals Using a BP Artificial Neural Network: The Case of Hubei Province in China. International Journal of Environmental Research and Public Health. 2013; 10(8):3619-3633. https://doi.org/10.3390/ijerph10083619
Chicago/Turabian StyleLi, Chunhui, and Chuanhua Yu. 2013. "Performance Evaluation of Public Non-Profit Hospitals Using a BP Artificial Neural Network: The Case of Hubei Province in China" International Journal of Environmental Research and Public Health 10, no. 8: 3619-3633. https://doi.org/10.3390/ijerph10083619