3.1. Results
All factors were recorded for the 173 farms in the survey, without any missing data. The consent to participate in the door-to-door interview was 100%, and no specific problems occur in the process of data collection (a pilot survey was first carried out in 2010 to adjust the questionnaire used to describe agricultural practices).
Statistical results by factors (proportion of yes answers, standard deviation) are given in
Table 2. Scores of vulnerability are presented in
Table 3. Category 3 (bio-security measures and farm management) is the one with the worst average score.
Table 2.
Results of the survey by factor: proportion of yes answers, standard deviation, results by type of production (meat or layer) or type of bird (chicken or duck).
Table 2.
Results of the survey by factor: proportion of yes answers, standard deviation, results by type of production (meat or layer) or type of bird (chicken or duck).
| n° | Vulnerability factors | All farms | Sdt. Dev. | Meat farms | Layer farms | Chicken farms | Duck farms |
|---|
| 1 | Distance to main road less than 50 m | 0.18 | 0.38 | 0.16 | 0.22 | 0.18 | 0.18 |
| 2 | No fence at all around the farm | 0.03 | 0.18 | 0.04 | 0.02 | 0.05 | 0.00 |
| 3 | Easy entry to the farm | 0.76 | 0.43 | 0.74 | 0.82 | 0.73 | 0.86 |
| 4 | A pond is on the farm or next to the farm | 0.75 | 0.43 | 0.68 | 0.92 | 0.69 | 0.93 |
| 5 | Open air house on fish pond | 0.11 | 0.31 | 0.12 | 0.06 | 0.14 | 0.02 |
| 6 | Dead fowl used as animal food | 0.53 | 0.50 | 0.50 | 0.57 | 0.50 | 0.59 |
| 7 | Sale of dead birds | 0.01 | 0.11 | 0.01 | 0.00 | 0.02 | 0.00 |
| 8 | Carcass of dead birds throw away | 0.08 | 0.27 | 0.08 | 0.08 | 0.09 | 0.07 |
| 9 | Domestic cats and dogs living on the farm | 0.84 | 0.37 | 0.82 | 0.88 | 0.89 | 0.68 |
| 10 | Stray dogs/cats on farm | 0.27 | 0.45 | 0.32 | 0.14 | 0.26 | 0.32 |
| 11 | Backyard poultry on the farm | 0.18 | 0.38 | 0.15 | 0.26 | 0.16 | 0.25 |
| 12 | Presence of other birds | 1.00 | 0.00 | 1.00 | 1.00 | 1.00 | 1.00 |
| 13 | Fighting cocks on the farm | 0.05 | 0.22 | 0.06 | 0.02 | 0.05 | 0.07 |
| 14 | Presence of exotic birds in cage | 0.04 | 0.20 | 0.05 | 0.02 | 0.04 | 0.05 |
| 15 | Presence of other farm animals (pigs, cow, horse, rabbit, boar) | 0.26 | 0.44 | 0.26 | 0.24 | 0.29 | 0.18 |
| 16 | Frog breeding on the farm | 0.05 | 0.210 | 0.06 | 0.02 | 0.06 | 0.00 |
| 17 | No rodent control | 0.14 | 0.35 | 0.10 | 0.26 | 0.12 | 0.20 |
| 18 | No use of insecticides | 0.94 | 0.23 | 0.95 | 0.89 | 0.94 | 0.95 |
| 19 | Outsider are permitted to enter the farm | 0.37 | 0.48 | 0.31 | 0.51 | 0.34 | 0.45 |
| 20 | Frequent entry/exit from farm more than two times per day | 0.67 | 0.47 | 0.60 | 0.84 | 0.66 | 0.70 |
| 21 | Workers do not have working clothing | 0.93 | 0.25 | 0.94 | 0.90 | 0.92 | 0.95 |
| 22 | Same employees work on several units on the same farm | 0.38 | 0.49 | 0.48 | 0.14 | 0.38 | 0.39 |
| 23 | No farm disinfection | 0.41 | 0.49 | 0.37 | 0.51 | 0.38 | 0.50 |
| 24 | Disinfectant barrier at farm entrance does not exist | 0.94 | 0.24 | 0.93 | 0.96 | 0.91 | 1.00 |
| 25 | Footbath next to poultry house does not exist | 0.97 | 0.17 | 0.98 | 0.96 | 0.96 | 1.00 |
| 26 | Vehicles are not disinfected before entering | 0.55 | 0.50 | 0.50 | 0.67 | 0.51 | 0.66 |
| 27 | Dealers/Drivers free movement without changing clothes | 1.00 | 0.00 | 1.00 | 1.00 | 1.00 | 1.00 |
| 28 | Poultry houses are not disinfected at end of production | 0.02 | 0.13 | 0.01 | 0.04 | 0.01 | 0.05 |
| 29 | Different age groups in same building (no all in/all out) | 0.02 | 0.13 | 0.01 | 0.04 | 0.01 | 0.05 |
| 30 | Pond water used for animal drinking | 0.04 | 0.20 | 0.01 | 0.12 | 0.00 | 0.16 |
| 31 | Manure not properly stored | 0.03 | 0.18 | 0.02 | 0.08 | 0.02 | 0.07 |
| 32 | Manure used as animal feed | 0.57 | 0.50 | 0.56 | 0.61 | 0.70 | 0.23 |
| 33 | Use of wet and fresh litter | 0.29 | 0.46 | 0.15 | 0.67 | 0.31 | 0.25 |
| 34 | Not daily cleaning of rearing equipment | 0.27 | 0.44 | 0.27 | 0.26 | 0.34 | 0.05 |
| 35 | Cleaning of equipment only at the end of production cycle | 0.27 | 0.44 | 0.27 | 0.26 | 0.34 | 0.05 |
| 36 | Food delivered by different suppliers | 0.07 | 0.25 | 0.07 | 0.06 | 0.07 | 0.07 |
| 37 | Easy access to food storage for rodents and wild birds | 0.83 | 0.38 | 0.86 | 0.73 | 0.78 | 0.95 |
| 38 | Poultry sold to trader | 0.39 | 0.49 | 0.35 | 0.49 | 0.39 | 0.39 |
| 39 | Restocking before 14 days gap | 0.22 | 0.42 | 0.25 | 0.16 | 0.27 | 0.09 |
| 40 | Slaughtering on the farm without proper hygiene facilities | 0.04 | 0.20 | 0.06 | 0.00 | 0.05 | 0.00 |
| 41 | Egg trays not disinfected at the farm | 0.10 | 0.31 | 0.00 | 0.37 | 0.05 | 0.27 |
| 42 | Eggs are sold on the farm to villagers | 0.21 | 0.41 | 0.00 | 0.73 | 0.19 | 0.27 |
| 43 | Eggs sold to different dealers | 0.15 | 0.36 | 0.00 | 0.51 | 0.14 | 0.18 |
| 44 | Farmers are not informed about AI | 0.01 | 0.13 | 0.01 | 0.02 | 0.01 | 0.05 |
| 45 | Farmers are not concerned about AI as dangerous disease | 0.63 | 0.48 | 0.72 | 0.41 | 0.64 | 0.59 |
Table 3.
Summary statistics for five categories of vulnerability scores of commercial poultry farms in Nakhon Pathom, Thailand, 2011.
Table 3.
Summary statistics for five categories of vulnerability scores of commercial poultry farms in Nakhon Pathom, Thailand, 2011.
| Vulnerability Score Category | Min. | Max. | Mean | Median | Sdt. Dev. |
|---|
| General characteristics of the farm | 0.11 | 0.66 | 0.39 | 0.37 | 0.11 |
| Agricultural and commercial practices | 0 | 0.54 | 0.20 | 0.19 | 0.12 |
| Biosecurity measures, farm management | 0.25 | 0.79 | 0.52 | 0.52 | 0.10 |
| Layers farms practices | 0 | 1 | 0.16 | 0 | 0.29 |
| AI farmer knowledge | 0 | 0.5 | 0.32 | 0.5 | 0.24 |
| Global score | 0.17 | 0.58 | 0.38 | 0.37 | 0.07 |
Systematic correlation analysis did not reveal strong relationships between vulnerability factors. A multivariate principal component analysis with all the 45 factors of the survey (
Table 1) shows a first component explaining only 10% of the total variance.
Analysis of vulnerability by type of production (meat or layer) revealed that excessive vulnerability correlates with farms producing eggs (
Table 4). The type of production is very significant for vulnerability since factors associated with eggs production may strongly contribute to increasing vulnerability. Furthermore, the same results are found whenever we take into account the vulnerability factors directly related to egg production.
Table 4.
Analysis of vulnerability scores by type of production (meat or layer).
Table 4.
Analysis of vulnerability scores by type of production (meat or layer).
| Vulnerability Score Category | Meat * | Layer | p-value (T) | OR | Chi2 |
|---|
| General characteristics of the farm | 0.38 | 0.40 | 0.17 | 1.32 [0.52, 3.31] | 0.34 |
| Agricultural and commercial practices | 0.18 | 0.27 | 0.00005 | 3.77 [1.63, 8.69] | 10 |
| Biosecurity measures, farm management | 0.51 | 0.55 | 0.001 | 5.64 [2.27, 14.01] | 16 |
| AI farmer knowledge | 0.37 | 0.21 | 0.00006 | 0.27 [0.14, 0.54] | 14 |
| Global score | 0.36 | 0.43 | <0.000001 | 13.24 [4.12, 42.51] | 27 |
| Score w/t cat. 4 | 0.39 | 0.42 | 0.0006 | 5.53 [2.29, 13.32] | 16 |
Analysis of vulnerability by poultry type (duck or chicken) shows no significant differences (
Table 5). With the overall score classified into two classes (not vulnerable, s < 0.5 and vulnerable, s ≥ 0.5), the odd ratio adjusted by poultry production doesn’t show a significant difference between classes.
Table 5.
Analysis of vulnerability scores by poultry type (chicken or duck), with OR adjusted by production type (meat or layer), and Mantel-Haenszel Chi2.
Table 5.
Analysis of vulnerability scores by poultry type (chicken or duck), with OR adjusted by production type (meat or layer), and Mantel-Haenszel Chi2.
| Vulnerability Score Category | Chicken * | Duck | p-value (T) | OR (Ajusted) | Chi2 (MH) |
|---|
| General characteristics of the farm | 0.37 | 0.43 | 0.0028 | 1.25 [0.46, 3.43] | 0.15 |
| Agricultural and commercial practices | 0.21 | 0.18 | 0.056 | 1.35 [0.55, 3.32] | 0.31 |
| Biosecurity measures, farm management | 0.51 | 0.53 | 0.19 | 0.81 [0.27, 2.44] | 0.22 |
| Layers farms practices | 0.13 | 0.23 | 0.006 | 0.93 [0.28, 3.10] | 0.01 |
| AI farmer knowledge | 0.32 | 0.32 | 0.42 | 1.09 [0.51, 2.32] | 0.05 |
| Global score | 0.38 | 0.40 | 0.03 | 1.41 [0.65, 3.06] | 0.81 |
| Score w/t cat. 4 (Layers farms practices) | 0.39 | 0.41 | 0.08 | 2.28 [0.89, 5.86] | 3.06 |
Finally, the study of scores using all possible combinations between production type (meat or layer) and poultry type (duck or chicken) shows that farms producing duck eggs are the most vulnerable in all categories, with a difference between groups always significant at a 5% type I error (
Table 6).
Table 6.
Analysis by poultry type and production type.
Table 6.
Analysis by poultry type and production type.
| Vulnerability Score | All | Meat | Layer | p-value (F *) |
|---|
| Chicken | Duck | Chicken | Duck |
|---|
| General characteristics of the farm | 0.39 | 0.37 | 0.42 | 0.38 | 0.44 | 0.046 |
| Agricultural and commercial practices | 0.20 | 0.19 | 0.15 | 0.28 | 0.24 | 0.00003 |
| Biosecurity measures, farm management | 0.52 | 0.51 | 0.50 | 0.53 | 0.58 | 0.02 |
| Layers farms practices | 0.16 | 0.00 | 0.00 | 0.50 | 0.62 | <0.00001 |
| AI farmer knowledge | 0.32 | 0.36 | 0.37 | 0.21 | 0.22 | 0.002 |
| Global score | 0.38 | 0.36 | 0.36 | 0.42 | 0.46 | <0.00001 |
| Score w/t cat.4 (Layers farms practices) | 0.40 | 0.39 | 0.39 | 0.41 | 0.44 | 0.02 |
Spatial analysis was performed to help in identifying further contributing factors in environment or geographic context or organization of space.
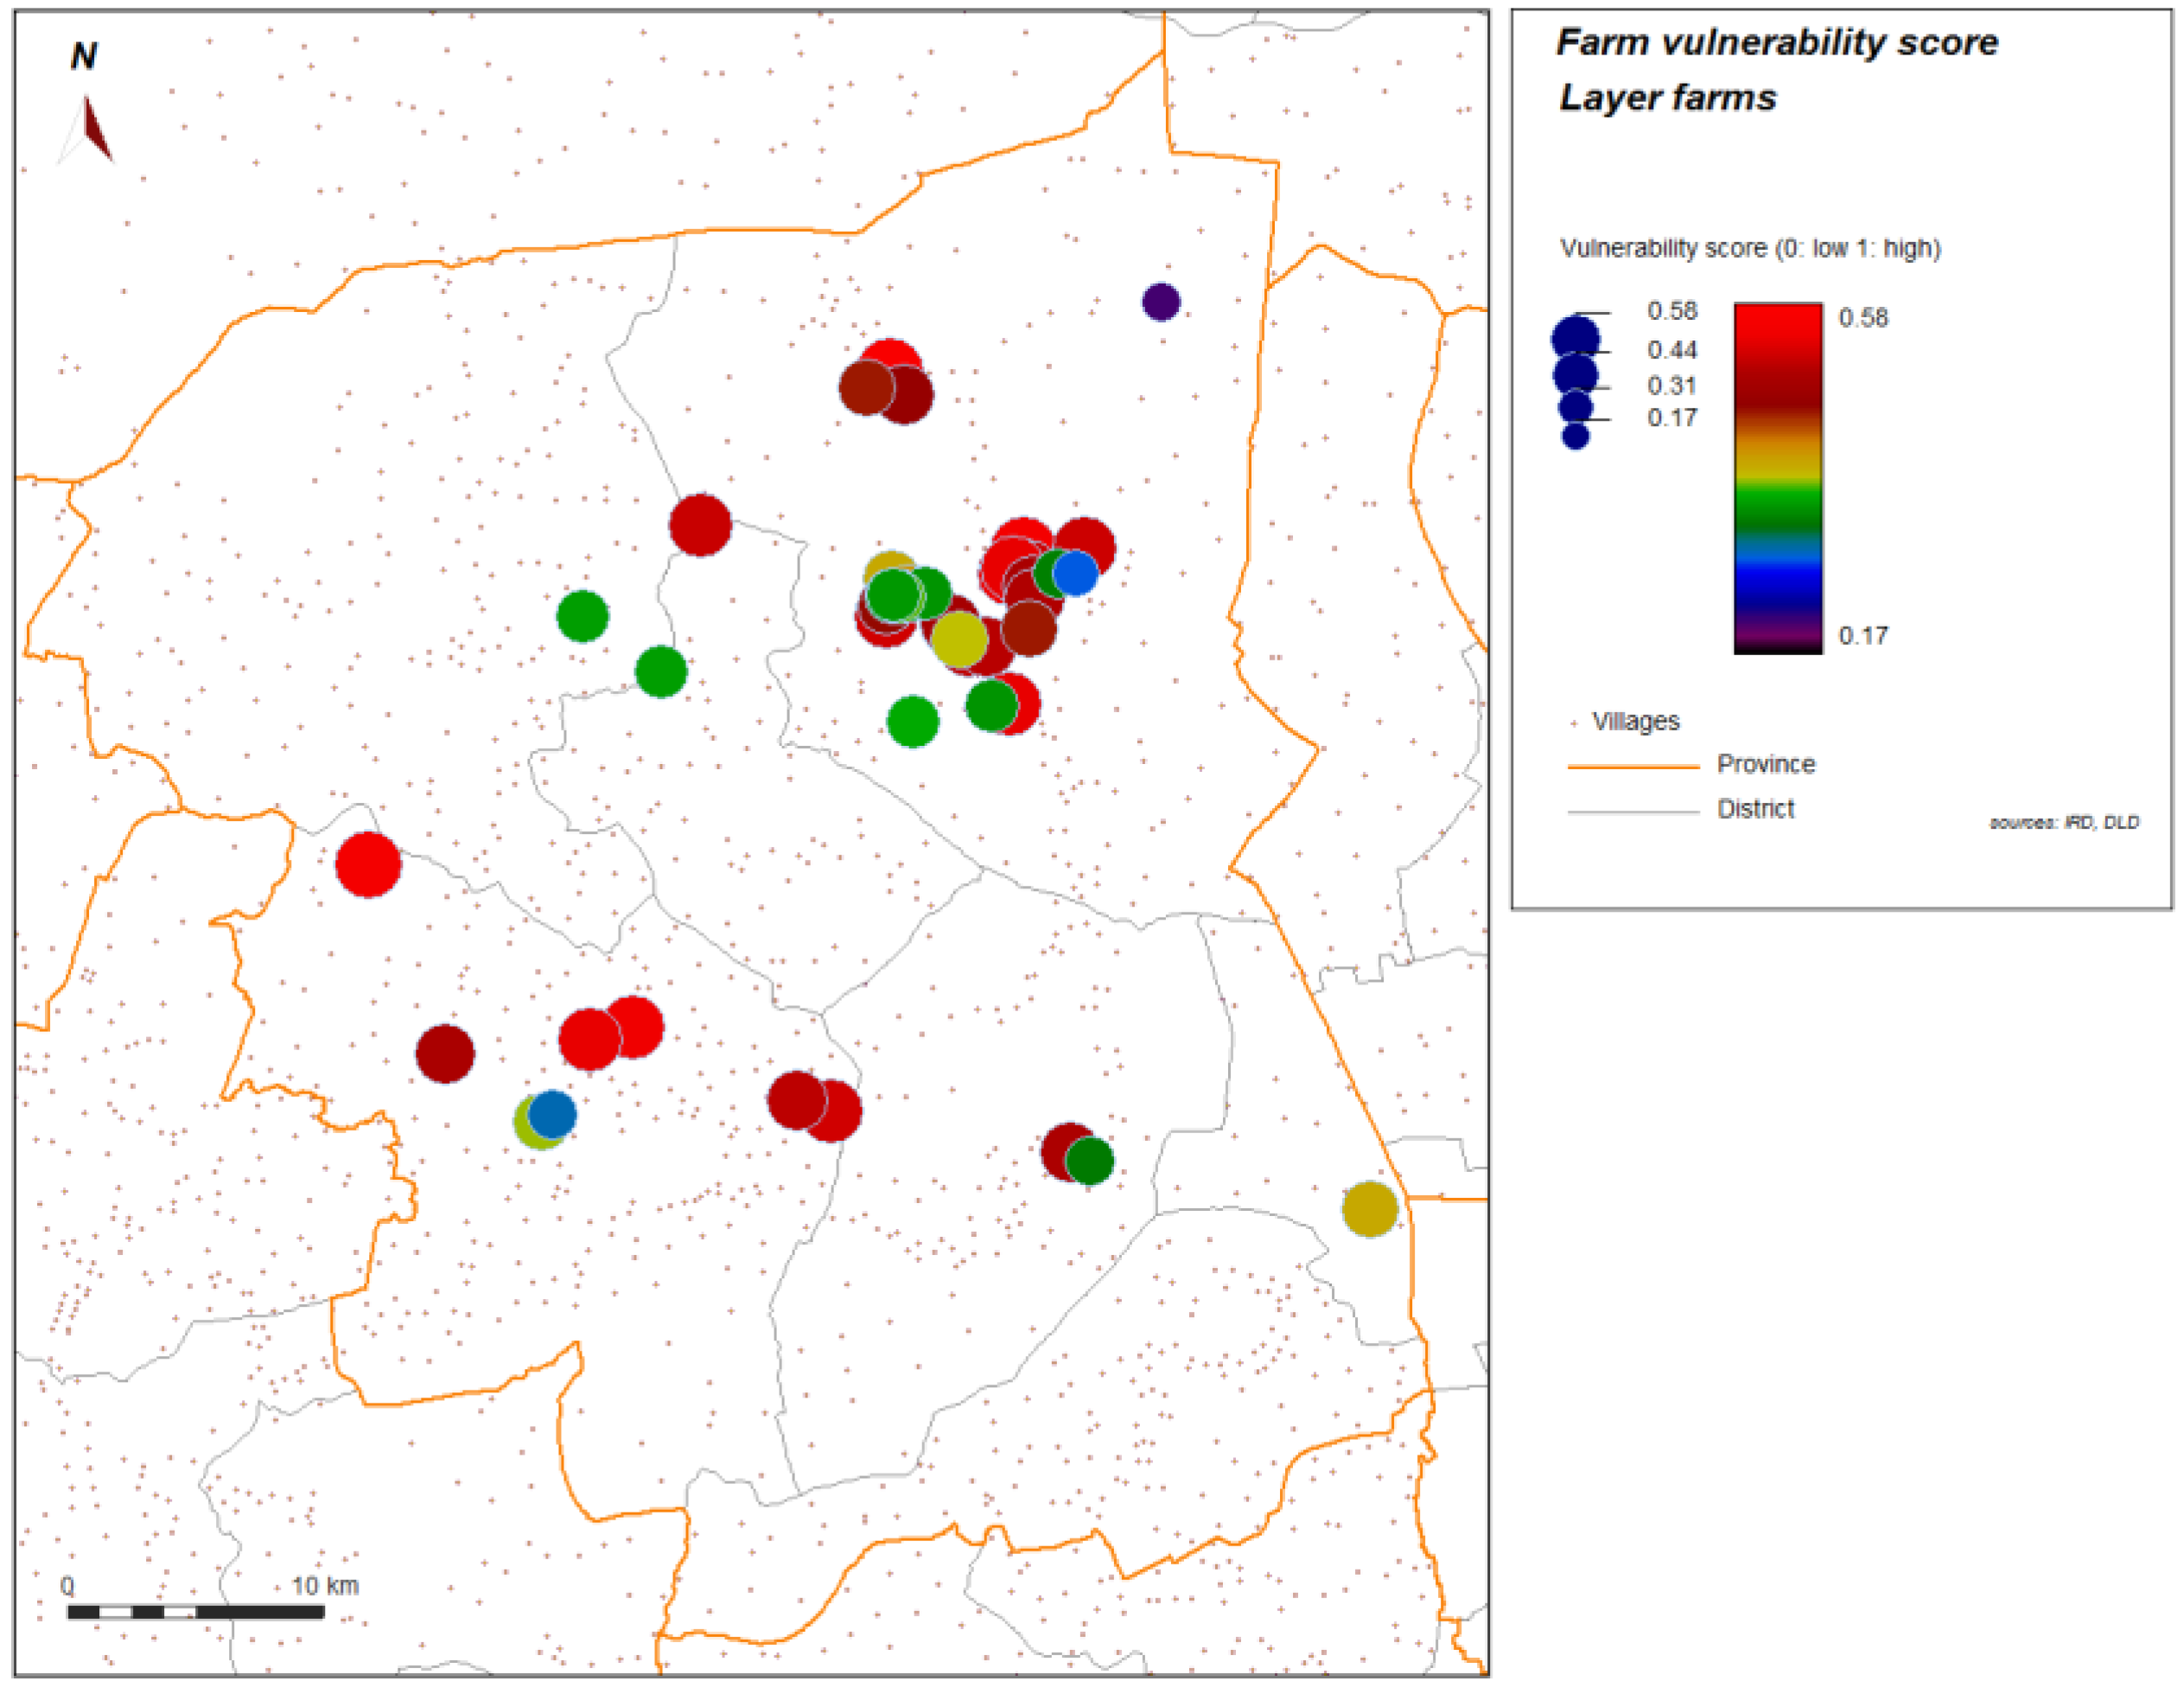
Figure 4 and
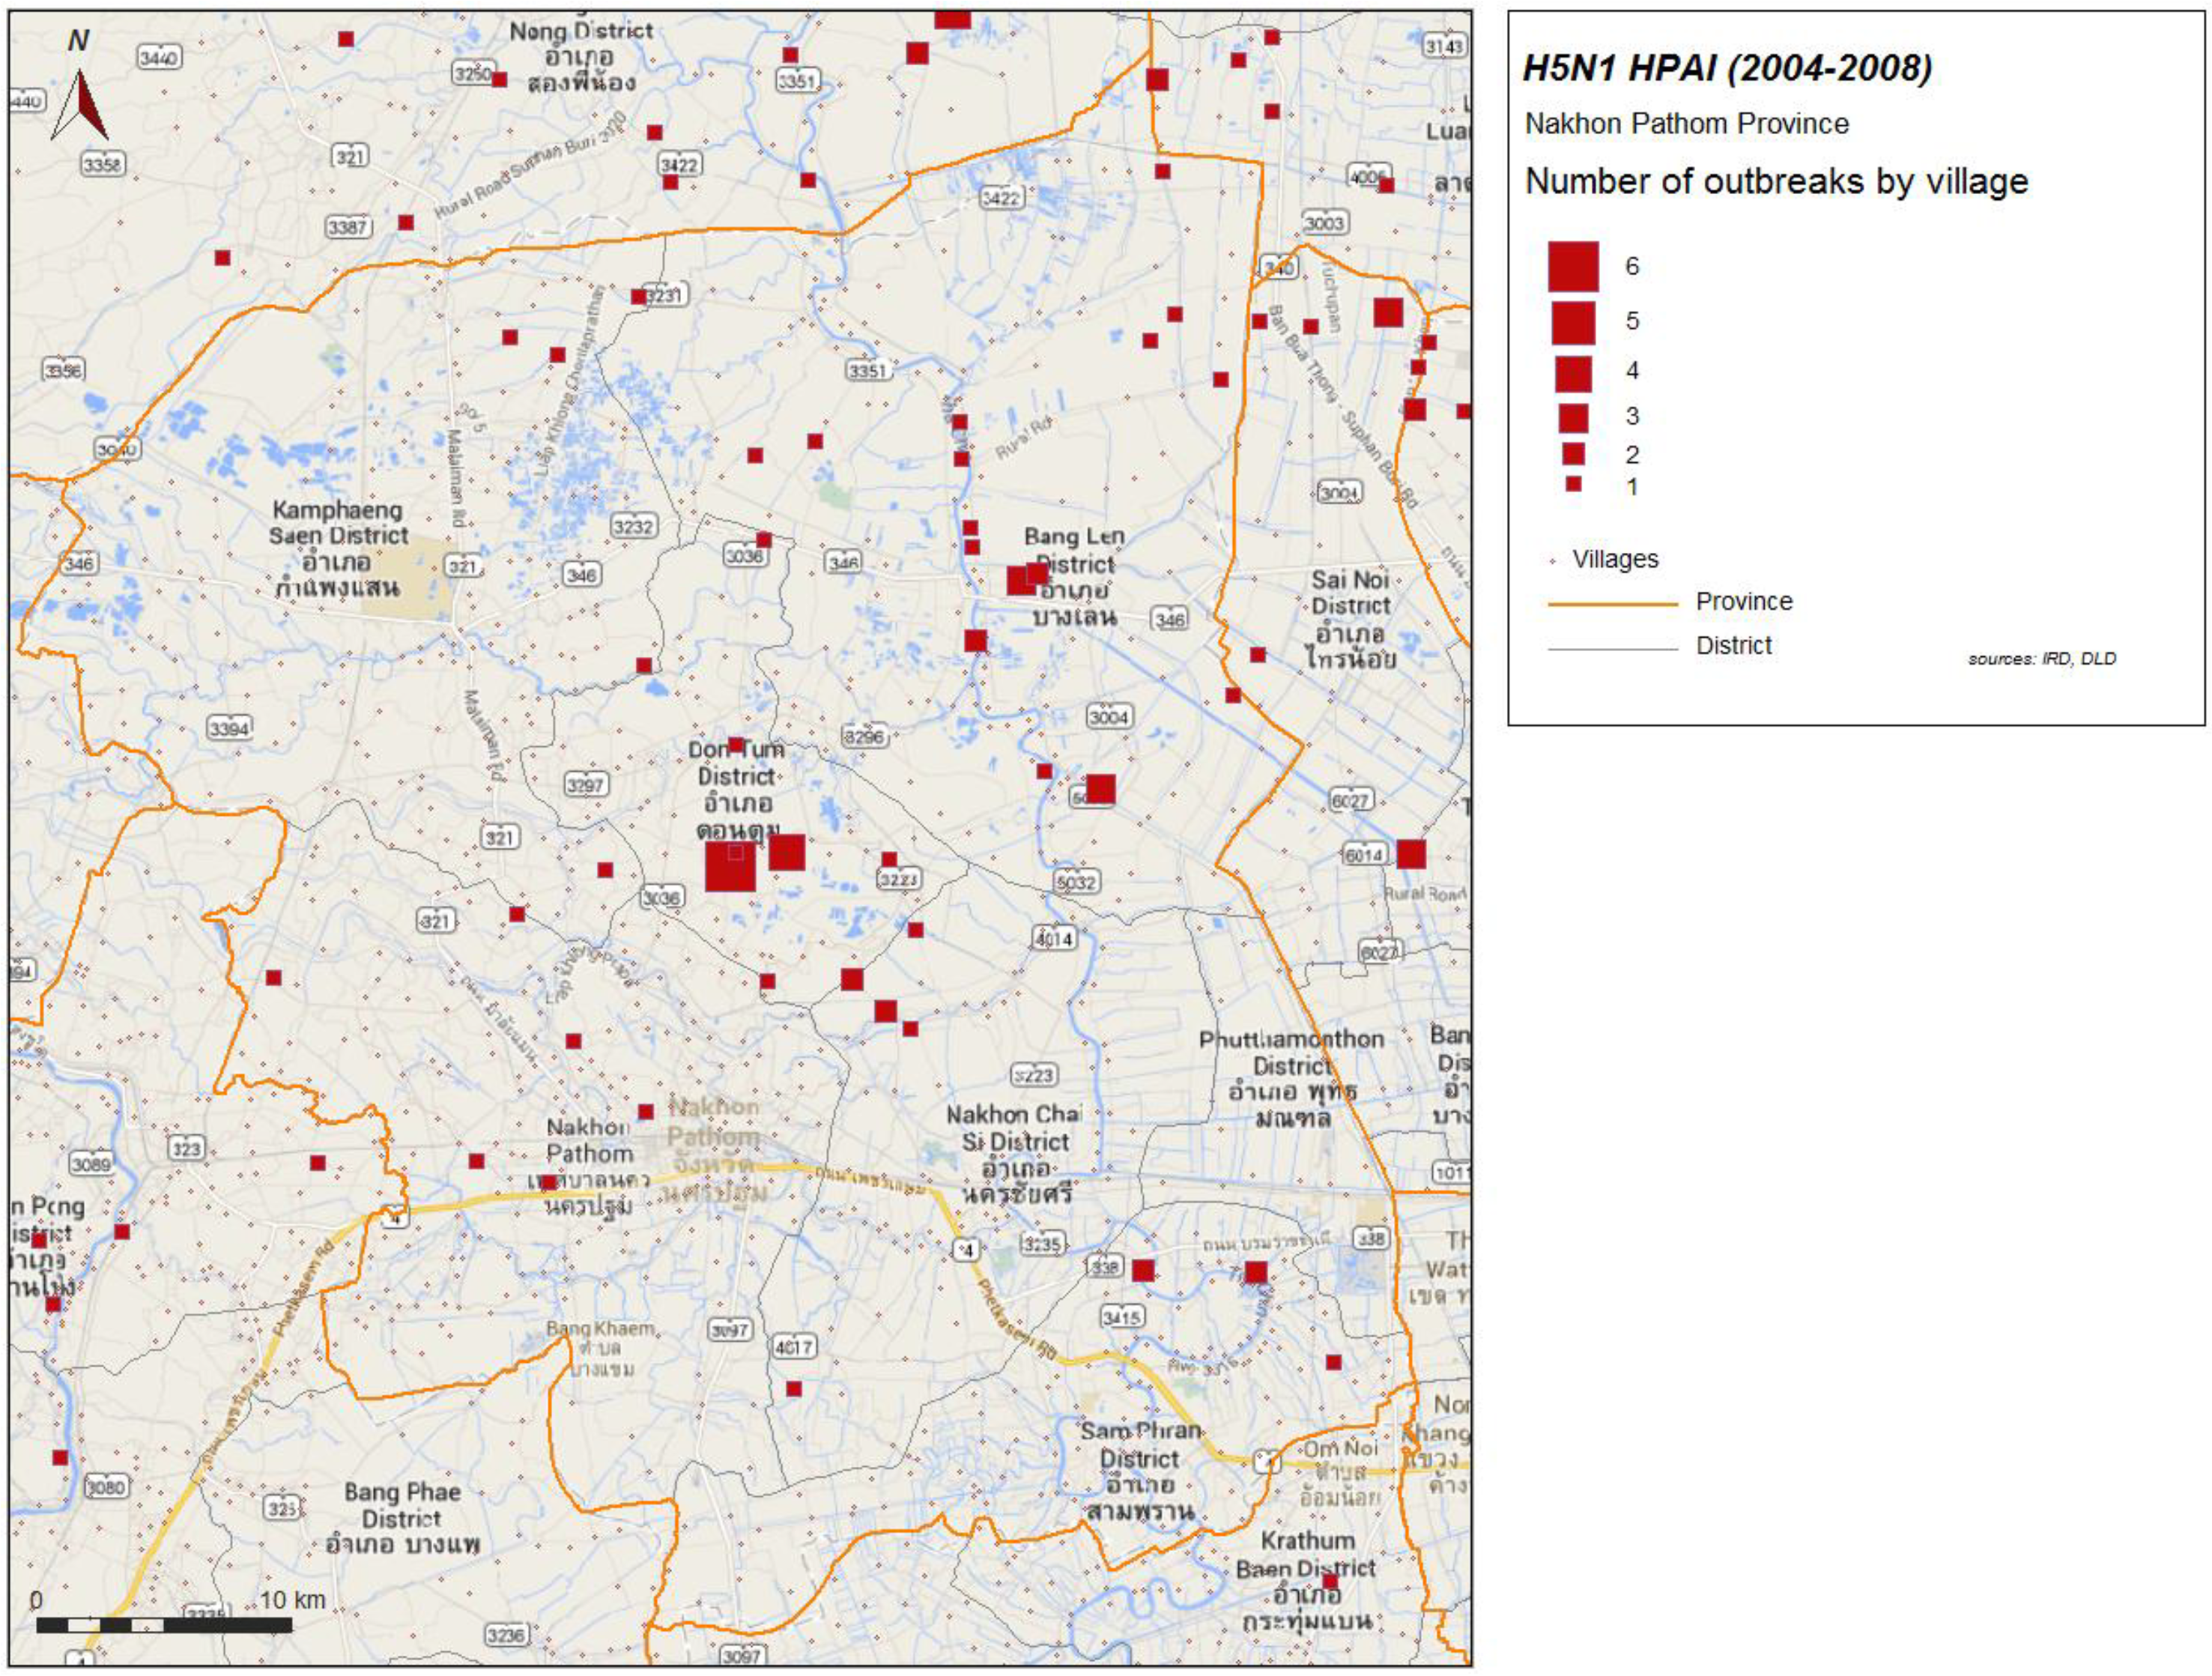
Figure 5 show the spatial distribution of the vulnerability score for layer farms and for meat farms. Significant global spatial autocorrelation of global vulnerability score (Z-score > 1.96) is found within a short radius for the spatial weight used in the spatial autocorrelation index (search radius up to 10 km). With automatic cluster detection using a spatial statistic scan, we found a most significant spatial cluster for the vulnerability score in our study, and this cluster is spatially close to the most significant cluster of the H5N1 HPAI cases that occurred during the epidemics from 2004 to 2008, and automatically detected with the same technique (
Figure 6). Local spatial association is also found (
Figure 7), showing again a clustered pattern, especially for high level of vulnerability.
Figure 4.
Score of vulnerability, layer farms sector 2 and 3, Nakhon Pathom province, Thailand. Level of vulnerability is given by color graduation and symbol width.
Figure 4.
Score of vulnerability, layer farms sector 2 and 3, Nakhon Pathom province, Thailand. Level of vulnerability is given by color graduation and symbol width.
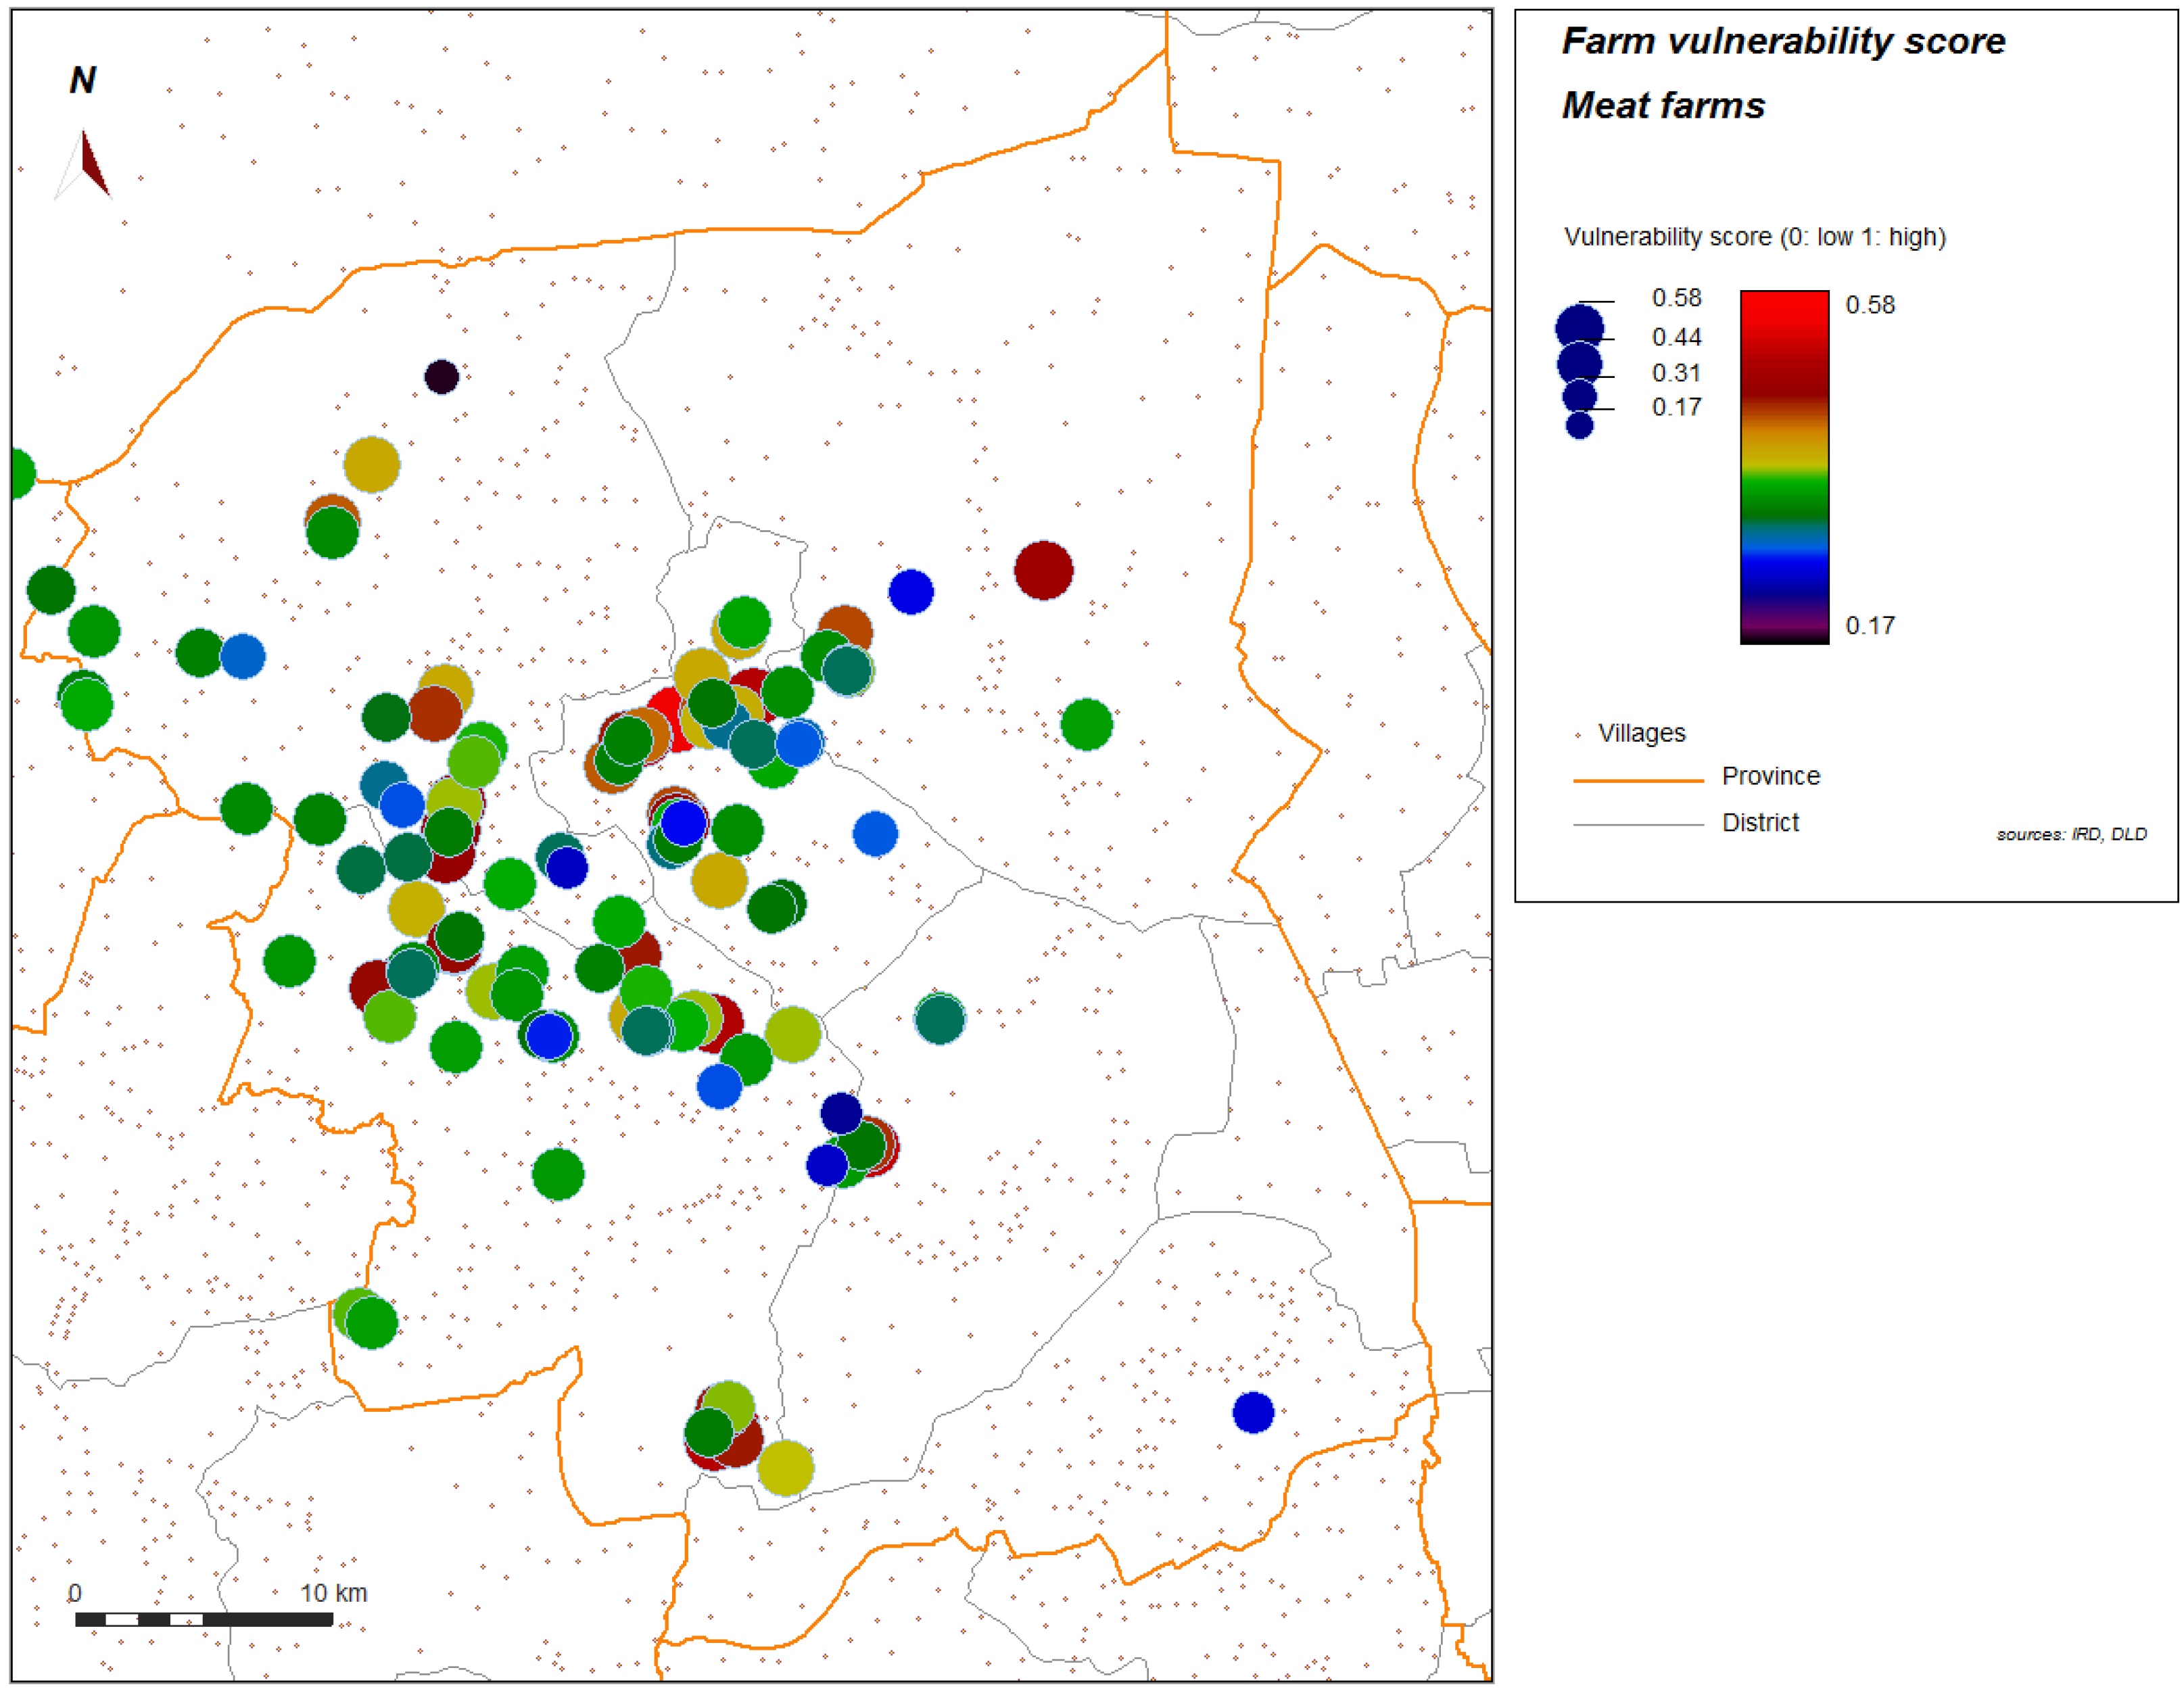
Figure 5.
Score of vulnerability, meat farms sector 2 and 3, Nakhon Pathom province, Thailand. Level of vulnerability is given by color graduation and symbol width.
Figure 5.
Score of vulnerability, meat farms sector 2 and 3, Nakhon Pathom province, Thailand. Level of vulnerability is given by color graduation and symbol width.
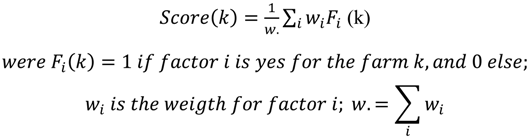
Figure 6.
Most significant cluster of vulnerability (yellow), farms sector 2 and 3, and most significant cluster (red) of 2004–2008 H5N1 HPAI outbreaks, Nakhon Pathom province, Thailand.
Figure 6.
Most significant cluster of vulnerability (yellow), farms sector 2 and 3, and most significant cluster (red) of 2004–2008 H5N1 HPAI outbreaks, Nakhon Pathom province, Thailand.
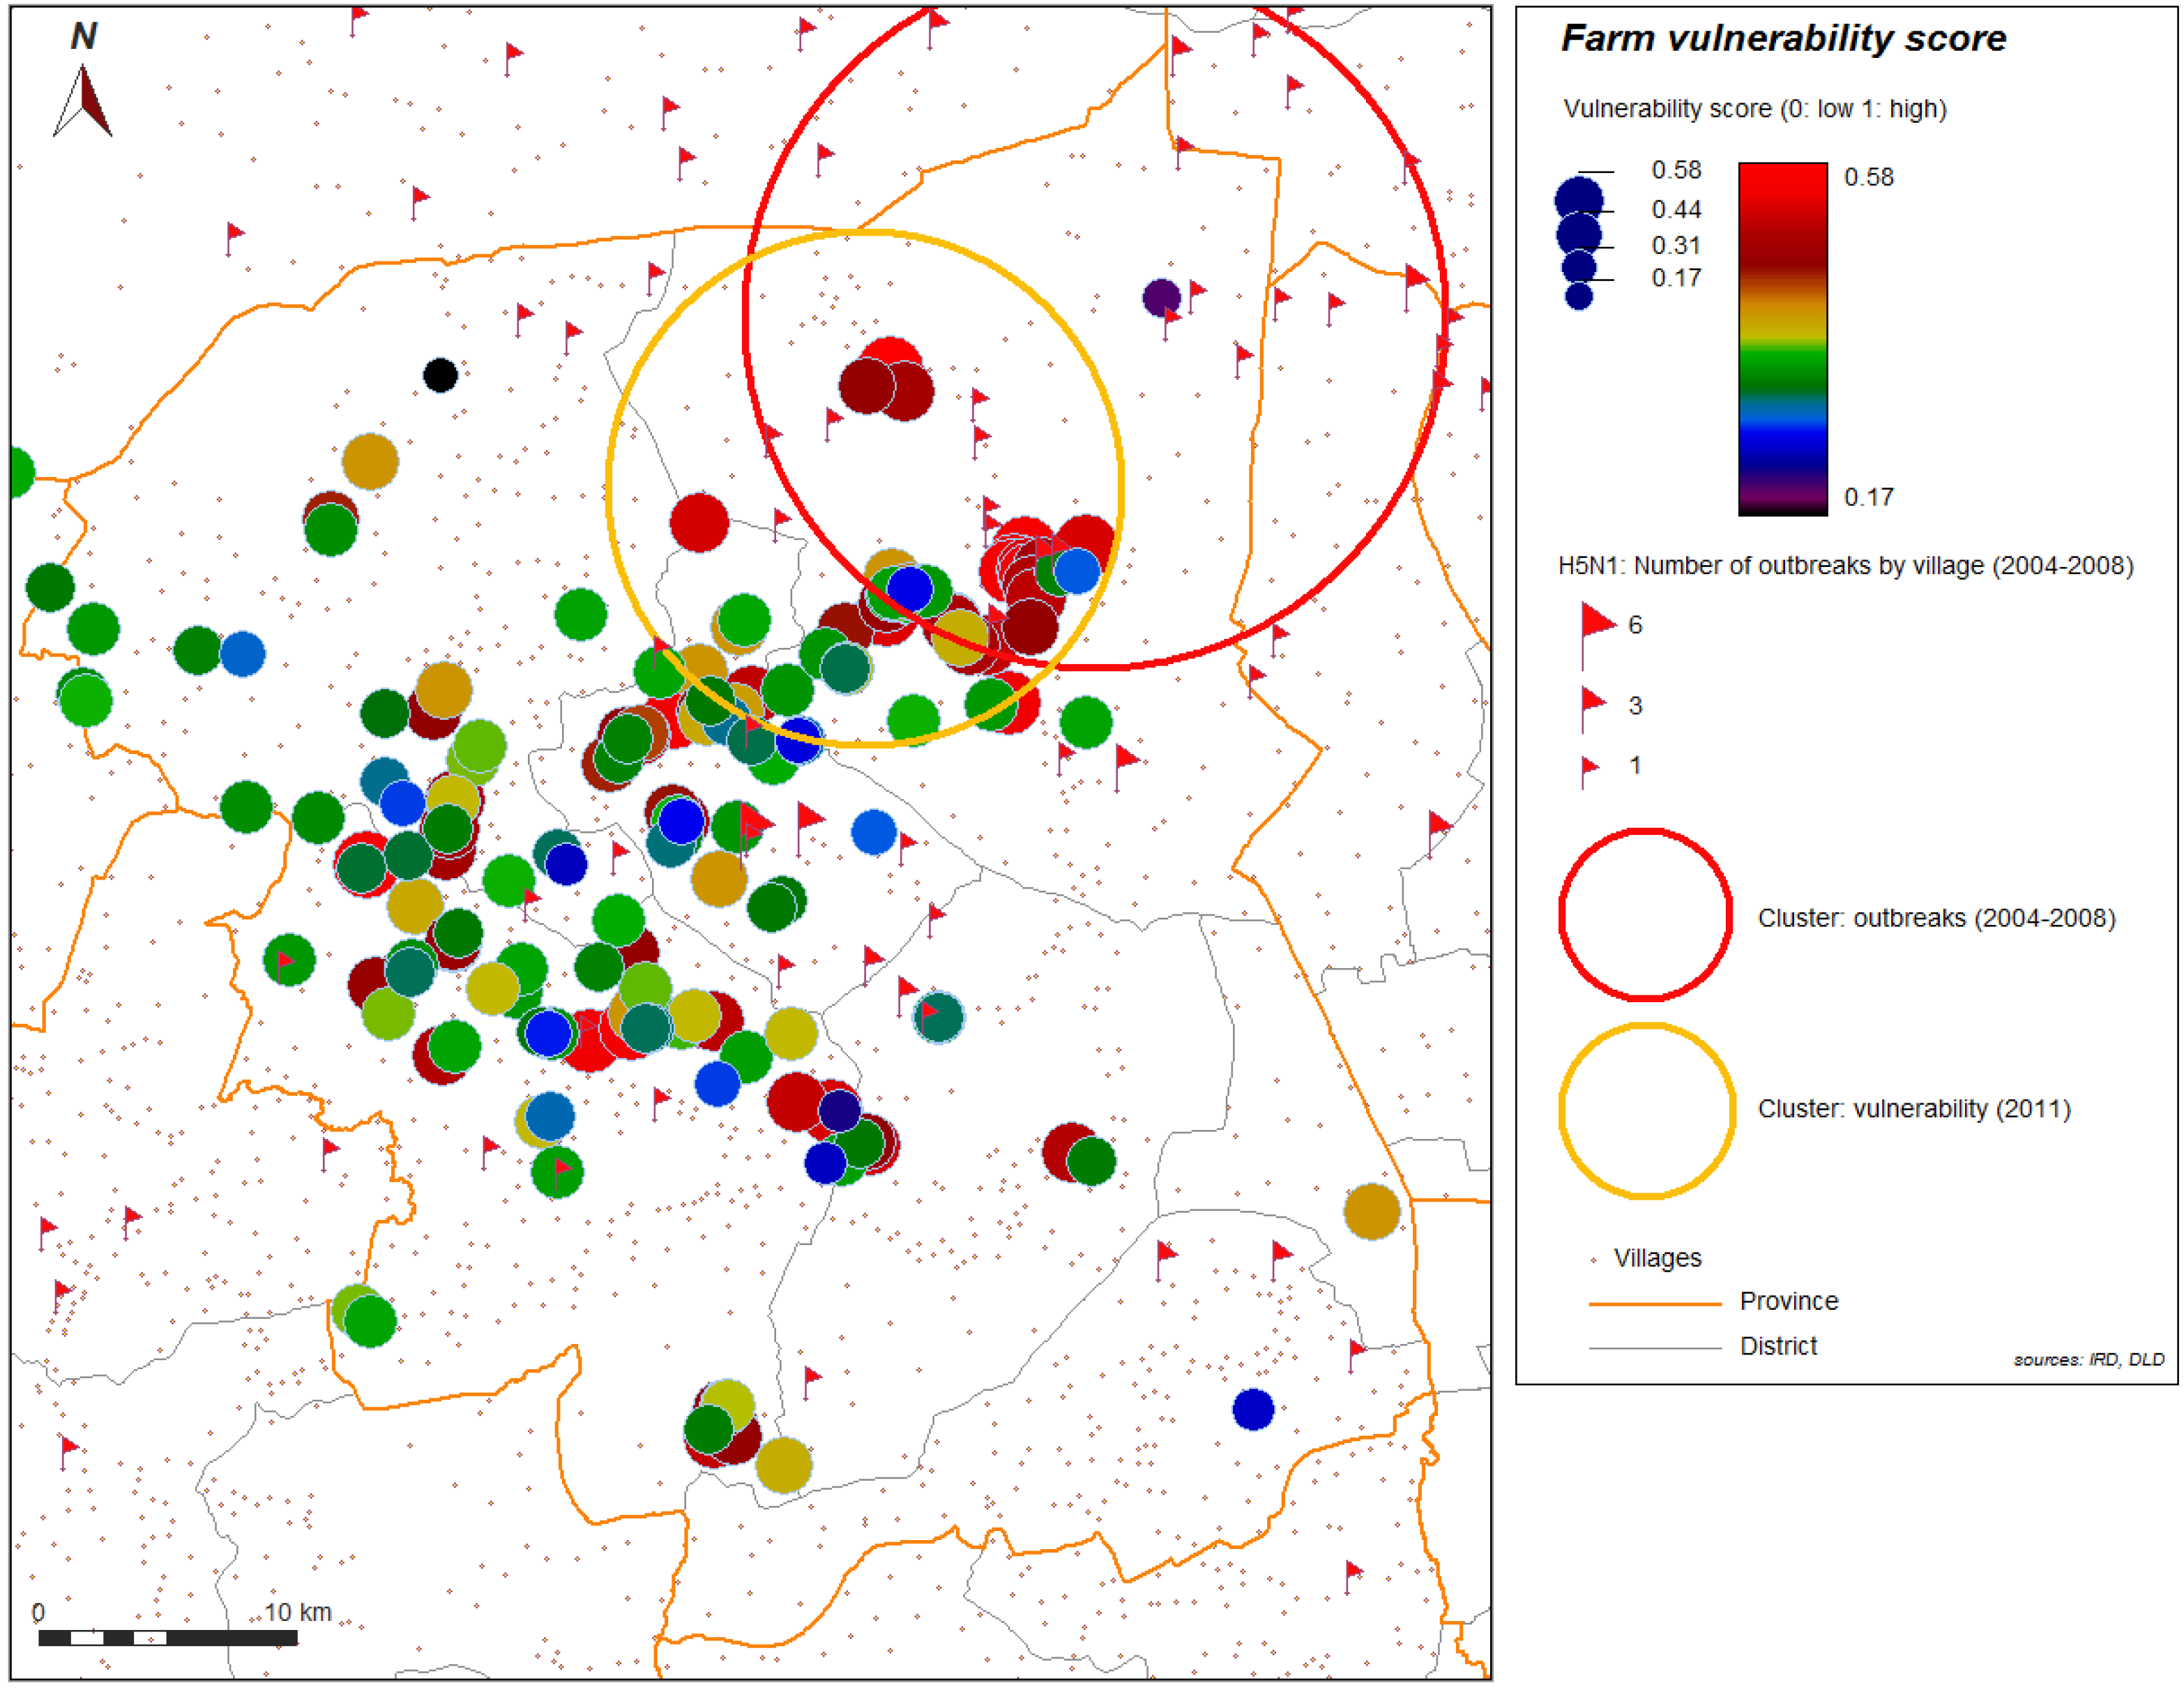
Figure 7.
Local index of spatial association (Getis-Ord) for vulnerability, farms sector 2 and 3, Nakhon Pathom province, Thailand.
Figure 7.
Local index of spatial association (Getis-Ord) for vulnerability, farms sector 2 and 3, Nakhon Pathom province, Thailand.
Spatial analysis performed by separating farms into two groups by poultry production (meat or layer) showed no significant spatial clustering in each group separately.
3.2. Discussion
For more than 20 years, the poultry production in Thailand has radically shifted to a more industrial structure, and in 2002 more than 70% of national poultry production was oriented to the export market [
13]. Industrial poultry production system in Thailand consists of vertically integrated companies controlling every stage of the production chain, from breeding to marketing processed poultry [
21]. Those companies offer contractual agreements to private farms and purchase poultry products from them. The firm holds considerable control over raw material production without ownership of the production units. Contract farmers have an assured market for their poultry, access to the firm’s services, and easier access to credit from banks [
22]. Independent farmers mostly sell their larger surpluses to aggregators who drive pickups from village to village, purchasing birds from numerous different farms. A small amount of eggs and live or slaughter birds are sold to “End Users” (neighbors, restaurants or village, market vendors). Due to this production system, 98% of commercial poultry producers (sector 1–3) belongs to sector 2 and 3 in Thailand [
3]. Sector 4 still exists as a source of suppliers for local markets.
Our goal was therefore to determine the actual level of vulnerability of this medium and small scale commercial poultry production system (sector 2 and 3) and to determine the most hazardous poultry farming practices related to the risk of avian influenza contamination and spread.
Our study clearly showed that vulnerability among farms in the province of Nakhon Pathom is still very high. It appears that the vulnerabilities related to poor farm management are predominant. Major deficiencies in bio-security measures were found in the areas of farm management, including transport, restocking practice, manure utilization, water management, rodent and insect control, frequency of disinfection, worker routines, hygiene practices and contact between farms. This is undoubtedly the result of a lack of awareness among farmers regarding the potential risks of epidemics. They are relatively complying with current regulations, but not all are entirely convinced that the risk of infections is still real, after a long period without warning since the last outbreak (in 2008).
Easy access to farm through entrances was found in 76% of farms, as the doors are open with no locks or warning sign. This percentage is very high and this is a major issue in vulnerability regarding farm to farm contamination.
75% of farms are located next to a pond or a pond is present at the farm. 19% of farms practice an integrated poultry and fish farming. Droppings and food spilled by chickens fall directly into the water and feed the fish. If birds are housed without proof housing this practice is considered as high risk to disseminate avian influenza virus [
6,
23,
24,
25,
26]. Furthermore, constant presence of wild birds or ducks attracted by the pond can contribute to the spreading of the disease. Finally, disinfection of poultry houses is not practiced in integrated poultry-fish farms since farmers are afraid of killing the fish. All farmers declare the regular presence of wild birds on the farm. 82% have no proper food storage or keep an open door at poultry food storage.
Although 85% of farmers replied positively to the use of rodent control, 83% of them use cats as the unique means of rodent control. The use of insecticides is very uncommon, and 94% think insects are not an issue. Even if insects themselves do not represent a known risk for the spread of avian influenza, insect infestation is a marker of poor hygiene and poor maintenance of the farm.
The transport of poultry, food, or fomite is an important risk factor for the transmission and dispersion of avian influenza [
27,
28]. On contractor farms, the company tracks and collects poultry or delivers food directly to the farm, unlike 39% of independent farms who delivers their products to various aggregators. These aggregators move from one farm to another, thus increasing the risk of avian influenza virus entry [
29]. This practice represents a significant risk of spreading pathogens between farms if the disinfections of trucks are not applied at the entries and exits of the farm [
30]. Similarly, the transport of poultry to the slaughterhouse several times per production cycle and restocking with non-compliance the rule “all in, all out” is also a risk factor [
6]. In 93% of visited farms, disinfectant barriers at the farm entrance do not exist. 55% of farms do not practice trucks disinfection. Moreover, at all farms, truck drivers leave vehicles and walk around in their own clothes. These results show a very high vulnerability issue.
Employers of 93% of the farms do not provide or request work clothing, and at 38% of farms the same employees work on several different poultry units. Most farms do not provide food for the workers, and they frequently go out (more than two times a day) to buy a meal. Moreover, 37% of farms permit street food vendors to enter the farms and sell food to workers. Again, these results show a high vulnerability issue regarding virus dissemination.
Regular cleaning of poultry rearing equipment is practiced on only 26% of farms. Farm disinfection is applied at 59%, and no one in a poultry farm above a fishpond uses disinfectant. Disinfection of poultry houses at the end of the poultry production cycle is widely applied but still not applicable on poultry rearing equipment and egg trays. As animal food, fresh manure is used at 57% of farms, and 50% use dead fowl of farms as animal food.
Farms producing eggs are more vulnerable than farms producing birds and this result is consistent with the type of farms mostly affected during the 2004–2008 outbreaks [
2]. Layer farms are more vulnerable than meat farms: factors associated with egg production strongly contributes to the vulnerability, and many farms producing eggs have low results regarding vulnerability factors linked to egg production.
Although almost all farmers knew about avian influenza, 63% of them do not think it is a dangerous disease and therefore are not concerned. Farmers adhere only to what is requested by the DLD GAP regulations. The long period without warning since the last outbreak of HPAI could also be an element of a relative lessening of farmers’ vigilance.
Spatial clustering of vulnerability is also an important bio-security issue; infection in a farm may spread to neighboring farms if vulnerability of neighbors is high. Compartmentalization (defined primarily by management and husbandry practices related to biosecurity) is recommended by FAO [
6,
23] and has been promoted to limit disease spread between farms. Nevertheless, our results show that many vulnerability issues are related to contacts (
i.e., easy access to farms, behaviors of workers, low disinfection at entrance) and are clustered. These spatial clusters of vulnerability need to receive special attention from authorities to respect the purpose of compartmentalization.


