3.1. Remote Sensing Inversion of PM10 Concentration in Beijing
The DVI index is built due to the different influence of inhalable particle pollutants on the transmissivity of the visible channel and near infrared channel of the NOAA satellite [
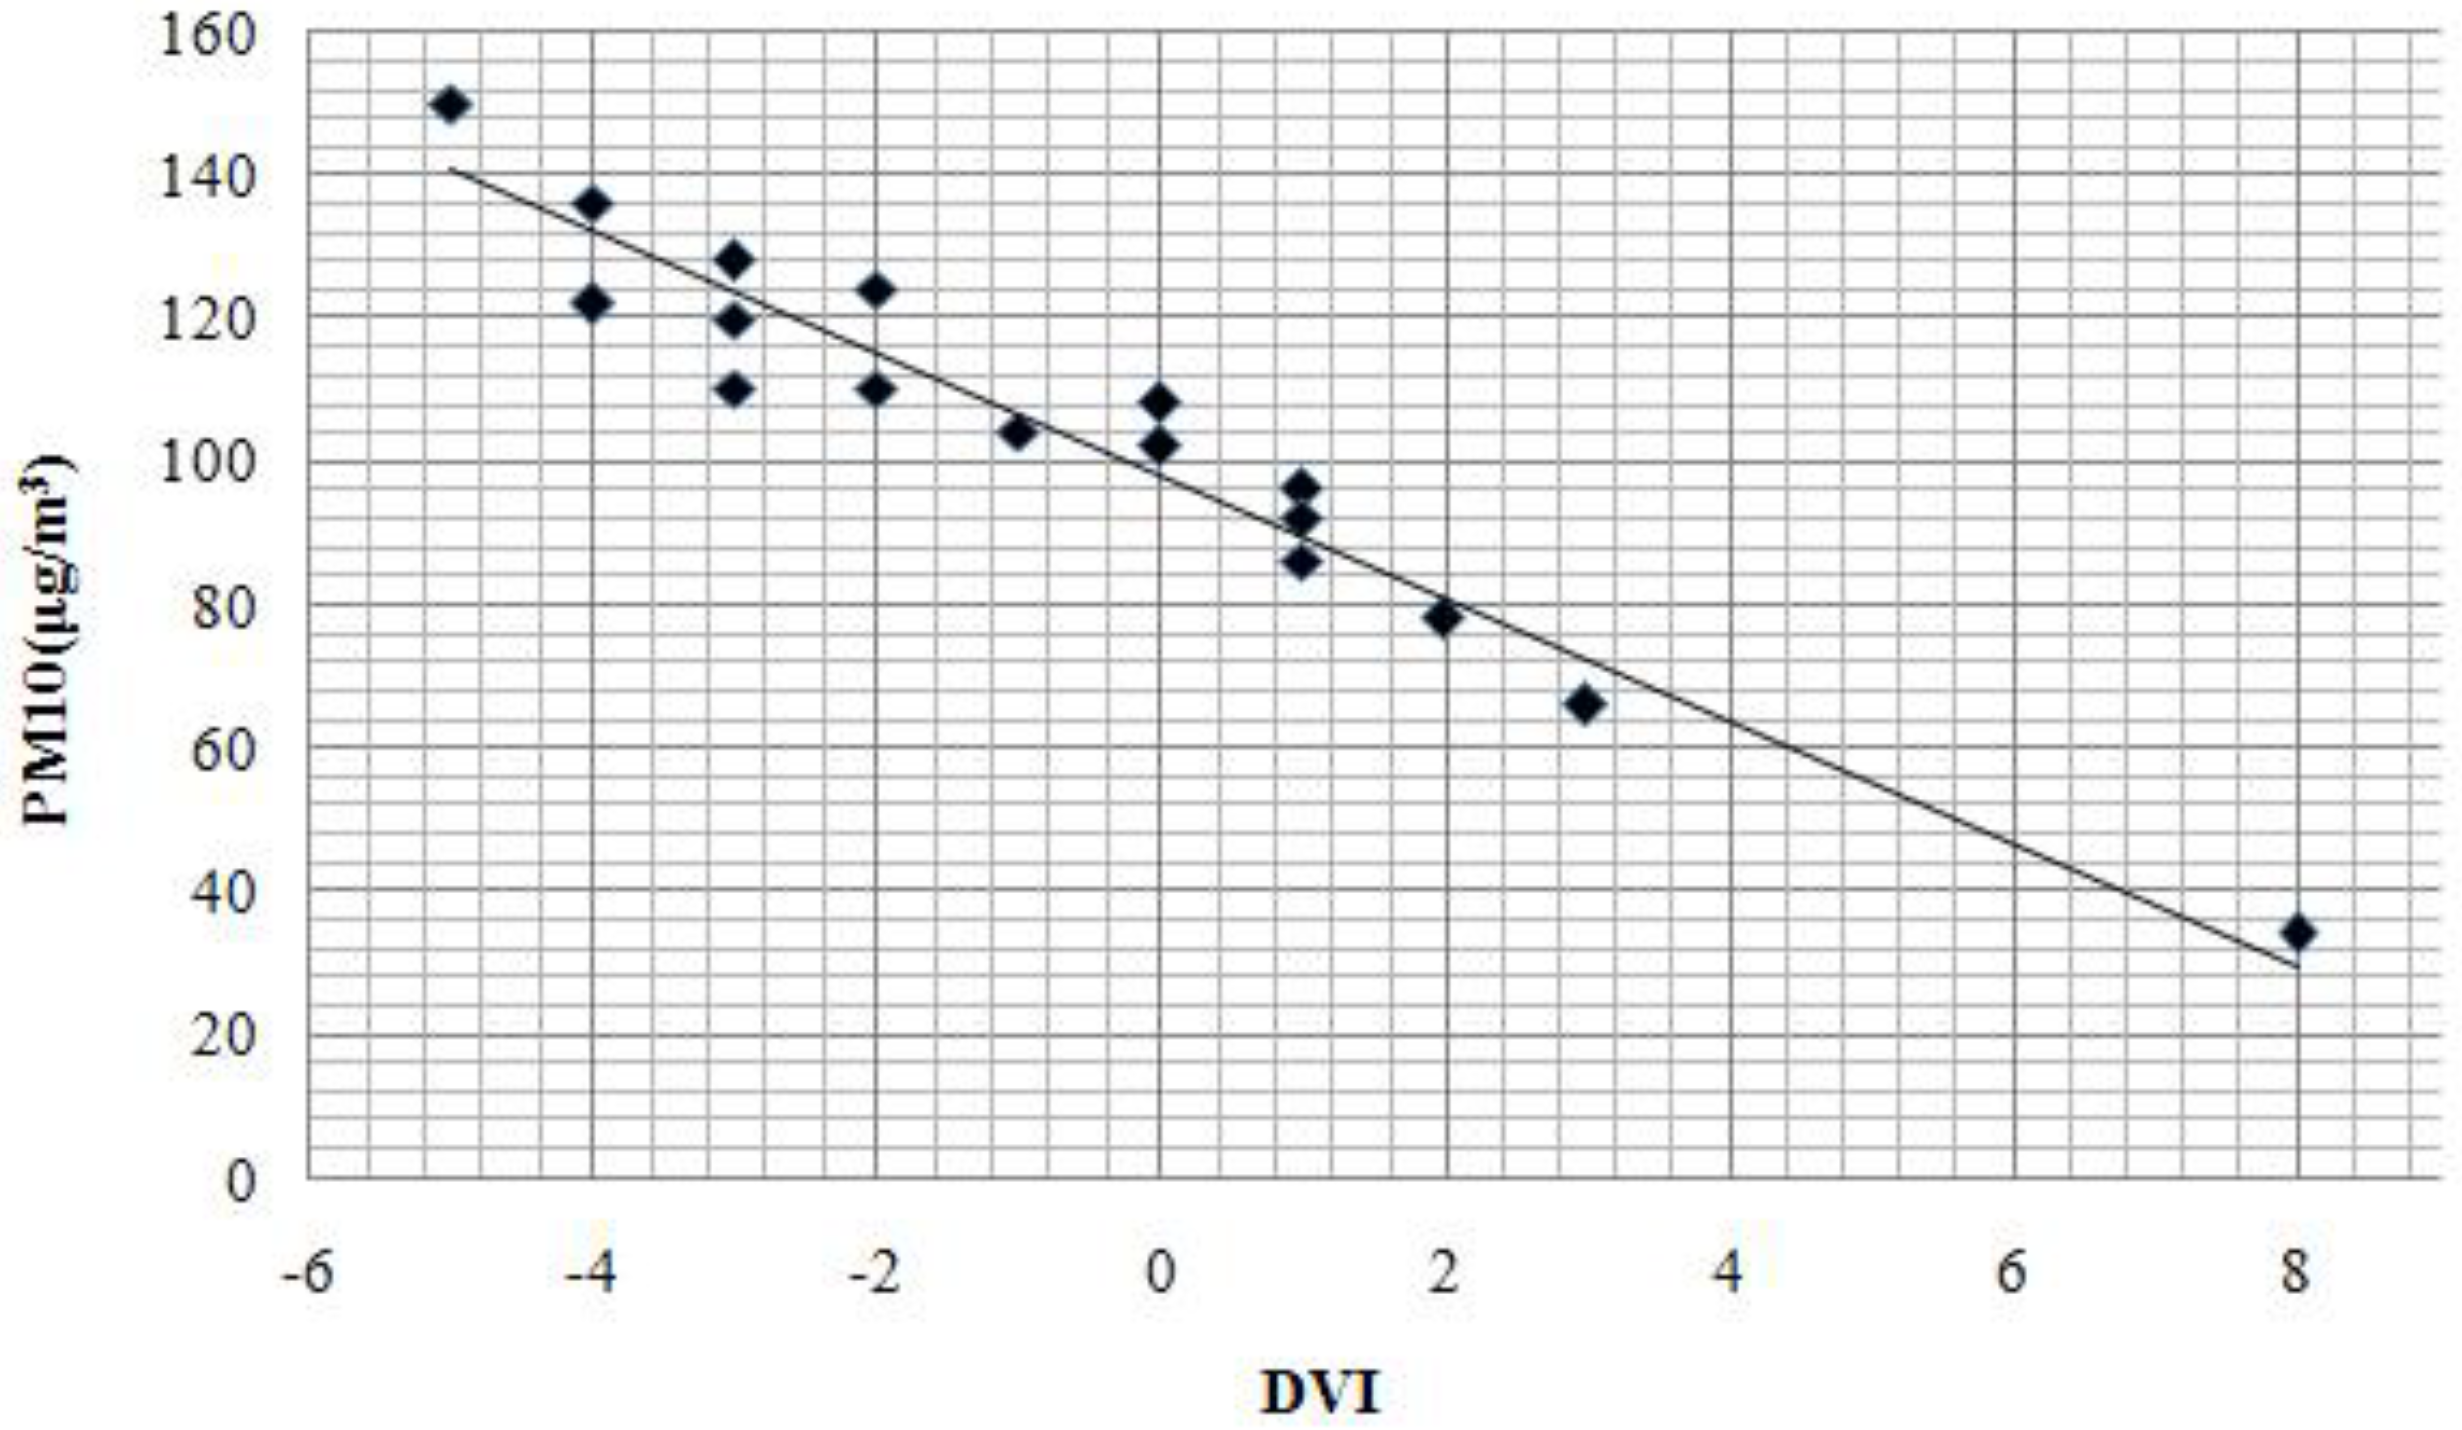
30]. The DVI (difference vegetation index) was used to determine the inverse spatial distribution of inhalable particulate matter. Recent studies indicate that there is a linear correlation between DVI and PM
10 [
30,
47]. We used the PM
10 synchronous monitoring data collected from 17 Beijing ground stations taken when the Landsat Satellite transited Beijing (see
Figure 2). The DVI values were then extracted according to the geographic coordinates of the stations. To diminish impacts on the final results due to location errors, the average DVI values of 3 × 3 pixels around the monitoring station were used. SPSS software analysis of the linear correlation of the monitoring data of PM
10 and DVI values generated a correlation coefficient of −0.9683. The linear regression equation describing the relationship between PM
10 concentration and DVI was then established and the following regression equation of the PM
10 concentration and the DVI values based on the TM images in 2009 was generated (Equation (11)):
where y is the concentration of PM
10 (μg/m
3) and x is the DVI.
Figure 2.
Relationship between DVI and PM10 concentration in March 2009.
Figure 2.
Relationship between DVI and PM10 concentration in March 2009.
The Spatial Analyst tool in ArcGIS was used to establish the inverse model based on the regression equation to give the inverse PM
10 spatial distribution for Beijing in 2009 (
Figure 3). Due to the fact that water surface has a very low reflection; therefore, the DVI values are influenced by this and has a much lower values than the other areas. Thus it is illustrated clear that large water surface areas all have a relative high PM
10 inversion concentration. Therefore, the PM
10 concentration reversion results of Miyun reservoir and other large water surface areas should not be taken into consideration. To make the study results accurate, we have deleted the PM
10 concentration of the water surface areas in the study area. The PM
10 concentration retrieval method is not suitable for the water surface; therefore, the Miyun reservoir PM
10 concentration reversion results could not be taken into consideration. Except for some unique areas such as the Miyun reservoir, the spatial distribution of the inverse PM
10 concentration from the TM images in 2009 were generally in line with the spatial distribution characteristics of inhalable particulate matter in Beijing, with PM
10 concentrations in urban areas being larger than in suburbs and southwestern PM
10 concentrations being larger than those in the northeast. The statistical analysis function also revealed that the average PM
10 concentration in Beijing is 81.507 μg/m
3, while the west area of the city had the largest PM
10 concentration of 125.958 μg/m
3, and that of the Huairou district had the lowest PM
10 concentration of 66.464 μg/m
3.
Figure 3.
PM10 TM image inversion results in March 2009.
Figure 3.
PM10 TM image inversion results in March 2009.
Validation samples were selected at random based on the regression equations for accuracy verification using Equation (12) to acquire the results shown in
Table 2. We excluded the largest and smallest error rates during statistical analysis to obtain reliable results. The results of the 2009 PM10 inversion of the TM image had a smaller error and higher precision. The final average error rate was 8.44%, indicating that the error of the PM10 concentration inversion results in 2009 was relatively small and authentic:
where ER is the error rate of the PM
10 concentration based on thermal environment,
Ci is the value of the PM
10 concentration based on thermal environment,
Cj is the actual value of the PM
10 concentration.
Table 2.
Accuracy verification results of PM10 TM image inversion in March 2009.
Table 2.
Accuracy verification results of PM10 TM image inversion in March 2009.
| Sample Serial Number | 1 | 2 | 3 | 4 | 5 | 6 | 7 |
|---|
| Error rate (%) | 3.98 | 16.68 | 5.66 | 14.39 | 0.05 | 11.76 | 6.41 |
| Average error rate (%) | 8.44 |
3.2. PM10 Health Risk Assessment in Beijing
According to the inhalable particulate matter risk assessment method, we used the remote sensing inversion of PM
10 spatial distribution to calculate the corresponding relative risk (TR
i) to the certain health impact (i) of inhalable particulate matter (Equation (1)), after which we calculated the inhalable particulate matter health risk assessment (TR) according to Equation (2). The calculation results are shown in
Figure 4.
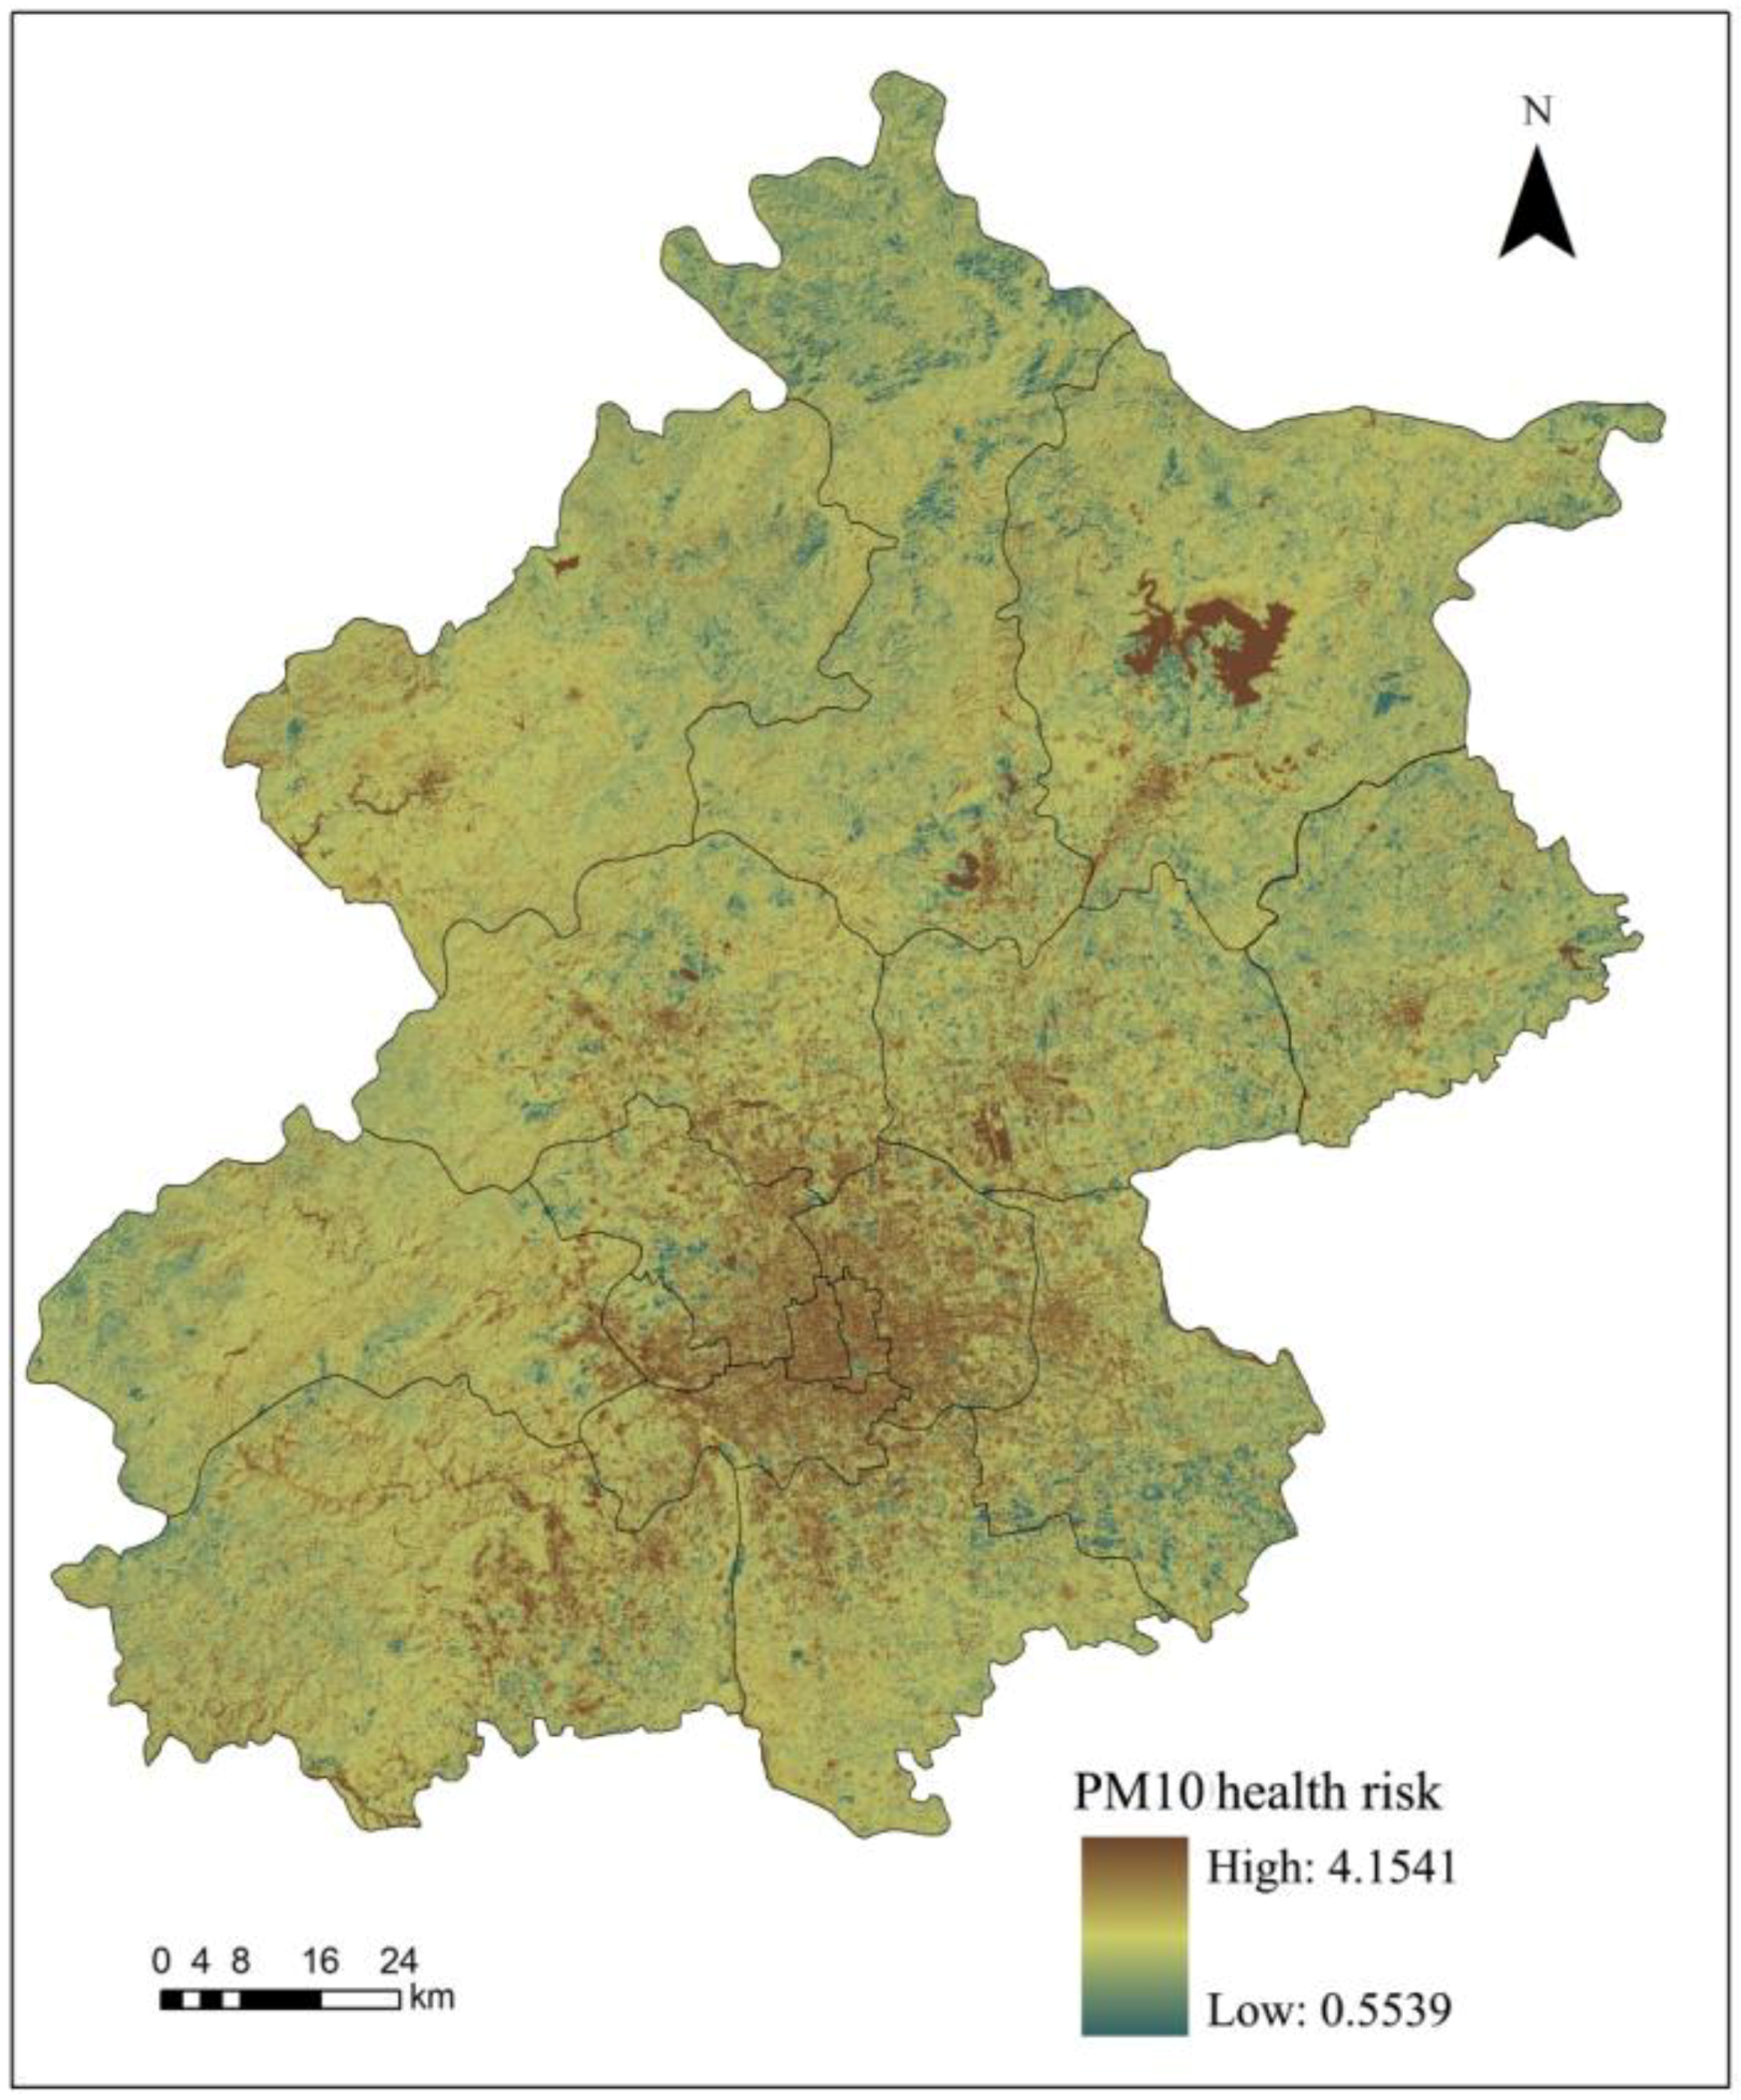
Figure 4.
PM10 health risk assessment results in Beijing in March 2009.
Figure 4.
PM10 health risk assessment results in Beijing in March 2009.
The spatial distribution of the PM
10 health risk assessment results is basically the same as the inhalable particulate matter spatial distribution in Beijing in 2009; with a higher health risk in urban areas than rural areas and southwest regions than northeast regions (
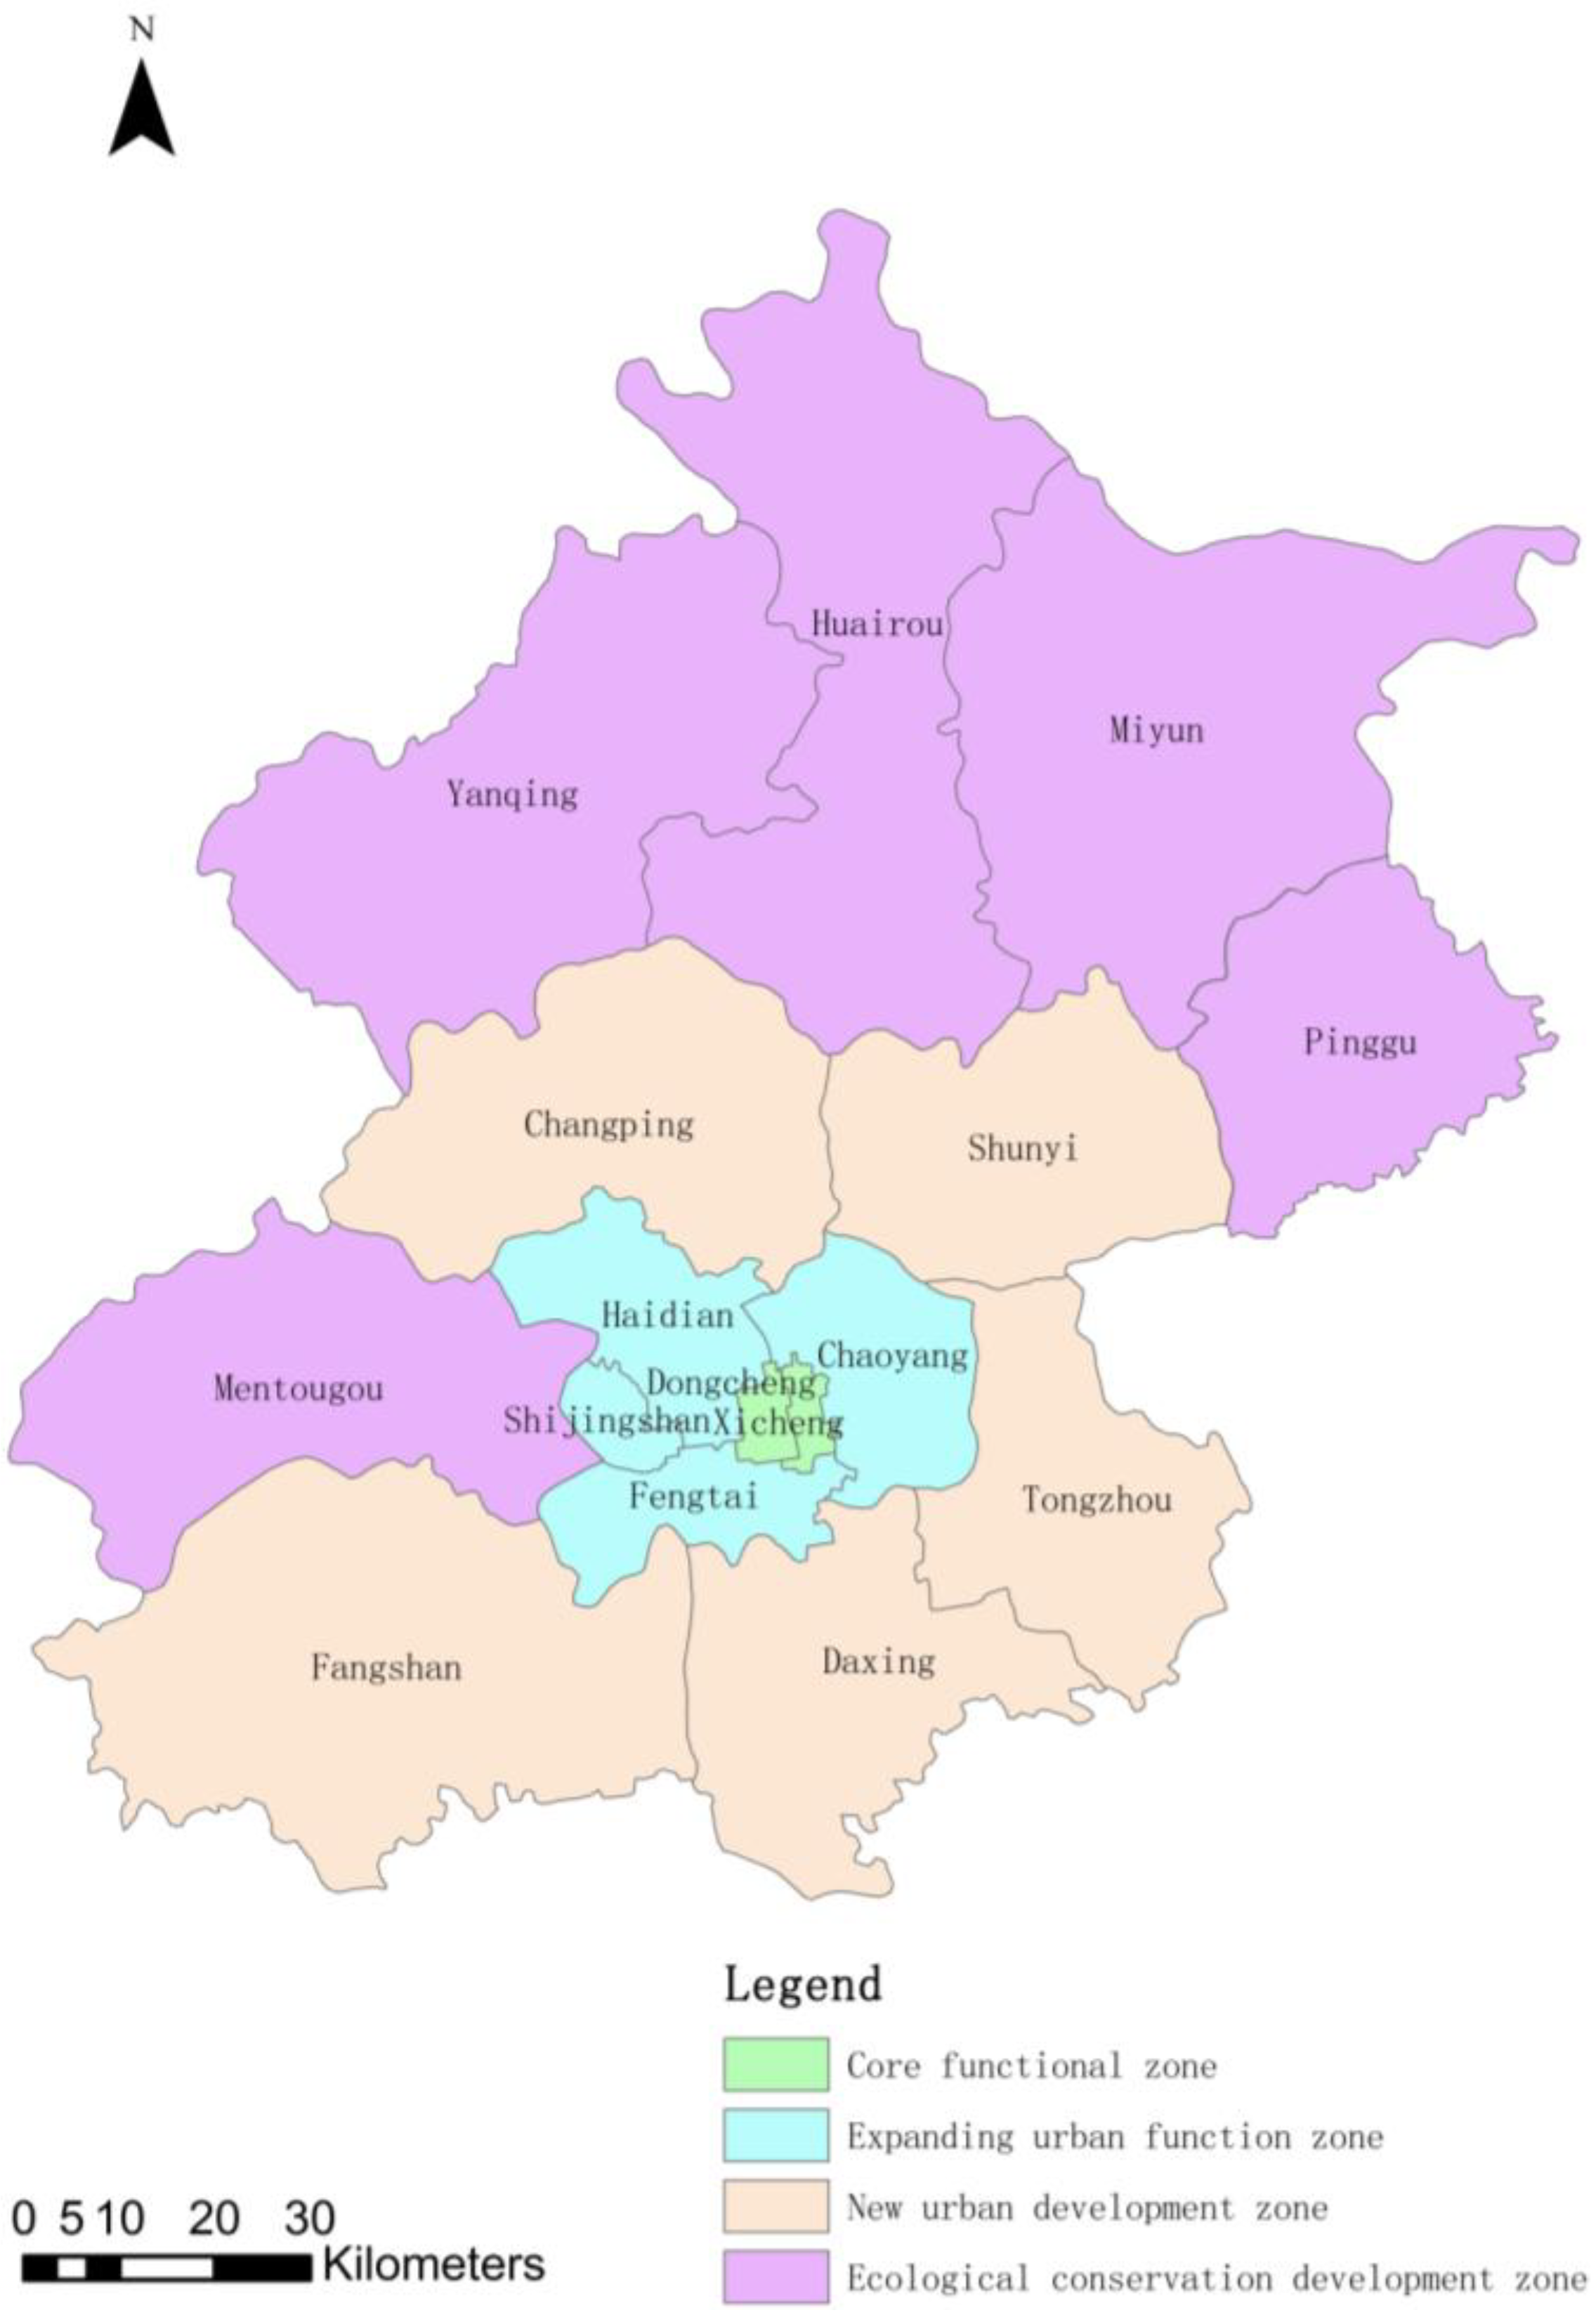
Figure 4). Additionally; we excluded specific regions such as the Miyun reservoir and obtained an average health risk value of 1.144. Statistical analysis revealed a descending health risk in central areas of the city; including the Dongcheng; Xicheng; Chaoyang; Fengtai; Shijingshan and Haidian districts; as well as in the new urban development zone; which comprises the Fangshan; Changping; Tongzhou; Shunyi and Daxing districts. However; in the ecological conservation development zone; the PM
10 health risk was increasing from the Pinggu; Mentougou; and Huairou districts to Miyun and Yanqing counties.
When Miyun reservoir and other special areas are excluded, the health risk associated with PM10 in Beijing was 1.144. The results indicated that health risks associated with inhalable particulate matter occurred in the following order: Dongcheng > Xicheng > Chaoyang > Fengtai > Shijingshan > Haidian districts, as well as: Fangshan > Changping > Tongzhou > Shunyi > Daxing districts in the new urban development area and Pinggu > Mentougou > Huairou > Miyun > Yanqing in the ecological conservation area.
3.3. PM10 Health Risk Assessment Based on Thermal Environment in Beijing
We calculated the average UHI, NDVI and NDWI and utilized these indicators to compute the PM
10 concentration values in different districts or counties in Beijing in March 2009 (
Table 3). The calculation equations of UHI, NDVI and NDWI have been conducted and published by Xu
et al. [
46].
Table 3.
UHI, NDVI and NDWI and PM10 concentration of different districts/counties in March 2009.
Table 3.
UHI, NDVI and NDWI and PM10 concentration of different districts/counties in March 2009.
| Function Zone | Districts/Counties | UHI | NDVI | NDWI | PM10 |
|---|
| Core functional zone | Dongcheng | 0.0949 | −0.0340 | 2.1858 | 122.1179 |
| Xicheng | 0.1032 | −0.0479 | 2.26298 | 122.4633 |
| Expanding urban functional zone | Chaoyang | 0.1347 | −0.0110 | 1.82502 | 103.6067 |
| Fengtai | 0.2059 | −0.0087 | 1.63885 | 103.0618 |
| Shijingshan | 0.1738 | −0.0027 | 1.51558 | 98.6612 |
| Haidian | 0.1295 | 0.0075 | 1.46408 | 91.0722 |
| New urban development zone | Fangshan | 0.0821 | 0.0142 | 1.88004 | 86.1678 |
| Tongzhou | 0.1630 | 0.0240 | 1.64704 | 77.9883 |
| Shunyi | 0.1159 | 0.0233 | 1.04961 | 78.8774 |
| Changping | 0.1718 | 0.0201 | 1.16889 | 80.9161 |
| Daxing | 0.1980 | 0.0169 | 1.12659 | 83.1933 |
| Ecological conservation development zone | Mentougou | −0.0294 | 0.0246 | 1.59843 | 79.5299 |
| Huairou | 0.0314 | 0.0482 | 1.87591 | 66.9317 |
| Pinggu | −0.2141 | 0.0423 | 2.11136 | 70.1956 |
| Miyun | −0.1543 | 0.0325 | 1.79686 | 75.3956 |
| Yanqing | −0.1562 | 0.0307 | 1.75038 | 76.3468 |
According to the PM
10 concentration calculated based on the thermal environment, we obtained the health risks of Beijing in March 2009. The results indicated that the health risk results based on thermal environment were similar to the previous assessment results calculated from PM
10 remote sensing inversion, which was with an average variance ratio of 0.38% and the largest variance ratio being 1.05% (
Table 4). These findings indicate that the PM
10 health risk assessment method based on thermal environment can present PM
10 health risks in the region with relatively good precision.
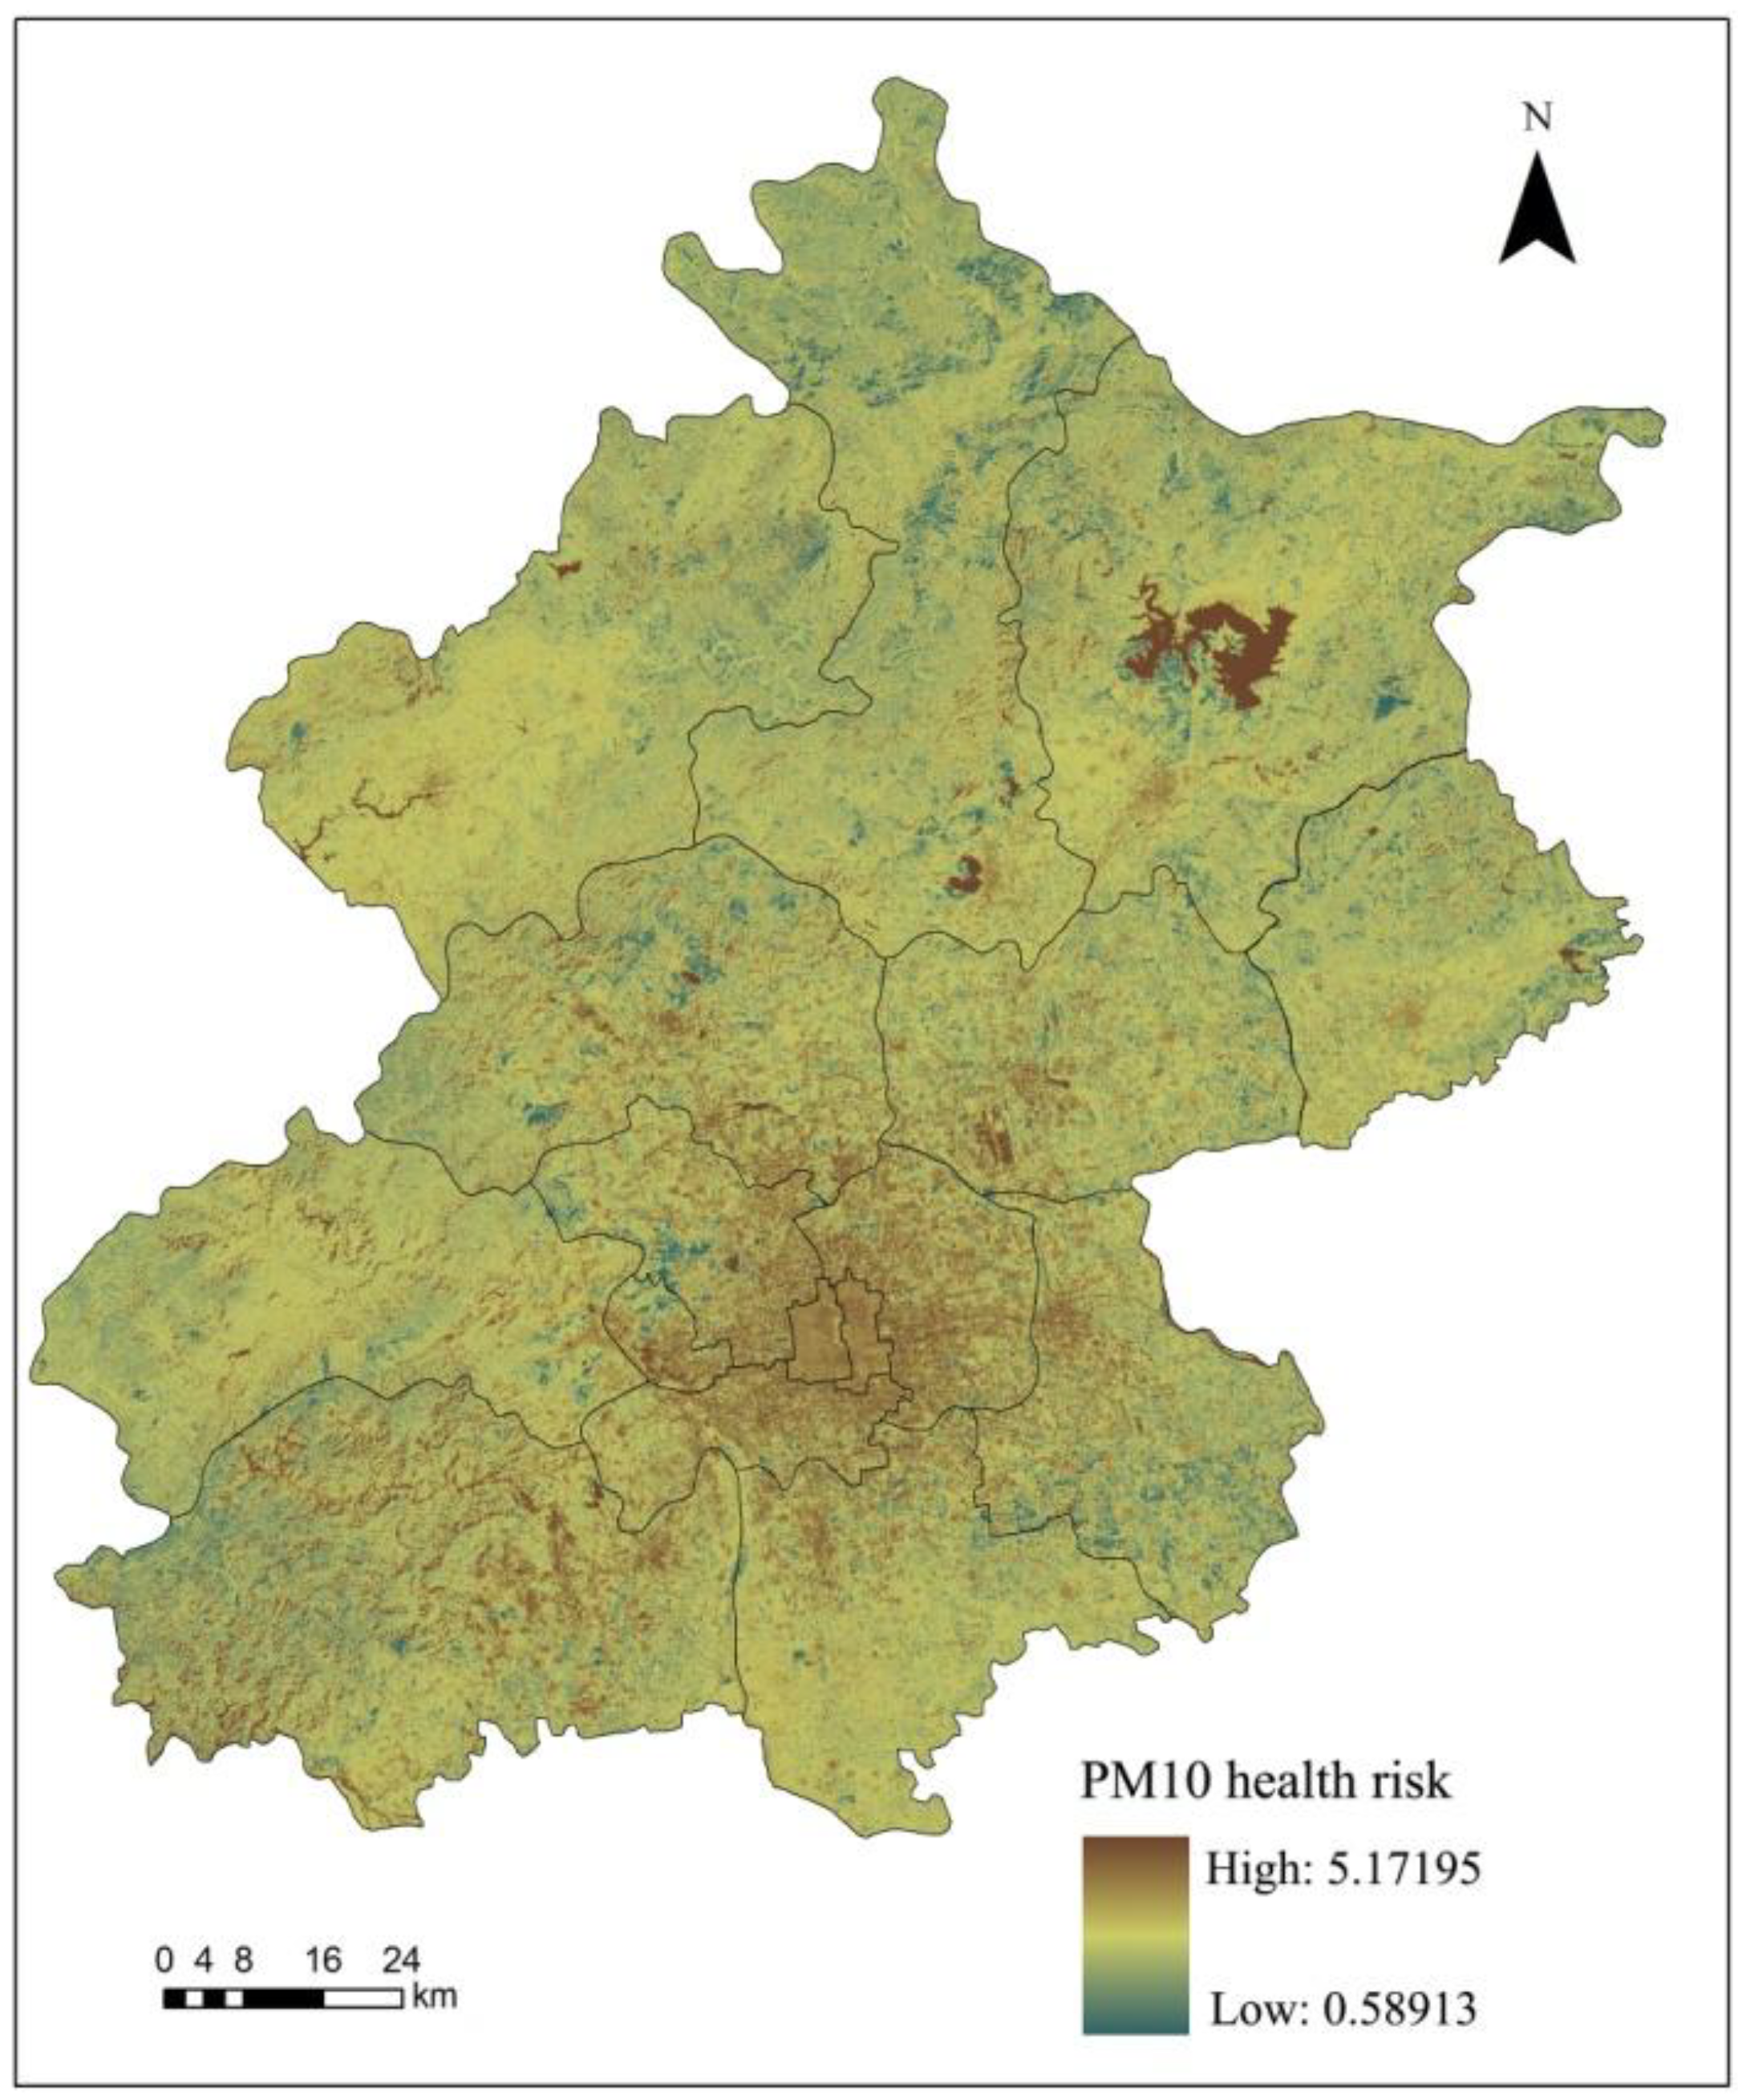
To compare the PM
10 risk assessment results based on thermal environment with the previous results in part 3.3, the Zonal Statistics function in the ArcGIS software was used to analyze the statistical results. It was indicated that the analysis of PM
10 health risks based on thermal environment was roughly the same as the PM
10 spatial distribution in Beijing (
Figure 5). The assessment results showed that the health risk of urban areas was higher than the health risk of rural areas and the southwest region had a higher risk than northeast regions. After excluding some unique regions such as the Miyun reservoir, we obtained the average health risk associated with PM
10 of 1.145.
Table 4.
PM10 health risk assessment results comparison in Beijing in March 2009.
Table 4.
PM10 health risk assessment results comparison in Beijing in March 2009.
| Function Zone | District/County | PM10 Health Risk Assessment |
|---|
| Results 1 (TRa) CI (95%) | Results 2 (TRb) CI (95%) | Variance Ratio (%) |
|---|
| Core functional zone | Dongcheng | 1.2876 (1.1052, 1.5196) | 1.3012 (1.1094, 1.5482) | 1.0593 |
| Xicheng | 1.3157 (1.1139, 1.5789) | 1.3025 (1.1098, 1.5509) | 1.0025 |
| Expanding urban functional zone | Chaoyang | 1.2355 (1.0883, 1.4138) | 1.2351 (1.0882, 1.4131) | 0.0291 |
| Fengtai | 1.2351 (1.0882, 1.4130) | 1.2333 (1.0876, 1.4094) | 0.1451 |
| Shijingshan | 1.2254 (1.0850, 1.3940) | 1.2185 (1.0827, 1.3803) | 0.5707 |
| Haidian | 1.1962 (1.0751, 1.3374) | 1.1937 (1.0742, 1.3326) | 0.2104 |
| New urban development zone | Fangshan | 1.1754 (1.0679, 1.2982) | 1.1781 (1.0599, 1.2568) | 0.2273 |
| Tongzhou | 1.1469 (1.0577, 1.2457) | 1.1530 (1.0609, 1.2617) | 0.5301 |
| Shunyi | 1.1514 (1.0594, 1.2539) | 1.1557 (1.0631, 1.2731) | 0.3682 |
| Changping | 1.1694 (1.0658, 1.2870) | 1.1619 (1.0656, 1.2860) | 0.6436 |
| Daxing | 1.1657 (1.0644,1.2870) | 1.1689 (1.0616, 1.2653) | 0.2727 |
| Ecological conservation development zone | Mentougou | 1.1583 (1.0618, 1.2666) | 1.1576 (1.0688, 1.3032) | 0.0588 |
| Huairou | 1.1192 (1.0476, 1.1962) | 1.1205 (1.0481, 1.1986) | 0.1192 |
| Pinggu | 1.1248 (1.0496, 1.2061) | 1.1299 (1.0515, 1.2153) | 0.4590 |
| Miyun | 1.1429 (1.0563, 1.2385) | 1.1452 (1.0571, 1.2427) | 0.2026 |
| Yanqing | 1.1509 (1.0592, 1.2530) | 1.1481 (1.0581, 1.2478) | 0.2499 |
| Average value | 1.1875 | 1.1877 | 0.3843 |
3.4. PM10 Health Risk Regulation in Beijing
There is a certain relationship between UHI and NDVI, -which means the increase of NDVI may cause the temperature mitigation or UHI intensity reduction. Due to the fact that complex processes are involved in determining the cooling effect of vegetation on daytime air and surface temperature [
32], there is no authentic correlation of the two indicators obtained from recent studies.
Figure 5.
PM10 health risks based on the thermal environment in Beijing in March 2009.
Figure 5.
PM10 health risks based on the thermal environment in Beijing in March 2009.
There is also no accurate relationship between UHI intensity and NDWI. In this study, we assume that UHI, NDVI and NDWI indicators are relatively independent indicators to set three regulation scenarios:
Scenario 1: UHI regulation. To promote the urban atmospheric environment management, in this study, we decreased UHI indicator for the value of 0.1 and analyzed the variation of PM
10 health risk in Beijing in March 2009. Results showed that the core functional zone and expanding urban functional zone were found to have positive regulation effects, with average regulation effects of 0.0152 and 0.0069 (
Table 5). Additionally, after reducing UHI indicator of 0.1, the inhalable particulate matter health risk decreased by 1.52% and 0.69% in the two zones. Conversely, the new urban development zone and ecological conservation development zone regulation effects were negative, that was, and the reduction of UHI intensity value leads to the increase of PM
10 health risk.
From the health risk assessment results (
Table 5), it is claimed that the health risks in Core functional zone (average 1.3016) and Expanding urban functional zone (average 1.2230) are higher than the New urban development zone (average 1.1618) and Ecological conservation development zone (average 1.1392). Therefore, the UHI regulation could be more effective with higher health risks, whereas, the health risk regulation could be adverse with lower health risk in certain circumstances. It is illustrated that UHI regulation can be effective in relative high-risk areas while can be adverse in some low health risk regions.
Table 5.
Beijing PM10 health risk regulation results analysis (UHI-0.1).
Table 5.
Beijing PM10 health risk regulation results analysis (UHI-0.1).
| Function Zone | District/County | Assessment Results | Regulation Results | Regulation Effects |
|---|
| Core functional zone | Dongcheng | 1.2876 | 1.2858 | 0.0018 |
| Xicheng | 1.3157 | 1.2870 | 0.0286 |
| Average | 1.3016 | 1.2864 | 0.0152 |
| Expanding urban functional zone | Chaoyang | 1.2355 | 1.2311 | 0.0044 |
| Fengtai | 1.2351 | 1.2292 | 0.0058 |
| Shijingshan | 1.2254 | 1.2145 | 0.0109 |
| Haidian | 1.1962 | 1.1899 | 0.0063 |
| Average | 1.2230 | 1.2162 | 0.0069 |
| New urban development zone | Fangshan | 1.1754 | 1.1806 | −0.0051 |
| Tongzhou | 1.1469 | 1.1553 | −0.0084 |
| Shunyi | 1.1514 | 1.1580 | −0.0066 |
| Changping | 1.1694 | 1.1643 | 0.0051 |
| Daxing | 1.1657 | 1.1713 | −0.0056 |
| Average | 1.1618 | 1.1659 | −0.0041 |
| Ecological conservation development zone | Mentougou | 1.1583 | 1.1577 | 0.0006 |
| Huairou | 1.1192 | 1.1206 | −0.0014 |
| Pinggu | 1.1248 | 1.1300 | −0.0053 |
| Miyun | 1.1429 | 1.1453 | −0.0024 |
| Yanqing | 1.1509 | 1.1482 | 0.0028 |
| Average | 1.1392 | 1.1404 | −0.0012 |
Scenario 2: UHI and NDVI regulation. Based on
Scenario 1, we increased the NDVI indicator by 0.1 to figure out the variation of regulation effects.
Table 6 shows the regulation effects after the adjustment of UHI and NDVI in different functional zones.
It is obvious that Scenario 2 has better regulation effects than Scenario 1, and in expanding urban functional zone, new urban development zone and ecological conservation development zone, the health risks decline by 20.48%, 19.48% and 13.82% respectively, while the health risk is the consistent with Scenario1 in core functional zone.
Scenario 3: UHI, NDVI and NDWI regulation. In this scenario, we decreased UHI by 0.1 and increased NDVI and NDWI by 0.1 respectively to analyze the health risk in different districts or counties in Beijing. The calculation results compared with the health risk assessment results are listed in
Table 7. As the results illustrated, only in expanding urban functional zone there is a little improvement (0.0003) in regulation effects, while the other zones have the same results compared with Scenario 2 (
Table 7). The results may be due to the fact that the NDVI and NDWI show little correlation with the DVI indicator in core functional zone (Equation (3)). Therefore, the increase of NDVI and NDWI does not reduce the health risk of core functional zone obviously. Moreover, NDWI is directly correlated with DVI in expanding urban functional zone only, as a result of this, the regulation of NDWI influences little on the PM10 health risks in the other functional zones.
Table 6.
Beijing PM10 health risk regulation results analysis (UHI-0.1, NDVI + 0.1).
Table 6.
Beijing PM10 health risk regulation results analysis (UHI-0.1, NDVI + 0.1).
| Function Zone | District/County | Regulation Results | Regulation Effects |
|---|
| Core functional zone | Dongcheng | 1.2858 | 0.0018 |
| Xicheng | 1.2870 | 0.0286 |
| Average | 1.2864 | 0.0152 |
| Expanding urban functional zone | Chaoyang | 1.0290 | 0.2065 |
| Fengtai | 1.0276 | 0.2074 |
| Shijingshan | 1.0171 | 0.2084 |
| Haidian | 0.9993 | 0.1969 |
| Average | 1.0183 | 0.2048 |
| New urban development zone | Fangshan | 0.9772 | 0.1982 |
| Tongzhou | 0.9595 | 0.1874 |
| Shunyi | 0.9614 | 0.1900 |
| Changping | 0.9658 | 0.2036 |
| Daxing | 0.9707 | 0.1950 |
| Average | 0.9669 | 0.1948 |
| Ecological conservation development zone | Mentougou | 1.0146 | 0.1437 |
| Huairou | 0.9856 | 0.1336 |
| Pinggu | 0.9930 | 0.1318 |
| Miyun | 1.0049 | 0.1380 |
| Yanqing | 1.0071 | 0.1438 |
| Average | 1.0010 | 0.1382 |
Table 7.
Beijing PM10 health risk regulation results analysis (UHI-0.1, NDVI + 0.1, NDWI + 0.1).
Table 7.
Beijing PM10 health risk regulation results analysis (UHI-0.1, NDVI + 0.1, NDWI + 0.1).
| Function Zone | District/County | Regulation Results | Regulation Effects |
|---|
| Core functional zone | Dongcheng | 1.2858 | 0.0018 |
| Xicheng | 1.2870 | 0.0286 |
| Average | 1.2864 | 0.0152 |
| Expanding urban functional zone | Chaoyang | 1.0286 | 0.2068 |
| Fengtai | 1.0273 | 0.2077 |
| Shijingshan | 1.0167 | 0.2087 |
| Haidian | 0.9990 | 0.1972 |
| Average | 1.0179 | 0.2051 |
| New urban development zone | Fangshan | 0.9772 | 0.1982 |
| Tongzhou | 0.9595 | 0.1874 |
| Shunyi | 0.9614 | 0.1900 |
| Changping | 0.9658 | 0.2036 |
| Daxing | 0.9707 | 0.1950 |
| Average | 0.9669 | 0.1948 |
| Ecological conservation development zone | Mentougou | 1.0146 | 0.1437 |
| Huairou | 0.9856 | 0.1336 |
| Pinggu | 0.9930 | 0.1318 |
| Miyun | 1.0049 | 0.1380 |
| Yanqing | 1.0071 | 0.1438 |
| Average | 1.0010 | 0.1382 |
However, we must admit that the correlation equations show the main oriented correlation types, which means that NDVI and NDWI still influence the concentration of inhalable particulate matter in core functional zone. To achieve the goal of PM10 health risk mitigation of Beijing in March 2009, Scenario 2 and Scenario 3, which can control the UHI effect and improve the vegetation coverage in urban areas are very acceptable and effective, although for environmental management and control, Scenario 2 is more practicable than the other scenarios.


