1. Introduction
In April 2009, China had announced a health reform blueprint for achieving universal coverage by 2020 [
1]. The plan focuses on major structural change in five areas over the next three years: (a) Expanding the medical security system, (b) establishing the essential medicines system, (c) strengthening the capacity of primary care facilities, (d) reducing gaps in coverage of public health services, and (e) reforming the organization and financing mechanisms for public hospitals on a pilot basis. The 2009–2011 implementation plan is backed by an investment of 850 billion Yuan (124 billion USD) from the central and regional governments [
2]. To meet the overall design and working requirements for expanding health care system reform in China and to ensure that health care system reform will proceed in a planned and orderly manner, the Center for Health Statistics and Information (CHIS) has conducted an evaluation titled
Monitoring and Evaluation of China’s Health Care System Reform Project [
3]. Hubei Province and Shanghai Municipality were chosen as the first pilot areas for the research. The establishment of a scientific evidence-based monitoring and evaluation system is needed to answer a series of questions: How has Hubei Province’s health care system performed? Will China’s health care system reform efforts improve the health system sub-nationally? In what particular areas has Hubei performed well or poorly? Therefore, the health care system reform evaluation has three aims: managing the health investment, monitoring the reform process and providing evidence-based assessment of reform policies. In this study, we conducted a comprehensive evaluation of health care system reform in Hubei Province from 2009 to 2011 by establishing an indicator system for performance evaluation. Our assessment was then translated into a set of suggestions for health care system reform in Hubei Province.
Three evaluation frameworks for health care system reform have been described [
4]. The first is the “Control Knobs” method proposed by the World Bank and Harvard University in 2004, the second is the “Building Blocks” model proposed by WHO in 2006 [
5], and the third is the “Primary Health Care Evaluation Framework”. Many countries use their evaluation frameworks to monitor and evaluate health care system reform. Britain, for example, proposed the NHS Performance Assessment Framework in 1999 [
6]. The subject of the framework is an indicator system of the National Health System’s performance, which includes health service quality, efficiency and outcome. The framework highlights six domains, including health improvement, accessibility of health equity, effective utilization of the health service, efficiency, patient experience and health outcomes. In Mexico, the aim of the evaluation is to measure effective coverage [
7,
8]. Australia proposed a continuous evaluation framework, which mainly targets hospital performance. Indicators of the framework include medical quality, health outcomes, and clinical indicators, among others [
9]. The United States’ health policy experts proposed benchmarks to evaluate whether a country’s health system reform is successful [
10,
11]. The central premise is that disease and disability reduce the opportunities available to individuals and that the principle of equal opportunity provides a basis for regulating a health care system. The same theory can be extended to look beyond the point of delivery of health care to the social determinants of health.
Because health care system reform in China has its own characteristics, China’s Center for Health Statistics and Information (CHIS) invited experts from the WHO to design an evaluation framework for China. This evaluation framework refers to the international experience and the “Results Chain”. It provides a set of indicators, which focus on the evaluation of reform for 2009–2011. In addition, this system is proposed based on the practicalities of health care system reform in China. However, it is difficult to use the same indicator system in different provinces because China is such a large and heterogeneous nation. Therefore, we selected the indicators from this system and added other indicators in consideration of the local health development level in Hubei Province. We then weighted each indicator using scientific methods and comprehensively evaluated health care system reform in Hubei Province from 2009 to 2011.
2. Methods
2.1. Data Source
The data used in this study are derived from
Monitoring Progress Table on Recent Focus Work of the Health Care System Reform (
i.e., Health care system reform Monitoring Table),
Health Statistics Yearbook of Hubei Province [
12,
13,
14], and statistical information from departments related to health care system reform in Hubei Province from 2009 to 2011.
2.2. Establishment of Indicator System
The foundation of our study is
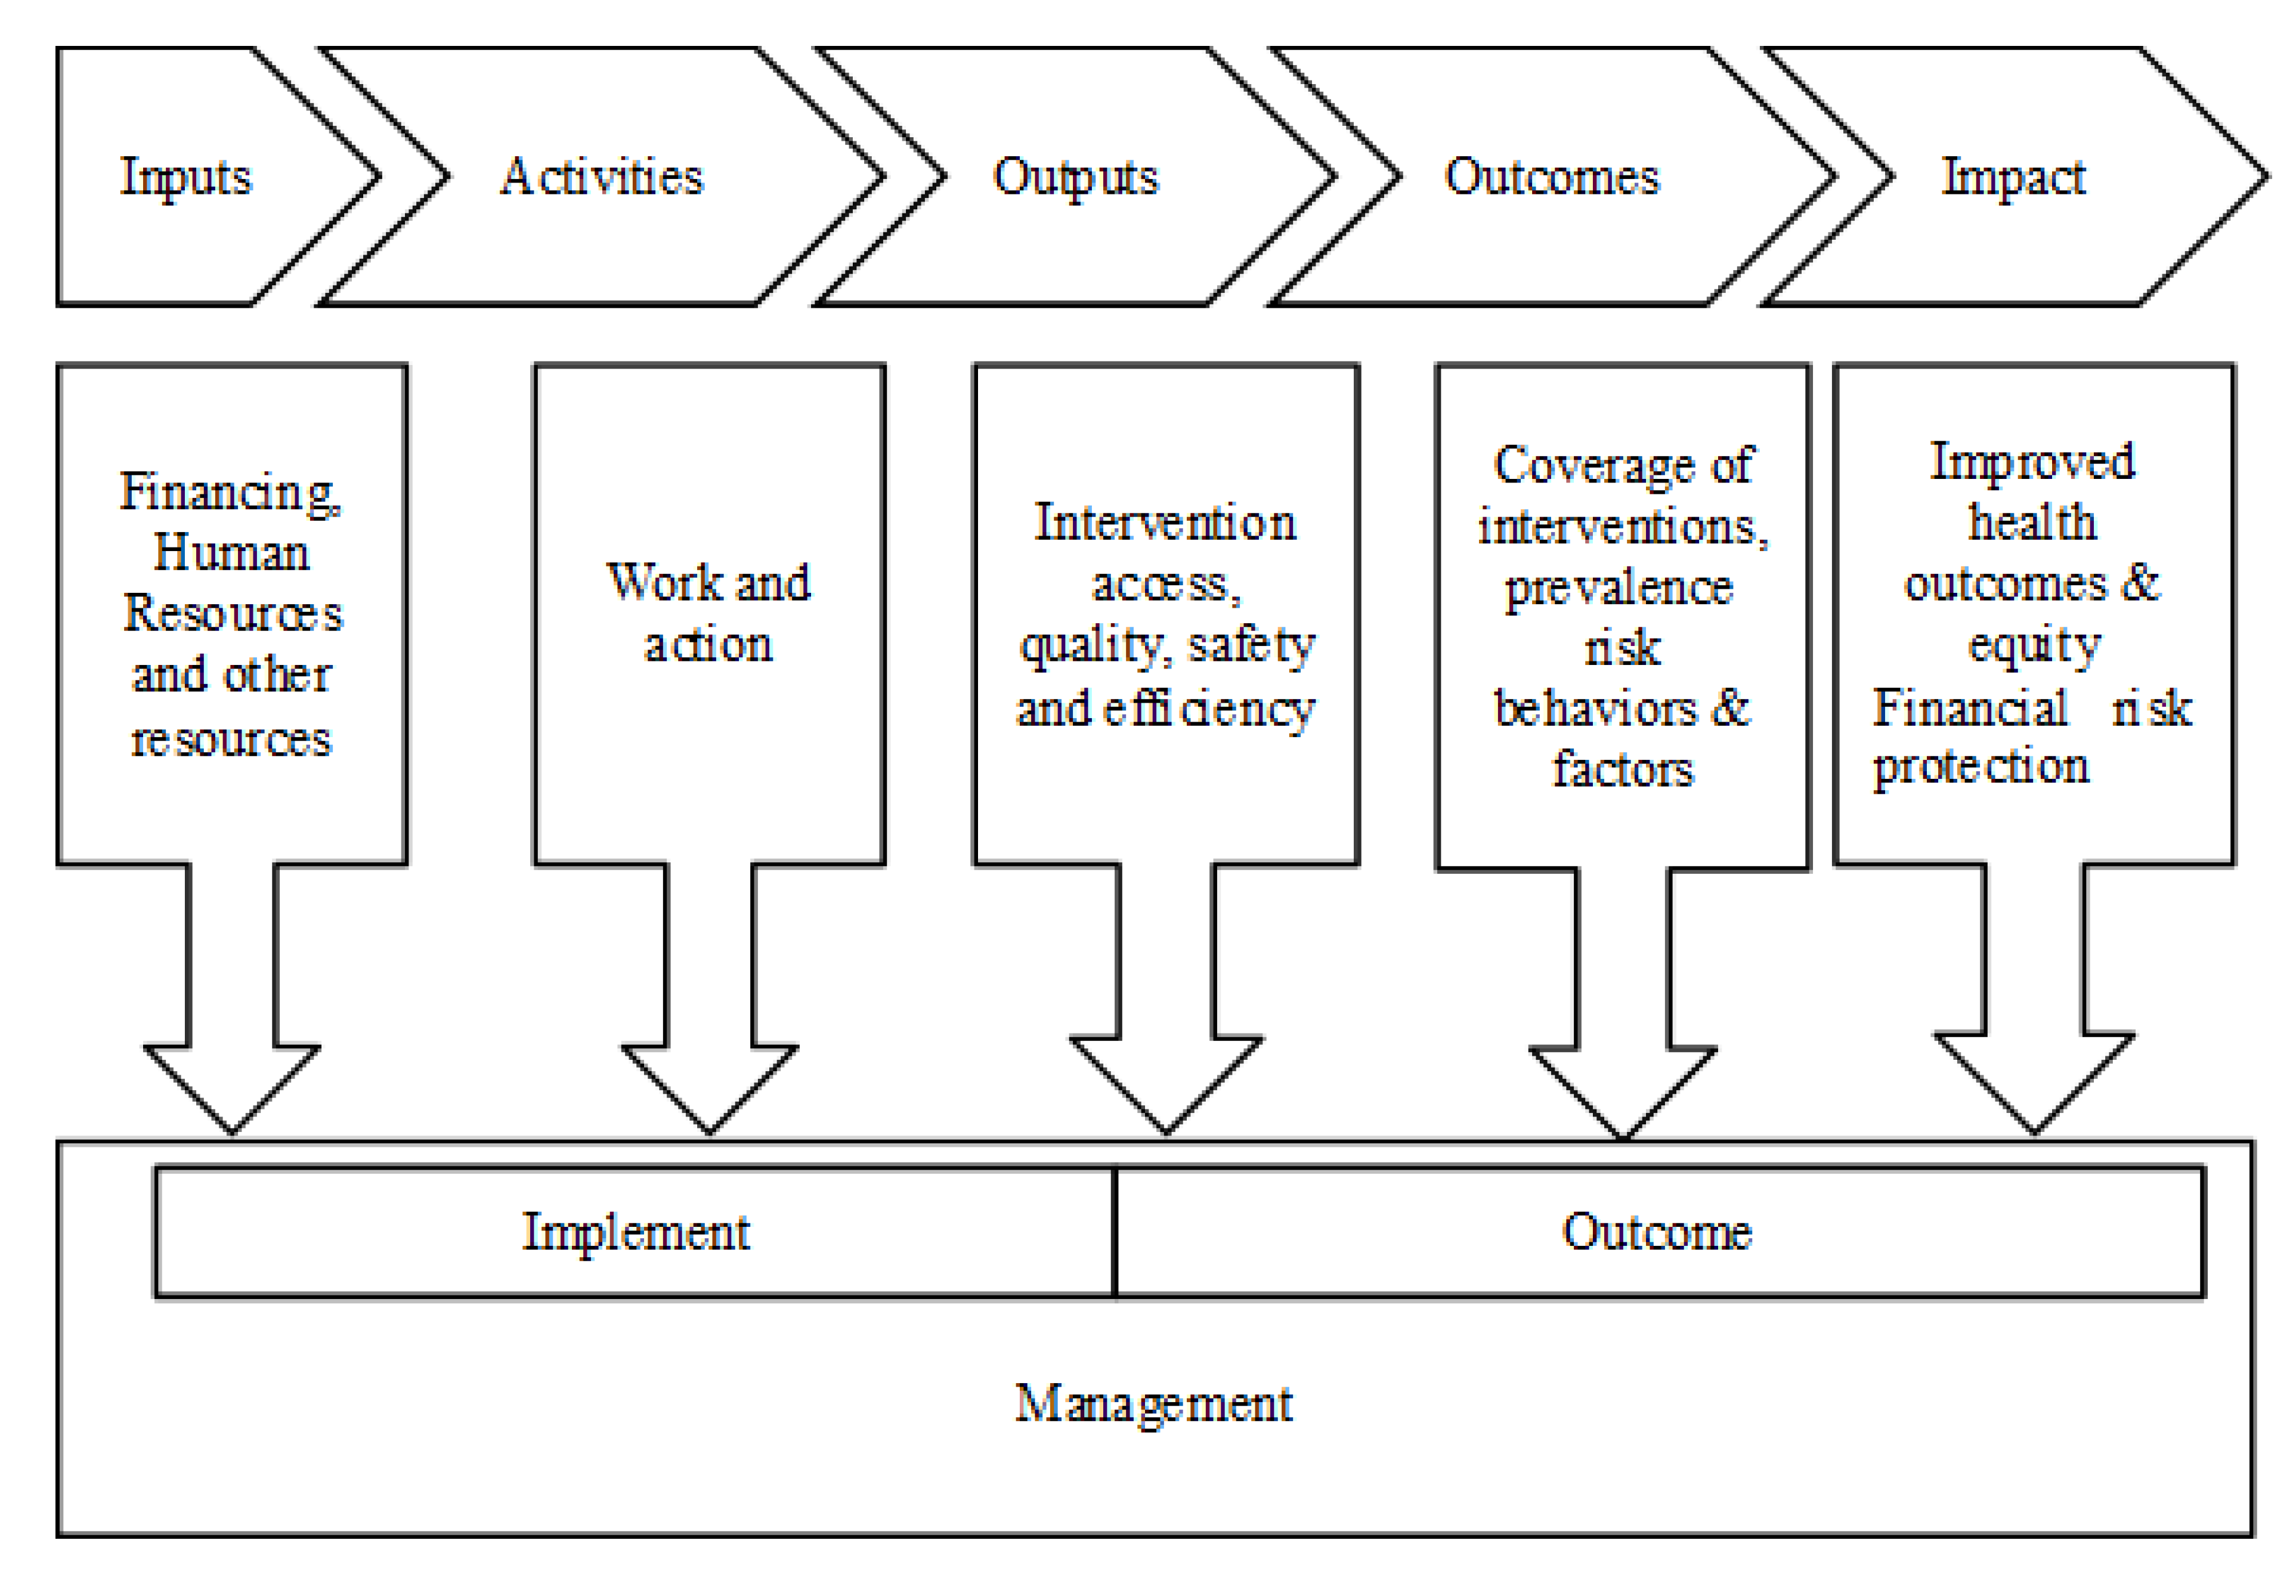
Monitoring and Evaluation Framework of China’s Health Care System Reform, which was proposed by the WHO and is based on the logical framework of a “Results Chain”. The “Results Chain” is results-oriented, with evaluation as a component of promoting intervention, strategy and policy (
Figure 1).
Figure 1.
Logical frame of Results Chain.
Figure 1.
Logical frame of Results Chain.
As we know, what all the evaluation frameworks described for health care system reform have in common is consensus that monitoring and evaluation must address performance in terms of both health system measures—availability, access, quality, efficiency, and population health measures—health status, responsiveness, user satisfaction, financial risk protection. Therefore, after referring to the international experience and the “Results Chain”, we developed the evaluation indicator system for Hubei Province based on four domains: Input and Process, Output, Outcome, and Impact. We screened the indicators based on importance, briefness, sensibility, availability and comparability.
2.3. Determination of the Weights
Satty’s Weighting Method of Analytic Hierarchical Process was used to determine the weights of indicators at different levels in the indicator system [
15]. The team establishing the weights was composed of 13 experts in the field of health reform and performance evaluation representing different universities, institutes and health departments such as the Health Care Center, Centers for Disease Control (CDC) and Health Information Statistics Center. The importance of the indicators was scored by the experts, assessment targets were resolved, and evaluation indicators at different levels were then obtained [
16]. Four major steps were used to compute the weights:
1. The sum of each column is calculated using the pair-wise comparison matrix. In our study, we use “The 9-point scale for comparative judgments” suggested by Satty(1980) to transform the verbal judgments into numerical quantities [
17].
2. The initial weights are calculated by Equation (1):
where
W'j is the
jth indicator’s initial weight,
j = 1,2∙∙∙
m,
m represents the number of the indicators, and
aj1,
aj2∙∙∙
ajm represents the elements of the
jth line in the judgment matrix.
3. Equation (2) is used to calculate the normalized weight coefficient to obtain the weight of each indicator:
4. Paired comparison consistency is assessed to test the logic of the weights. The consistency ratio (
CR) is determined by Equation (3):
where
λmax is the maximum eigenvalue, m represents the number of the indicators, and RI is a random index; when m is equal to 3 and 8, RI is 0.58 and 1.41, respectively. The Consistency Ratio should be less than 0.1; otherwise, the decision should be revised [
18].
The final weight of each indicator is calculated by multiplying the weights of the level 1, 2 and 3 evaluation indicators.
2.4. Synthesized Evaluation Methods
The TOPSIS method and Weighted Rank-Sum Ratio (WRSR) were used to evaluate health care system reform performance in this study. The TOPSIS method eliminates the influence of different indicator dimensions by using the same trending method and the normalization method to process the original data from the evaluation indicators to determine the best and worst solutions in finite schemes in the data matrix based on normalization. The relative similar degree
Ci between the evaluation object and the best solution is calculated by the Equation (4):
where
i = 1,2…
n,
n is the number of the evaluation objects,
di+ is the distance between an evaluation object’s value and the positive ideal solution, and
di- is the distance between an evaluation object’s value and the negative ideal solution. A larger
Ci value indicates better comprehensive benefits and higher evaluation [
19].
The basic idea of the Weighted Rank Sum Ratio (WRSR) method is to convert the original data matrix by rank transformation and then to calculate the ratio of each appraisal object rank to its ideal maximum rank by the Equation (5):
where
Rij is the rank of the element in the
ith line of the
jth column,
i = 1,2∙∙∙
n,
j = 1,2∙∙∙
m. Equation (5) is used to perform the weighted calculation to perform the Weighted Rank Sum Ratio (WRSR), where
Wj is the weight of the
jth indicator:
A larger
WRSRi value indicates better comprehensive benefits and performance [
20].
2.5. Sensitivity Analysis of the Weights
If
W'j is the
jth indicator’s initial weight,
![Ijerph 11 02262 i006]()
, then we can calculate the marginal weight coefficient [
21]
W'r and
W's by using the Equations (7) and (8):
3. Results
3.1. Screening Results of Evaluation Indicator
The indicator system of the health care system reform evaluation is composed of four parts: Inputs and Process, Outputs, Outcomes, and Impact. The final evaluation indicator system and weights are shown in
Table 1,
Table 2,
Table 3 and
Table 4. There are 20 indicators in the “Input and Process” domain, which mainly reflects conditions of the policy and management of health care system reform, health financing, infrastructure, health human resources, service system, and information of health care system reform. There are 30 indicators in the “Outputs” domain, which mainly reflect conditions of accessibility, quality, safety and efficiency of interventions. There are nine indicators in the “Outcomes” domain, which mainly reflect coverage of interventions and changes in people’s health behavior. Finally there are 12 indicators in the “Impact” domain, which mainly reflect the long-term effects and influences of health care system reform activities.
3.3. Sensitivity Analysis of the Weights
Table 7 shows the marginal weight coefficient of
M1, the first indicator of the system. Every marginal weight coefficient is larger than 1, which means the marginal weight is not in the allowable range. We then calculated the marginal weight coefficient of the other indicators, and no marginal weight coefficient fell within the allowable range. Therefore, we can say that the weight of each indicator is insensitive [
22].
Table 1.
Indicator system for healthcare.
Table 1.
Indicator system for healthcare.
| Grade-1 Indicators (Weight) | Grade-2 Indicators (Weight) | Grade-3 Indicators (Weight) | Synthetic Weight |
|---|
| Input and process (0.2) | Health resource (0.30) | Total health expenditure(TEH) (0.22) | 0.0132 |
| % of TEH in GDP (0.14) | 0.0084 |
| Total medical institutes (0.08) | 0.0048 |
| Medical institutes per thousand people (0.10) | 0.0060 |
| Total medical beds(0.07) | 0.0042 |
| Medical beds per thousand people (0.09) | 0.0054 |
| Total health personnel (0.08) | 0.0048 |
| Health personnel per thousand people (0.09) | 0.0054 |
| Certified doctor per thousand people (0.07) | 0.0042 |
| Registered nurse per thousand people (0.06) | 0.0036 |
| Total investment in reform (0.15) | Government special grants (1.00) | 0.0300 |
| Basic medical insurance (0.15) | Government special grants (0.50) | 0.0150 |
| government subsidies for basic medical insurance (0.50) | 0.0150 |
| Essential medicines (0.10) | Government special grants (0.50) | 0.0100 |
| Coverage of essential medicines (0.50) | 0.0100 |
| Basic medical health service system (0.10) | Government special grants (0.50) | 0.0100 |
| Training basic level sanitary personnel (0.50) | 0.0100 |
| Basic public health services (0.10) | Government special grants (0.50) | 0.0100 |
| per capital public health expenditures (0.50) | 0.0100 |
| Public hospital reform (0.10) | Government special grants (1.00) | 0.0200 |
| Output (0.35) | Improve health service accessibility (0.35) | The average outpatient expenditure(0.18) | 0.0221 |
| The average hospitalizing expenditure (0.18) | 0.0221 |
| % of average medicine fee in outpatient expenditure (0.19) | 0.0233 |
| % of average medicine fee in inpatient expenditure (0.19) | 0.0233 |
Table 2.
Indicator system for healthcare (continued).
Table 2.
Indicator system for healthcare (continued).
| Grade-1 Indicators (Weight) | Grade-2 Indicators (Weight) | Grade-3 Indicators (Weight) | Synthetic Weight |
|---|
| Output (0.35) | Improve health service accessibility (0.35) | Number of village clinics (0.08) | 0.0098 |
| Number of township health centers (0.09) | 0.0110 |
| Number of community health service centers(stations) (0.09) | 0.0110 |
| Improve the equity of the health service (0.20) | % of government health expenditures in THE (0.07) | 0.0050 |
| % of social health expenditures in THE (0.07) | 0.0050 |
| % of out-of-pocket payments in THE (0.07) | 0.0050 |
| Number of hospital outpatient visits (0.05) | 0.0036 |
| Number of Basic medical institutions outpatient visits (0.05) | 0.0036 |
| Number of village clinics outpatient visits (0.05) | 0.0036 |
| Number of professional public health agency outpatient visits (0.05) | 0.0036 |
| Rate of establishing individual health profiles in urban residents (0.06) | 0.0040 |
| Rate of establishing individual health profiles in rural residents (0.06) | 0.0040 |
| Number of patients with hypertension management (0.07) | 0.0046 |
| Number of patients with diabetes mellitus (0.07) | 0.0046 |
| Number of individuals aged< 15 years is a catch-up program for hepatitis B vaccinations (0.07) | 0.0046 |
| Number of rural women undergoing cervical cancer screening (0.06) | 0.0043 |
| Number of rural women undergoing breast cancer screening (0.06) | 0.0043 |
| Number of rural women of childbearing age who take folate daily (0.06) | 0.0043 |
| Number of impoverished patients who accept free cataract surgeries (0.05) | 0.0032 |
| Coverage of health toilet (0.04) | 0.0027 |
Table 3.
Indicator system for healthcare (continued).
Table 3.
Indicator system for healthcare (continued).
| Grade-1 Indicators (Weight) | Grade-2 Indicators (Weight) | Grade-3 Indicators (Weight) | Synthetic Weight |
|---|
| Output (0.35) | Improve the quality of the health service (0.25) | Consistent rate of diagnoses between patients and inpatients (0.19) | 0.0166 |
| Consist rate of diagnosis before and after operation (0.19) | 0.0166 |
| Consistent rate of agreement between clinical and pathological diagnoses (0.19) | 0.0166 |
| Rate of correct diagnosis within 3 days (0.19) | 0.0166 |
| Nosocomial infection rates (0.24) | 0.0210 |
| Increase the efficiency of the health service (0.20) | Total number of outpatient visits (0.15) | 0.0105 |
| Total number of inpatients (0.15) | 0.0105 |
| Average number of patients per day per doctor (0.18) | 0.0126 |
| Average inpatients per day per doctor (0.18) | 0.0126 |
| Average length of stay (0.18) | 0.0126 |
| Bed occupancy rate (0.16) | 0.0112 |
| Outcome (0.25) | Coverage of intervention (0.60) | Rate of prenatal care (0.16) | 0.0240 |
| Rate of postnatal care (0.16) | 0.0240 |
| Rate of hospital delivery (0.17) | 0.0255 |
| Systematic management rate for pregnant women (0.17) | 0.0255 |
| Rate of systematic management of children <3 years of age (0.17) | 0.0255 |
| Rate of systematic management of children <7 yeas of age (0.17)management rate (0.17) | 0.0255 |
| Risk factors (0.40) | Incidence of pulmonary tuberculosis (0.33) | 0.0330 |
| Incidence of viral hepatitis (0.31) | 0.0310 |
| Incidence of AIDS (0.36) | 0.0360 |
| Impact (0.20) | Health status (0.40) | Infant mortality rate (0.26) | 0.0208 |
| Mortality rate of children under 5 (0.26) | 0.0208 |
| Maternal mortality rate (0.26) | 0.0208 |
| Life expectancy (0.22) | 0.0176 |
Table 4.
Indicator system for health care (continued).
Table 4.
Indicator system for health care (continued).
| Grade-1 Indicators (Weight) | Grade-2 Indicators (Weight) | Grade-3 Indicators (Weight) | Synthetic Weight |
|---|
| Impact (0.20) | Economic risk- sharing (0.30) | Number of urban employees with basic health insurance (0.11) | 0.0063 |
| Coverage of urban employees with basic health insurance (0.23) | 0.0135 |
| Number of urban residents with basic health insurance (0.11) | 0.0064 |
| Coverage of urban employees with basic health insurance (0.23) | 0.0136 |
| Number of new rural cooperative medical systems (NCMS) (0.11) | 0.0065 |
| Coverage of new rural cooperative medical systems (0.23) | 0.0137 |
| Social satisfaction (0.30) | Outpatient service satisfaction (0.50) | 0.0300 |
| Inpatient service satisfaction (0.50) | 0.0300 |
Table 5.
Rankings for performanceevaluation of healthcare reform in Hubei Province 2009–2011.
Table 5.
Rankings for performanceevaluation of healthcare reform in Hubei Province 2009–2011.
| Year | Input and Process | Output | Outcome | Impact |
|---|
| TOPSIS | WRSR | TOPSIS | WRSR | TOPSIS | WRSR | TOPSIS | WRSR |
|---|
| | Ci |
Rank
| WRSR |
Rank
| Ci |
Rank
| WRSR |
Rank
| Ci |
Rank
| WRSR |
Rank
| Ci |
Rank
| WRSR |
Rank
|
|---|
| 2009 | 0.573 | 3 | 0.538 | 3 | 0.327 | 3 | 0.352 | 3 | 0.388 | 3 | 0.453 | 3 | 0.609 | 3 | 0.537 | 3 |
| 2010 | 0.724 | 2 | 0.584 | 2 | 0.359 | 2 | 0.379 | 2 | 0.568 | 1 | 0.562 | 1 | 0.617 | 2 | 0.590 | 2 |
| 2011 | 0.786 | 1 | 0.669 | 1 | 0.361 | 1 | 0.401 | 1 | 0.543 | 2 | 0.508 | 2 | 0.676 | 1 | 0.528 | 1 |
Table 6.
Rankings for comprehensive performanceevaluation of healthcare reform in Hubei Province 2009–2011.
Table 6.
Rankings for comprehensive performanceevaluation of healthcare reform in Hubei Province 2009–2011.
| Year | TOPSIS | WRSR |
|---|
| Ci | Rank | WRSR | Rank |
|---|
| 2009 | 0.658 | 3 | 0.623 | 3 |
| 2010 | 0.737 | 2 | 0.658 | 2 |
| 2011 | 0.781 | 1 | 0.689 | 1 |
Table 7.
Marginal weight coefficients of M1.
Table 7.
Marginal weight coefficients of M1.
| Indicators | Marginal weight coefficient |
|---|
| M1, M2 | ![Ijerph 11 02262 i009]() =2.250, =2.250, ![Ijerph 11 02262 i009]() = 3.717 = 3.717 |
| M1, M3 | ![Ijerph 11 02262 i009]() =2.232, =2.232, ![Ijerph 11 02262 i009]() = 2.392 = 2.392 |
| M1, M4 | ![Ijerph 11 02262 i009]() =2.258, =2.258, ![Ijerph 11 02262 i009]() =3.251 =3.251 |
| M1, M5 | ![Ijerph 11 02262 i009]() =1.297, =1.297, ![Ijerph 11 02262 i009]() =3.291 =3.291 |
| M1, M6 | ![Ijerph 11 02262 i009]() =1.084, =1.084, ![Ijerph 11 02262 i009]() =5.345 =5.345 |
| M1, M7 | ![Ijerph 11 02262 i009]() =2.141, =2.141, ![Ijerph 11 02262 i009]() =2.518 =2.518 |
| M1, M8 | ![Ijerph 11 02262 i009]() =2.172, =2.172, ![Ijerph 11 02262 i009]() =4.490 =4.490 |
| M1, M9 | ![Ijerph 11 02262 i009]() =2.230, =2.230, ![Ijerph 11 02262 i009]() =3.987 =3.987 |
4. Discussion
4.1. Evaluation Methods and Evaluation Results
This study utilized two comprehensive evaluation methods. While the TOPSIS method is more precise, the Weighted Rank-Sum Ratio method can be used as a comprehensive index specialized for statistical analysis that does not introduce subjective variables; thus, it avoids the deficits of the subjective weighting method and demonstrated strong comprehensive ability [
23]. Relatively stable evaluation results can be obtained when these two methods are used together.
Based on our results, we conclude that performance in the Input and Process, Output and Impact domains increased yearly from 2009 to 2011 in Hubei Province. The Input and Process domain was more efficient than the others, and the values of Ci and WRSR were the highest. This finding indicates that health care system reform led to better results with regard to health input and health resource allocation. However, increasing performance was not observed in the Output domain, and the values of Ci and WRSR were lower. The Output domain covers improvements in accessibility, equity, quality and efficiency of health care services. In this study, we used indicators such as Average Number of Outpatients/Inpatient Expenditures, Percentage of Revenues Allocated to Outpatient/Inpatient Medications to measure accessibility. These indicators were improved and accessibility was enhanced in 2011. However, health expenditures were still high and the level of health accessibility in Hubei Province was still lower than the world average. Additionally, the composition of Total Health Expenditure (THE) was unreasonable, as the proportion of Out-of-Pocket Payment was still higher than government (or social) health expenditures. This disparity adversely affected Output performance. It is worth noting that the performance in the Outcome domain increased and reached its peak in 2010 and decreased during the next year (2011), possibly because the incidences of some communicable diseases (e.g., pulmonary tuberculosis and AIDS) were increasing in 2011, which required more work in communicable disease control. In general, the performance of health care system reform in Hubei Province increased from 2009 to 2011, and health care system reform has played an active role in the health care system in Hubei Province.
5. Conclusions
In order to evaluate the health care system reform in Hubei Province, our study established a set of indicators including four grade-1 indicators, 16 grade-2 indicators and 76 grade-3 indicators. The effects of the reforms increased year by year from 2009 to 2011 in Hubei Province. The health status of urban and rural populations and the accessibility, equity and quality of health services in Hubei Province were improved after the reforms.
6. Research Prospects
Our research has several limitations that need to be considered when interpreting the findings and that could be addressed in the future. Our results should be considered an example of what could and should be done if more data were available.
First, the indicator system needs to be adjusted in the future. The new health care system reform began in 2009. Although many studies in the literature were examined when establishing the indicator system and screening indicators, the indicator system is still imperfect because the reform was still new, data collection was limited, and some data (e.g., evaluation of the public hospital reform performance need to be set up special studies) could only evaluated qualitatively rather quantitatively. With further development of the reform and the accumulation of experience, the indicator system will need to be continuously adjusted. In future health care system evaluation studies, the weights of the indicators could be determined using other objective weighting methods so that the entire indicator system can reflect reform performance more scientifically and effectively, based on actual conditions and existing data.
Furthermore, in terms of improving data collection, as the evaluation data are derived from different projects, such as the Direct Reporting Network System, National Health Account Project, Human Resources and Social Security Department, it will be important to emphasize cooperation between different departments, use the same standards, and strengthen the system of health information for improving work efficiency and ensuring data quality.
In the end, health care system reform evaluation is significant in that it is a means rather than an end. The ultimate aim of evaluation is to uncover the achievements in and problems of health care system reform, constantly summarize experiences and address disadvantages, so that efforts can be made to promote health care system reform and development of the health system. Therefore, health care system reform evaluation should be a long-term and sustainable process with the goal of offering guidance for health care system reform and health policy in Hubei Province and in China as a whole.
Acknowledgments
This work is supported by the Ministry of Health of the People’s Republic of China. The authors would like to thank the Health Statistics Center of Hubei Province for data preparation.
Author Contributions
Shuping Sang and Chuanhua Yu conceived the project and collected data, Shuping Sang and Zhenkun Wang analysed data. All authors were involved in writing the paper and had final approval of the submitted and published versions.
Conflicts of Interest
The authors declare no conflict of interest.
References
- Opinions of the CPC Central Committee and the State Council on Deepening the Health Care System Reform. Available online: http://www.ndrc.gov.cn/shfz/yywstzgg/ygzc/t20090408_359822.htm (accessed on 1 September 2013).
- Implementation Plan for the Recent Priorities of the Health Care System Reform (2009–2011). Available online: http://shs.ndrc.gov.cn/ygzc/t20090408_359216.htm (accessed on 1 September 2013).
- World Health Organization (WHO). Monitoring and Evaluation of China’s Health System Reform: Global Perspective on A Comprehensive Framework; WHO: Geneva, Switzerland, 2009. [Google Scholar]
- Hu, S.L. Recommendations on Health system reform monitoring and evaluation framework in China from international organizations. Chin. J. Health Policy 2010, 3, 4–6. [Google Scholar]
- Roberts, M.; Hsiao, W.; Berman, P.; Reich, M. Getting Heath Reform Right: A Guide to Improving Performance and Equity; Oxford University Press: New York, NY, USA, 2004. [Google Scholar]
- The NHS Performance Assessment Framework. Available online: http://webarchive.nationalarchives.gov.uk/20130107105354/http://www.dh.gov.uk/prod_consum_dh/groups/dh_digitalassets/@dh/@en/documents/digitalasset/dh_4057184.pdf (accessed on 1 September 2013).
- Lozano, R.; Soliz, P.; Gakidou, E.; Abbott-Klafter, J.; Feehan, M.D.; Vidal, C.; Ortiz, P.J.; Murray, J.L.C. Benchmarking of performance of Mexican States with effective coverage. Lancet 2006, 368, 1729–1741. [Google Scholar] [CrossRef]
- He, J.W. The methodological strategy for National Health Policy evaluation: The case of policy evaluation of Mexico’s Seguro popular de Salud. Chin. Public. Admin. Rev. 2009, 8, 161–170. [Google Scholar]
- National Health Ministers’ Benchmarking Working Group. First National Report on Health Sector Performance Indicators: Public Hospitals—The State of the Play; Australian Institute of Health and Welfare: Canberra, Australia, 1996.
- Daniels, N.; Bryant, J.; Castano, R.A.; Dantes, O.G.; Khan, K.S.; Pannarunothai, S. Benchmarks of fairness for healthcare reform: A policy tool for developing countries. Bull. World Health Org. 2000, 78, 740–750. [Google Scholar]
- Daniels, N.; Kennedy, B.; Kawachi, I. Why justice is good for our health: The social determinants of health inequalities. Daedalus 1999, 128, 215–252. [Google Scholar]
- Health Bureau of Hubei Province. Hubei Health Statistics 2009; Printing House of Statistics Bureau of Hubei Province: Wuhan, China, 2010. [Google Scholar]
- Health Bureau of Hubei Province. Hubei Health Statistics 2010; Printing House of Statistics Bureau of Hubei Province: Wuhan, China, 2011. [Google Scholar]
- Health Bureau of Hubei Province. Hubei Health Statistics 2011; Printing House of Statistics Bureau of Hubei Province: Wuhan, China, 2012. [Google Scholar]
- Dolan, J.G. Shared decision-making-transferring research into practice: The Analytic Hierarchy Process (AHP). Patient Educ. Couns. 2008, 73, 418–425. [Google Scholar] [CrossRef]
- Sun, Z.Q.; Wang, L. Medical Synthetic Evaluation and Its Application, 1st ed.; Chemical Industry Press: Beijing, China, 2006; pp. 14–16. [Google Scholar]
- Wind, Y.; Saaty, T.L. Marketing application of the Analytic Hierarchy Process. Manag. Sci. 1980, 26, 641–658. [Google Scholar] [CrossRef]
- Carlsson, C.; Walden, P. AHP in political group decisions: A study in the art of possibilities. Interfaces 1995, 25, 14–29. [Google Scholar] [CrossRef]
- Wang, Y.R.; Sun, Z.Q.; Huang, Z.N. Topsis method analysis by using SAS software. Chin. J. Health. Stat. 2003, 20, 119–121. [Google Scholar]
- Wang, Y.R.; Sun, Z.Q. Review of medical synthetic evaluation research. J. Cent. S. Uni. 2005, 30, 228–232. [Google Scholar]
- Zhong, H.R.; Gu, X.P. Assessment of power system black-start schemes based on fuzzy analytic hierarchy process and its sensitivity analysis. Automat. Electr. Pow. Syst. 2010, 16, 34–49. [Google Scholar]
- Xu, J.P.; Wu, W. Multiple Attribute Decision Making Theory and Methods; Tsinghua University Press: Beijing, China, 2006. [Google Scholar]
- Jia, P.; Li, X.B.; Wang, J.X. Comparison of several kinds of typical comprehensive evaluation methods. Chin. J. Hosp. Stat. 2008, 15, 351–353. [Google Scholar]
- Alma Ata Declaration. Available online: http://who.int/topics/primary_health_care/alma_ata_declaration/zh/ (accessed on 18 December 2013).
- Ge, Y.; Sen, G. China’s Health System Reform: Issue, Root, Way Out; China Development Press: Beijing, China, 2007. [Google Scholar]
- Wang, Y.P.; Zhou, X.S. Progress, outlook and implications of U.S. health care system reform. Chin. J. Health. Policy 2013, 6, 38–44. [Google Scholar]
- Li, L.; Xu, Y.; Chen, Q.L. An integrated healthcare system: The strategic choice of Chinese Healthcare Reform. Chin. J. Health Policy 2012, 5, 10–16. [Google Scholar]
© 2014 by the authors; licensee MDPI, Basel, Switzerland. This article is an open access article distributed under the terms and conditions of the Creative Commons Attribution license (http://creativecommons.org/licenses/by/3.0/).


 , then we can calculate the marginal weight coefficient [21] W'r and W's by using the Equations (7) and (8):


 =2.250,