Article

Level and Contamination Assessment of Environmentally Sensitive Elements in Smaller than 100 μm Street Dust Particles from Xining, China

School of Tourism and Environment, Shaanxi Normal University, Xi'an 710062, China
*
Author to whom correspondence should be addressed.
Int. J. Environ. Res. Public Health 2014, 11(3), 2536-2549; https://doi.org/10.3390/ijerph110302536
Submission received: 29 November 2013 / Revised: 20 January 2014 / Accepted: 28 January 2014 / Published: 28 February 2014

Abstract

:
Concentrations of the environmentally sensitive elements (ESEs) As, Co, Cu, Mn, Ni, Pb, V and Zn in smaller than 100 μm street dust particles from Xining were measured using X-ray fluorescence spectrometry and their contamination levels were assessed based on enrichment factor (EF), geoaccumulation index (Igeo) and pollution load index (PLI). The concentrations of As, Co, Cu, Mn, Ni, Pb, V and Zn in smaller than 100 μm street dust particles from Xining are 0.1–0.8, 2.7–10.9, 0.7–5.2, 0.3–1.1, 0.6–2.5, 1.2–11.1, 0.7–1.3 and 0.4–2.9 times the background values of Qinghai soil, respectively. The calculated EF and Igeo values reveal the order Co > Pb > Cu > Zn > V > Ni > Mn > As. The EF and Igeo values of Co, Cu, Pb and Zn are higher indicating that there is considerable pollution by these elements in smaller than 100 μm street dust particles, especially for Co. The EF and Igeo of Mn, Ni and V are lower and the assessment results indicate an absence of distinct Mn, Ni and V pollution in the studied samples. The mean value of PLIsite is 1.14, indicating a slightly pollution in the whole city of Xining. The order of PLIarea for the five tested districts is Center District (CD) > East District (ED) > West District (WD) > North District (ND) > South District (SD), showing that ESEs pollution in the South District is the lightest while it is the highest in the Central District.

1. Introduction

At present, nearly half of the world’s population lives in urban agglomerations [1], and the dense population leads to an increasing amount of pollutants being discharged into the urban environment. Streets, an essential component of the urban landscape, are conspicuous sources of dissolved and sediment-associated contaminants [2,3,4]. Street dust, particles deposited on roads, is an important medium hosting environmental pollutants in urban environments [5,6], and can easily accumulate in the human body via directly inhalation, ingestion and dermal contact absorption [7,8,9,10]. Dust particles can migrate via saltation (diameters > 500 μm), creep (100 μm < diameters < 500 μm), suspension and re-suspension (diameters < 100 μm) [11]. The re-suspension of street dust has proven to be an important contributor to atmospheric particulate matter in urban areas [12,13], and these polluted particles are easily deposited with a greater dry and wet deposition scope after being spread broadly [14].
Contaminants in street dust include inorganic toxic metals, de-icing salts, and organic compounds such as polycyclic aromatic hydrocarbons (PAHs), polychlorinated biphenyls (PCBs), and pesticides [15]. The concentration of toxic metals in street dust has proven to be extremely variable [16]. These toxic metals such as As, Co, Cu, Mn, Ni, Pb, V and Zn are also collectively called environmentally sensitive elements (ESEs) [17]. In urban areas, street dust, which serves as both a sink and source for ESEs [18,19,20], is emitted from mobile or stationary sources [7,21,22,23,24,25], such as vehicle wear, industrial activities, domestic heating, activities of construction and demolition, degradation of road paint and waste incineration. The ESEs in street dust may harm the urban environment and endanger the ecosystem’s health.
In recent decades many studies on street dust have focused on the concentration, distribution and source identification of ESEs [8,22,26,27,28,29]. Environmental quality and potential health risk assessment methods have been applied to explore the potential harm caused by ESEs from street dust [30,31]. Contamination levels of ESEs in street dust from different cities or different functional areas of city have also been compared [5,28,32]. The dispersion and distribution of ESEs are highly dependent on the size of particles and the surface properties of the substrate on which ESEs are deposited [33]. ESEs are preferentially presented in finer particles [18,34], due to their lower density and greater surface area [34]. ESEs in the finer fraction could have greater effects on human health due to the fact they remain for a longer time in air, adhere to the skin and are inhaled through the nose or mouth more easily [30]. Fine street dust particulates are not always removed efficiently through street sweeping, which as a basic contaminant control measure [35]. For example, only 50% of all fractions of road deposited sediments could be removed by sweeping and the removal rate for dust particles of diameter <104 μm is only 15%–20% [36,37].
Former studies focused on ESEs in street dust with diameters ranging from 0.1 to 2,000 μm with most being higher than 100 μm [24,25,38,39,40,41,42,43]. However, the research about contamination level of ESEs in smaller than 100 μm street dust particles is lacking, especially in the northwest cities of China. The particles smaller than 100 μm in street dust have a greater impact on the environment and human health. The objectives of the present work were thus to determine the concentration levels of the ESEs As, Co, Cu, Mn, Ni, Pb, V and Zn in smaller than 100 μm street dust particles from Xining, China and to assess their contamination level. The results could be useful for regulators and engineers involved in environmental protection and management.

2. Materials and Methods
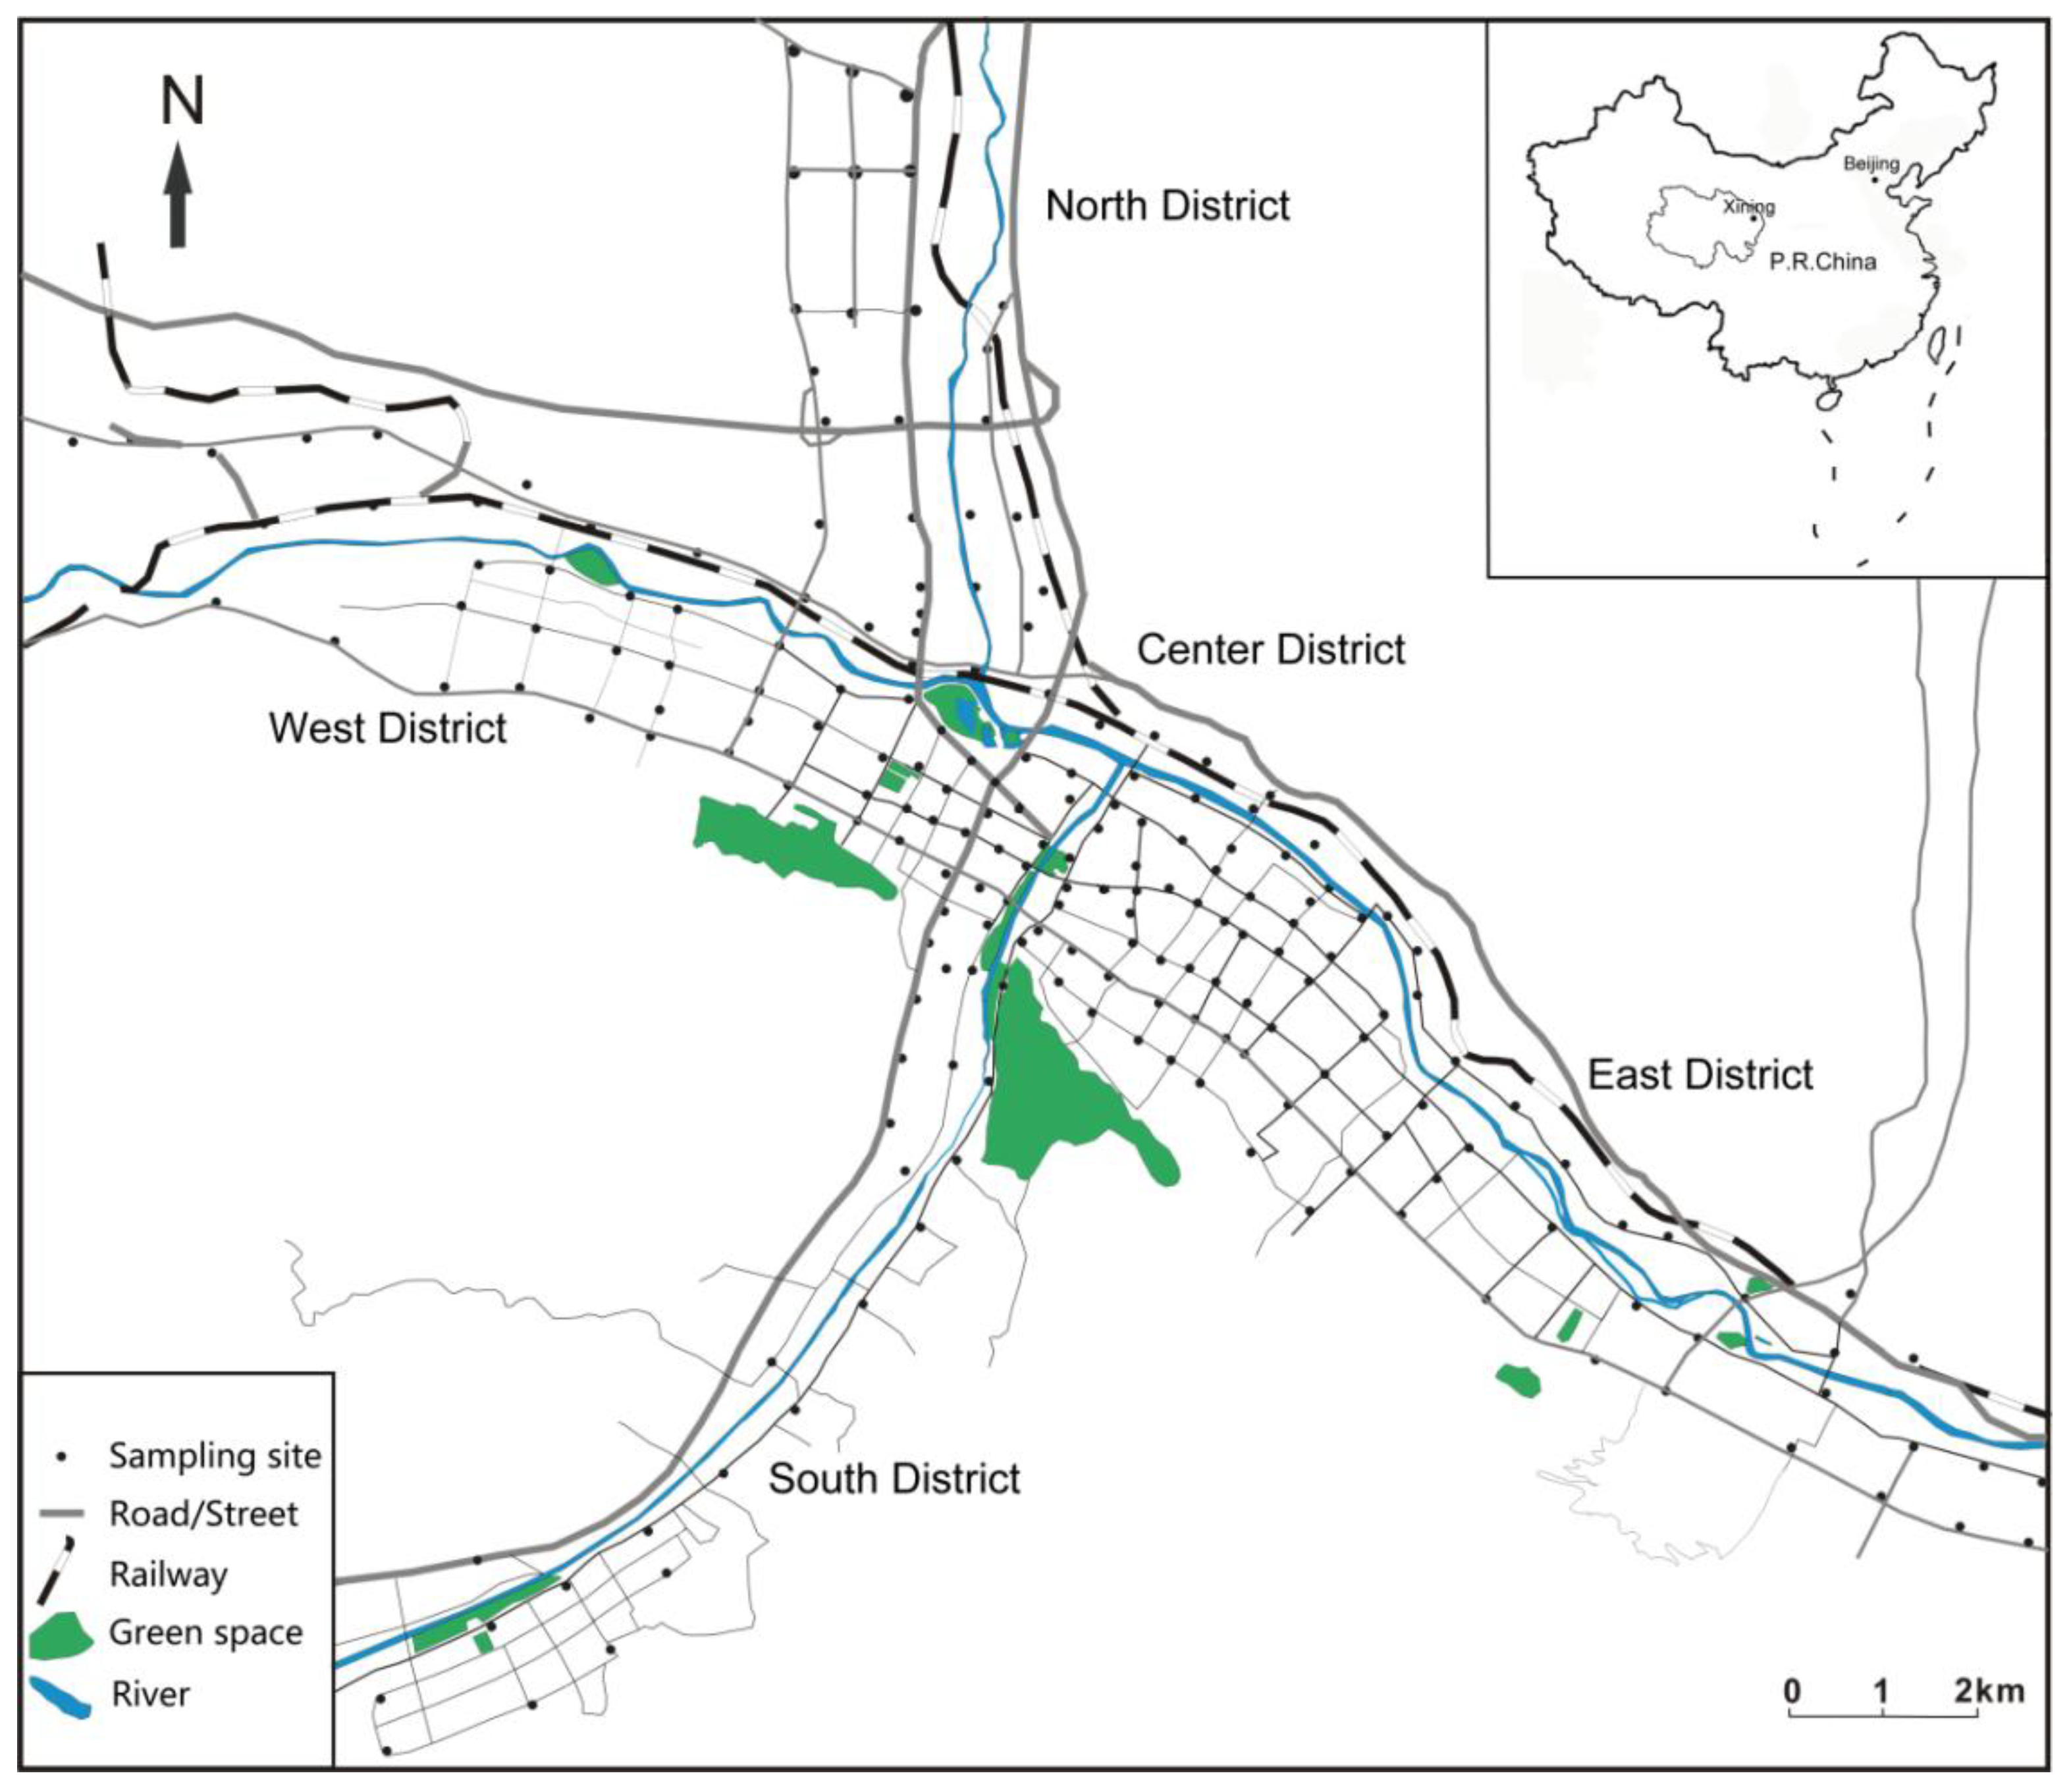
2.1. Study Area

Xining, the capital of Qinghai Province, is located in the eastern Tibetan Plateau with the longitude 101°77'E and latitude 36°62'N (Figure 1). Xining City has a typical continental plateau semi-arid climate with an annual temperature of −18.9 to 34.6 °C, annual average rainfall of 380 mm and annual average evaporation of 1,360 mm. Xining is surrounded by mountains with the average altitude is 2,260 m and three rivers converge on the city. The prevailing wind direction in Xining is northwest and the northwest altitude is high, while the southeast one is low. The urban population of Xining was 941,000 in 2000 and it had increased to 1,198,000 by 2010. Meanwhile the urbanization rate was 59.59% in 2006 and it increased to 67.73% in 2012. There were more than 300,000 motor vehicles in Xining in February 2013, while the number of motor vehicles was only 100,000 in 2006. The urban construction area of Xining is 75 km2. Xining urban area consists of five areas, i.e., East District (ED), West District (WD), South District (SD), North District (ND) and Center District (CD).
Figure 1. Study area and sampling sites in Xining.
Ijerph 11 02536 g001
Dongchuan industrial park is located in ED which is a new materials, new energy and mechanical processing area. Xining steel group, the railway station and bus terminal are located in WD. South Hill and Nanshan park are located in SD. There is one large steel market located in ND. CD is a commercial and residential mixed area with crowded traffic and dense population. All streets in Xining city are cleaned by sweeping every day in the morning.

2.2. Sampling and Analytical Methods

Dust sampling sites covered all five districts of the Xining urban area (Figure 1). At every sampling site, dust samples were collected by sweeping with a clean plastic brush and a dustpan [25,39] from five to eight points of the road or pavement edges twice during the dry season in July 2012. The amount street dust collected at each sampling point was about 30–50 g/m2. The twice collected samples were mixed to form a composite sample of ~500 g representing each sampling site and stored in a sealed polyethylene bag. In the laboratory, all the samples were air-dried naturally and sieved through a 100 μm nylon sieve. The fraction below 100 μm particle was collected. The concentrations of As, Co, Cu, Mn, Ni, Pb, V and Zn in the smaller than 100 μm street dust particles were measured by using wavelength dispersive X-ray fluorescence spectrometry (XRF, PW2403 apparatus, PANalytical, Almelo, Netherlands) [39]. Standard samples (GSD-12, GSS10) and 15% of the repeat samples were used for quality control in the experiments. The analytical precision, measured as relative standard deviation, was routinely 3%–5%. Accuracy of the analyses was checked using standard and duplicate samples. The quality control gave good precision (S.D. < 5%).

2.3. Methods of Contamination Assessment

A number of calculation methods have been put forward for quantifying the degree of ESEs’ enrichment or pollution in dust [6,16,44]. In this study, geoaccumulation index (Igeo), enrichment factor (EF) and pollution load index (PLI) are calculated to assess the metal contamination levels in the studied samples.

2.3.1. Enrichment Factor

For each ESE (i), the enrichment factor (EF) is defined in Equation (1):
EF = (Ci / Cref )sample /(Ci / Cref)background
where (Ci/Cref) is the ratio of concentration of metal i to the concentration of a reference metal in the sample and background. EF of an element in the studied samples is based on the standardization of a measured element against a reference element. A reference element is often the one characterized by low occurrence of variability, such as the most commonly used elements: Al, Fe, Ti, Si, Zr, etc. [38,45,46,47]. Five different categories defined for EF values [38,45] are listed in Table 1.
Table 1. Pollution index and pollution grade.
EFEnrichment CategoryIgeoPollution CategoryPLIPollution Category
EF < 2Deficiency to minimal pollutedIgeo ≤ 0Unpolluted 0 < PLI ≤ 1Unpolluted
2 ≤ EF < 5Moderate polluted0 < Igeo ≤ 1Unpolluted to moderately polluted1 < PLI ≤ 2Unpolluted to moderately
5 ≤ EF < 20Significant polluted1 < Igeo ≤ 2 Moderately polluted2 < PLI ≤ 3Moderately polluted
20 ≤ EF < 40Very high polluted2 < Igeo ≤ 3Moderately to strongly polluted3 < PLI ≤ 4Moderately to highly polluted
EF > 40Extremely high polluted3 < Igeo ≤ 4Strongly polluted4 < PLI ≤ 5Highly polluted
4 < Igeo ≤ 5Strongly to extremely pollutedPLI > 5Very highly polluted
Igeo > 5Extremely polluted

2.3.2. Geoaccumulation Index

The geoaccumulation index (Igeo) was originally defined by Müller [24] and used for bottom sediments. By making comparisons with pre-industrial levels, Igeo is capable of evaluating pollutant accumulation. It is computed through the Equation (2):
Igeo = log2 (Ci / (1.5 Bi))
where Ci represents the measured concentration of the element i and Bi is the geochemical background value of the element i in fossil argillaceous sediment (average shale). In the study, Bi is the background value of element i in Qinghai soil [48]. The factor 1.5 is introduced in this equation to minimize the effect of possible variations in the background values. The geoaccumulation index for each ESE is classified as shown in Table 1.

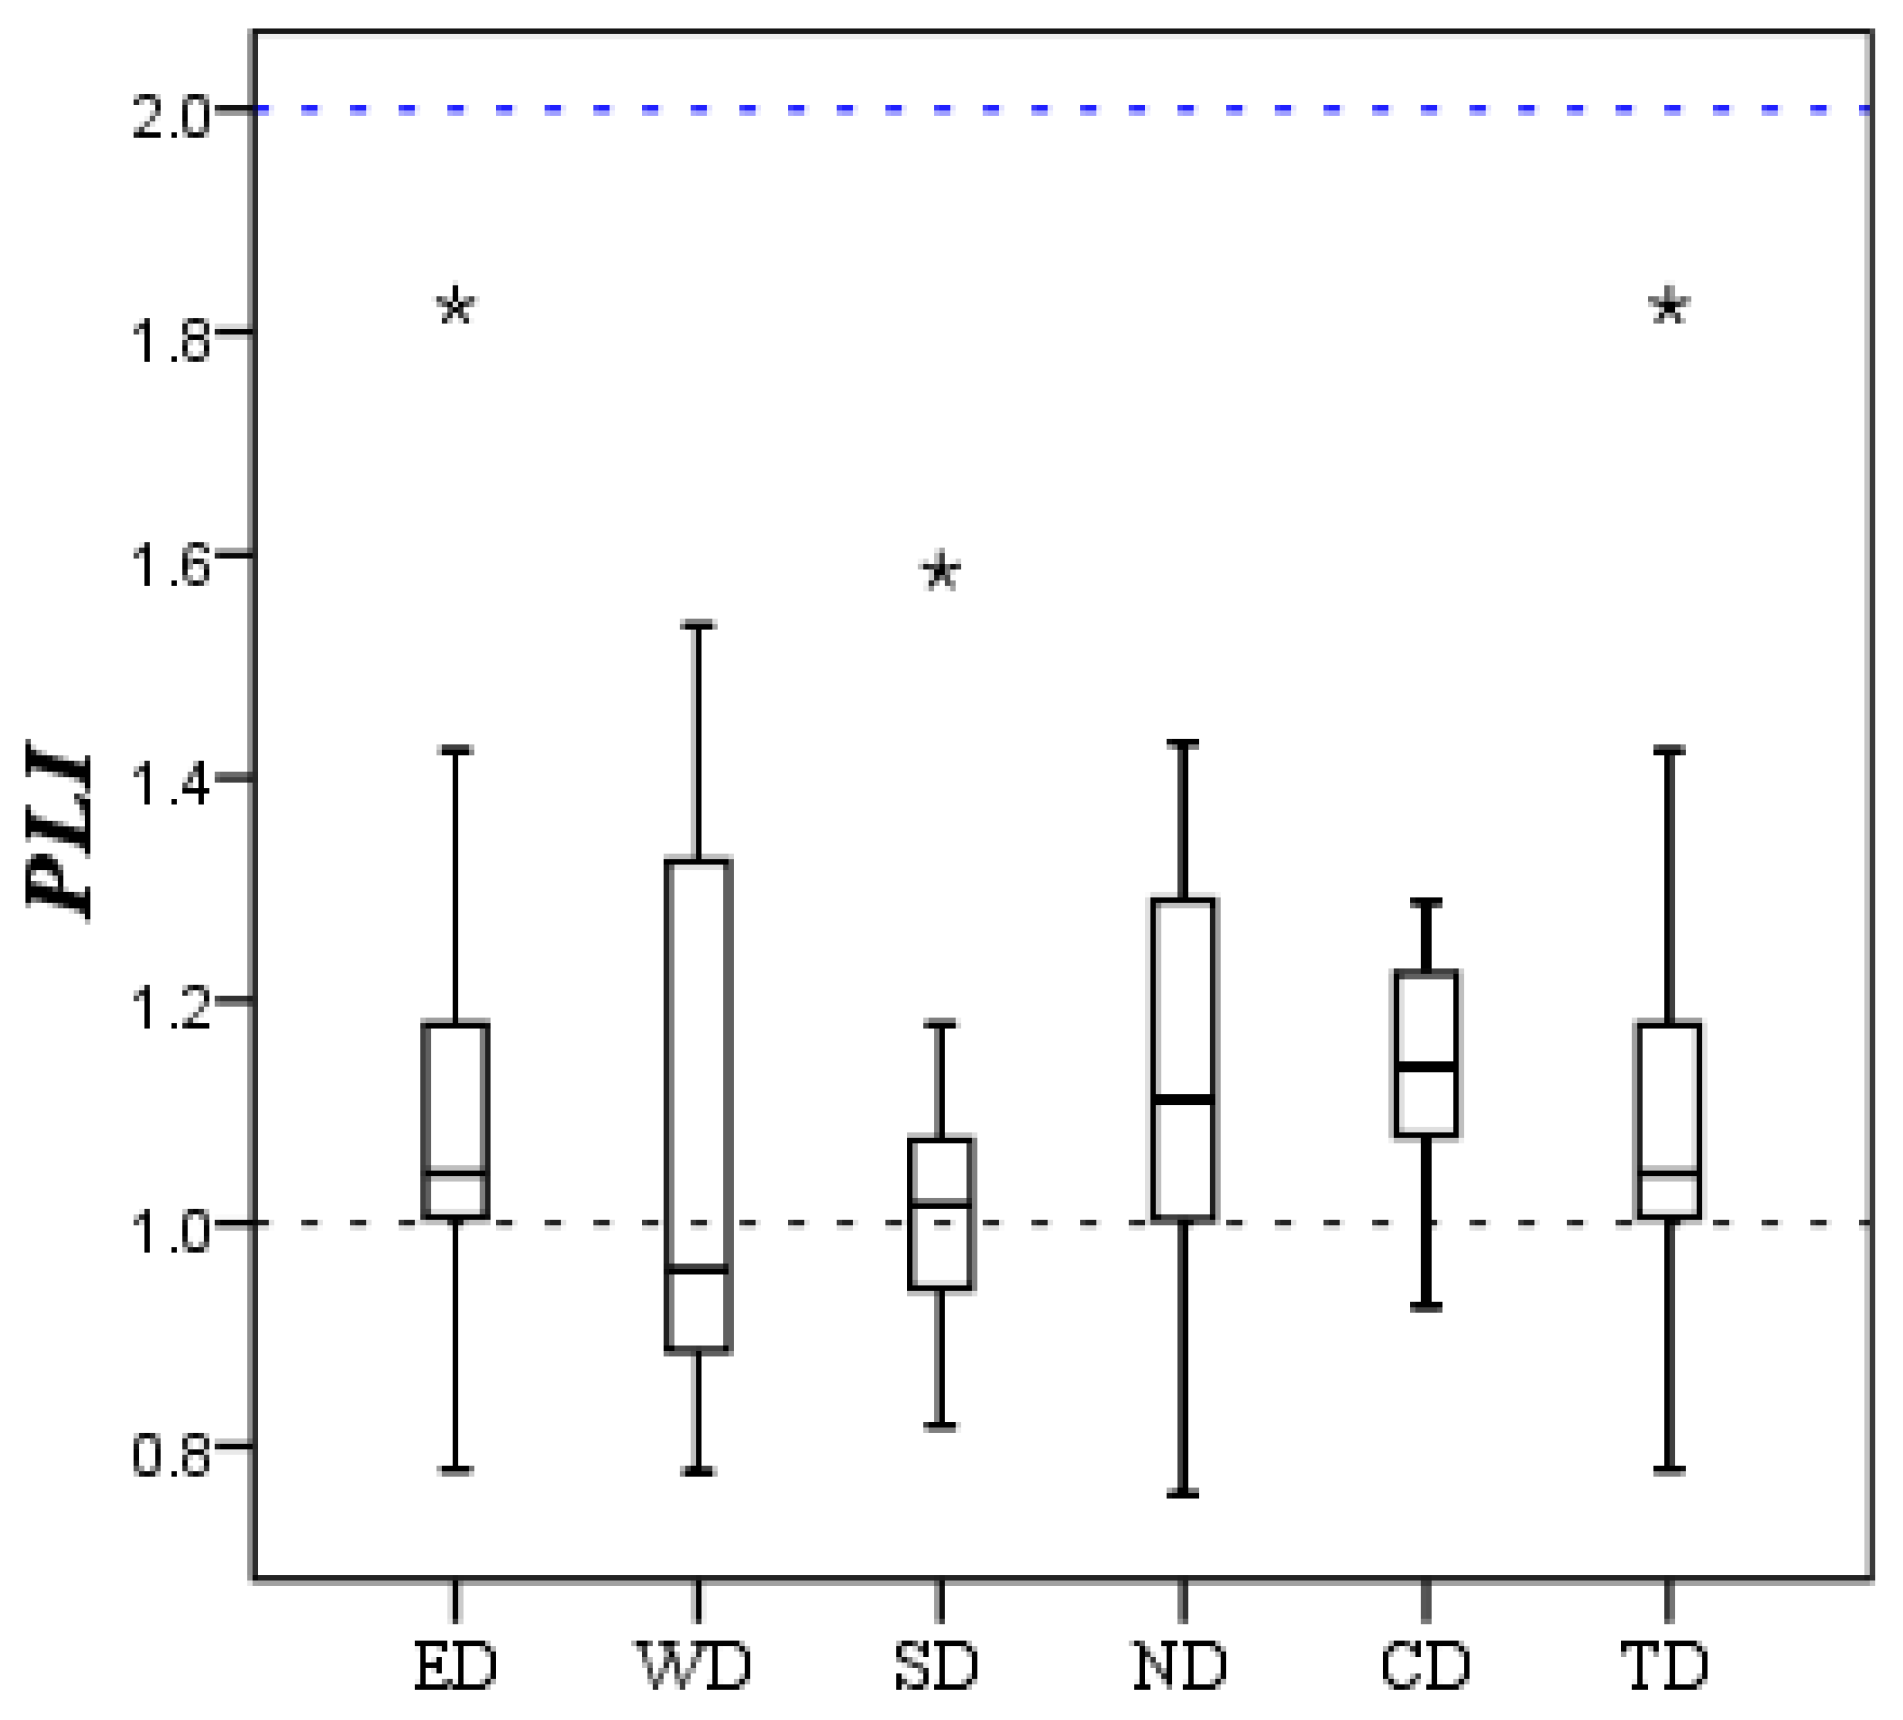
2.3.3. Pollution Load Index

In order to assess the integrative impact of anthropogenic activity on related ESEs, the Tomlinson multi-element pollution load index (PLI) [49] is calculated based on each element concentration (As, Co, Cu, Ni, Mn, Pb, V and Zn). The PLI index for each sampling site is defined as Equation (3):
Ijerph 11 02536 i001
where the CFelement i is the ratio between the content of metal i to its background value, which is computed with Equation (4):
CFelementi = Ci / Bi
where Ci represents the measured concentration of the element i and Bi is the background value of element i in Qinghai soil [48]. Finally, individual PLIsite values were used to compute PLIarea value for each sampling area as Equation (5) [15]:
Ijerph 11 02536 i002
where i is the number of the sampling site in each sampling area including East District (ED), West District (WD), South District (SD), North District (ND), Central District (CD) and Total Districts (TD). The PLI index is classified as shown in Table 1.

3. Results and Discussion

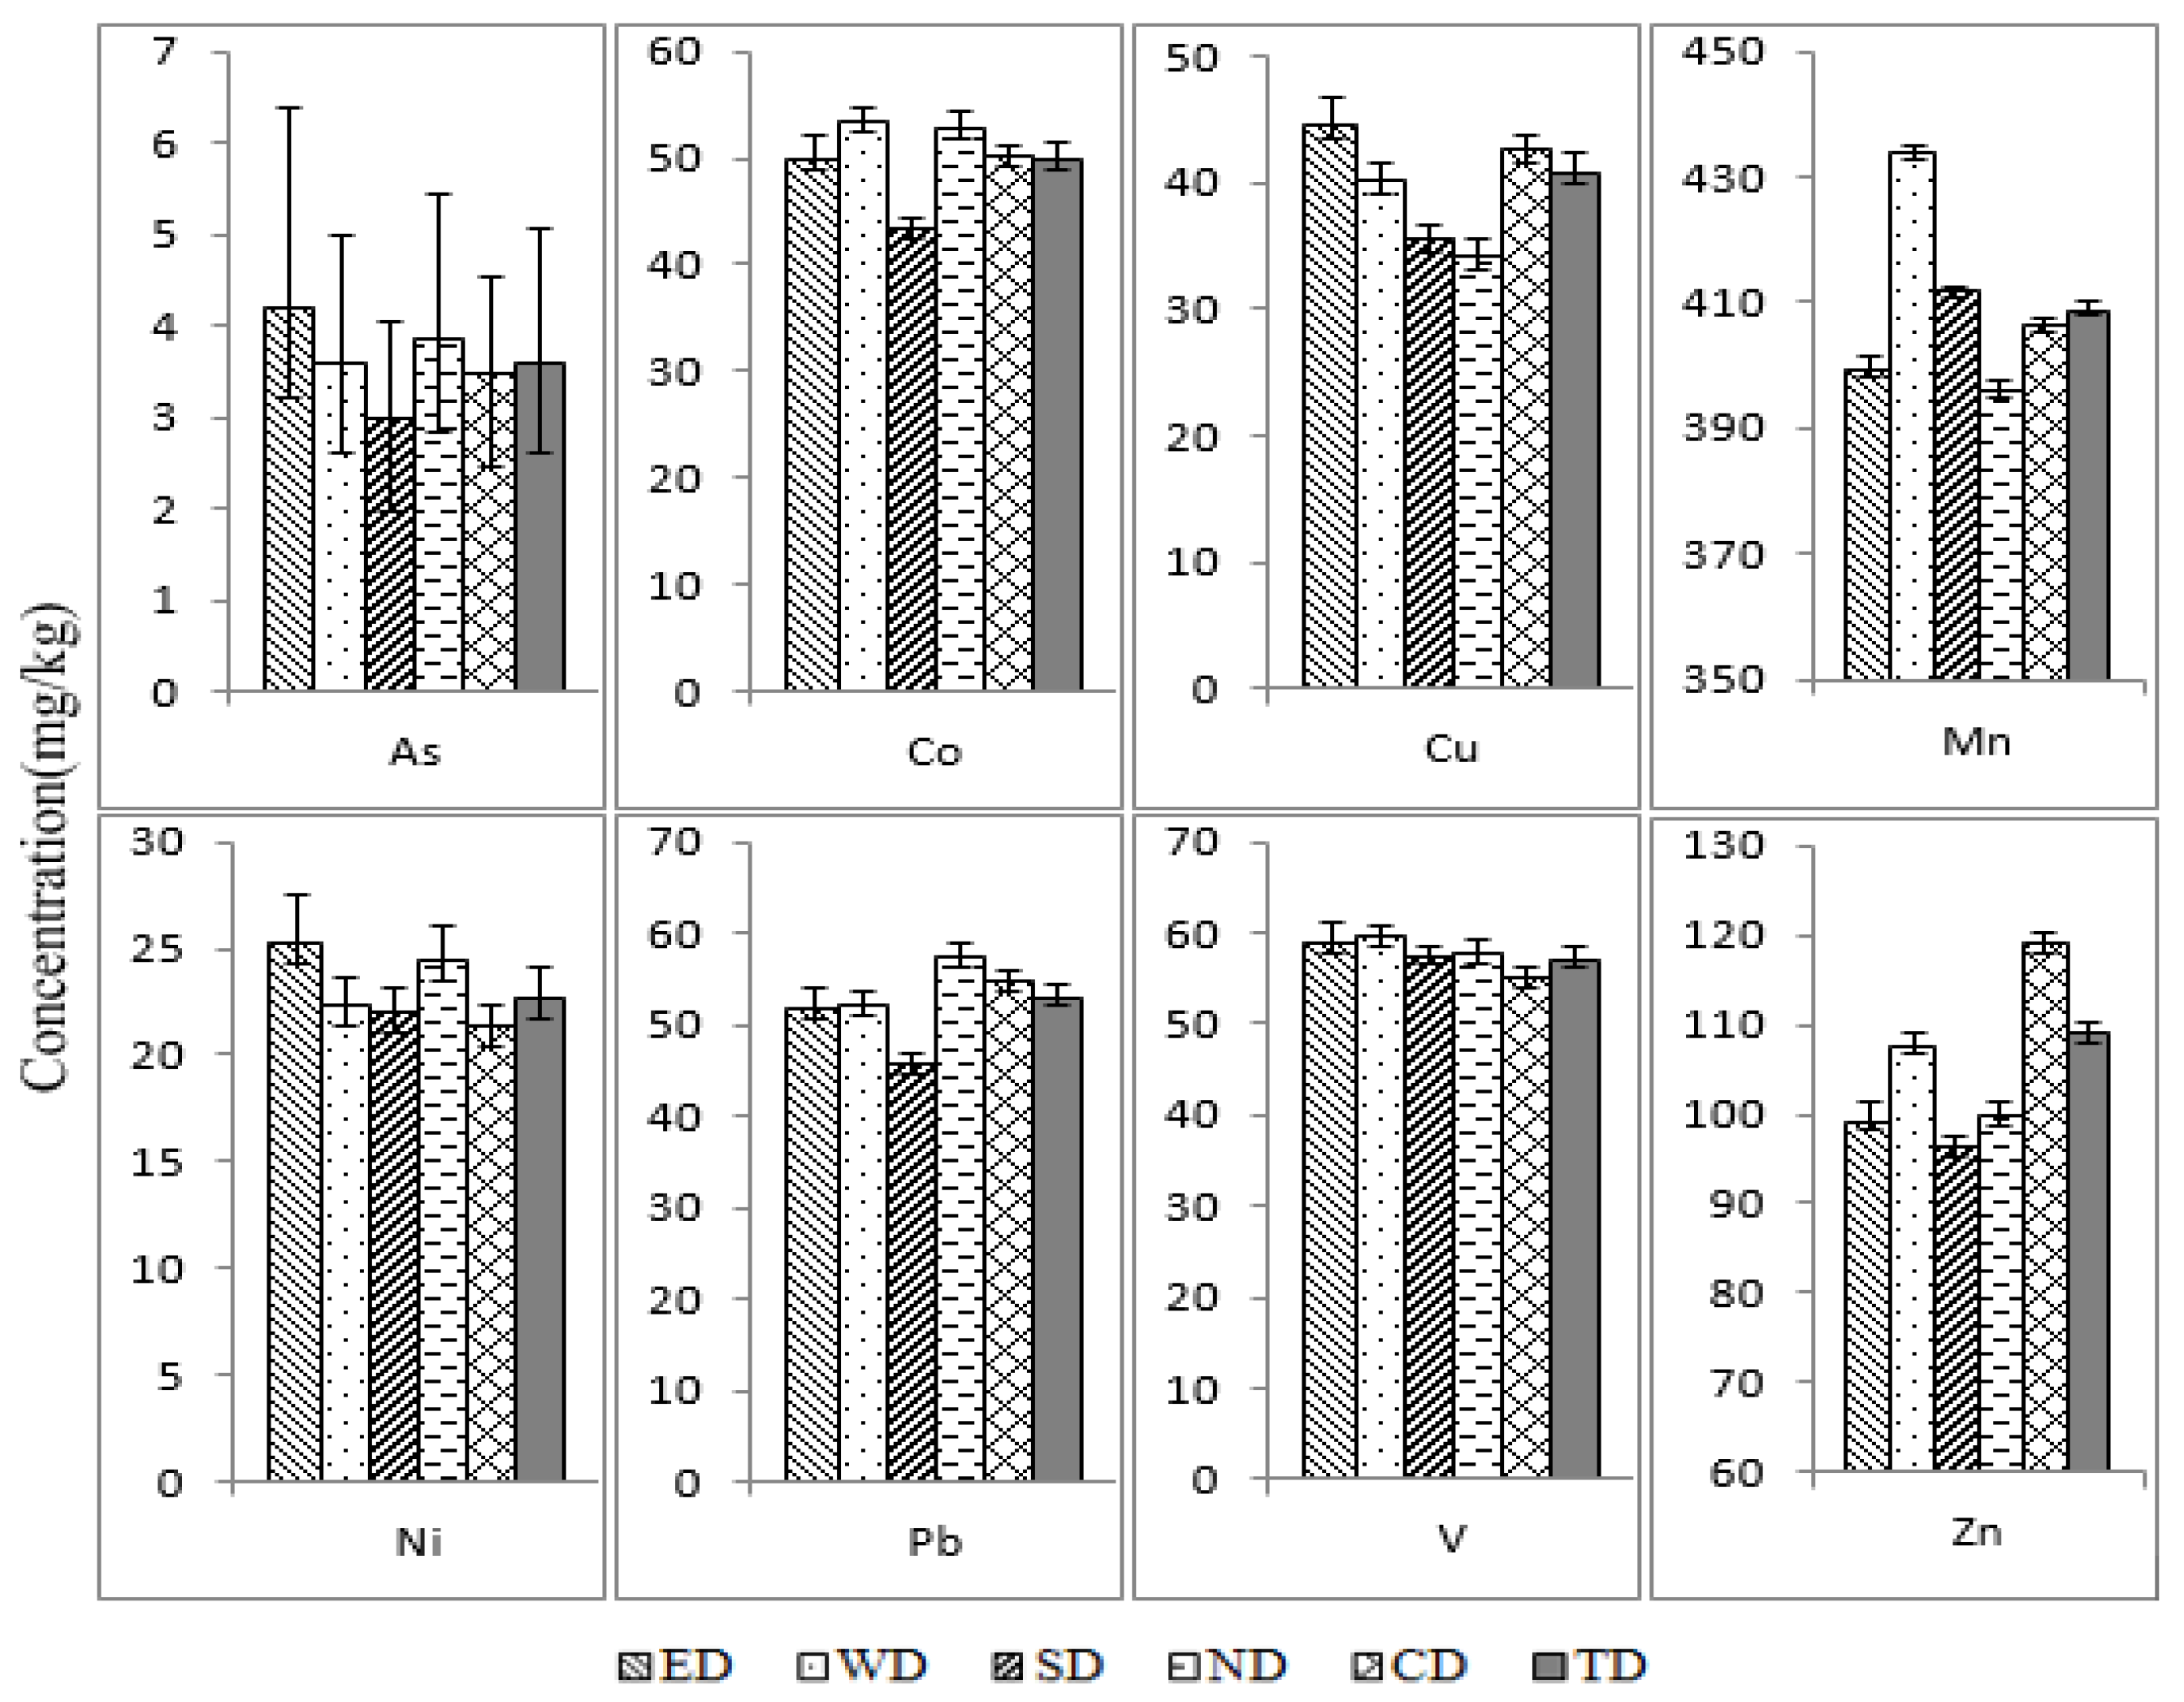
3.1. Concentration of ESEs in Smaller than 100 μm Street Dust Particles

Descriptive statistical values of ESEs concentrations in smaller than 100 μm street dust particles from Xining are summarized in Table 2. The background values for Qinghai soil [48], listed in Table 2, are used as reference values. The concentrations of ESEs in smaller than 100 μm street dust particles from the different districts, i.e., East District (ED), West District (WD), South District (SD), North District (ND) and Central District (CD), as well as the Total District (TD) are shown in Figure 2.
Table 2. Concentrations of ESEs in smaller than 100 μm street dust particles from Xining (mg/kg).
ElementsMin5%25%50%Mean75%95%MaxS.D.KurtosisSkewnessReference Value
As0.8 1.8 2.7 3.3 3.6 4.1 6.7 11.1 1.5 5.9 1.8 14.0
Co27.2 34.3 41.5 49.7 50.0 56.5 67.3 110.2 11.3 3.6 1.0 10.1
Cu15.1 20.2 30.537.9 40.8 47.5 76.6 115.2 16.4 3.5 1.5 22.2
Mn150.1 351.9 385.8 405.7 408.7 425.1 506.2 623.5 47.7 8.2 0.3 580.0
Ni16.8 18.3 19.8 21.2 22.6 22.6 30.9 74.1 6.6 30.6 5.0 29.6
Pb24.4 34.8 41.5 48.5 52.9 56.6 85.8 233.0 21.029.5 4.3 20.9
V47.4 51.5 53.6 55.5 57.1 58.7 65.2 96.8 6.0 14.6 3.0 71.8
Zn33.1 64.4 85.9 106.9 108.9 127.1 161.8 231.1 31.3 0.9 0.6 80.3
Figure 2. Concentrations of ESEs in smaller than 100 μm street dust particles from Xining (ED: East District; WD: West District; SD: South District; ND: North District; CD: Central District; TD: Total District).
Ijerph 11 02536 g002
As shown in Table 2, the mean concentration of As, Co, Cu, Mn, Ni, Pb, V and Zn in smaller than 100 μm street dust particles from Xining City is 3.6, 50.0, 40.8, 408.7, 22.6, 52.9, 57.1 and 108.9 mg/kg, respectively. Based on the mean metal concentrations in the studied samples, the ratios of mean concentration and the reference value is in order Co > Pb > Cu > Zn > V > Ni > Mn > As. The mean concentrations of Co, Cu, Pb and Zn in smaller than 100 μm street dust particles are significantly higher than their background values of Qinghai soil, indicating possible contamination, likely caused by an anthropogenic source. The concentrations of As, Co, Cu, Mn, Ni, Pb, V and Zn in the smaller than 100 μm street dust particles are 0.1–0.8, 2.7–10.9, 0.7–5.2, 0.36–1.1, 0.6–2.5, 1.2–11.1, 0.7–1.3 and 0.4–2.9 times the background value of Qinghai soil, respectively. The 95th percentile values of As, Mn, Ni and V are lower or slightly higher than their background values and their mean concentrations are 0.5, 0.9, 1.0 and 0.9 times the background values, respectively, indicating that these four metals may mainly originate from natural sources. The 25th percentile values of Co, Cu, Pb and Zn are obviously higher than their corresponding background values, indicating they may be influenced by the anthropogenic pollution. Similar results have been reported before, showing that Pb, Zn and Cu in the street dust of Baoji were 5–71, 5–24 and 3–12 times the background values of Shaanxi soil [25]. The mean concentrations of Co, Cu, Pb and Zn in re-suspended dust from Xining are 5.0, 1.8, 2.5 and 1.4 times the background values, respectively, so we should pay more attention to their potential risks to local humans [44].
Figure 2 shows the concentrations of ESEs in smaller than 100 μm street dust particles from the different districts. The mean concentration orders for each metal in the different districts is As: ED > ND > WD > CD > SD; Co: WD > ND > CD > ED > SD; Cu: ED > CD > WD > SD > ND; Mn: WD > SD > CD > ED > ND; Ni: ED > ND > WD > SD > CD; Pb: ND > CD > WD > ED > SD; V: WD > ED > SD > ND > CD; Zn: CD > WD > ED > ND >SD. The highest concentrations of Co, Cu, Pb and Zn in the studied samples were found in WD, ED, ND and CD, respectively, indicating these four metals may derive from different anthropogenic sources due to the different regional characteristics of the four districts.

3.2. Assessment Results of the ESEs Contamination in Smaller than 100 μm Street Dust Particles

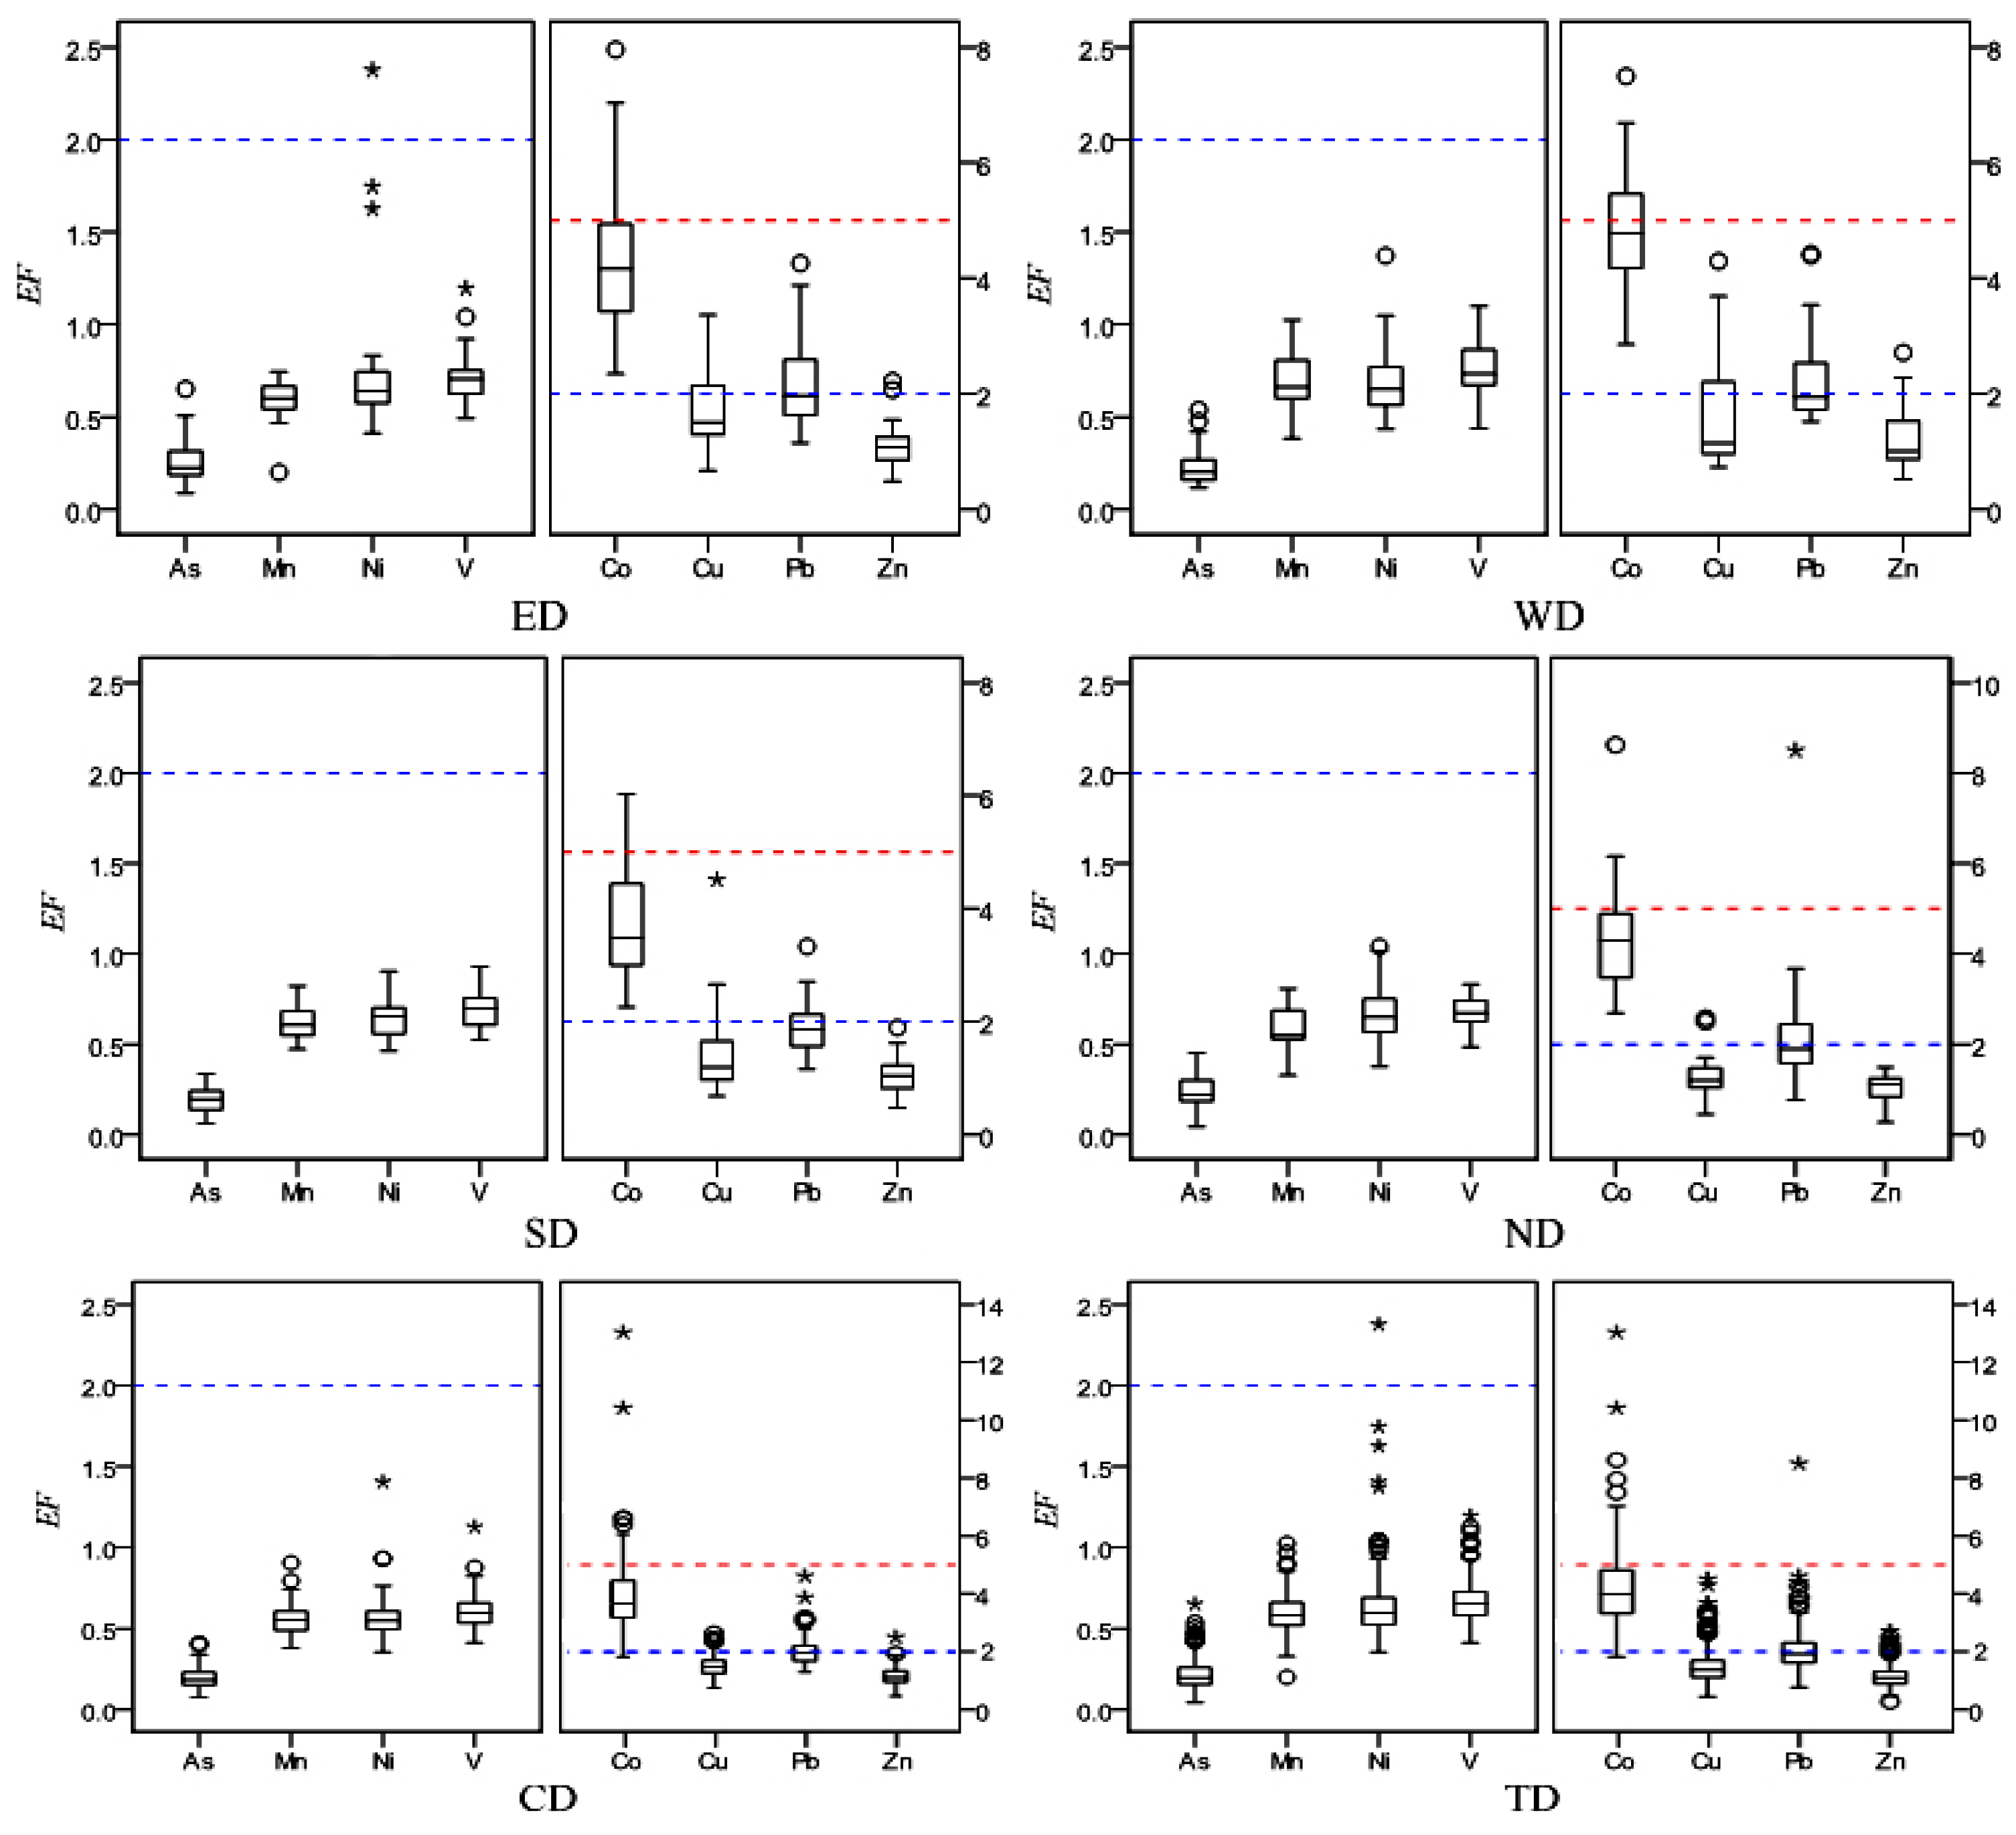
3.2.1. Enrichment Index Assessment Results

Enrichment factors of ESEs are calculated for each metal relative to the background value of Qinghai soil [48]. In this study, Zr is used as a reference element. The Box-plots of EF for ESEs in smaller than 100 μm street dust particles from Xining are provided in Figure 3.
The EF values of As, Co, Cu, Mn, Ni, Pb, V and Zn in the smaller than 100 μm street dust particles are in the range of 0.04–0.65, 1.82–13.03, 0.45–4.51, 0.2–1.02, 0.35–2.38, 0.77–8.5, 0.41–1.19 and 0.27–2.71, with an average of 0.22, 4.19, 1.53, 0.59, 0.64, 2.10, 0.67 and 1.14, respectively. All the EF values of As, Mn, Ni and V are lower than 2, indicating these four metals are in the deficiency to minimal pollution range, according to the pollution grade ratings in Table 1, while for Cu, Pb and Zn, 84%, 55% and 97% the EF values are lower than 2, and 16%, 45% and 3% EF values are between 2 and 5, respectively, indicating they are minimal to moderate pollutants. Co has 78% EF in the 2 to 5 and 21% EF in the 5 to 20 range, indicating the Co is moderate to significant polluted. The order of mean EF values is Co (4.19) > Pb (2.10) > Cu (1.53) > Zn (1.14) > V (0.67) > Ni (0.64) > Mn (0.59) > As (0.22).
Figure 3. Box-plots of EF for ESEs in smaller than 100 μm street dust particles from Xining (ED: East District; WD: West District; SD: South District; ND: North District; CD: Central District; TD: Total District; °: outlier; *: extreme).
Ijerph 11 02536 g003
The EF values of the ESEs in each district are different. The highest mean EF values of Co (4.89) and Zn (1.23) are found in the West District (WD), where the Xining steel group, railway station and bus terminal are located. Co and Zn can be found in stainless and alloy steels [50] and Co in dust appears to come at least partially from automotive emissions [25], Zn has a traffic source coupled with industrial sources [39]. The highest mean EF values of Cu and Pb occurred in the East District (ED) and North District (ND), respectively, where the main traffic and industrial areas are, indicating these two elements are strongly influenced by the mechanical abrasion of vehicle parts [51] and industrial pollution [39]. The EF values of all analyzed metals in smaller than 100 μm street dust particles from the South District (SD) are the lowest, indicating the South District of Xining is barely influenced by human activities.

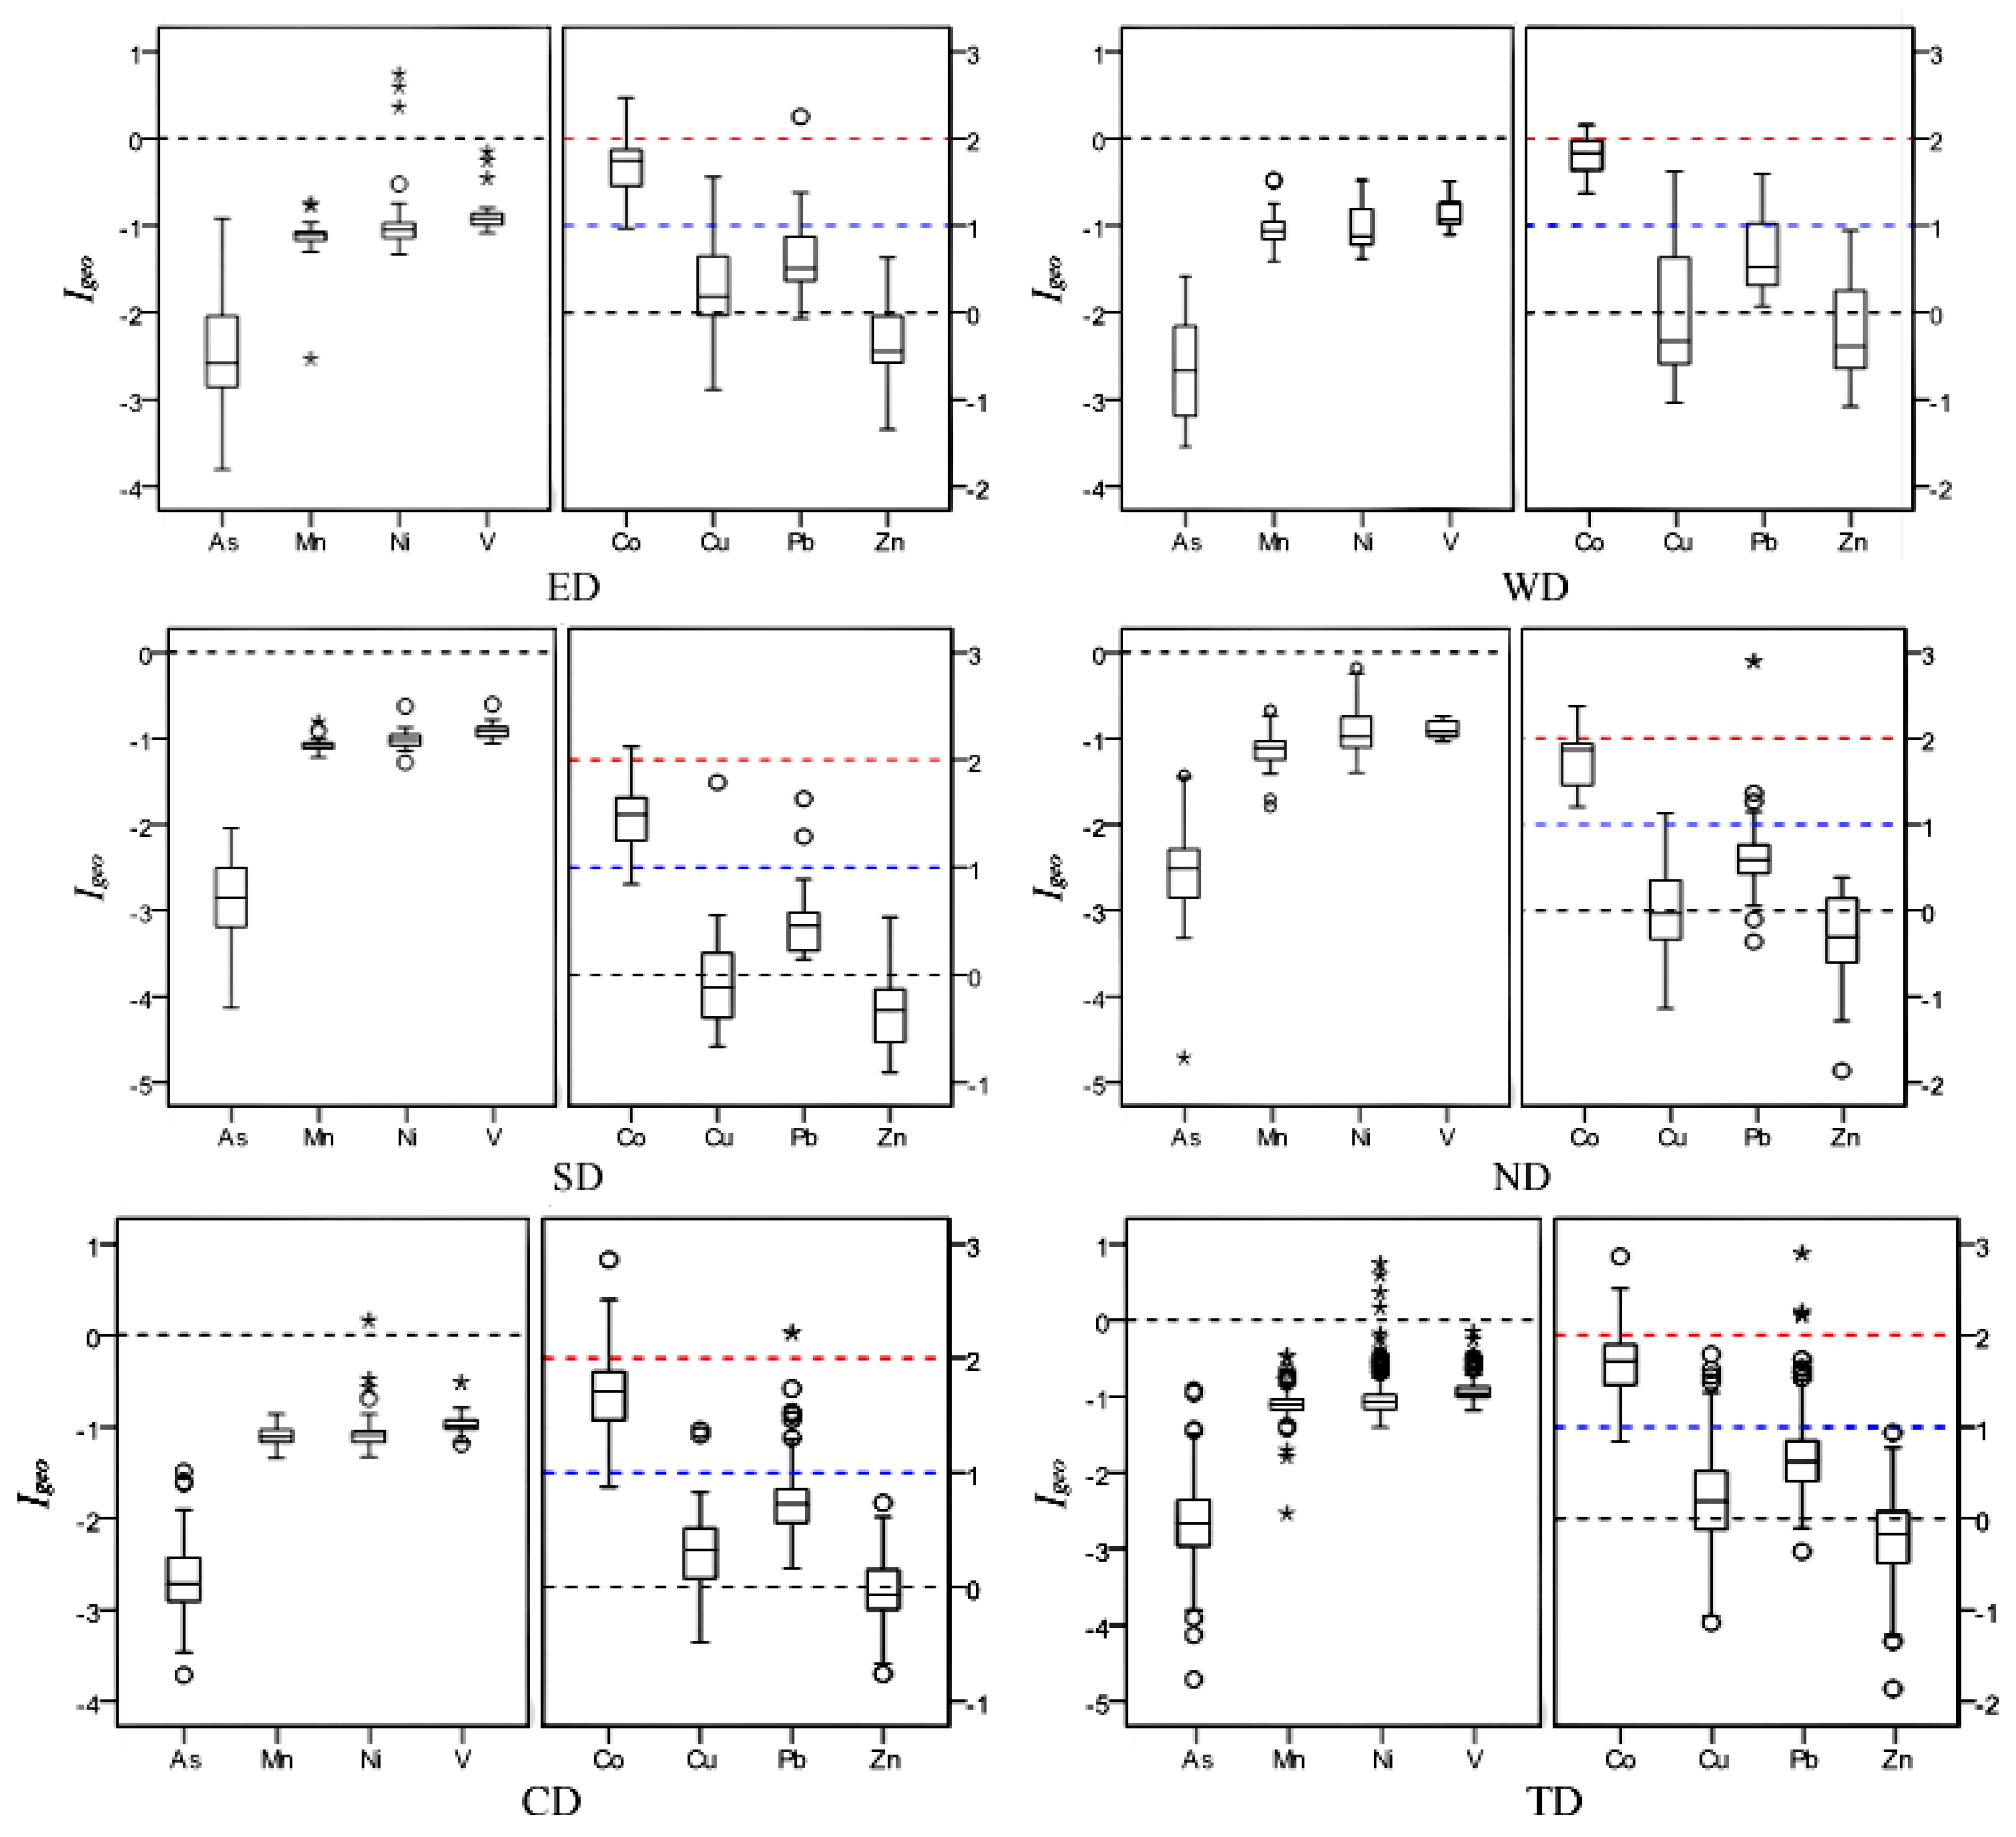
3.2.2. Assessment Results of Geoaccumulation Index

The calculated results of Igeo of ESEs in smaller than 100 μm street dust particles from Xining are presented in Figure 4. The Igeo values of As, Co, Cu, Mn, Ni, Pb, V and Zn in the investigated samples range from −0.47 to −0.92, 0.84 to 2.86, −1.14 to 1.79, −2.54 to −0.48, −1.40 to 0.74, −0.36 to 2.89, −1.18 to −0.15 and −1.86 to 0.94, with an average of −2.64, 1.69, 0.19, −1.10, −1.01, 0.68, −0.92 and −0.21, respectively. The order of mean Igeo is Co (1.69) > Pb (0.68) > Cu (0.19) > Zn (−0.21) > V (−0.92) > Ni (−1.01) > Mn (−1.10) > As (−2.64), similar to the order of EF. All Igeo values for As, Mn and Ni and 98% Igeo of V are less than 0, indicating that the studied samples in Xining is unpolluted by As, Mn, V and Ni.
The mean Igeo value and 69% Igeo values of Zn are less than 0 (unpolluted), and 31% Igeo values of Zn are slightly higher than 0, indicating an unpolluted to moderately polluted status. The 58% Igeo values of Cu and 80% Igeo values of Pb, as well as the mean Igeo values of Cu and Pb, are between 0 and 1 revealing an unpolluted to moderately polluted status, while 34% Igeo values of Pb and 2% Igeo values of Cu are lower than 0 and 8% Igeo values of Pb and 16% Igeo values of Cu are between 1 and 2, revealing the unpolluted or moderately polluted status of these metals. The 84% and 14% Igeo values of Co fall into 1 to 2 and 2 to 3, respectively, and only 2% are between 0 and 1, indicating Co is a moderate pollutant and moderate to strong pollutant. The Igeo results indicates that the smaller than 100 μm street dust particles from Xining City are contaminated by with different levels of different ESEs, especially Co, Cu, Pb and Zn, which are derived from anthropogenic sources.
Figure 4. Box-plots of Igeo for ESEs in smaller than 100 μm street dust particles from Xining (ED: East District; WD: West District; SD: South District; ND: North District; CD: Central District; TD: Total District; °: outlier; *: extreme).
Ijerph 11 02536 g004
The Igeo results in each district are same as the EF results except for Zn. The highest mean Igeo value of Zn is found in the Central District, while it is in the West District in the EF analysis, which may be related to the concentration of reference element Zr in these two districts. The Central District is a commercial and residential mixed zone which is influenced by heavy traffic and human activities, which further explains a significant contribution to Zn and Pb from traffic-related sources [7,51].

3.2.3. Pollution Load Index Assessment Results

The calculated PLI values including eight ESEs (As, Co, Cu, Mn, Ni, Pb, V and Zn) in smaller than 100 μm street dust particles from Xining are summarized in Figure 5. According to Suresh et al. [52], PLI values equal to zero indicate perfection, a value of one indicates baseline levels of pollutants present and values above one indicate progressive deterioration. The extent of pollution increases with the increase in the numerical PLI value.
Figure 5. Box-plots of PLI for ESEs in smaller than 100 μm street dust particles from Xining (ED: East District; WD: West District; SD: South District; ND: North District; CD: Central District; TD: Total District; *: extreme).
Ijerph 11 02536 g005
Figure 5 shows that PLIsite values range from 0.76 to 1.82, with a mean value of 1.14 in the whole city of Xining (TD). 20% PLIsite values in Xining are lower than one, indicating an unpolluted status, but 80% PLIsite values are between 1 and 2, indicating most street dust sampling sites are unpolluted to moderately polluted. Three higher PLIsite values (1.82, 1.75 and 1.65) are found in the samples collected from heavy traffic and industrial areas. The overall PLIarea value for Xining is calculated and the result is 1.12, indicating a slightly moderately polluted status.
As for the five districts in Xining City, the PLIarea is 1.14, 1.13, 1.03, 1.11 and 1.15 for ED, WD, SD, ND and CD, respectively. The values of the five areas are roughly the same, and slightly higher than one. South District (SD) has the lowest PLIarea value among five districts, and is where South Hill and Nanshan Park are located; these indicate that South District is seldom affected by the human activities such as heavy traffic and industries. The highest PLIarea value occurred in the Central District (CD), which is the commercial and residential mixed zone, easily influenced by anthropogenic sources.

4. Conclusions

Street dust samples were collected from Xining and the concentrations of ESEs As, Co, Cu, Mn, Ni, Pb, V and Zn in the smaller than 100 μm street dust particle samples were determined using the XRF method. The results indicate that Co, Cu, Pb and Zn were significantly concentrated in the smaller than 100 μm street dust particles from Xining City. Their EF and Igeo values reveal that Co, Cu, Pb and Zn in the studied samples presented different level of contamination, while As, Mn, Ni and V were non-pollutants. The pollution load index assessment results indicate that the smaller than 100 μm street dust particles from Xining presented a slightly polluted status as a whole, and ESE pollution in the South District is lighter than in other districts. The environmental risk of ESEs As, Co, Cu, Mn, Ni, Pb, V and Zn in the smaller than 100 μm street dust particles is not only related to their respective concentration levels, but with their speciation in the samples. The speciation of ESEs in the smaller than 100 μm street dust particles and their health risk will be further investigated in the future work.

Acknowledgments

The research was supported by the National Natural Science Foundation of China through Grant 41271510 and the Fundamental Research Funds for the Central University through Grants GK201305008. We thank Mengmeng Zhang, Xiang Ding and Tingting Feng for their help with the experiments. We also thank Editor Xie and the anonymous reviewers for their insightful suggestions and critical reviews of the manuscript.

Author Contributions

Ni Zhao: sample pretreatment, experimental analysis and initial manuscript writing. Xinwei Lu conceived the study and revised the manuscript. Shigang Chao contributed to field works and dust sample collection.

Conflicts of Interest

The authors declare no conflict of interest.

References

  1. Grimm, N.B.; Faeth, S.H.; Golubiewski, N.E.; Redman, C.L.; Wu, J.; Bai, X.; Briggs, J.M. Global change and the ecology of cities. Science 2008, 319, 756–760. [Google Scholar] [CrossRef]
  2. McKenzie, E.R.; Wong, C.M.; Green, P.G.; Kayhanian, M.; Young, T.M. Size dependent elemental composition of road-associated particles. Sci. Total Environ. 2008, 398, 145–153. [Google Scholar] [CrossRef]
  3. Tian, P.; Li, Y.; Yang, Z. Effect of rainfall and antecedent dry periods on heavy metal loading of sediments on urban roads. Front. Earth Sci. China 2009, 3, 297–302. [Google Scholar] [CrossRef]
  4. Zhao, H.; Yin, C.; Chen, M.; Wang, W. Risk assessment of heavy metals in street dust particles to a stream network. Soil Sediment Contam. 2009, 18, 173–183. [Google Scholar] [CrossRef]
  5. Banerjee, A.D. Heavy metal levels and solid phase speciation in street dusts of Delhi, India. Environ. Poll. 2003, 123, 95–105. [Google Scholar] [CrossRef]
  6. Zhu, Z.; Li, Z.; Bi, X.; Han, Z.; Yu, G. Response of magnetic properties to heavy metal pollution in dust from three industrial cities in China. J. Hazard. Mater. 2013, 246, 189–198. [Google Scholar]
  7. Ferreira-Baptista, L.; de Miguel, E. Geochemistry and risk assessment of street dust in Luanda, Angola: A tropical urban environment. Atmos. Environ. 2005, 395, 4501–4512. [Google Scholar] [CrossRef] [Green Version]
  8. Ahmed, F.; Ishiga, H. Trace metal concentrations in street dusts of Dhaka city, Bangladesh. Atmos. Environ. 2006, 40, 3835–3844. [Google Scholar] [CrossRef]
  9. De Miguel, E.; Iribarren, I.; Chacón, E.; Ordonez, A.; Charlesworth, S. Risk-based evaluation of the exposure of children to trace elements in playgrounds in Madrid (Spain). Chemosphere 2007, 66, 505–513. [Google Scholar] [CrossRef]
  10. Lim, H.S.; Lee, J.S.; Chon, H.T.; Sager, M. Heavy metal contamination and health risk assessment in the vicinity of the abandoned Songcheon Au-Ag mine in Korea. J. Geochem. Explor. 2008, 96, 223–230. [Google Scholar] [CrossRef]
  11. De Miguel, E.; Llamas, J.F.; Chacon, E.; Mazadiego, L.F. Sources and pathways of trace elements in urban environments: A multi-elemental qualitative approach. Sci. Total Environ. 1999, 235, 355–357. [Google Scholar] [CrossRef]
  12. Sabin, L.D.; Lim, J.H.; Venezia, M.T.; Winer, A.M.; Schiff, K.C.; Stolzenbach, K.D. Dry deposition and resuspension of particle-associated metals near a freeway in Los Angeles. Atmos. Environ. 2006, 40, 7528–7538. [Google Scholar] [CrossRef]
  13. De Pereira, P.A.; Lopes, W.A.; Carvalho, L.S.; da Rocha, G.O.; de Carvalho Bahia, N.; Loyola, J.; Quiterio, S.L.; Escaleira, V.; Arbilla, G.; de Andrade, J.B. Atmospheric concentrations and dry deposition fluxes of particulate trace metals in Salvador, Bahia, Brazil. Atmos. Environ. 2007, 41, 7837–7850. [Google Scholar] [CrossRef]
  14. Garnaud, S.; Mouchel, J.M.; Chebbo, G.; Thévenot, D.R. Heavy metal concentrations in dry and wet atmospheric deposits in Paris district: comparison with urban runoff. Sci. Total Environ. 1999, 235, 235–245. [Google Scholar] [CrossRef] [Green Version]
  15. Yuen, J.Q.; Olin, P.H.; Lim, H.S.; Benner, S.G.; Sutherland, R.A.; Ziegler, A.D. Accumulation of potentially toxic elements in road deposited sediments in residential and light industrial neighborhoods of Singapore. J. Environ. Manage. 2012, 101, 151–163. [Google Scholar] [CrossRef]
  16. Wei, B.; Yang, L. A review of heavy metal contaminations in urban soils, urban road dusts and agricultural soils from China. Microchem. J. 2010, 94, 99–107. [Google Scholar] [CrossRef]
  17. Tang, Q.; Liu, G.; Zhou, C.; Zhang, H.; Sun, R. Distribution of environmentally sensitive elements in residential soils near a coal-fired power plant: Potential risks to ecology and children’s health. Chemosphere 2013, 93, 2473–2479. [Google Scholar] [CrossRef]
  18. Charlesworth, S.; Everett, M.; McCarthy, R.; Ordonez, A.; de Miguel, E. A comparative study of heavy metal concentration and distribution in deposited street dusts in a large and a small urban area: Birmingham and Coventry, West Midlands, UK. Environ. Int. 2003, 29, 563–573. [Google Scholar] [CrossRef]
  19. Zhao, P.; Feng, Y.; Zhu, T.; Wu, J. Characterizations of resuspended dust in six cities of North China. Atmos. Environ. 2006, 40, 5807–5814. [Google Scholar] [CrossRef]
  20. Zhang, M.; Wang, H. Concentrations and chemical forms of potentially toxic metals in road-deposited sediments from different zones of Hangzhou, China. J. Environ. Sci. 2009, 21, 625–631. [Google Scholar] [CrossRef]
  21. McAlister, J.J.; Smith, B.J.; Török, A. Element partitioning and potential mobility within surface dusts on buildings in a polluted urban environment, Budapest. Atmos. Environ. 2006, 40, 6780–6790. [Google Scholar] [CrossRef]
  22. Tokalıoğlu, Ş.; Kartal, Ş. Multivariate analysis of the data and speciation of heavy metals in street dust samples from the Organized Industrial District in Kayseri (Turkey). Atmos. Environ. 2006, 40, 2797–2805. [Google Scholar] [CrossRef]
  23. Shi, G.; Chen, Z.; Xu, S.; Zhang, J.; Wang, L.; Bi, C.; Teng, J. Potentially toxic metal contamination of urban soils and roadside dust in Shanghai, China. Environ. Poll. 2008, 156, 251–260. [Google Scholar] [CrossRef]
  24. Lu, X.; Wang, L.; Lei, K.; Huang, J.; Zhai, Y. Contamination assessment of copper, lead, zinc, manganese and nickel in street dust of Baoji, NW China. J. Hazard. Mater. 2009, 161, 1058–1062. [Google Scholar] [CrossRef]
  25. Lu, X.; Wang, L.; Li, L.Y.; Lei, K.; Huang, L.; Kang, D. Multivariate statistical analysis of heavy metals in street dust of Baoji, NW China. J. Hazard. Mater. 2010, 173, 744–749. [Google Scholar] [CrossRef]
  26. Al-Khashman, O. Heavy metal distribution in dust, street dust and soils from the work place in Karak Industrial Estate, Jordan. Atmos. Environ. 2004, 38, 6803–6812. [Google Scholar] [CrossRef]
  27. Sezgin, N.; Ozcan, H.K.; Demir, G.; Nemlioglu, S.; Bayat, C. Determination of heavy metal concentrations in street dusts in Istanbul E-5 highway. Environ. Int. 2004, 29, 979–985. [Google Scholar] [CrossRef]
  28. Al-Khashman, O.A. Determination of metal accumulation in deposited street dusts in Amman, Jordan. Environ. Geochem. Health 2007, 29, 1–10. [Google Scholar] [CrossRef]
  29. Al-Khashman, O.A. The investigation of metal concentrations in street dust samples in Aqaba city, Jordan. Environ. Geochemi. Health 2007, 29, 197–207. [Google Scholar] [CrossRef]
  30. Faiz, Y.; Tufail, M.; Javed, M.T.; Chaudhry, M.M. Road dust pollution of Cd, Cu, Ni, Pb and Zn along Islamabad Expressway, Pakistan. Microchem. J. 2009, 92, 186–192. [Google Scholar] [CrossRef]
  31. Ghorbel, M.; Munoz, M.; Courjault-Radé, P.; Destrigneville, C.; de Parseval, P.; Souissi, R.; Souissi, F.; Mammou, A.B.; Abdeljaouad, S. Health risk assessment for human exposure by direct ingestion of Pb, Cd, Zn bearing dust in the former miners’ village of Jebel Ressas (NE Tunisia). Eur. J. Mineral. 2010, 22, 639–649. [Google Scholar] [CrossRef]
  32. Herngren, L.; Goonetilleke, A.; Ayoko, G.A. Analysis of heavy metals in road-deposited sediments. Anal. Chim. Acta 2006, 571, 270–278. [Google Scholar] [CrossRef] [Green Version]
  33. Wong, C.S.; Li, X.; Thornton, I. Urban environmental geochemistry of trace metals. Environ. Pollut. 2006, 142, 1–16. [Google Scholar] [CrossRef]
  34. Zhao, H.; Li, X.; Wang, X.; Tian, D. Grain size distribution of road-deposited sediment and its contribution to heavy metal pollution in urban runoff in Beijing, China. J. Hazard. Mater. 2010, 183, 203–210. [Google Scholar] [CrossRef]
  35. Walker, T.; Wong, T.H.F. Effectiveness of Street Sweeping for Storm Water Pollution Control. 1999. Available online: http://www.clearwater.asn.au/user-data/resource-files/CRC-Street-Sweep-Eval-1999.pdf (accessed on 12 February 2014).
  36. Final Report No WH-55; Results of the Nationwide Urban Runoff Program, 4th ed.United States Environmental Protection Agency Water Planning Division (USEPA): Washington, DC, USA, 1983; Volume 1.
  37. Sartor, J.D.; Gaboury, D.R. Street sweeping as a water pollution control measure: Lessons learned over the past ten years. Sci. Total Environ. 1984, 33, 171–183. [Google Scholar] [CrossRef]
  38. Han, Y.; Du, P.; Cao, J.; Posmentier, E.S. Multivariate analysis of heavy metal contamination in urban dusts of Xi’an, Central China. Sci. Total Environ. 2006, 355, 176–186. [Google Scholar] [CrossRef]
  39. Han, L.; Zhuang, G.; Cheng, S.; Wang, Y.; Li, J. Characteristics of re-suspended road dust and its impact on the atmospheric environment in Beijing. Atmos. Environ. 2007, 41, 7485–7499. [Google Scholar] [CrossRef]
  40. Duong, T.T.; Lee, B.K. Partitioning and mobility behavior of metals in road dusts from national-scale industrial areas in Korea. Atmos. Environ. 2009, 43, 3502–3509. [Google Scholar] [CrossRef]
  41. Joshi, U.M.; Vijayaraghavan, K.; Balasubramanian, R. Elemental composition of urban street dusts and their dissolution characteristics in various aqueous media. Chemosphere 2009, 77, 526–533. [Google Scholar] [CrossRef]
  42. Yang, T.; Liu, Q.; Li, H.; Zeng, Q.; Chan, L. Anthropogenic magnetic particles and heavy metals in the road dust: Magnetic identification and its implications. Atmos. Environ. 2010, 44, 1175–1185. [Google Scholar] [CrossRef]
  43. Fujiwara, F.G.; Gómez, D.R.; Dawidowski, L.; Perelman, P.; Faggi, A. Metals associated with airborne particulate matter in road dust and tree bark collected in a megacity (Buenos Aires, Argentina). Ecol. Indic. 2011, 11, 240–247. [Google Scholar] [CrossRef]
  44. Kong, S.; Lu, B.; Ji, Y.; Zhao, X.; Chen, L.; Li, Z.; Han, B.; Bai, Z. Levels, risk assessment and sources of PM10 fraction heavy metals in four types dust from a coal-based city. Microchem. J. 2011, 98, 280–290. [Google Scholar] [CrossRef]
  45. Kartal, Ş.; Aydın, Z.; Tokalıoğlu, Ş. Fractionation of metals in street sediment samples by using the BCR sequential extraction procedure and multivariate statistical elucidation of the data. J. Hazard. Mater. 2006, 132, 80–89. [Google Scholar] [CrossRef]
  46. Turner, A.; Simmonds, L. Elemental concentrations and metal bioaccessibility in UK household dust. Sci. Total Environ. 2006, 371, 74–81. [Google Scholar] [CrossRef]
  47. Meza-Figueroa, D. Heavy metal distribution in dust from elementary schools in Hermosillo, Sonora, México. Atmos. Environ. 2007, 41, 276–288. [Google Scholar] [CrossRef]
  48. CNEMC (China National Environmental Monitoring Centre). The Background Values of Qinghai Soils; Environmental Science Press of China: Beijing, China, 1990. [Google Scholar]
  49. Tomlinson, D.L.; Wilson, J.G.; Harris, C.R.; Jeffrey, D.W. Problems in the assessment of heavy-metal levels in estuaries and the formation of a pollution index. Helgoländer Meeresuntersuchungen 1980, 33, 566–575. [Google Scholar] [CrossRef]
  50. Yeung, Z.L.L.; Kwok, R.C.W.; Yu, K.N. Determination of multi-element profiles of street dust using energy dispersive X-ray fluorescence (EDXRF). Appl. Radiat. Isotopes 2003, 58, 339–346. [Google Scholar] [CrossRef]
  51. Jiries, A.; Hussein, H.; Halaseh, Z. The quality of water and sediments of street runoff in Amman, Jordan. Hydrol. Process. 2001, 15, 815–824. [Google Scholar] [CrossRef]
  52. Suresh, G.; Ramasamy, V.; Meenakshisundaram, V.; Venkatachalapathy, R.; Ponnusamy, V. Influence of mineralogical and heavy metal composition on natural radionuclide concentrations in the river sediments. Appl. Radiat. Isotopes 2011, 69, 1466–1474. [Google Scholar] [CrossRef]

