Article

Evaluation of the Impact of Low Emission Zone and Heavy Traffic Ban in Munich (Germany) on the Reduction of PM10 in Ambient Air

1
Statistical Consulting Unit, Department of Statistics, Ludwig-Maximilians-Universität, Akademiestr. 1, Munich 80799, Germany
2
Helmholtz Zentrum München, Institute of Epidemiology I, Ingolstädter Landstr. 1, Neuherberg 85764, Germany
3
Helmholtz Zentrum München, Institute of Epidemiology II, Ingolstädter Landstr. 1, Neuherberg 85764, Germany
4
Environment Science Center, Universität Augsburg, Universitätsstr. 1a, Augsburg 86159, Germany
*
Author to whom correspondence should be addressed.
Int. J. Environ. Res. Public Health 2014, 11(5), 5094-5112; https://doi.org/10.3390/ijerph110505094
Submission received: 31 March 2014 / Revised: 5 May 2014 / Accepted: 5 May 2014 / Published: 13 May 2014

Abstract

:
Concentrations of ambient fine particles (PM10: particles with an aerodynamic diameter ≤ 10 µm) are still exceeding current air quality standards in many European cities. In Munich (Germany), low emission zone and transit bans for heavy-duty vehicles were introduced in 2008 aiming at reduction of traffic emissions contribution to PM10. The effects of those measures on PM10 mass concentrations in Munich were investigated with a semiparametric regression model for modeling PM10 levels adjusted for time, background pollution, public holidays and wind direction. The reduction of PM10 concentration after the introduction of the measures was larger at a traffic monitoring site (13.0 %, 19.6 % in summer, and 6.8 % in winter) and smaller in urban background (4.5 %, 5.7 % in summer, and 3.2 % in winter). The effect was most pronounced on Fridays and on the weekends in summer.

1. Introduction

In recent years, epidemiological studies have shown consistent associations between exposure to air pollution and cardio-respiratory morbidity and mortality [1,2,3]. The effects were partially attributed to traffic-related air pollutants such as fine particles, diesel soot or ultrafine particles in ambient air as well as other indicators of road traffic exposures, such as living or working close to major roads or nitrogen oxides [4,5,6,7]. Besides other ambient particle sources including e.g. industry and domestic heating, traffic emissions are supposed to have a significant impact on the local air quality and to contribute to the observed adverse health effects on humans.
In 1999, the European Commission established limit values for PM10 and some other air pollutants in the Air Quality Daughter Directive 1999/30/EC [8], which was replaced in 2008 by the new Directive 2008/50/EC on ambient air quality and cleaner air for Europe [9]. The existing air quality guidelines for PM10 are currently being exceeded at many locations throughout Europe and Germany [10,11,12].
As traffic emissions are among the main contributors to anthropogenic pollutant emissions in the urban air [13], the reduction of traffic emissions offers an efficient strategy for reducing PM10 levels in urban air. One widely-used, non-technical measure to meet the policy targets for PM10 is the implementation of Low Emission Zones (LEZs). In Germany, a LEZ is a defined area (mostly located around the city centre) where the vehicles that enter have to meet certain emissions standards. For entering the LEZ all vehicles have to be identified by color coded windscreen badges which are directly linked to the corresponding stages of European emission standards (Euro 2: red; Euro 3: yellow; Euro 4: green). Petrol-driven vehicles equipped with a catalytic converter are principally assigned to the Euro 4 class and will be entitled to a green badge. In the first stage of operation all vehicles with a badge (red, yellow or green) are allowed to enter the LEZ. In stage 2, the LEZ can be accessed by vehicles displaying a yellow or green badge, whereas stage 3 of the LEZ allows access only to vehicles with a green badge.
The first measure aiming reduction of PM10 concentrations in ambient air in Munich was the introduction of a law forbidding transit of vehicles heavier than 3.5 tons through the city area on 1 February 2008. This law forces all trucks without final destination in Munich to use the motorway ring A99 round around the city area. As a second measure the first stage of the LEZ became operative at 1 October 2008. In this stage, all vehicles with Euro 1 (or worse) were no longer allowed to enter and drive within the area of the LEZ. From 1 October 2010 the second stage of the LEZ in Munich became effective; all vehicles with Euro 2 (red sticker or without any sticker) are not allowed to enter the LEZ. Stage 3 of the Munich LEZ has been in operation since 1 October 2012 and only vehicles with green batches are allowed within the LEZ.
Currently, LEZs have been implemented in 13 European countries [14]. In Germany, 49 LEZs are in operation or in the planning stages [15]. Some local authorities in Germany estimated the expected impact of the LEZ on air quality prior to their implementation (mostly by dispersion modeling). The predicted reduction of PM10 mass concentration in ambient air, which is currently regulated and therefore the focus of our examination, ranges from 2% to 10 % depending on the characteristics of the specific LEZ, its valid stage and the number of exceptional permissions for cars that fail to meet the required emission standards. However, the verifying of the predicted reduction of PM10 levels by analyzing the measured PM10 mass concentrations is difficult, due to large influence of meteorological conditions on the PM10 levels [16].
Several studies about the benefit of traffic regulation measures in European cities were already published. PM10 and CO levels decreased after the introduction of the London congestion charging scheme [17,18] and PM10 and NOX were reduced during a seven month test period of the congestion tax in Stockholm. Modest reductions in PM10 and PM2.5 were observed in four Danish cities as a consequence of the introduction of a LEZ [19]. Since the implementation of the London LEZ strong reductions of the particle number concentration were detected [20] and small changes in the PM concentration [21]. Boogaard et al. [22] found that local traffic policies were associated with reductions in PM2.5 in five Dutch cities. In spite of the challenges, there have already been a few papers analyzing the effects of the German LEZs on the improvement of air quality [16,23,24,25,26,27,28,29,30]. However, they mostly use rather simple (and varying) statistical approaches. Because these studies analyze different LEZs using different statistical methods, the results are difficult to compare insofar as different statistical approaches were used for the analyses.
In the first study of LEZ impact in Munich, the adjustment for the influence of meteorological conditions on PM10 levels was conducted with a reference monitoring station located in a regional background area close to the city [25]. A relative reduction of PM10 levels has been seen at almost all involved monitoring sites and the relative decrease ranged from 5% up to 12 %. However, this analysis was applied on a rather short period and used descriptive statistical analyses only. Morfeld et al. [30] analysed the same data set using regression analyses for matched observations of subsequent years and have not found significant effects of the LEZ.
In our study, we extended the period under investigation and improved the statistical approach of the analysis. We restrict here our analysis only on the PM10 particle fraction. One reason for this restriction is that there are no data on other relevant particle characteristics (such as PM2.5, Black Smoke or particle number concentration) available for Munich. Secondly, LEZs were introduced in Germany as a primary measure for reducing PM10 and consequently the public debate about the effectiveness of LEZs is mainly focused on changes in this particle fraction. We compared the PM10 concentrations before and after the LEZ implementation by applying of a semiparametric statistical model with first-order autoregressive errors on data in a time resolution of one hour. The estimated PM10 levels were adjusted for PM10 exposure at the reference station, wind direction, season, time throughout a week, and public holidays. Two questions were of interest: First, we investigated, whether a significant overall reduction of PM10 levels adjusted for possible confounders could be detected following the implementation of the measures in Munich and whether the effect at the street site differed from the urban background site. Second, we examined the seasonal and diurnal variation of the air quality changes, which might have originated in the variations of the number of vehicles and of the composition of the vehicle fleet.

2. Materials and Methods

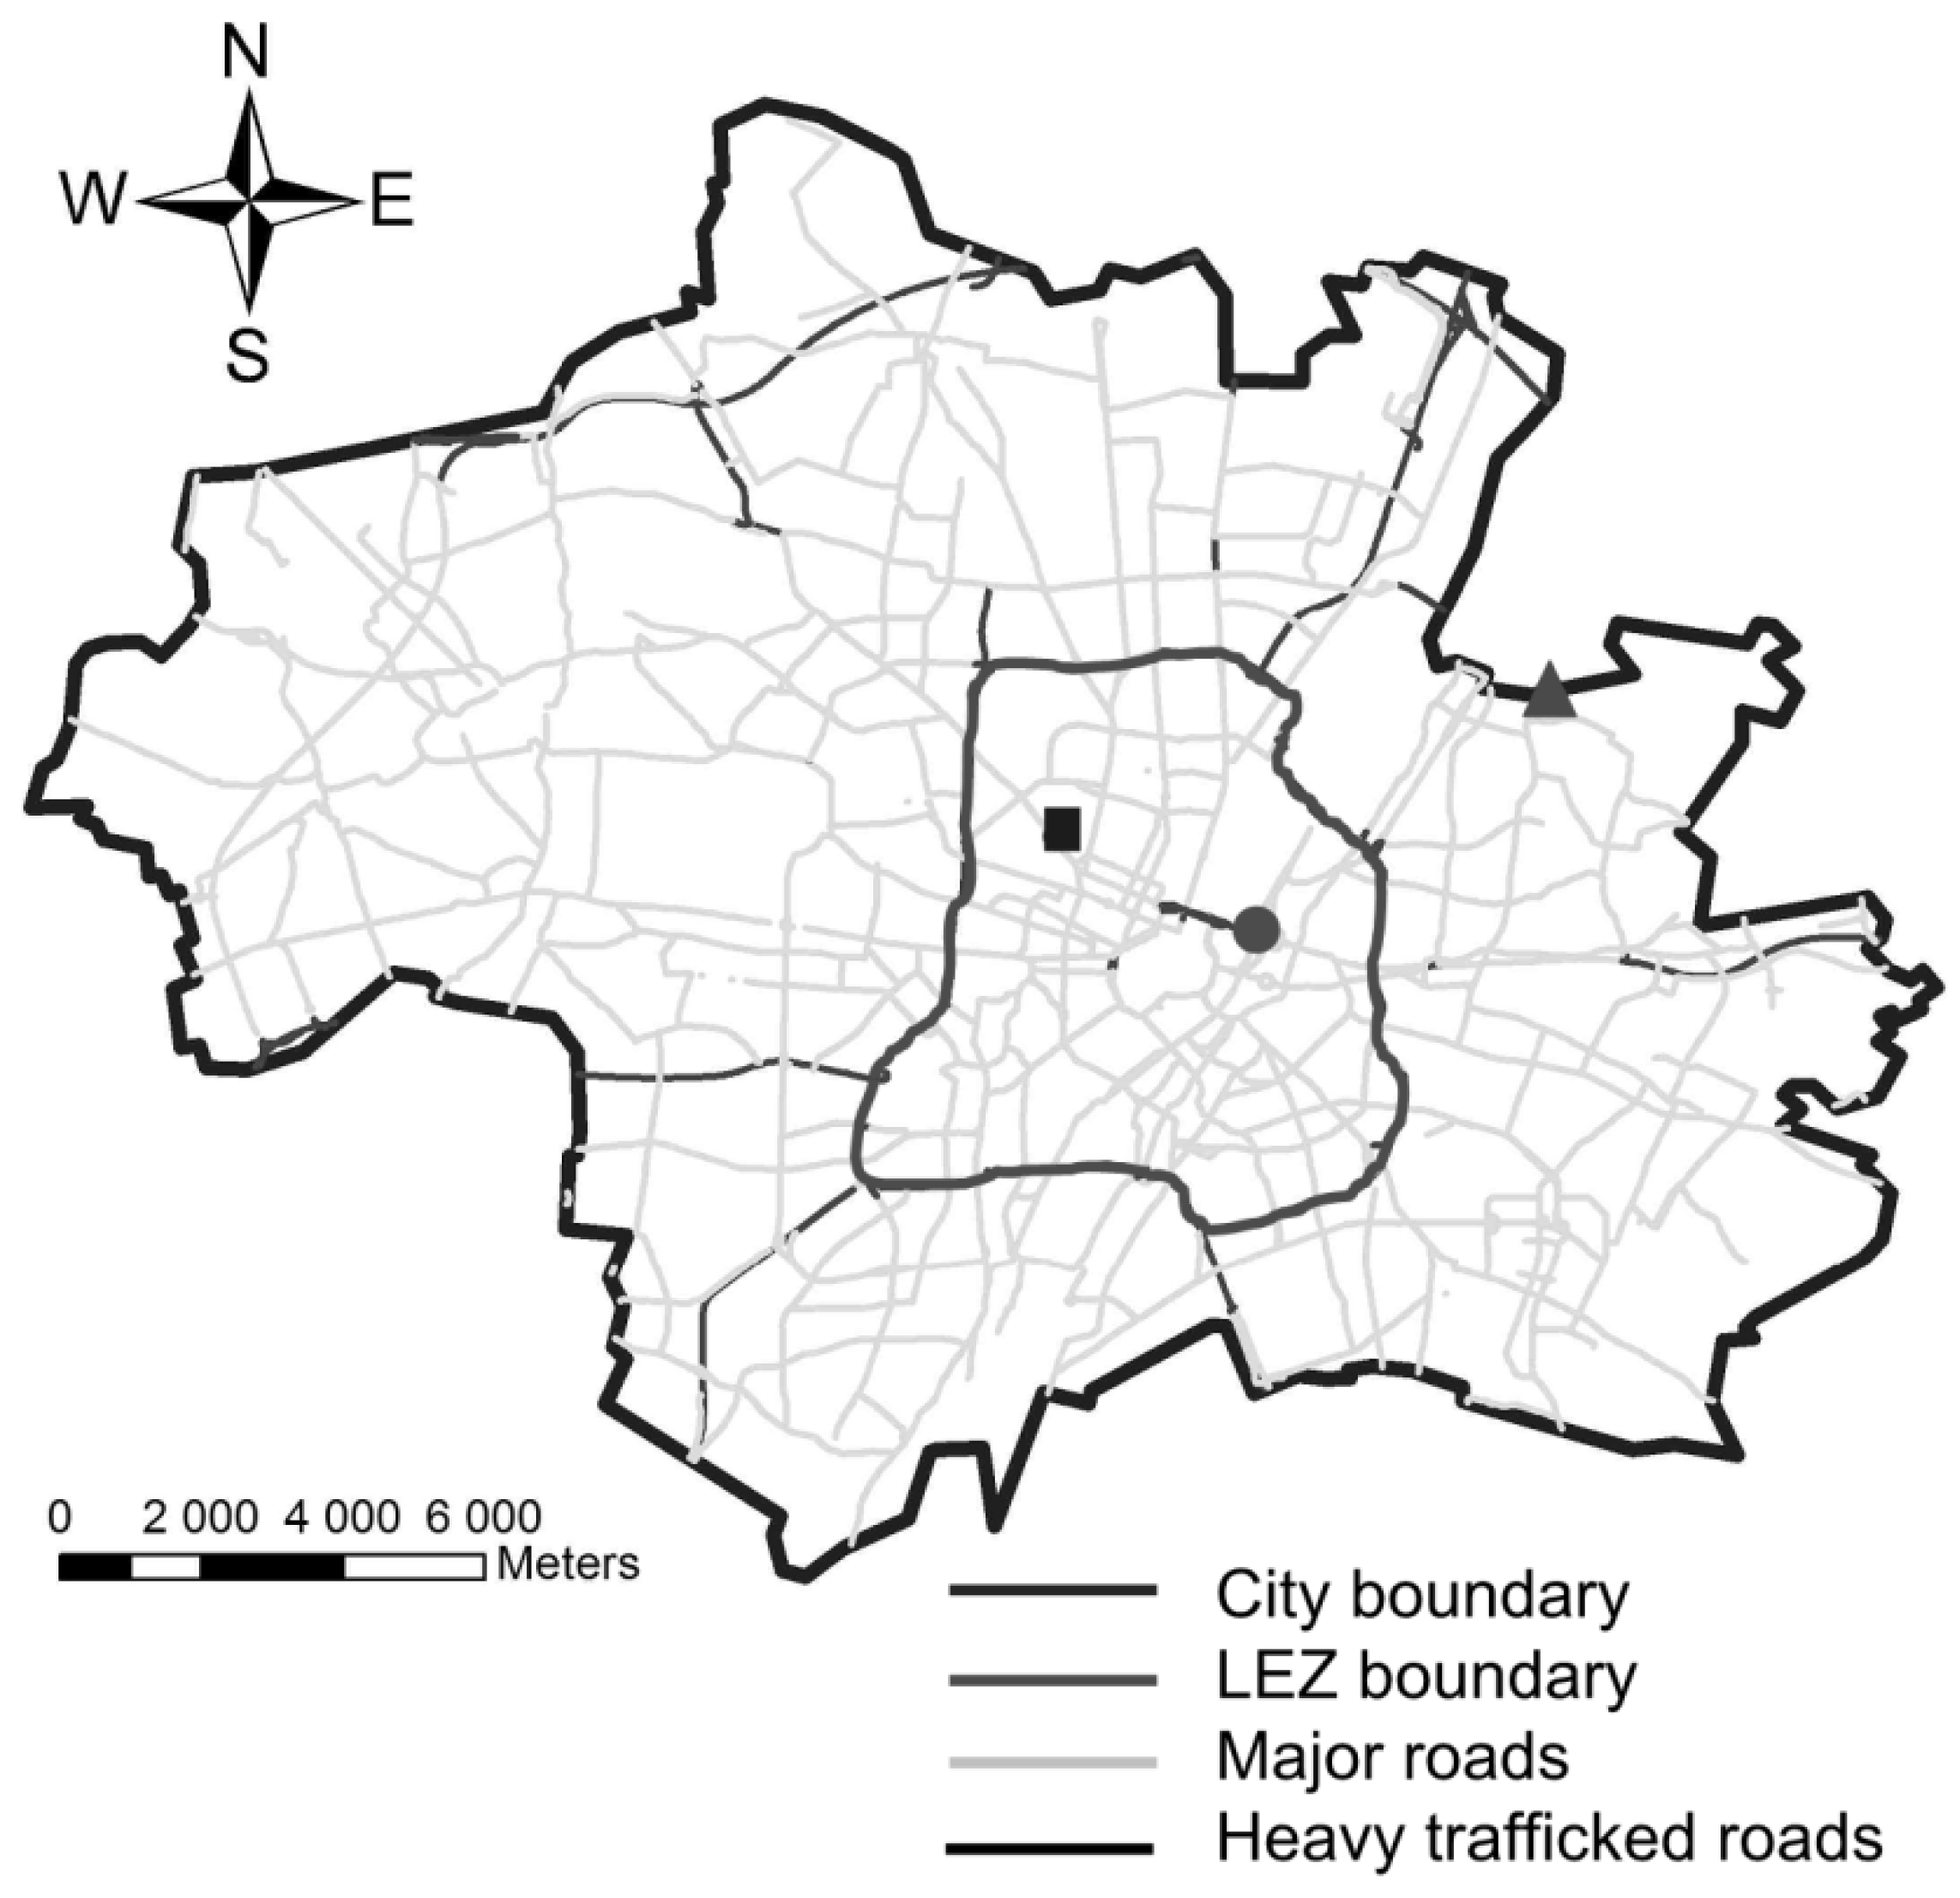
2.1. Study Area and Selection of the Monitoring Stations

The study was conducted in Munich, Germany. In 2011, Munich had a population of approximately 1.41 million inhabitants in an area of 310.4 km2 and there were approximately 700,000 registered cars [31]. The LEZ in Munich covers 44 km², which accounts for 14 % of the whole city area. However, 32 % of the city population lives in this area (Figure 1).
Figure 1. Locations of the LÜB monitoring sites in Munich, Germany: Prinzregentenstrasse (●), Lothstrasse (■), Johanneskirchen (▲).
Ijerph 11 05094 g001
For our study, we obtained PM10 data collected at two monitoring sites located within the LEZ: one urban background site, Lothstrasse (measurement height: 4 m over ground) and one street site, Prinzregentenstrasse (measurement height: 2.9 m over ground; distance to road: 3 m; 39,000 vehicles/day in 2007–2010) [32,33]. The local traffic contributes with 22 % to the PM10 levels at the measurement site Prinzregentenstrasse and to 6 % at the site Lothstrasse [33]. A regional background site in the outskirts of the city and outside the LEZ in Johanneskirchen was selected as a reference site (measurement height: 4 m over ground; distance to road: 5 m). All three monitoring stations are operated by the Bavarian Environment Agency (Bayerisches Landesamt für Umwelt, Augsburg, Germany) as part of the Bavarian Monitoring System for Air Quality (LÜB: Lufthygienisches Landesüberwachungssystem Bayern) (Figure 1). The remaining three monitoring stations were not involved in the analysis and are not shown in Figure 1. Two of them (Luise-Kiesselbach-Platz, Landshuter Allee) are located at the border of the LEZ and one (Stachus) were excluded as construction and tram track maintenance was conducted between August 2008 and April 2010 in the vicinity of this monitoring site.

2.2. Study Period and Data

In our analysis, we compared the PM10 concentrations measured prior to the implementation of any air quality measures (period 1) with the PM10 levels measured after the measures became effective (period 2).
Data on PM10 mass concentrations in an hourly time resolution were used for the analysis. The analysis period 1 was selected from 1 February 2006 until 31 January 2008. In the period between 1 February 2008 and 30 September 2008, only a truck transit ban was effective. This period was excluded from the analysis because it was too short to draw general conclusions. The examination period 2 (both transit ban for heavy-duty vehicles and LEZ in stage 1 were effective) covered the rest of the data between 1 October 2008 and 30 September 2010. PM10 records at the Prinzregentenstrasse were only available until 31 June 2010, because the station was closed. The PM10 values on 1 January were excluded from the analysis for each year due to the traditional New Year’s Eve fireworks.
Hourly measurements of the wind direction in 36 angle categories representative for the city of Munich (measured ca. 4 km northwest of the inner city of Munich) were obtained from the German National Meteorological Service.

2.3. Statistical Analysis

The urban PM10 levels were assumed to be mainly driven by the following factors: The measurements at the reference station represented the regional background pollution level, which was mostly not affected by the measures. Therefore, the PM10 levels of the reference station reflected the changes of the PM10 levels of the station of interest owing to meteorological conditions, the background PM10 levels and long term temporal trends in PM10. Despite large scale effects of the wind direction, which were represented through the reference station, local effects of the wind direction occur due to the position of the measurement stations in the local vicinity, e.g. regarding to nearby factories or park areas.
Since our data comprise only four years of measurements, long term temporal trends at the stations within the LEZ beyond the trends at the reference station could not be considered in the model and are of minor relevance. However, seasonal variation in PM10 concentration occurred (see Supplemental Material, Figure S1), which possibly may change the effect of the measures. Hourly PM10 levels are subject to daily cyclic variation due to heating and also due to traffic; therefore, the measures may also affect the temporal pattern of PM10 levels. Public holidays during weekdays may yield deviations from the usual concentration levels.
A semiparametric model with first-order autoregressive errors (refer to Clifford et al. [34] for a Bayesian implementation of a similar model for ultrafine particle number concentrations) was used to estimate the association between air pollution and the introduction of measures:
log(PM10x) = β0 + β1 log(PM10ref) + βSM · ISM + βW · IW + βWM · IWM + fS(hour) · IS + fSM(hour) · ISM + fW(hour) · IW + fWM(hour) · IWM + fwd(wind direction) + β2(public holiday) + ε .
The effects of the corresponding covariates were denoted with β.The outcome variable was the logarithmically transformed PM10 mass concentration at an urban station, which is denoted by log(PM10x). IS, IW, ISM, IWM denote the indicator function for “summer without measures”, “winter without measures”, “summer with measures” and ”winter with measures”, respectively. The winter season was defined from October to March, the summer season from April to September.
The following variables were considered as confounding factors: logarithmically transformed PM10 levels at the reference station (log(PM10ref)), a smooth, cyclic effect based on P-splines with maximum four degrees of freedom of the wind direction, fwd(wind direction), and an indicator for public holidays (public holiday). Adjusting for the PM10 measurements at the reference station prevents from “regression to the mean” [35], improves the power of the model in comparison to the analysis of differences [36] and allows flexible and simple adjustments for other confounders. We selected the confounder variables by a priori considerations. Since we include an adjustment by the reference station with similar temperature and precipitation, we did not use these variables in the confounder model. Since wind direction has a local effect, which differs from the effect at the reference station, we included the variable wind direction in our model.
In addition, the model was adjusted for deterministic seasonal components, similar to [37]. The effect of the measures (M) was analyzed separately for summer (S) and winter (W) to allow for seasonal variability. Daily and daytime-specific deviations were modeled with an hourly-resolved weekly season-specific trend, fS(hour) · IS, fSM(hour) · ISM, fW(hour) · IW, fWM(hour) · IWM Cyclic penalized splines were used as basis functions for a smooth nonparametric estimation. Permitting a maximum number of 49 degrees of freedom, the model reached enough flexibility to describe the daytime dependent variability of the traffic.
Percentage changes of PM10 levels were modeled through logarithmic concentration levels [37]. In particular, it was suggested that the measures, the public holidays and the seasons yielded to percentage effects on the PM10 concentration.
Note, that the usage of the semiparametric model lessens the problem of scale. Furthermore, the highly skewed distribution of the PM10 mass concentration was another reason for using the logarithmic transformation.
Since the measurements are not independent, an autoregressive process of order 1 is simultaneously modeled for the error term ε.
The overall effect of the measures was examined for each of the two seasons with a test on the hypotheses whether the effect coefficients for winter and summer differ between the periods with and without measures:
H0 : βW = βWMSM = 0
Day-specific effects were investigated using an appropriate linear combination of the effect coefficients, representing the area between the smooth effect with and without measures. The inference for the day-specific effects was based on the asymptotic normality of linear combinations (for more details see Supplemental Material, “Modelling of day specific effects”).
Statistical calculations were conducted using R [38], version 2.15.3; semiparametric models were estimated with the package “mgcv” [39], version 1.7-22.

3. Results

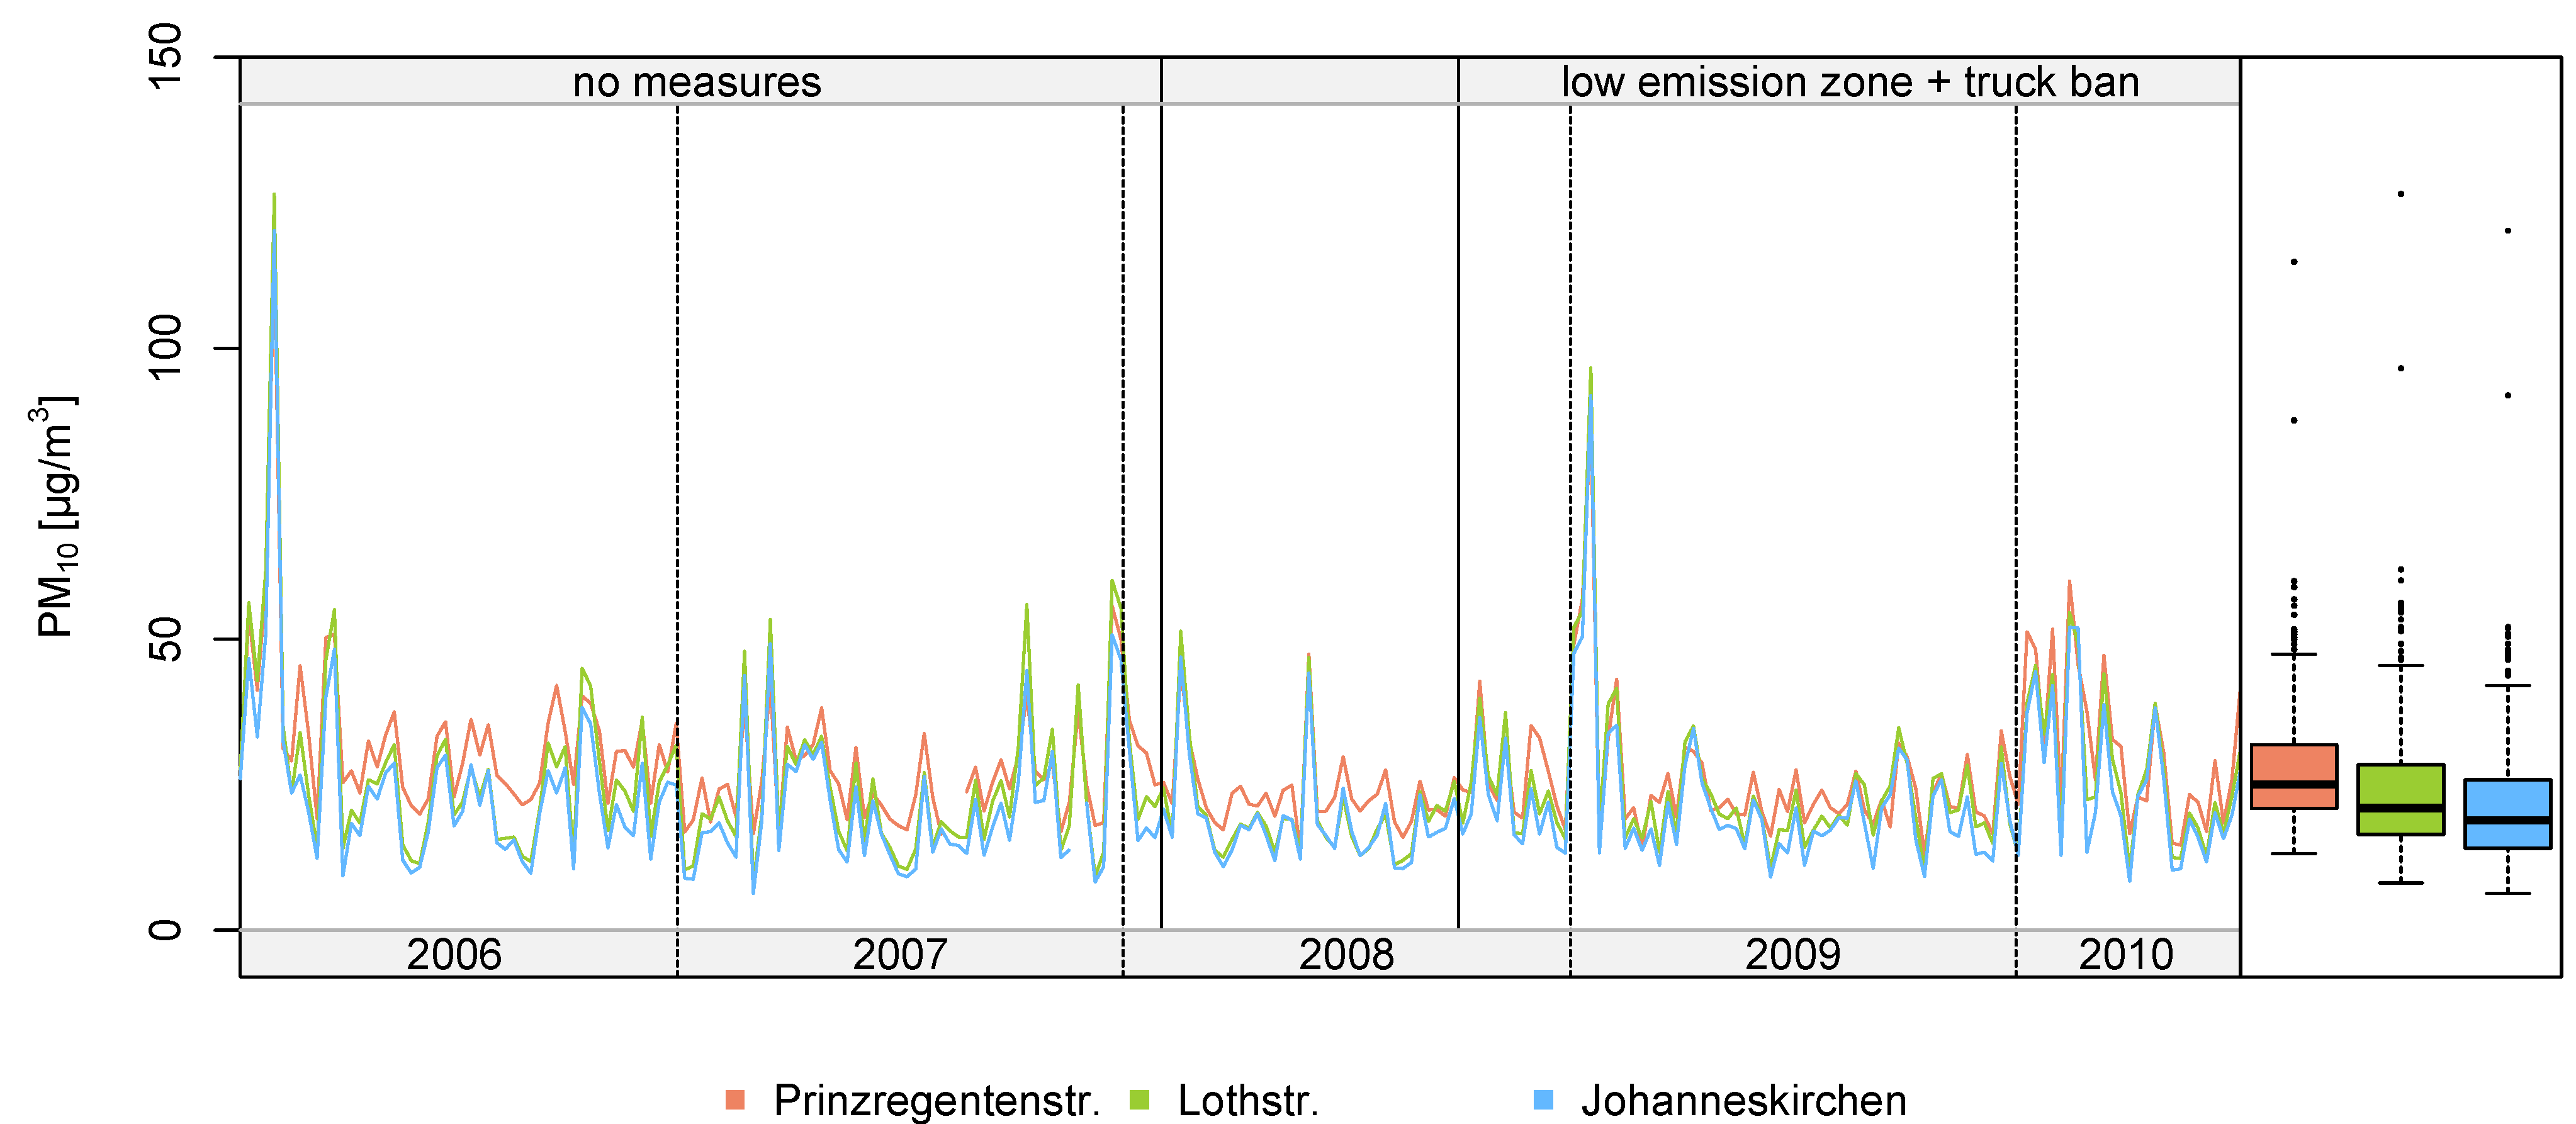
3.1. Data Description

Figure 2 shows the weekly means of PM10 concentrations at the two monitoring sites within the LEZ (Prinzregentenstrasse and Lothstrasse) and at the reference site in Johanneskirchen. Weekly means were chosen to display the trend of PM10 levels for reasons of clarity and reducing the point-to-point variation.
Figure 2. Time series of weekly averages of PM10 concentrations at three monitoring sites in Munich, Germany (Prinzregentenstrasse, Lothstrasse, and Johanneskirchen). The three boxplots (on the right-hand side) describe the respective distributions the PM10 concentrations at the three sites ignoring the temporal structure.
Ijerph 11 05094 g002
The PM10 concentrations were higher in the winter season and lower in the summer season. In particular, elevated PM10 levels were observed between January and March. The means of the unadjusted PM10 mass concentrations before and after the implementation of measures are given in Table 1.
At both urban stations, a decrease of PM10 in period 2 (compared to period 1) was observed. The decrease at Prinzregentenstrasse (−14.0% in summer, −1.9% in winter) was larger in summer and similar in winter as at Lothstrasse (−2.3% in summer, −2.5% in winter). At the reference station in Johanneskirchen, also differences between the two periods were detected (−2.1% in summer, −0.8% in winter). The PM10 concentration was on average 27.6% at Prinzregentenstrasse and 12.5% at Lothstrasse higher (median percentage difference) than at the reference station. While considering mere mean concentrations the impact of confounding factors like meteorological conditions were disregarded; the regression analysis in section 3.2 allowed for these confounders. The Spearman correlation coefficients between the hourly means of PM10 concentration measured at the three monitoring sites were high and ranged from 0.69 to 0.88, the correlations between the daily averages were even slightly stronger (ranged from 0.83 to 0.96). The hourly PM10 concentrations at the three monitoring sites were highly autocorrelated with autocorrelation coefficients between 0.87 and 0.92. The temporal trend of the annual means observed at the urban background site Lothstrasse and the regional background site (as the reference site) in Johanneskirchen was very similar. It indicates that both sites were not influenced by any local sources of PM. Even more, the PM10 values obtained at the measurement site in Johanneskirchen were very similar and strong correlated with the PM10 values observed at a regional background site located at the campus of the Bavarian Agency for Environmental Protection in Augsburg, Germany (about 90 km linear distance from Johanneskirchen).
Table 1. PM10 means in Munich for the periods with (October 2008–September 2010) and without (February 2006–January 2008) measures and the corresponding differences in % separated by season (Summer: April–September; Winter: October–March).
Measurement StationSeasonWithout MeasuresWith MeasuresPercentage Difference
nPM10 mean (SD)nPM10 mean (SD)
Prinzregentenstr.Summer8,20027.2 (14.3)6,53523.4 (14.5)−14.0
Winter8,56230.8 (21.6)8,67630.2 (23.6)−1.9
Lothstr.Summer8,76921.3 (12.9)8,73020.8 (15.3)−2.3
Winter8,52028.3 (23.6)8,68727.6 (22.0)−2.5
JohanneskirchenSummer8,76519.3 (12.2)8,76818.9 (12.3)−2.1
Winter8,45124.3 (21.6)8,68624.5 (20.8) 0.8

3.2. Statistical Modeling

According to equation (1), the PM10 concentrations at a specific monitoring site were calculated for “summer without measures” and “winter without measures” as well as “summer with measures” and “winter with measures”, respectively. In Table 2, the relative differences between the periods with and without measures are shown for Prinzregentenstrasse (street site) and Lothstrasse (urban background site), and indicated separately for the summer and winter season.
Table 2. Change of PM10 concentration a in period 2 when compared to period 1 at Prinzregentenstrasse and Lothstrasse.
Measurement StationSummerWinter
effectconfidence intervalp-valueeffectconfidence intervalp-value
Prinzregentenstr.−19.63%(−22.75%, −16.52%)<0.001−6.80%(−10.14 %, −3.47 %)<0.001
Lothstr.−5.73%(−7.71%, −3.74%)<0.001−3.18%(−5.24 %, −1.11 %) 0.003
Note: adjusted for exposure at the reference station, wind direction, day of the week, time of the day and public holidays.
The effects of the air quality measures differ at the two measurement stations as well as between the seasons. A stronger reduction in PM10 mass concentrations was observed at the street site; on average 19.6% (5.4 µg/m3, p-value: <0.001) in summer and 6.8% (2.1 µg/m3, p-value: <0.001) in winter, respectively. At the urban background site Lothstrasse smaller decreases were estimated: 5.73% (1.1 µg/m3, p-value: <0.001) in summer and 3.18% (0.7 µg/m3, p-value: <0.003) in winter. If we had not have determined separate effects for the two seasons, the reduction of the PM10 concentration by the measures at Prinzregentenstrasse would have been estimated with 13.0% (p-value: <0.001) and with 4.5%; (p-value: <0.001) at Lothstrasse.
Figure 3 shows the temporal patterns of the modeled PM10 concentrations at Prinzregentenstrasse and Lothstrasse for the periods with and without measures (adjusted for PM10 concentration at the reference station, wind direction and public holidays). Temporal variability of PM10 levels occurred between the seasons, the weekdays and times of day. The concentrations were higher in the winter months. The morning and afternoon rush hour peaks during the working days were clearly visible especially at Prinzregentenstrasse. The morning peak in the summer months was more clearly separated from the afternoon peak as in the winter season. The efficiency of the measures depended on the time of the day (see also Supplemental Material, Figure S2) and followed a diurnal pattern. Due to the implemented measures the PM10 burden was stronger reduced during hours with higher relative and absolute PM10 mass concentration, i.e. between the morning and afternoon rush hour peaks. The rush hour peaks themselves were reduced and there seemed to be lesser spillover from the morning to the afternoon. Furthermore, the improving of air quality during the nights on workdays was faster at the street site. The effect of the measures vanishes during night-time of the first days of the working week.
The mean daily effects of both measures (stratified by season and week day) are shown in Figure 4 for each day of the week separately. In the summer season, the effect of the measures for each day of the week was at the street site stronger than in winter, whereas this tendency is not observed at the background site. However, at both sites the strongest effects were observed on Fridays (−25.0% in summer and −16.4% in winter at street site, −8.2% in summer and −6.1% in winter at the background site) and Saturdays (−25.9% in summer at street site, −11.4% in summer and −5.3% in winter at the background site). On Sunday a strong seasonal dependency of the effect was observed: the measures were only effective in summer.
The effects of the linearly modeled confounding covariates are displayed in Supplemental Material, Table S1. The logarithmic values of the reference station had a significant, additive effect of log(1.381) = 0.323 at Prinzregentenstrasse and log(1.972) = 0.679 at Lothstrasse. Public holidays led to a reduction of PM10 levels in the ambient air by approximately 13%. Since the estimated autocorrelation coefficient was relatively high (Prinzregentenstrasse: ρ = 0.70, Lothstrasse: ρ = 0.54), the bigger part of the autocorrelation of the PM10 measurements could not be explained through the inclusion of the smooth components in the predictor. The model for the measurements at Prinzregentenstrasse explained 74.5% of the variability in the data and the model for the Lothstrasse 83.0%.
The shape of the smooth effect of wind direction indicates decreased PM10 levels, if the wind blew from the South or West at Lothstrasse and if the wind blew from North or East at Prinzregentenstrasse (data not shown). We focused our analysis on PM10, because the reason for the establishment of the LEZ exceeded PM10 limit values.
Figure 3. Modeled hourly concentrations of PM10 at Prinzregentenstrasse (first and second chart) and Lothstrasse (third, fourth chart) adjusted for PM10 at the reference station, wind direction and public holidays.
Ijerph 11 05094 g003
Figure 4. Mean daily effects of the measures stratified by season and day of the week with 95% confidence intervals for Prinzregentenstrasse (above) and Lothstrasse (below).
Ijerph 11 05094 g004

4. Discussion

4.1. Impact of the Measures on PM10 Mass Concentration

We investigated whether changes in PM10 levels after the introduction of a truck transit ban through the city area and the implementation of the first stage of the LEZ in Munich could be detected by analysis of emission data on PM10 mass concentration collected at an urban background and a street monitoring site. The comparison of the PM10 mass concentrations (adjusted for exposure at the reference station, wind direction, day of the week, time of the day and public holidays and calculated separately for summer and winter seasons in a semiparametric model with first-order autoregressive errors) showed a large relative decrease of PM10 levels at the street site (13.0%, p-value: <0.001), whereas the relative decrease observed at the urban background monitoring site was smaller (4.5%, p-value: <0.001). The decrease of PM10 mass concentration predicted in Munich by dispersion modeling ranges between 2% and 10 % depending on the monitoring sites and the active stage of the LEZ [40]. The maximal reduction (up to 10 %) was predicted only for the third stage of the LEZ. The changes of PM10 concentrations detected at the street site in our study are larger than the reductions predicted a priori and are also larger than those observed in the most other German cities [16,23,24,26,27,28,29].
In general, the implementation of LEZ could influence the composition of the car fleet as well as the traffic intensity. The percentage of registered vehicles without any badge (Euro 1 or less) decreased during the time period 2007–2010 from 9.2% to 2.5% for passenger cars and from 31.5% to 24.1% for trucks, respectively. In the same time the percentage of vehicles with green badge increased from 78.4% to 89.6% for passenger cars and from 19.0% to 36.1% for trucks, respectively. Those changes are especially pronounced between the years 2007 and 2008, it means immediately before the implementation of the LEZ in Munich [41]. Such an extraordinary modernization of vehicle fleet in the city towards low-emission cars was reported also for Berlin [28]. Note that there is only information about the in Munich registered vehicles; no such information is available about the car fleet composition in flowing traffic in the city. Regarding the flowing traffic it can be assumed that the older vehicles are less often in use compared to the newer vehicles.
For the dispersion modelling, it was assumed that the traffic intensity remained constant over the time period 2007–2010. However, the analyses presented here are not only considering the impact of the LEZ alone, but also the additional impact of the transit ban for all trucks. The transit ban for trucks could affect the PM10 levels even to a larger extent than the LEZ, which operated in the analyzed period in the first stage only. It leads not solely to a reduction of particles emitted by vehicle exhaust, but also to a reduction of particles originated from tyre and brake wear or dust re-suspension. Due to the ban on driving for trucks on Sunday, the effect for Sunday can be directly ascribed to the implementation of the LEZ. A similar pattern was found for Saturday, but only at Prinzregentenstrasse. This lead us to the assumption that in winter, the vehicle fleet on weekends in the city and on Sundays in the urban background was the same before and after the introduction of the LEZ, whereas this was not the case during the summer season.
In the previous study estimating the LEZ impact in Munich, a slightly weaker effect of 12.3% relative reduction of PM10 mass concentration at Prinzregentenstrasse was found [25]. The analysis was based on the comparison of relative PM10 concentration changes by a reference station. However, such analysis of the quotient between the specific monitoring station and the reference station neglects the uncertainty of the measurements at the reference station. Further regression analyses on the ratio as used in the previous study revealed a comparably poor model fit (data not shown). This is also denoted by the strong deviation of the estimation of the intercept from 1 in our analysis. For comparison, we also analyzed the same period as described in Cyrys et al. [25] by use of the model applied in our study. We only found negligible (statistically insignificant) changes of the PM10 mass concentration (Prinzregenstrasse −1.05%, p-value: 0.855; Lothstrasse: 2.42%, p-value: 0.499), as it was similarly found by Morfeld et al. [30]. For further comparisons of the approach used in our study with other modelling approaches we refer to the “comparison of different modeling approaches” section in the Supplemental Material.
The results of our study are not directly comparable to the results obtained for other measures of traffic reduction, which were already introduced in some European cities. We analyzed here the common effect of the implementation of LEZ and transit ban for trucks in Munich and we are aware that such combination is not that common. Even if we might be able to evaluate the effects of the LEZ and transit ban for trucks separately, the comparison with other cites might remain difficult, as the regulations and areas of LEZ’s differ from city to city. The following discussion should compare rather roughly the range of the effects observed for different measures across Europe. Several studies analyzed the impact of congestion charging in London [17,18,42]. Atkinson et al. [17] observed reductions in PM10 only at the background monitor. The study conducted by Beevers and Carslaw [18] indicated that NOx and PM10 emissions have been reduced by about 12% in the charging zone, whereas the study of Tonne et al. [42] showed that the congestion charge schema led to only modest reductions in air pollutant concentrations across Greater London, but greater reductions in the charging zone. Ellison et al. [21] found that the LEZ in London had a significant effect on the composition of the vehicle fleet in London and reduced the PM10 concentrations.
Johansson and colleagues [43] assessed the effect of traffic congestion in Stockholm and concluded that the annual average NOx and PM10 concentrations along the most densely trafficked streets would be lower by up to 12% and 7%, respectively. Note that the effects in the studies of Beevers and Carslaw [18], Tonne et al. [42] and Johansson et al. [43] were analyzed by dispersion modelling combined with regression calculation and were not verified by air quality measurements. PM2.5 concentrations in Copenhagen were reduced by 5% after the introduction of the LEZ [19]. Unadjusted mean pollutants concentrations were lower after the implementation of the LEZ in five Dutch cities; the reduction in PM2.5 levels was larger at urban streets (31%) than in the suburban background (20%) [22].
The public debate is often focused solely on PM10 concentrations (as this parameter is currently regulated) without taking into account that only the toxic fraction of PM10 causes adverse human health effects [2,3,16]. Due to combustion processes particles originating from traffic exhibit a higher toxicity than particles from other sources; especially diesel-engine vehicles, which produce about 12% of the mean PM10 exposure of the German population [44], emit these more toxic particles.
Hence, the effectiveness of LEZ could be analyzed more precisely if Black Smoke (as marker for diesel soot) or the organic fraction of particles would be measured in ambient air instead of total PM10 concentration [16]. Unfortunately, in Germany no routine measurements of Black Smoke concentrations in ambient air are conducted. Quadir and colleagues [45] reported recently significant lower concentrations for elemental carbon and some of particulate organic compounds after the introduction of the LEZ in Munich (the data were collected during special monitoring campaigns and not routinely by the monitoring network). Source apportionment analysis showed a reduction of traffic factor contribution by 60% after the implementation of the LEZ [45]. Also in Berlin the concentration of soot particles decreased 2010 by 52% compared with 2007 [29]. As climatic conditions in the years 2008–2010 were adverse when compared to 2007, the authors attribute these results to the reduced traffic soot emissions. Currently, a debate about the pollution through PM2.5 emerges, but the data material is insufficient because the monitoring of PM2.5 is only at its early stages.
In addition to dispersion modelling, estimating the expected changes of PM10 mass concentration in the ambient air, our analysis evaluates the effects of the measures by analysis of the measured PM10 values. However, the limitation of this strategy is, that also long-term changes of PM10, which could not be explained by the included predictors, especially by the PM10 levels of the reference station (for example changes in heating habits), are completely attributed to the LEZ effect.

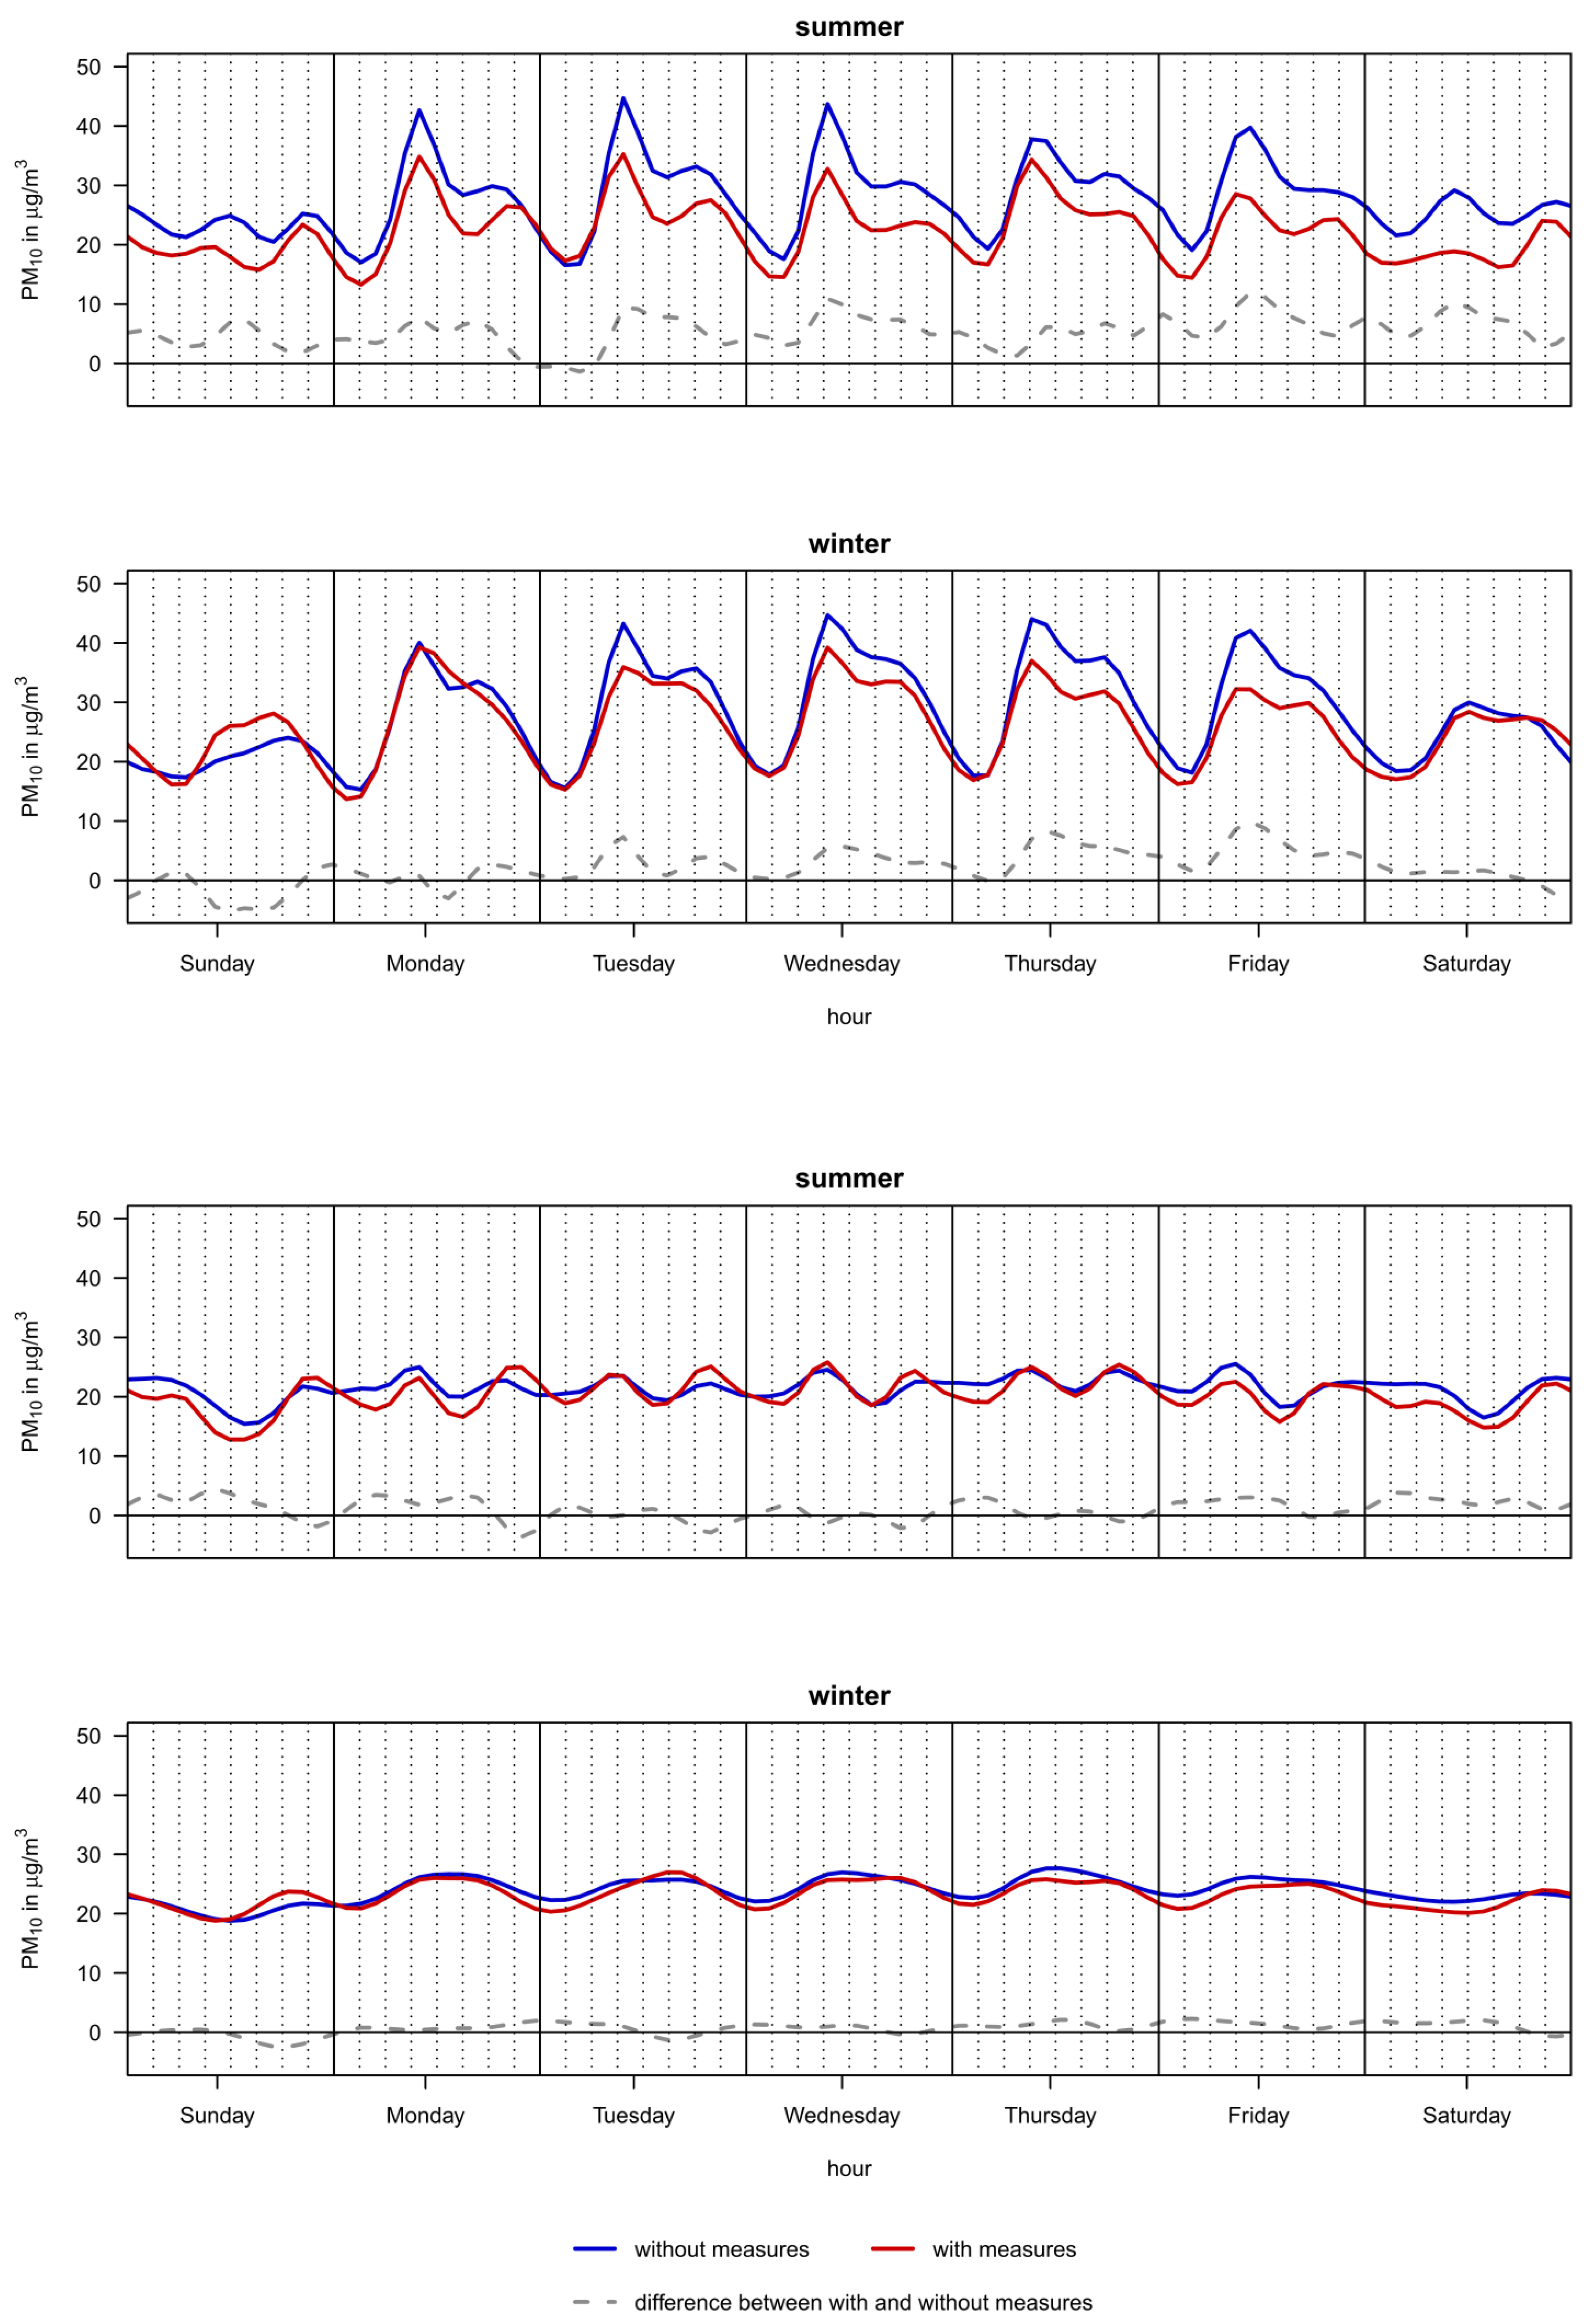
4.2. Seasonal and Diurnal Variation of the Changes in PM10 Levels

The second objective of this study was the examination of the seasonal and diurnal variation of the detected air quality improvements. The extent of the PM10 reduction at the background sites was largely similar in both seasons. In the urban background, exhaust particles represent a smaller fraction of fine particles compared to street site and the composition of particles varies less between winter and summer. On the contrary the difference between the two seasons was more pronounced at the street site, where the overall reduction of PM10 mass concentrations was considerable larger as at the background site. At this site, the reduction of PM10 levels due to the measures was larger during the summer season and smaller during the winter season. In winter, additional particle sources (such as domestic heating, wood combustion or combustion of other fossil fuels) contribute significantly to the PM10 mass concentrations in the ambient air. Also the contribution of re-suspended dust to fine particles concentration in the ambient air increases in winter due to the application of road salt for deicing. In addition, the generation of secondary aerosols such as nitrate or sulfate is more intensive in winter. Consequently, exhaust particles represent a smaller fraction of the fine particles in winter than in summer. Therefore, the measures regulating only the exhaust particles became less effective in the winter period. In addition, adverse meteorological conditions leading to increased PM10 levels from local mobile as well as stationary sources are occurring more frequently in the winter season. Our analysis suggests that in such episodes the influence of the implemented measures regulating the car exhaust is limited and that air quality is dominated by other unaffected mobile and stationary sources.
The reduced rush hour peaks may indicate that a larger proportion of old cars no longer accessed the city during midday. Alternatively, the contribution of aged particles from the morning rush hours during day and night time might be shifted due to the reduction in diesel particles. Further, the temporal varying effect of the measures could be caused by the same reason as the differences between winter and summer season. One has to keep in mind that the morning and afternoon rush hour peaks seem to be more separated in summer not due to differences in traffic flow between summer and winter, but as a result of the combination of increased traffic intensity and increased solar radiation in summer.

5. Conclusions

In our study we evaluated the effectiveness of two measures (a truck transit ban through the city area and implementation of LEZ) on the reduction of PM10 mass concentrations in the ambient air in Munich, Germany. The analysis of the routinely collected PM10 mass concentrations data by a semiparametric regression model showed statistically significant reduction of PM10 levels at a monitoring site located in the direct vicinity of a highly frequented road and to a lesser extent at an monitoring site located in the urban background. The statistical regression modeling was essential to identify the size of the effect. The magnitude of the effect at the street site was larger in summer season; smaller seasonal variation was observed at the urban background site. In general, the magnitude of the effect depends on day of the week, time of the day and location of the monitoring site.
Our analysis indicates that the assessment of the impact of measures aiming improvement of air quality in urban air could be conducted by use of routinely collected PM10 data. However, as the expected reduction of PM10 concentration after implementation of LEZ is in order of about 10%, the evaluation of this measure by PM10 data remains difficult; other particulate variables, such as PM2.5, Black Smoke, or particulate organic compounds are recommended for such evaluation.

Acknowledgments

We would like to thank Heinz Ott from the Bavarian Environmental Agency (Bayerisches Landesamt für Umwelt, Augsburg, Germany) for providing the air pollution and meteorological data. We also wish to thank Mainsi Marowsky-Köppl for data management and quality control of the final data set and Kathrin Wolf for preparation of Figure 1. We further acknowledge the provision of weather data from the German National Meteorological Service (DWD). The contribution of Annette Peters has been supported by the US Environmental Protection Agency STAR center grant RD 832415 (EPA Particulate Matter Centre, Rochester, NY., USA). The contribution of Josef Cyrys and Jianwei Gu was supported by EU ERA-ENVHEALTH grant agreement No. 219337.

Author Contributions

Josef Cyrys provided the data. Josef Cyrys, Veronika Fensterer, Helmut Küchenhoff developed the strategy of the analysis. The statistical analysis was conducted by Veronika Fensterer supported by Verena Maier and supervised by Helmut Küchenhoff, Josef Cyrys and Veronika Fensterer wrote the manuscript and the Supplementary Material. Susanne Breitner, Jianwei Gu, Helmut Küchenhoff, Verena Maier, Annette Peters, and Heinz-Erich Wichmann gave conceptual advice.

Conflicts of Interest

The authors declare no conflict of interest.

References

  1. Pope, C.A., III; Dockery, D.W. Health effects of fine particulate air pollution: Lines that connect. J. Air Waste Manage. Assoc. 2006, 56, 709–742. [Google Scholar] [CrossRef]
  2. Rückerl, R.; Schneider, A.; Breitner, S.; Cyrys, J.; Peters, A. Health effects of particulate air pollution: A review of epidemiological evidence. Inhal. Toxicol. 2011, 23, 555–592. [Google Scholar] [CrossRef]
  3. Air Quality Guidelines: Global Update 2005: Particulate Matter, Ozone, Nitrogen Dioxide and Sulfur Dioxide; WHO Regional Office for Europe: Copenhagen, Denmark, 2006.
  4. Adar, S.; Kaufman, J. Cardiovascular disease and air pollutants: Evaluating and improving epidemiological data implicating traffic exposure. Inhal. Toxicol. 2007, 19, 135–149. [Google Scholar] [CrossRef]
  5. Brugge, D.; Durant, J.L.; Rioux, C. Near-highway pollutants in motor vehicle exhaust: A review of epidemiologic evidence of cardiac and pulmonary health risks. Environ. Health 2007, 6, 1–12. [Google Scholar] [CrossRef]
  6. Salam, M.T.; Islam, T.; Gilliland, F.D. Recent evidence for adverse effects of residential proximity to traffic sources on asthma. Curr. Opin. Pulm. Med. 2008, 14, 3–8. [Google Scholar] [CrossRef]
  7. Samet, J.M. Traffic, air pollution, and health. Inhal. Toxicol. 2007, 19, 1021–1027. [Google Scholar] [CrossRef]
  8. Council Directive 99/30/EC of 22 April 1999 Relating to Limit Values for Sulphur Dioxide, Nitrogen Dioxide and Oxides of Nitrogen, Particulate Matter and Lead in Ambient Air. Available online: http://eur-lex.europa.eu/legal-content/EN/TXT/?uri=CELEX:31999L0030 (accessed on 7 May 2014).
  9. Directive 2008/50/EC of the European Parliament and of the Council of 21 May 2008 on Ambient Air Quality and Cleaner Air for Europe. Available online: http://eur-lex.europa.eu/LexUriServ/LexUriServ.do?uri=OJ:L:2008:152:0001:0044:EN:PDF (accessed on 7 May 2014).
  10. Indicator: Exceedance. of Air Quality Limit Values in Urban Areas; European Environment Agency: Copenhagen, Denmark, 2012.
  11. European Environment Agency. AirBase—The European Air Quality Database, Copenhagen, Denmark. Available online: http://acm.eionet.europa.eu/databases/airbase (accessed on 26 March 2013).
  12. Giannouli, M.; Kalognomou, E.A.; Mellios, G.; Moussiopoulos, N.; Samaras, Z.; Fiala, J. Impact of European emission control strategies on urban and local air quality. Atmos. Environ. 2011, 45, 4753–4762. [Google Scholar] [CrossRef]
  13. Colvile, R.; Hutchinson, E.; Mindell, J.; Warren, R. The transport sector as a source of air pollution. Atmos. Environ. 2001, 35, 1537–1565. [Google Scholar] [CrossRef]
  14. Low Emission Zone in Europe Network (LEEZEN). Low Emission Zones in Europe—Europe-wide information on LEZs. Available online: http://www.lowemissionzones.eu (accessed on 31 March 2014).
  15. Umweltbundesamt. Umweltzonen in Deutschland—Ein Service des Umweltbundesamtes. Available online: http://gis.uba.de/website/umweltzonen/umweltzonen.php (accessed on 28 November 2013).
  16. Cyrys, J.; Peters, A.; Soentgen, J.; Wichmann, H.E. Low emission zones reduce PM10 mass concentrations and diesel soot in German cities. J. Air Waste Manage. Assoc. 2014, 64, 481–487. [Google Scholar] [CrossRef]
  17. Atkinson, R.W.; Barratt, B.; Armstrong, B.; Anderson, H.R.; Beevers, S.D.; Mudway, I.S.; Green, D.; Derwent, R.G.; Wilkinson, P.; Tonne, C.; Kelly, F.J. The impact of the congestion charging scheme on ambient air pollution concentrations in London. Atmos. Environ. 2009, 43, 5493–5500. [Google Scholar] [CrossRef]
  18. Beevers, S.D.; Carslaw, D.C. The impact of congestion charging on vehicle emissions in London. Atmos. Environ. 2005, 39, 1–5. [Google Scholar] [CrossRef]
  19. Jensen, S.S.; Ketzel, M.; Nøjgaard, J.K.; Becker, T. What are the Impacts on Air Quality of Low Emission Zones in Denmark? Annual Transport Conference at Aalborg University, Aalborg, Denmark, 2011. Available online: www.trafikdage.dk/papers_2011/31_SteenSolvangJensen.pdf (accessed on 10 May 2014).
  20. Jones, A.M.; Harrison, R.M.; Barratt, B.; Fuller, G. A large reduction in airborne particle number concentrations at the time of the introduction of the “sulphur free” diesel and the London Low Emission Zone. Atmos. Environ. 2012, 50, 129–138. [Google Scholar] [CrossRef]
  21. Ellison, R.B.; Greaves, S.P.; Hensher, D.A. Five years of London’s low emission zone: Effects on vehicle fleet composition and air quality. Transp. Res. Pt. D-Transp. Enviro. 2013, 23, 25–33. [Google Scholar] [CrossRef]
  22. Boogaard, H.; Janssen, N.A.H.; Fischer, P.H.; Kos, G.P.A.; Weijers, E.P.; Cassee, F.R.; van der Zee, S.C.; de Hartog, J.J.; Meliefste, K.; Wang, M.; Brunekreef, B.; Hoek, G. Impact of low emission zones and local traffic policies on ambient air pollution concentrations. Sci. Total Environ. 2012, 435, 132–140. [Google Scholar]
  23. Bruckmann, P.; Lutz, M. Verbessern Umweltzonen die Luftqualität? In Proceedings of the 12th Technischer Kongress des Verbandes der Automobilindustrie (VDA), Ludwigsburg, Germany, 24–25 March 2010; pp. 299–311.
  24. Bruckmann, P.; Wurzler, S.; Brandt, A.; Vogt, K. Erfahrungen mit umweltzonen in Nordrhein-Westfalen. UMID 2011, 4, 27–33. (in German). [Google Scholar]
  25. Cyrys, J.; Peters, A.; Wichmann, H.-E. Umweltzone München—Eine erste Bilanz. Umweltmed. Forsch. Prax. 2009, 14, 127–132. [Google Scholar]
  26. Laberer, C.; Niedermaier, M. Wirksamkeit von Umweltzonen. ADAC-Untersuchung. Interessenvertretung Verkehr. Available online: http://www.adac.de/_mmm/pdf/umweltzonen_wirksamkeit_bericht_0609_43574.pdf (accessed on 26 March 2013).
  27. Lorenz, J. Feinstaub: Beim immissionsschutz sind alle in der pflicht—Erfahrungen mit der umweltzone in München. UMID 2011, 4, 19–26. (in German). [Google Scholar] [CrossRef]
  28. Lutz, M.; Rauterberg-Wulff, A. Ein Jahr Umweltzone Berlin: Wirkungsuntersuchungen. Available online: http://www.stadtentwicklung.berlin.de/umwelt/luftqualitaet/de/luftreinhalteplan/download/umweltzone_1jahr_stufe2_bericht.pdf (accessed on 26 March 2013).
  29. Rauterberg-Wulff, A.; Lutz, M. Wirkungsuntersuchungen zur umweltzone Berlin. UMID 2011, 4, 11–18. [Google Scholar]
  30. Morfeld, P.; Stern, R.; Builtjes, P.; Groneberg, D.A.; Spallek, M. Einrichtung einer umweltzone und ihre wirksamkeit auf die PM10-feinstaubkonzentration—Eine pilotanalyse am beispiel München (in German). Zentralbl. Arbeitsmed. Arbeitsschutz Ergon. 2013, 63, 105–115. (in German). [Google Scholar]
  31. Statistical Agency of the City of Munich. Statistisches Amt-ZIMAS—Datenbank. Available online: http://www.muenchen.de/rathaus/Stadtinfos/Statistik/CSV-Daten.html (accessed on 26 March 2014).
  32. Bayerisches Staatsministerium für Umwelt, Gesundheit und Verbraucherschutz: Luftreinhalte-/Aktionsplan für die Stadt München 1. Fortschreibung. Available online: http://www.regierung.oberbayern.bayern.de/imperia/md/content/regob/internet/dokumente/bereich5/technischerumweltschutz/lrp/erste_fortschreibung_lrp_muenchen.pdf (accessed on 8 May 2014).
  33. Bayerisches Landesamt für Umwelt: Anlage zur 4. Fortschreibung des Luftreinhalteplans München: Minderungswirkung von Umweltzonen auf die Luftschadstoffbelastung. Available online: http://www.regierung.oberbayern.bayern.de/imperia/md/content/regob/internet/dokumente/bereich5/technischerumweltschutz/lrp/anlage_zum_lrp___wirkungsanalyse.pdf (accessed on 8 May 2014).
  34. Clifford, S.; Mølgaard, B.; Choy, S.L.; Corander, J.; Hämeri, K.; Mengersen, K.; Hussein, T. Bayesian semi-parametric forecasting of ultrafine particle number concentration with penalised splines and autoregressive errors. Comput. Stat. Data Anal. 2012. Available online: http://arxiv.org/pdf/1207.0558.pdf (accessed on 8 May 2014).
  35. Barnett, A.G.; van der Pols, J.C.; Dobson, A.J. Regression to the mean: What it is and how to deal with it. Int. J. Epidemiol. 2005, 34, 215–220. [Google Scholar]
  36. Vickers, A.J.; Altman, D.G. Statistics notes: Analysing controlled trials with baseline and follow up measurements. BMJ 2001, 323, 1123–1124. [Google Scholar] [CrossRef]
  37. Li, K.H.; Le, N.D.; Sun, L.; Zidek, J.V. Spatial-Temporal models for ambient hourly PM10 in Vancouver. Environmetrics 1999, 10, 321–338. [Google Scholar] [CrossRef]
  38. R Core Team. A Language and Environment for Statistical Computing; R Foundation for Statistical Computing: Vienna, Austria, 2013. Available online: http://www.R-project.org/ (accessed on 6 March 2014).
  39. Wood, S.N. Generalized Additive Models: An Introduction wit R; Chapman and Hall/CRC: Boca Raton, FL, USA, 2006. [Google Scholar]
  40. Bayerisches Landesamt für Umwelt. Minderungswirkung von Umweltzonen auf die Luftschadstoffbelastung—Umweltzone München. Anlage zur 4. Fortschreibung des Luftreinhalteplans München. Available online: http://www.regierung.oberbayern.bayern.de/imperia/md/content/regob/internet/dokumente/bereich5/technischerumweltschutz/lrp/anlage_zum_lrp___wirkungsanalyse.pdf (accessed on 26 March 2013).
  41. Regierung von Oberbayern. Luftreinhalteplan für die Stadt München 4. Fortschreibung. Available online: http://www.regierung.oberbayern.bayern.de/imperia/md/content/regob/internet/dokumente/bereich5/technischerumweltschutz/lrp/lrp_m_4__fortschr_stmug_endfassung___05_09_2010.pdf (accessed on 28 March 2014).
  42. Tonne, C.; Beevers, S.; Armstrong, B.; Kelly, F.; Wilkinson, P. Air pollution and mortality benefits of the London congestion charge: Spatial and socioeconomic inequalities. Occup. Environ. Medicine 2008, 65, 620–627. [Google Scholar] [CrossRef]
  43. Johansson, C.; Burman, L.; Forsberg, B. The effects of congestions tax on air quality and health. Atmos. Environ. 2009, 43, 4843–4854. [Google Scholar] [CrossRef]
  44. Wichmann, H.-E. Feinstaub: Lufthygienisches Problem Nr. 1—Eine aktuelle Übersicht. Umweltmed. Forsch. Prax. 2005, 10, 157–162. [Google Scholar]
  45. Quadir, R.M.; Abbaszade, G.; Schnelle-Kreis, J.; Chow, J.C.; Zimmermann, R. Concentrations and source contributions of particulate organic matter before and after implementation of low emission zone in Munich, Germany. Environ. Pollut. 2013, 175, 158–167. [Google Scholar] [CrossRef]

Supplementary Files

  • Supplementary File 1:

    Supplementary Information (PDF, 397 KB)

  • Share and Cite

    MDPI and ACS Style

    Fensterer, V.; Küchenhoff, H.; Maier, V.; Wichmann, H.-E.; Breitner, S.; Peters, A.; Gu, J.; Cyrys, J. Evaluation of the Impact of Low Emission Zone and Heavy Traffic Ban in Munich (Germany) on the Reduction of PM10 in Ambient Air. Int. J. Environ. Res. Public Health 2014, 11, 5094-5112. https://doi.org/10.3390/ijerph110505094

    AMA Style

    Fensterer V, Küchenhoff H, Maier V, Wichmann H-E, Breitner S, Peters A, Gu J, Cyrys J. Evaluation of the Impact of Low Emission Zone and Heavy Traffic Ban in Munich (Germany) on the Reduction of PM10 in Ambient Air. International Journal of Environmental Research and Public Health. 2014; 11(5):5094-5112. https://doi.org/10.3390/ijerph110505094

    Chicago/Turabian Style

    Fensterer, Veronika, Helmut Küchenhoff, Verena Maier, Heinz-Erich Wichmann, Susanne Breitner, Annette Peters, Jianwei Gu, and Josef Cyrys. 2014. "Evaluation of the Impact of Low Emission Zone and Heavy Traffic Ban in Munich (Germany) on the Reduction of PM10 in Ambient Air" International Journal of Environmental Research and Public Health 11, no. 5: 5094-5112. https://doi.org/10.3390/ijerph110505094

    Article Metrics

    Back to TopTop