Use of Segregation Indices, Townsend Index, and Air Toxics Data to Assess Lifetime Cancer Risk Disparities in Metropolitan Charleston, South Carolina, USA

Abstract
:1. Introduction
2. Methods
2.1. Study Area
2.2. Census Data
2.3. Segregation Index

2.4. NATA Risk
2.5. Statistical Analysis
3. Results

| Variable | Percentile | |||
|---|---|---|---|---|
| Mean | 5th | 50th | 95th | |
| Segregation and Townsend Indices | ||||
| Diversity | 0.4 | 0.1 | 0.4 | 0.6 |
| Isolation | 0.4 | 0 | 0.4 | 0.9 |
| Dissimilarit | 0.2 | 0 | 0.2 | 0.6 |
| Relative Cluster | 0.1 | −0.3 | 0 | 0.6 |
| Delta | 0.3 | 0 | 0.2 | 0.6 |
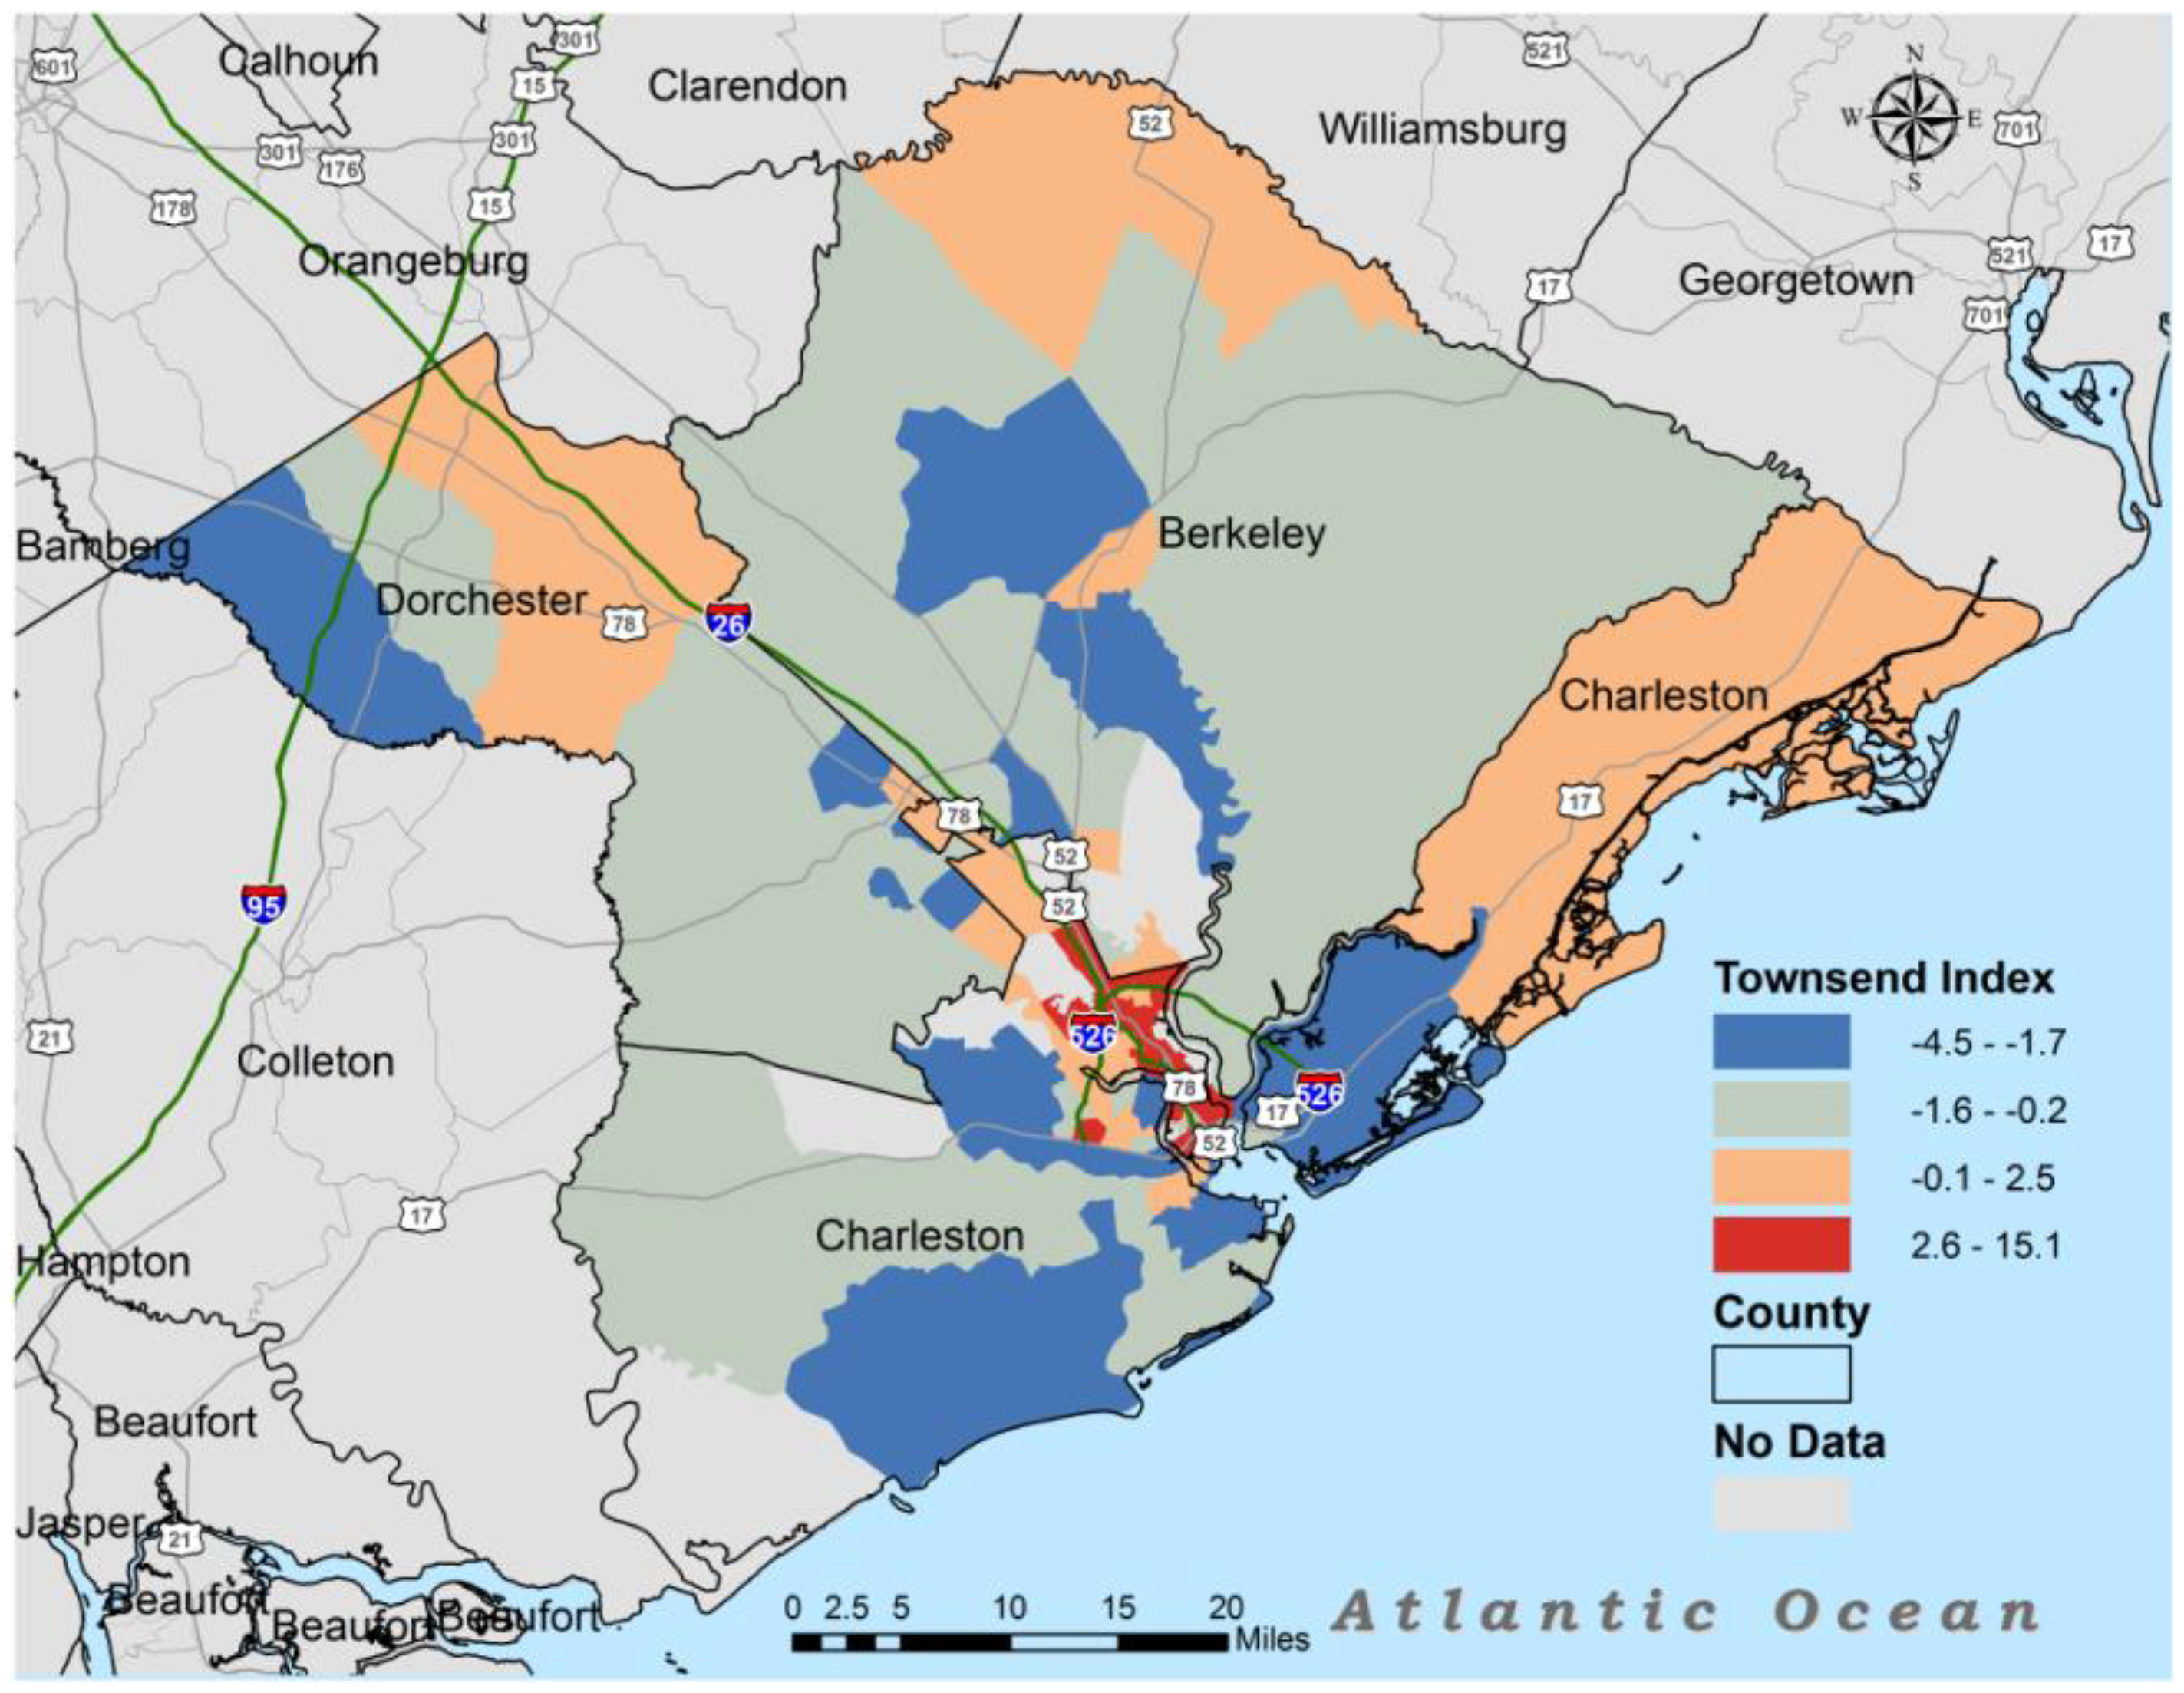
| Townsend | 1 | −3.1 | −0.2 | 8.8 |
| Sociodemographic Measures a | ||||
| % Black | 35.5 | 0.7 | 26.3 | 90.4 |
| % Unemployment | 4.1 | 1 | 3 | 10.5 |
| % Renter | 37.7 | 9.6 | 32.5 | 82 |
| % Crowded Room | 3.6 | 0 | 3 | 9 |
| % No Car | 13.3 | 1.4 | 7.7 | 42.2 |
| % Poverty | 17.8 | 4.1 | 13.5 | 44.3 |
| % Less than HS Education | 20.9 | 3.1 | 20 | 41.7 |
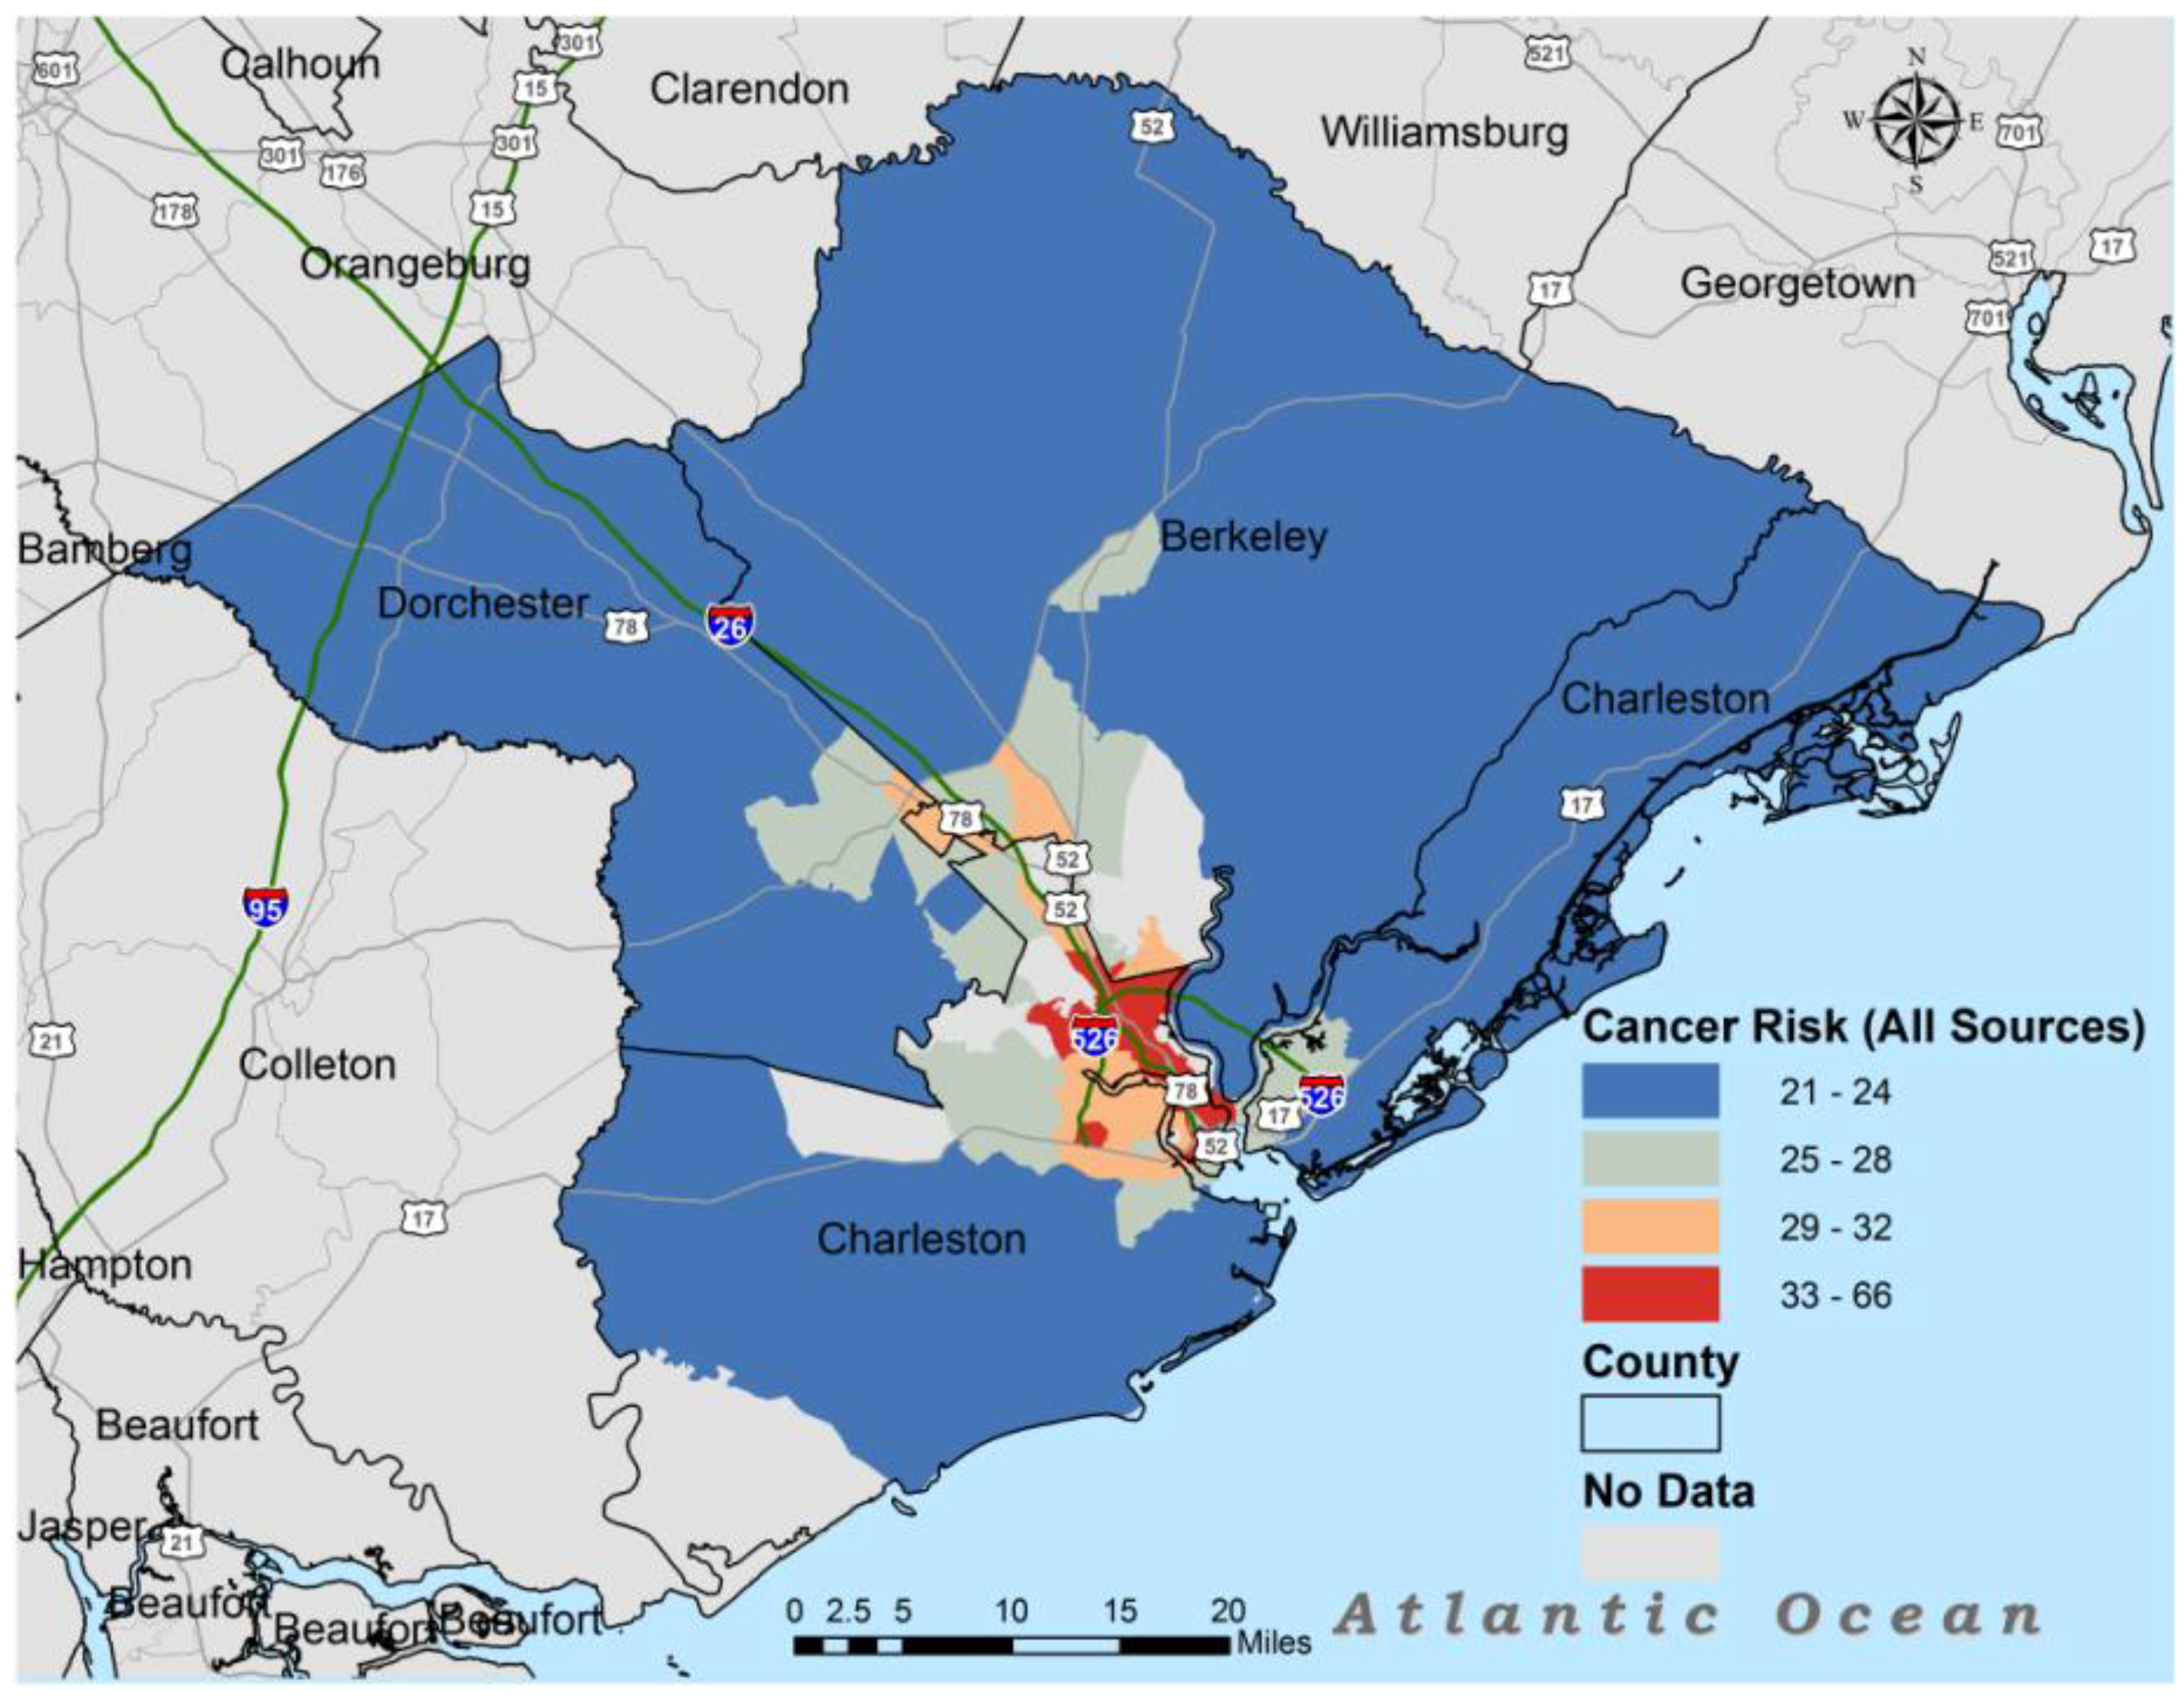
| Lifetime cancer risk (persons/million) b | ||||
| All Source | 29.1 | 22 | 28 | 42 |
| Major | 2.5 | 1 | 2 | 7.2 |
| Area | 2.1 | 1 | 2 | 4 |
| On-Road | 6.2 | 2 | 5 | 14 |
| Non-Road | 2 | 1 | 2 | 5 |
| Background | 16.3 | 15 | 16 | 18 |


| Segregation & Townsend Indices | All Source | Major | Area | On-road | Non-road | Background |
|---|---|---|---|---|---|---|
| Diversity | −0.04 | −0.08 | −0.01 | −0.04 | −0.1 | 0.03 |
| Isolation | 0.18 ** | 0.18 * | 0.06 | 0.19 ** | 0.15 * | −0.06 |
| Dissimilarity | −0.08 | −0.08 | −0.06 | −0.06 | 0.05 | 0.05 |
| Relative Cluster | −0.15 * | −0.11 | −0.07 | −0.17 ** | −0.09 | 0.07 |
| Delta | −0.02 | 0.03 | −0.02 | −0.01 | 0.03 | 0.06 |
| Townsend | 0.49 ** | 0.37 ** | 0.43 ** | 0.42 ** | 0.39 ** | −0.41 ** |
| Sociodemographic Measures | ||||||
| % Black | 0.21 ** | 0.16 * | 0.09 | 0.2 ** | 0.14 * | −0.08 |
| % Poverty | 0.33 ** | 0.24 ** | 0.25 ** | 0.29 ** | 0.3 ** | −0.27 ** |
| % Less than HS | 0.16 * | 0.19 ** | 0.06 | 0.13 | 0.07 | 0.01 |
| % Unemployment | 0.27 ** | 0.27 ** | 0.19 ** | 0.23 ** | 0.22 ** | −0.19 ** |
| % Renter | 0.55 ** | 0.38 ** | 0.52 ** | 0.49 ** | 0.52 ** | −0.54 ** |
| % Crowded Room | 0.22 ** | 0.16 * | 0.21 ** | 0.21 ** | 0.08 | −0.09 |
| % No Car | 0.32 ** | 0.25 ** | 0.28 ** | 0.26 ** | 0.33 ** | −0.22 ** |
| % Urban Area | 0.45 ** | 0.29 ** | 0.49 ** | 0.46 ** | 0.35 ** | −0.36 ** |
| Segregation Models | Coefficients (Exponential) |
|---|---|
| Isolation Index Model + | |
| Isolation | 1.25 ** |
| % Poverty | 0.99 |
| % Unemployment | 1.02 ** |
| % Crowded Room | 1.01 |
| % Renter | 1.01 ** |
| Townsend Index Model ++ | |
| Townsend | 1.03 ** |
| % Black | 1.00 |
| % Poverty | 1.00 |
4. Discussion
5. Conclusions
Acknowledgments
Author Contributions
Conflicts of Interest
References
- Bullard, R.D.; Mohai, P.; Saha, R.; Wright, B. Toxic Wastes and Race at Twenty 1987–2007: Grassroots Struggles to Dismantle Environmental Racism in the United States; United Church of Christ: Cleveland, OH, USA, 2007. [Google Scholar]
- Wilson, S. A holistic ecologic framework to study and address environmental justice and community health issues. Environ. Justice 2009, 2, 1–9. [Google Scholar] [CrossRef]
- American Cancer Society. Cancer Facts & Figures 2013. Available online: http://www.cancer.org/acs/groups/content/@epidemiologysurveilance/documents/document/acspc-036845.pdf (accessed on 3 August 2013).
- Williams, D.R.; Jackson, P.B. Social sources of racial disparities in health. Health Affair. 2005, 24, 325–334. [Google Scholar] [CrossRef]
- Office of Disease Prevention and Health Promotion, U.S. Department of Health and Human Services. Healthy People 2020. Available online: http://www.healthypeople.gov/2020/Consortium/HP2020Framework.pdf (accessed April 13 2014).
- Williams, D.R.; Collins, C. Racial residential segregation: A fundamental cause of racial disparities in health. Public Health Rep. 2001, 116, 404–416. [Google Scholar] [CrossRef]
- Diez-Roux, A. Investigating neighborhood and area effects on health. Amer. J. Public Health 2001, 91, 1783–1789. [Google Scholar] [CrossRef]
- Sampson, R.J. The neighborhood context of well-being. Perspect. Biol. Med. 2003, 46, S53–S64. [Google Scholar] [CrossRef]
- Morenoff, J.D.; House, J.S.; Hansen, B.B.; Williams, D.R.; Kaplan, G.A.; Hunte, H.E. Understanding social disparities in hypertension prevalence, awareness, treatment, and control: The role of neighborhood context. Soc. Sci. Med. 2007, 65, 1853–1866. [Google Scholar] [CrossRef]
- LaVeist, T.; Pollack, K.; Thorpe, R.; Fesahazion, R.; Gaskin, D. Place, not race: Disparities dissipate in southwest Baltimore when blacks and whites live under similar conditions. Health Affair. 2011, 30, 1880–1887. [Google Scholar] [CrossRef]
- Subramanian, S.V.; Acevedo-Garcia, D.; Osypuk, T.L. Racial residential segregation and geographic heterogeneity in black/white disparity in poor self-rated health in the USA: A multilevel statistical analysis. Soc. Sci. Med. 2005, 60, 1667–1679. [Google Scholar] [CrossRef]
- Jackson, S.A.; Anderson, R.T.; Johnson, N.J.; Sorlie, P.D. The relation of residential segregation to all-cause mortality: A study in black and white. Amer. J. Public Health 2000, 90, 615–617. [Google Scholar] [CrossRef]
- LaVeist, T.A. Linking residential segregation and the infant mortality race disparity. Sociol. Soc. Res. 1989, 73, 90–94. [Google Scholar]
- LaVeist, T.A. Segregation, poverty, and empowerment: Health consequences for African Americans. Milbank Quart. 1993, 71, 41–64. [Google Scholar] [CrossRef]
- Polednak, A.P. Black-white differences in infant mortality in 38 standard metropolitan statistical areas. Amer. J. Public Health 1991, 81, 480–1482. [Google Scholar] [CrossRef]
- Polednak, A.P. Poverty, residential segregation, and black/white mortality ratio in urban areas. J. Health Care Poor Underserve. 1993, 4, 363–373. [Google Scholar] [CrossRef]
- Hearst, M.O.; Oakes, M.; Johnson, P.J. The effect of racial residential segregation on black infant mortality. Amer. J. Epidemiol. 2008, 168, 1247–1254. [Google Scholar] [CrossRef]
- Apelberg, B.J.; Buckley, T.J.; White, R.H. Socioeconomic and racial disparities in cancer risk from air toxics in Maryland. Environ. Health Perspect. 2005, 113, 693–699. [Google Scholar]
- Linder, S.H.; Marko, D.; Sexton, K. Cumulative cancer risk from air pollution in Houston: Disparities in risk burden and social disadvantage. Environ. Sci. Technol. 2008, 42, 4312–4322. [Google Scholar]
- Collins, T.W.; Grineski, S.E.; Chakraborty, J.; McDonald, Y.J. Understanding environmental health inequalities through comparative intracategorical analysis: Racial/ethnic disparities in cancer risks from air toxics in El Paso county, Texas. Health Place 2011, 17, 335–344. [Google Scholar] [CrossRef]
- Morello-Frosch, R.; Lopez, R. The riskscape and the color line: Examining the role of segregation in environmental health disparities. Environ. Res. 2006, 102, 181–196. [Google Scholar] [CrossRef]
- Morello-Frosch, R.; Jesdale, B.M. Separate and unequal: Residential segregation and estimated cancer risks associated with ambient air toxics in U.S. metropolitan areas. Environ. Health Perspect. 2006, 114, 386–393. [Google Scholar] [CrossRef]
- Morello-Frosch, R.; Pastor, M.; Sadd, J. Environmental justice and southern California’s “riskscape”: The distribution of air toxics exposures and health risks among diverse communities. Urban. Aff. Rev. 2001, 36, 551–578. [Google Scholar] [CrossRef]
- Massey, D.; Denton, N.A. American Apartheid: Segregation and the Making of the Underclass; Harvard University Press: Cambridge, MA, USA, 1993. [Google Scholar]
- Neckerman, K.M.; Kirschenman, J. Hiring strategies, racial bias, and inner-city workers. Soc. Probl. 1991, 38, 433–447. [Google Scholar]
- Kasandra, J.D. Urban industrial transition and the underclass. Ann. Amer. Acad. Polit. Soc. Sci. 1989, 501, 26–47. [Google Scholar]
- Dai, D. Black residential segregation, disparities in spatial access to health care facilities, and late-stage breast cancer diagnosis in metropolitan Detroit. Health Place 2010, 16, 1038–1052. [Google Scholar] [CrossRef]
- White, K.; Haas, J.; Williams, D. Elucidating the role of place in health care disparities: The example of racial/ethnic residential segregation. Health Serv. Res. 2012, 47, 1278–1299. [Google Scholar] [CrossRef]
- Bell, J.F.; Zimmerman, F.J.; Mayer, J.D.; Almgren, G.R.; Huebner, C.E. Associations between residential segregation and smoking during pregnancy among urban African American women. J. Urban. Health 2007, 84, 372–388. [Google Scholar] [CrossRef]
- Cooper, H.L.F.; Friedman, S.R.; Tempalski, B.; Friedman, R. Residential segregation and injection drug use prevalence among black adults in U.S. metropolitan statistical areas. Amer. J. Public Health 2007, 97, 344–352. [Google Scholar] [CrossRef]
- Russell, E.F.; Kramer, M.R.; Cooper, H.L.; Gabram-Mendola, S.; Senior-Crosby, D.; Arriola, K.R.J. Metropolitan area racial residential segregation, neighborhood racial composition, and breast cancer mortality. Cancer Cause. Control 2012, 23, 1519–1527. [Google Scholar] [CrossRef]
- Collins, C.A.; Williams, D.R. Segregation and mortality: The deadly effects of racism? Sociol. Forum 1999, 14, 495–523. [Google Scholar] [CrossRef]
- Do, D.P.; Dubowitz, T.; Bird, C.E.; Lurie, N.; Escarce, J.J.; Finch, B.K. Neighborhood context and ethnicity differences in body mass index: A multilevel analysis using the NHANES III survey (1988–1994). Econ. Human Biol. 2007, 5, 179–203. [Google Scholar] [CrossRef]
- LaVeist, T.A. Racial segregation and longevity among African Americans: An individual-level analysis. Health Serv. Res. 2003, 38, 1719–1734. [Google Scholar] [CrossRef]
- Robert, S.A.; Ruel, E. Racial segregation and health disparities between black and white older adults. J. Gerontol. Ser. B-Psychol. Sci. 2006, 61, S203–S211. [Google Scholar] [CrossRef]
- Grady, S.C. Racial disparities in low birthweight and the contribution of residential segregation: A multilevel analysis. Soc. Sci. Med. 2006, 63, 3013–3029. [Google Scholar] [CrossRef]
- Geronimus, A.T.; Bound, J.; Waidmann, T.A. Poverty, time, and place: Variation in excess mortality across selected us populations, 1980–1990. J. Epidemiol. Community Health 1999, 53, 325–334. [Google Scholar] [CrossRef]
- O’Campo, P.; Xue, X.; Wang, M.-C.; Caughy, M. Neighborhood risk factors for low birthweight in Baltimore: A multilevel analysis. Amer. J. Public Health 1997, 87, 1113–1118. [Google Scholar] [CrossRef]
- Ross, C.E. Neighborhood disadvantage and adult depression. J. Health Soc. Behav. 2000, 41, 177–187. [Google Scholar]
- Murali, V.; Oyebode, F. Poverty, social inequality and mental health. Adv. Psychiatr. Treat. 2004, 10, 216–224. [Google Scholar] [CrossRef]
- Wilson, S.; Hutson, M.; Mujahid, M. How planning and zoning contribute to inequitable development, neighborhood health, and environmental injustice. Environ. Justice 2008, 1, 211–216. [Google Scholar] [CrossRef]
- Wilson, S.M.; Heaney, C.D.; Cooper, J.; Wilson, O. Built environment issues in unserved and underserved African American neighborhoods in north Carolina. Environ. Justice 2008, 1, 63–72. [Google Scholar] [CrossRef]
- Wilson, S.M. An ecologic framework to study and address environmental justice and community health issues. Environ. Justice 2009, 2, 15–24. [Google Scholar] [CrossRef]
- Gee, G.C.; Payne-Sturges, D.C. Environmental health disparities: A framework integrating psychosocial and environmental concepts. Environ. Health Perspect. 2004, 112, 1645–1653. [Google Scholar] [CrossRef]
- Kramer, M.R.; Hogue, C.R. Is segregation bad for your health? Epidemiol. Rev. 2009, 31, 178–194. [Google Scholar] [CrossRef]
- Houston, D.; Wu, J.; Ong, P.; Winer, A. Structural disparities of urban traffic in southern California: Implications for vehicle-related air pollution exposure in minority and high-poverty neighborhoods. J. Urban. Aff. 2004, 26, 565–592. [Google Scholar] [CrossRef]
- Payne-Sturges, D.; Gee, G.C. National environmental health measures for minority and low-income populations: Tracking social disparities in environmental health. Environ. Res. 2006, 102, 154–171. [Google Scholar] [CrossRef]
- U.S. Census Bureau. State and County QuickFacts: North Charleston (City), South Carolina. Available online: http://quickfacts.census.gov/qfd/states/45/4550875.html (accessed on 19 April 2014).
- Wilson, S.M.; Fraser-Rahim, H.; Williams, E.; Zhang, H.; Rice, L.; Svendsen, E.; Abara, W. Assessment of the distribution of toxic release inventory facilities in metropolitan Charleston: An environmental justice case study. Amer. J. Public Health 2012, 102, 1974–1980. [Google Scholar] [CrossRef]
- U.S. Army Corps of Engineers Charleston District. Final Environmental Impact Statement Proposed Marine Container Terminal at the Charleston Naval Complex North Charleston, South Carolina. Available online: http://www.porteis.com/project/documents.htm (accessed on 27 September 2010).
- Wilson, S.M.; Rice, L.; Fraser-Rahim, H. The Use of community-driven environmental decision making to address environmental justice and revitalization issues in a port community in South Carolina. Environ. Justice 2011, 4, 145–154. [Google Scholar] [CrossRef]
- Wilson, S.M.; Fraser-Rahim, H.; Zhang, H.; Williams, E.M.; Samantapudi, A.V.; Ortiz, K.; Abara, W.; Sakati, W. The spatial distribution of leaking underground storage tanks in Charleston, South Carolina: An environmental justice analysis. Environ. Justice 2012, 5, 198–205. [Google Scholar] [CrossRef]
- Burwell-Naney, K.; Zhang, H.; Samantapudi, A.; Jiang, C.; Dalemarre, L.; Rice, L.; Williams, E.; Wilson, S. Spatial disparity in the distribution of superfund sites in south Carolina: An ecological study. Environ. Health 2013, 12. [Google Scholar] [CrossRef]
- Massey, D.S.; Denton, N.A. The dimensions of residential segregation. Soc. Forces 1988, 67, 281–315. [Google Scholar] [CrossRef]
- Massey, D.S.; White, M.J.; Phua., V. The dimensions of segregation revisited. Sociol. Method. Res. 1996, 25, 172–206. [Google Scholar] [CrossRef]
- U.S. Census Bureau. Housing Patterns. Available online: http://www.census.gov/hhes/www/housing/housing_patterns/app_b.html (accessed on 1 August 2013).
- Townsend, P.; Phillimore., P.; Beattie, A. Health and deprivation: Inequality and the North; Croom Helm, London, 1988; p. 221. [Google Scholar]
- ICF International. 2011; An Overview of Methods for EPA’s National-scale Air Toxics Assessment. Available online: http://www.epa.gov/ttn/atw/nata2005/05pdf/nata_tmd.pdf (accessed on 12 November 2013). [Google Scholar]
- Federal Information Processing Standards Publications. FIPS-general Information. Available online: http://www.itl.nist.gov/fipspubs/geninfo.htm (accessed on 1 August 2012).
- R Development Core Team. R: A Language and Environment for Statistical Computing. Available online: http://www.R-project. Org (accessed on 13 May 2014).
- U.S. Census Bureau. Census 2000 Data for the United States. Available online: http://www.census.gov/census2000/states/us.html (accessed on 1 August 2013).
- Berkley Charleston Dorchester Council of Governments. Traffic in the Berekeley Charleston Dorchester Region: An Analysis of 1990–2000 Data. Available online: http://www.bcdcog.com/publications/traffic_in_the_bcdregion.pdf (accessed on 5 August 2013).
- U.S. Census Bureau. Statistical Abstract of the United States: 2012 (131st Edition). Available online: http://www.census.gov/compendia/statab/2012edition.html (accessed on 1August 2013).
- Lopez, R. Segregation and black/white differences in exposure to air toxics in 1990. Environ. Health Perspect. 2002, 110, S289–S295. [Google Scholar] [CrossRef]
- Acevedo-Garcia, D.; Lochner, K.A.; Osypuk, T.L.; Subramanian, S.V. Future directions in residential segregation and health research: A multilevel approach. Amer. J. Public Health 2003, 93, 215–221. [Google Scholar] [CrossRef]
- Crowder, K; Downey, L. Inter-neighborhood migration, race, and environmental hazards: Modeling micro-level processes of environmental inequality. AJS 2010, 115, 1110–1149. [Google Scholar]
© 2014 by the authors; licensee MDPI, Basel, Switzerland. This article is an open access article distributed under the terms and conditions of the Creative Commons Attribution license (http://creativecommons.org/licenses/by/3.0/).
Share and Cite
Rice, L.J.; Jiang, C.; Wilson, S.M.; Burwell-Naney, K.; Samantapudi, A.; Zhang, H. Use of Segregation Indices, Townsend Index, and Air Toxics Data to Assess Lifetime Cancer Risk Disparities in Metropolitan Charleston, South Carolina, USA. Int. J. Environ. Res. Public Health 2014, 11, 5510-5526. https://doi.org/10.3390/ijerph110505510
Rice LJ, Jiang C, Wilson SM, Burwell-Naney K, Samantapudi A, Zhang H. Use of Segregation Indices, Townsend Index, and Air Toxics Data to Assess Lifetime Cancer Risk Disparities in Metropolitan Charleston, South Carolina, USA. International Journal of Environmental Research and Public Health. 2014; 11(5):5510-5526. https://doi.org/10.3390/ijerph110505510
Chicago/Turabian StyleRice, LaShanta J., Chengsheng Jiang, Sacoby M. Wilson, Kristen Burwell-Naney, Ashok Samantapudi, and Hongmei Zhang. 2014. "Use of Segregation Indices, Townsend Index, and Air Toxics Data to Assess Lifetime Cancer Risk Disparities in Metropolitan Charleston, South Carolina, USA" International Journal of Environmental Research and Public Health 11, no. 5: 5510-5526. https://doi.org/10.3390/ijerph110505510