A Cluster Analysis of Constant Ambient Air Monitoring Data from the Kanto Region of Japan

Abstract
:1. Introduction

2. Method
2.1. Air Monitoring Data
2.2. Cluster Analysis
2.3. Concentration Contour Maps
3. Results and Discussion
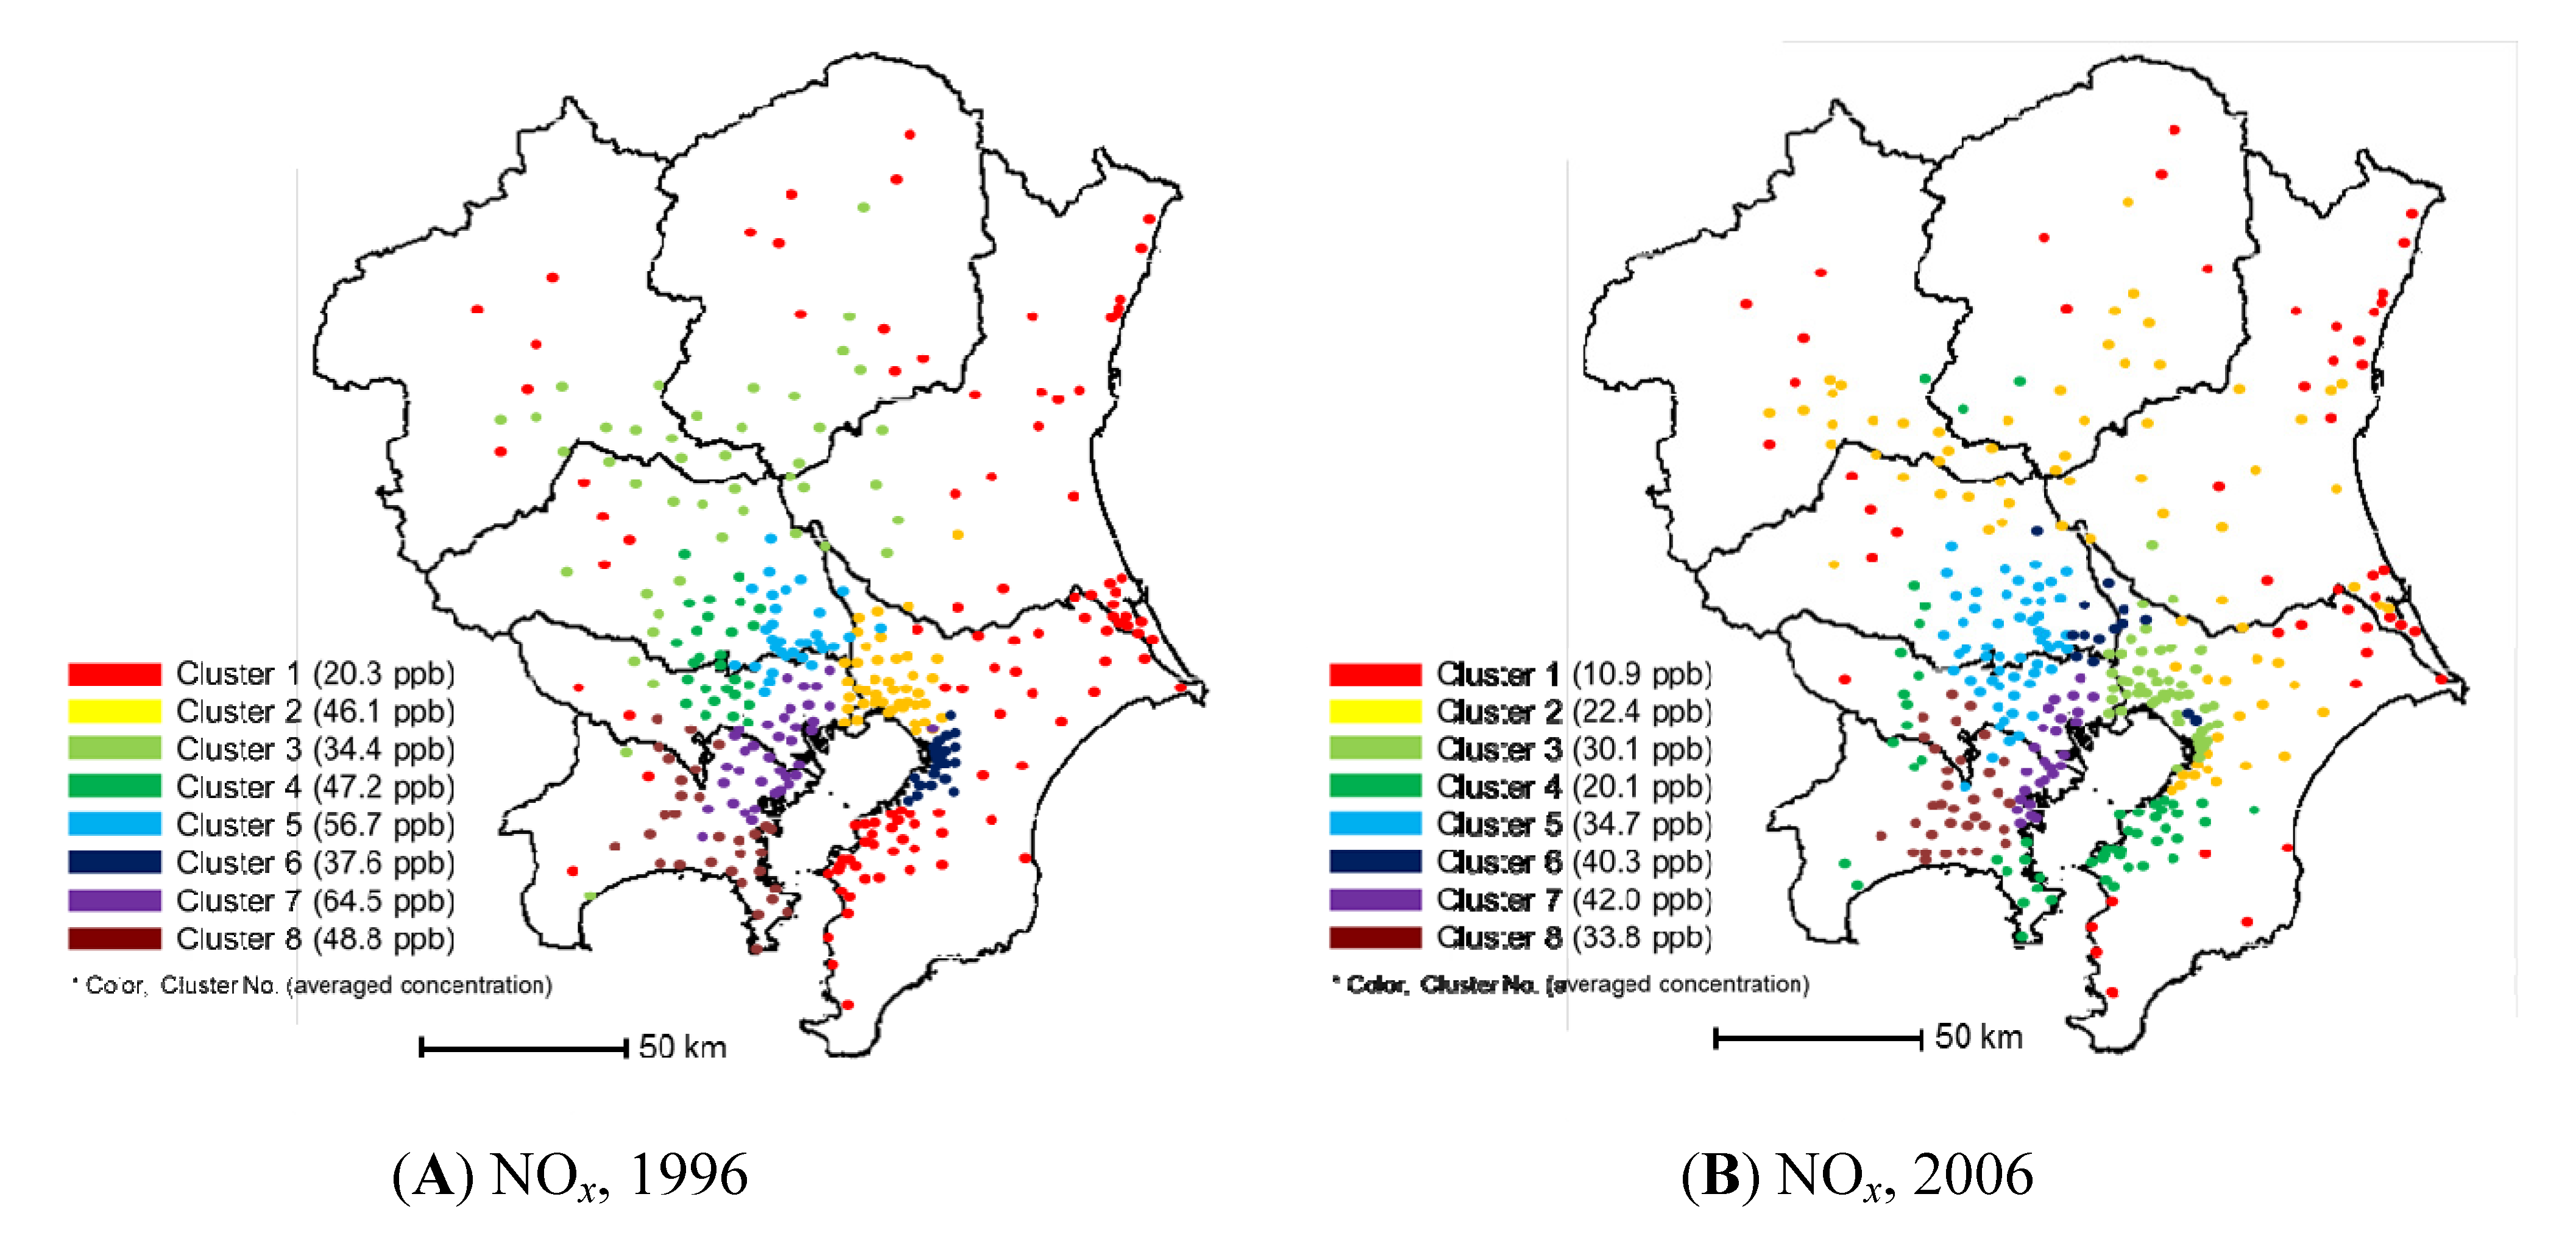
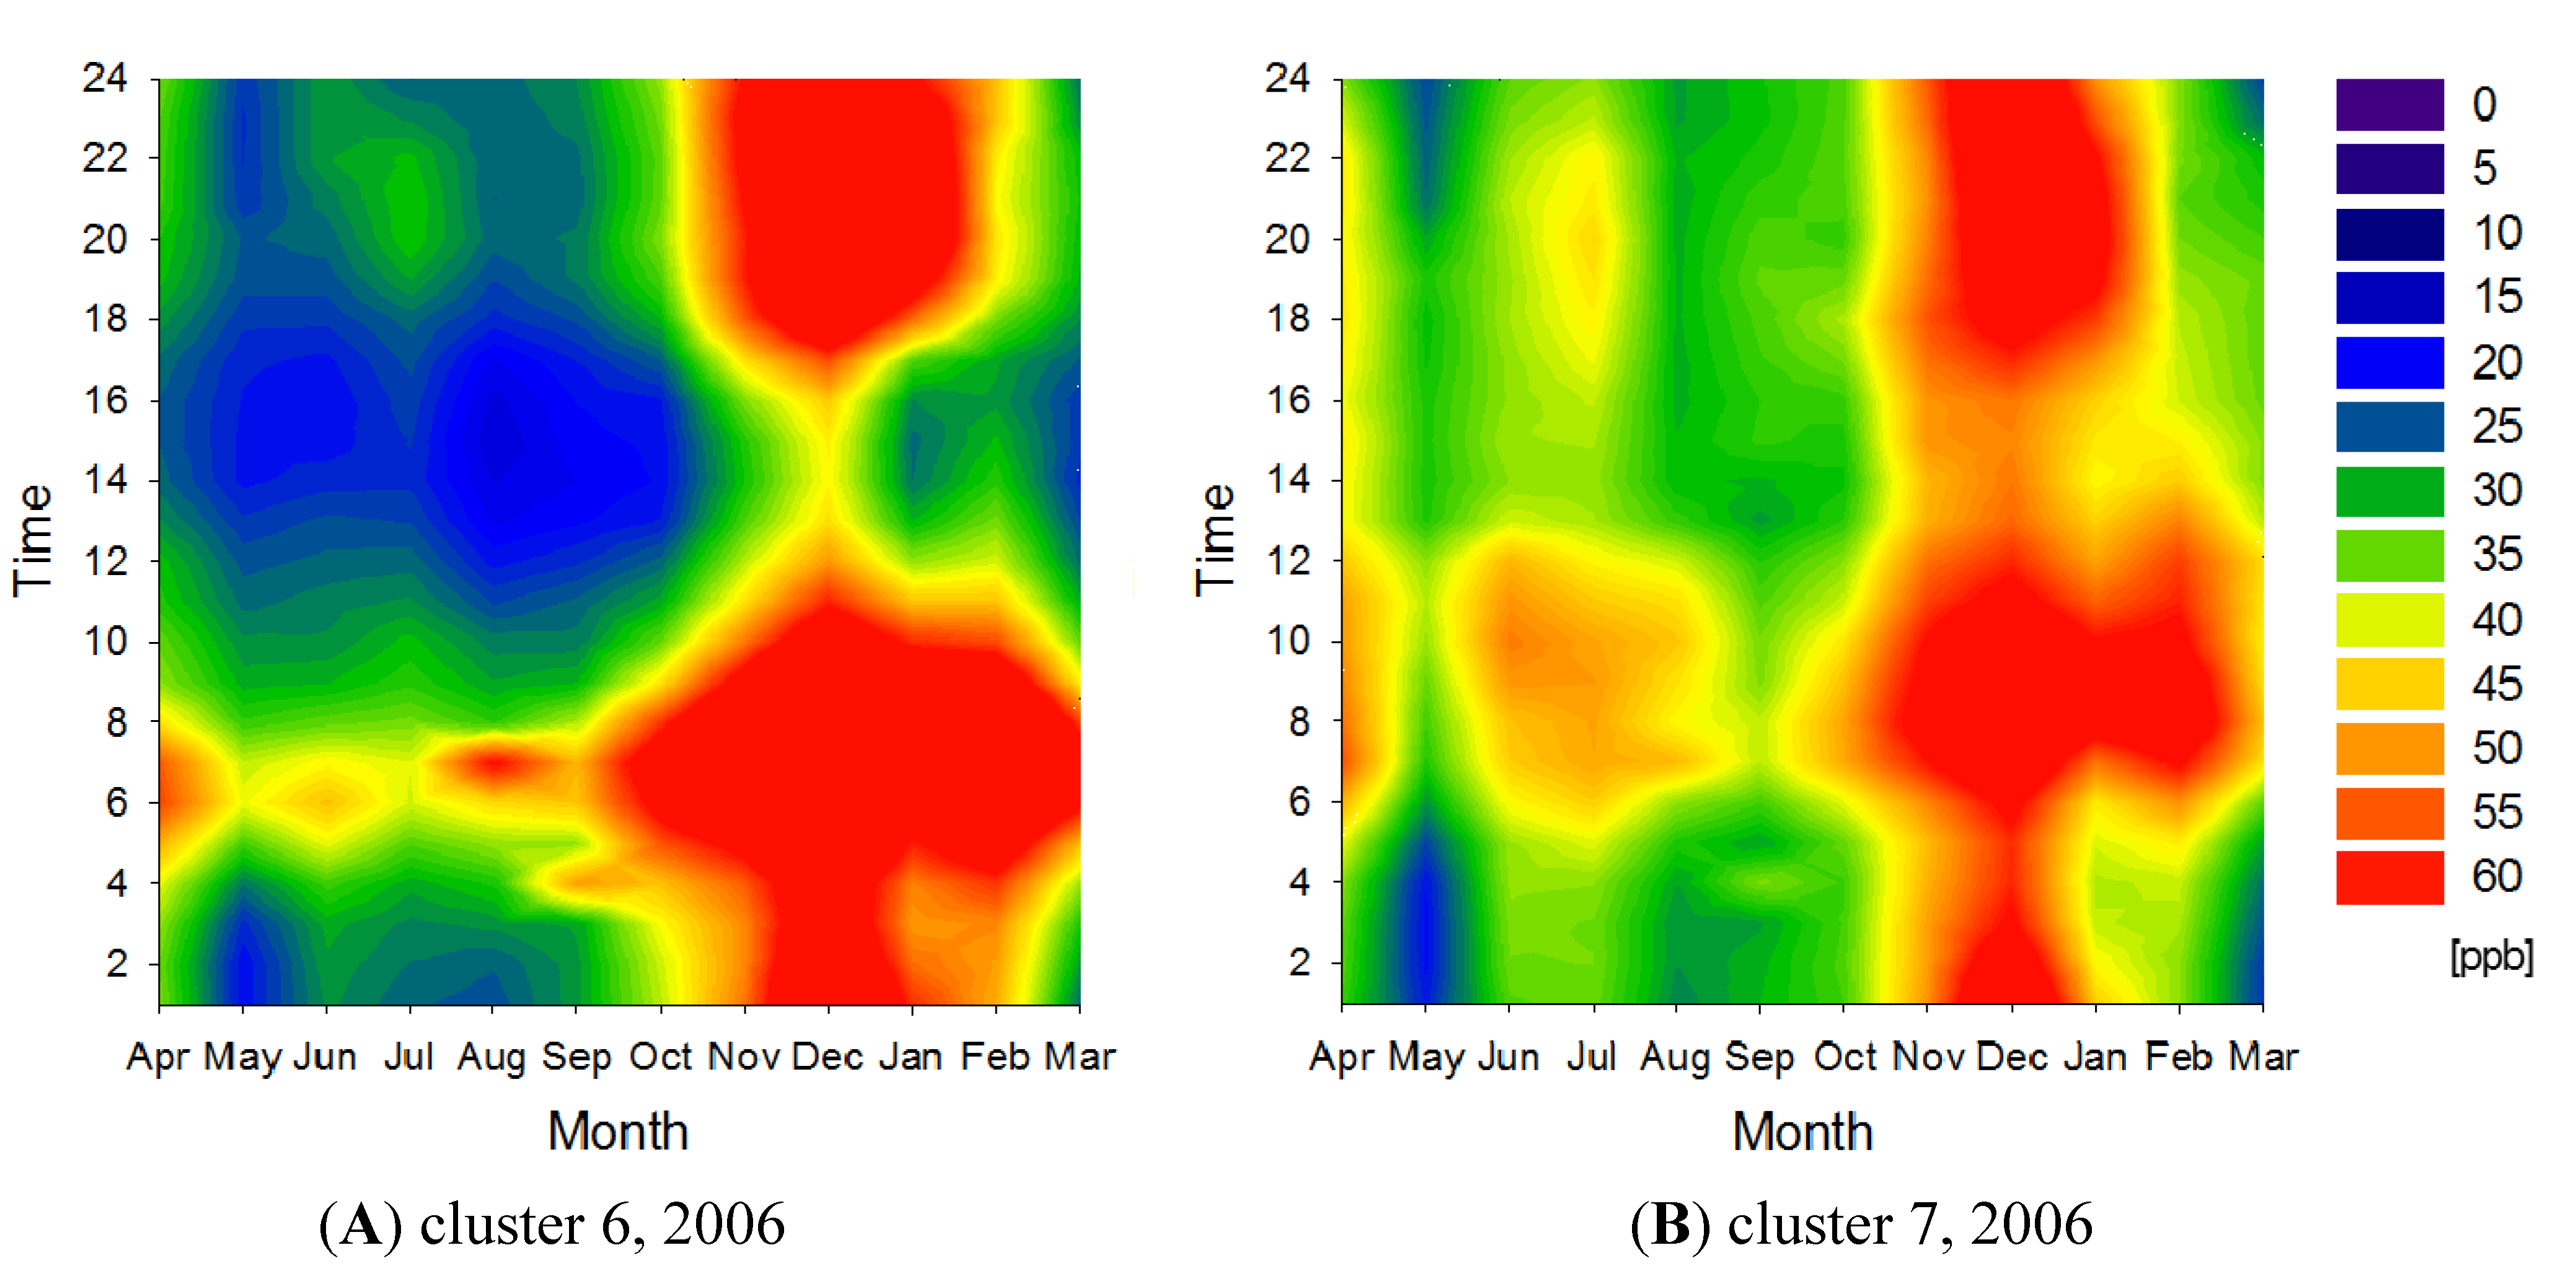
3.1. NOx
3.1.1. General Environmental Air Monitoring Stations


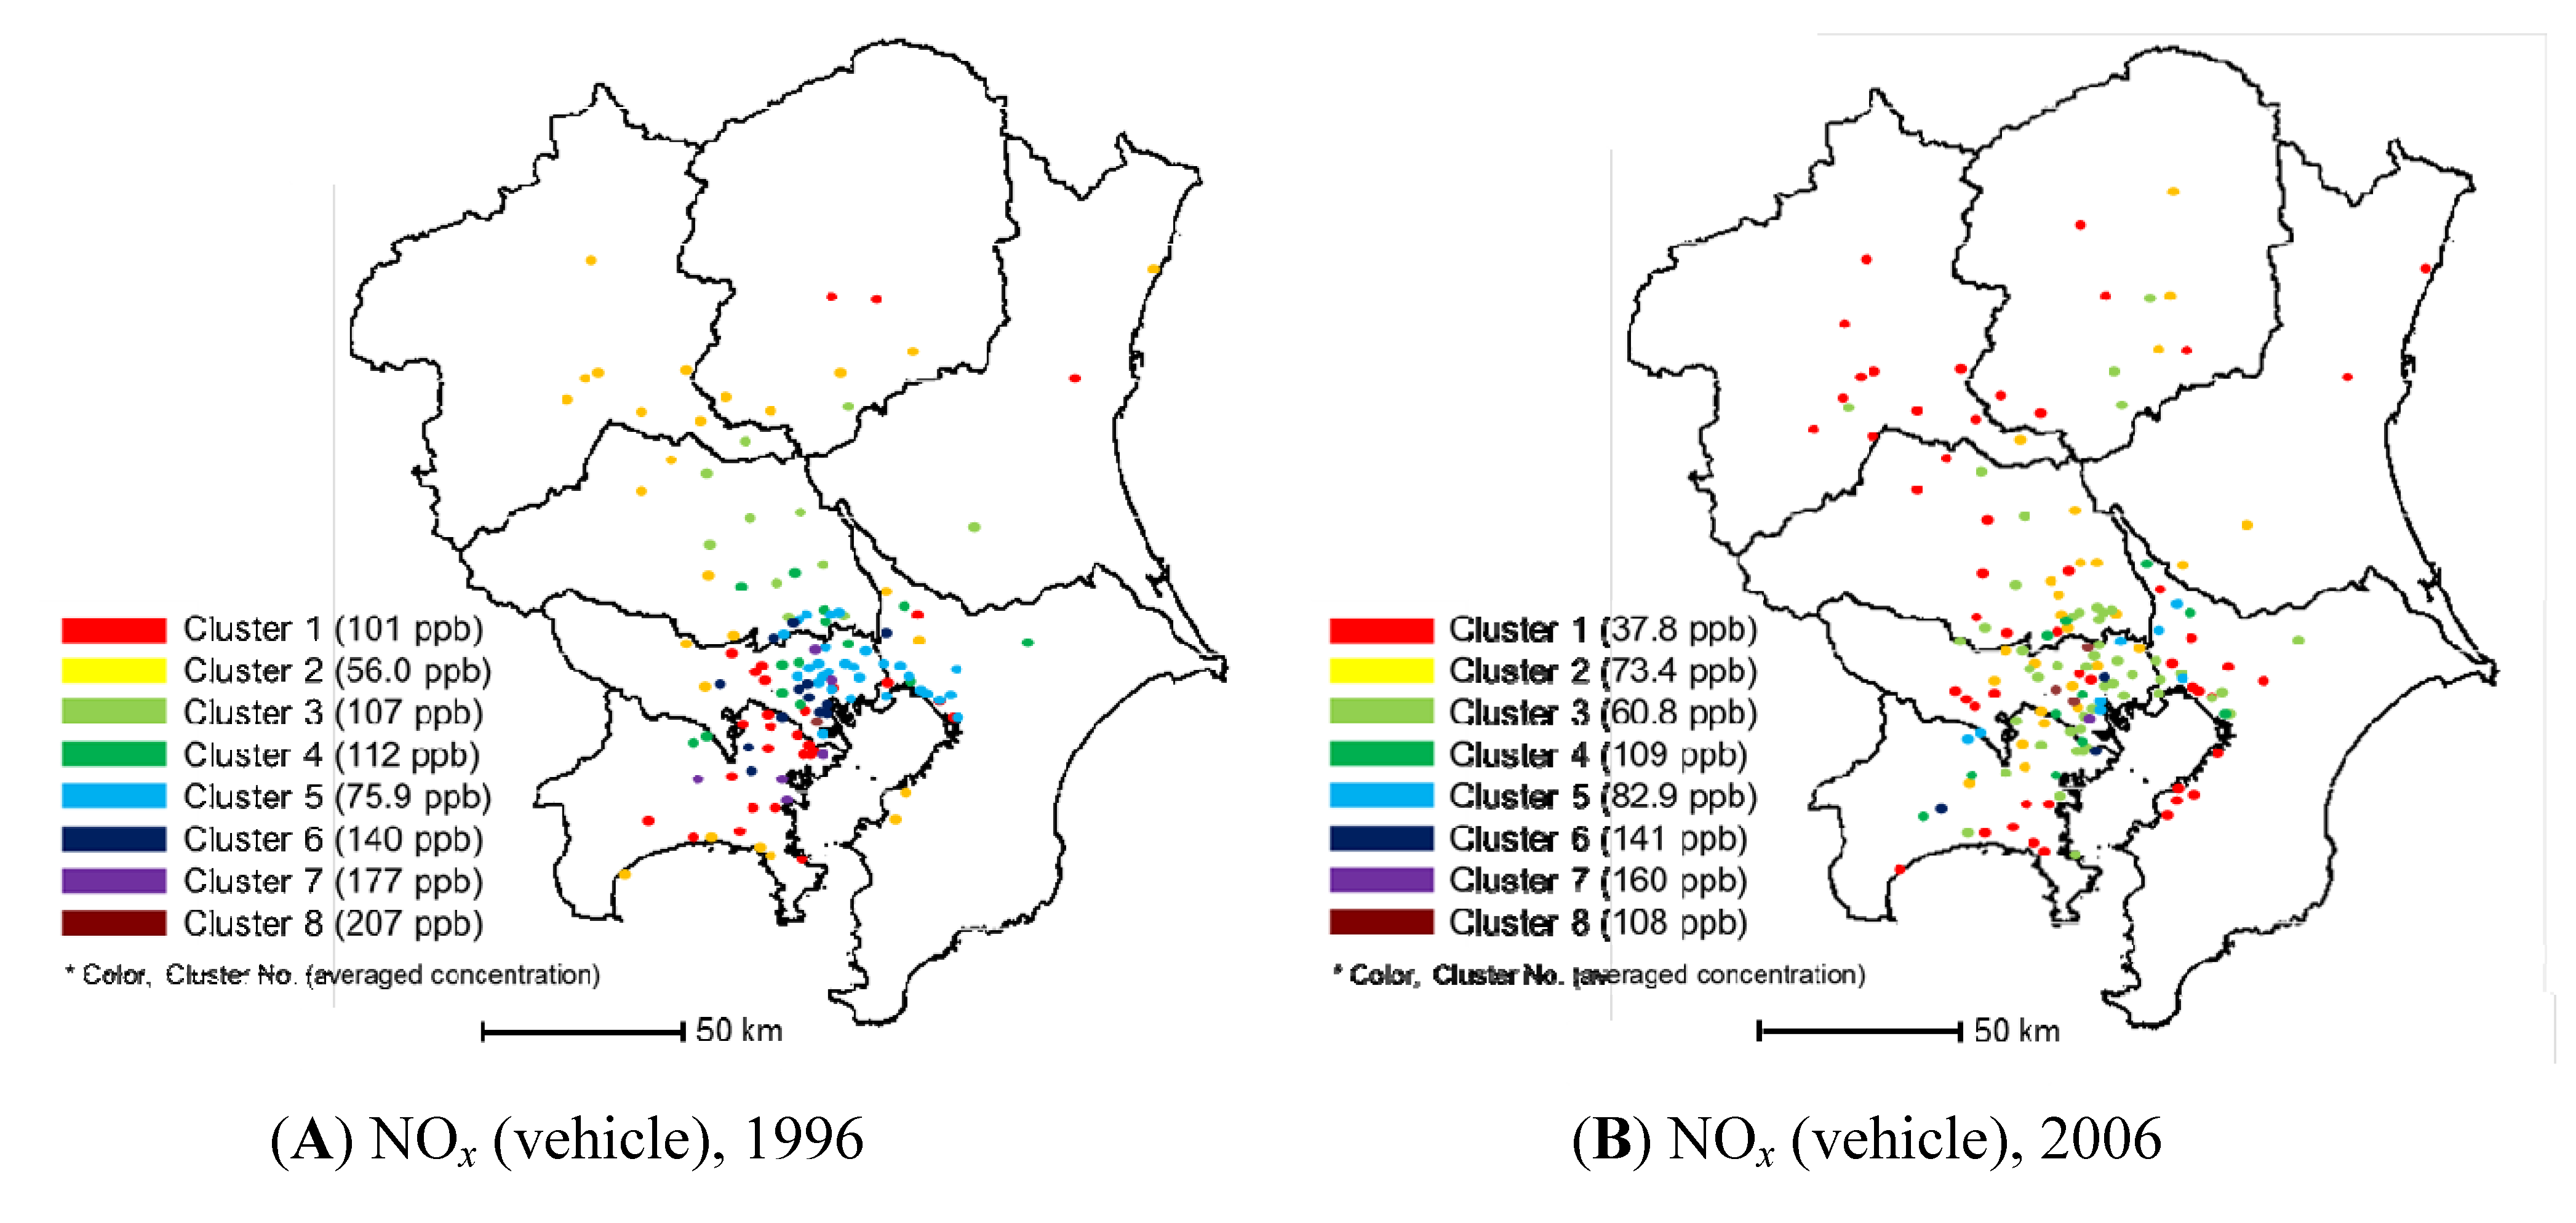
3.1.2. Vehicle Emission Monitoring Stations

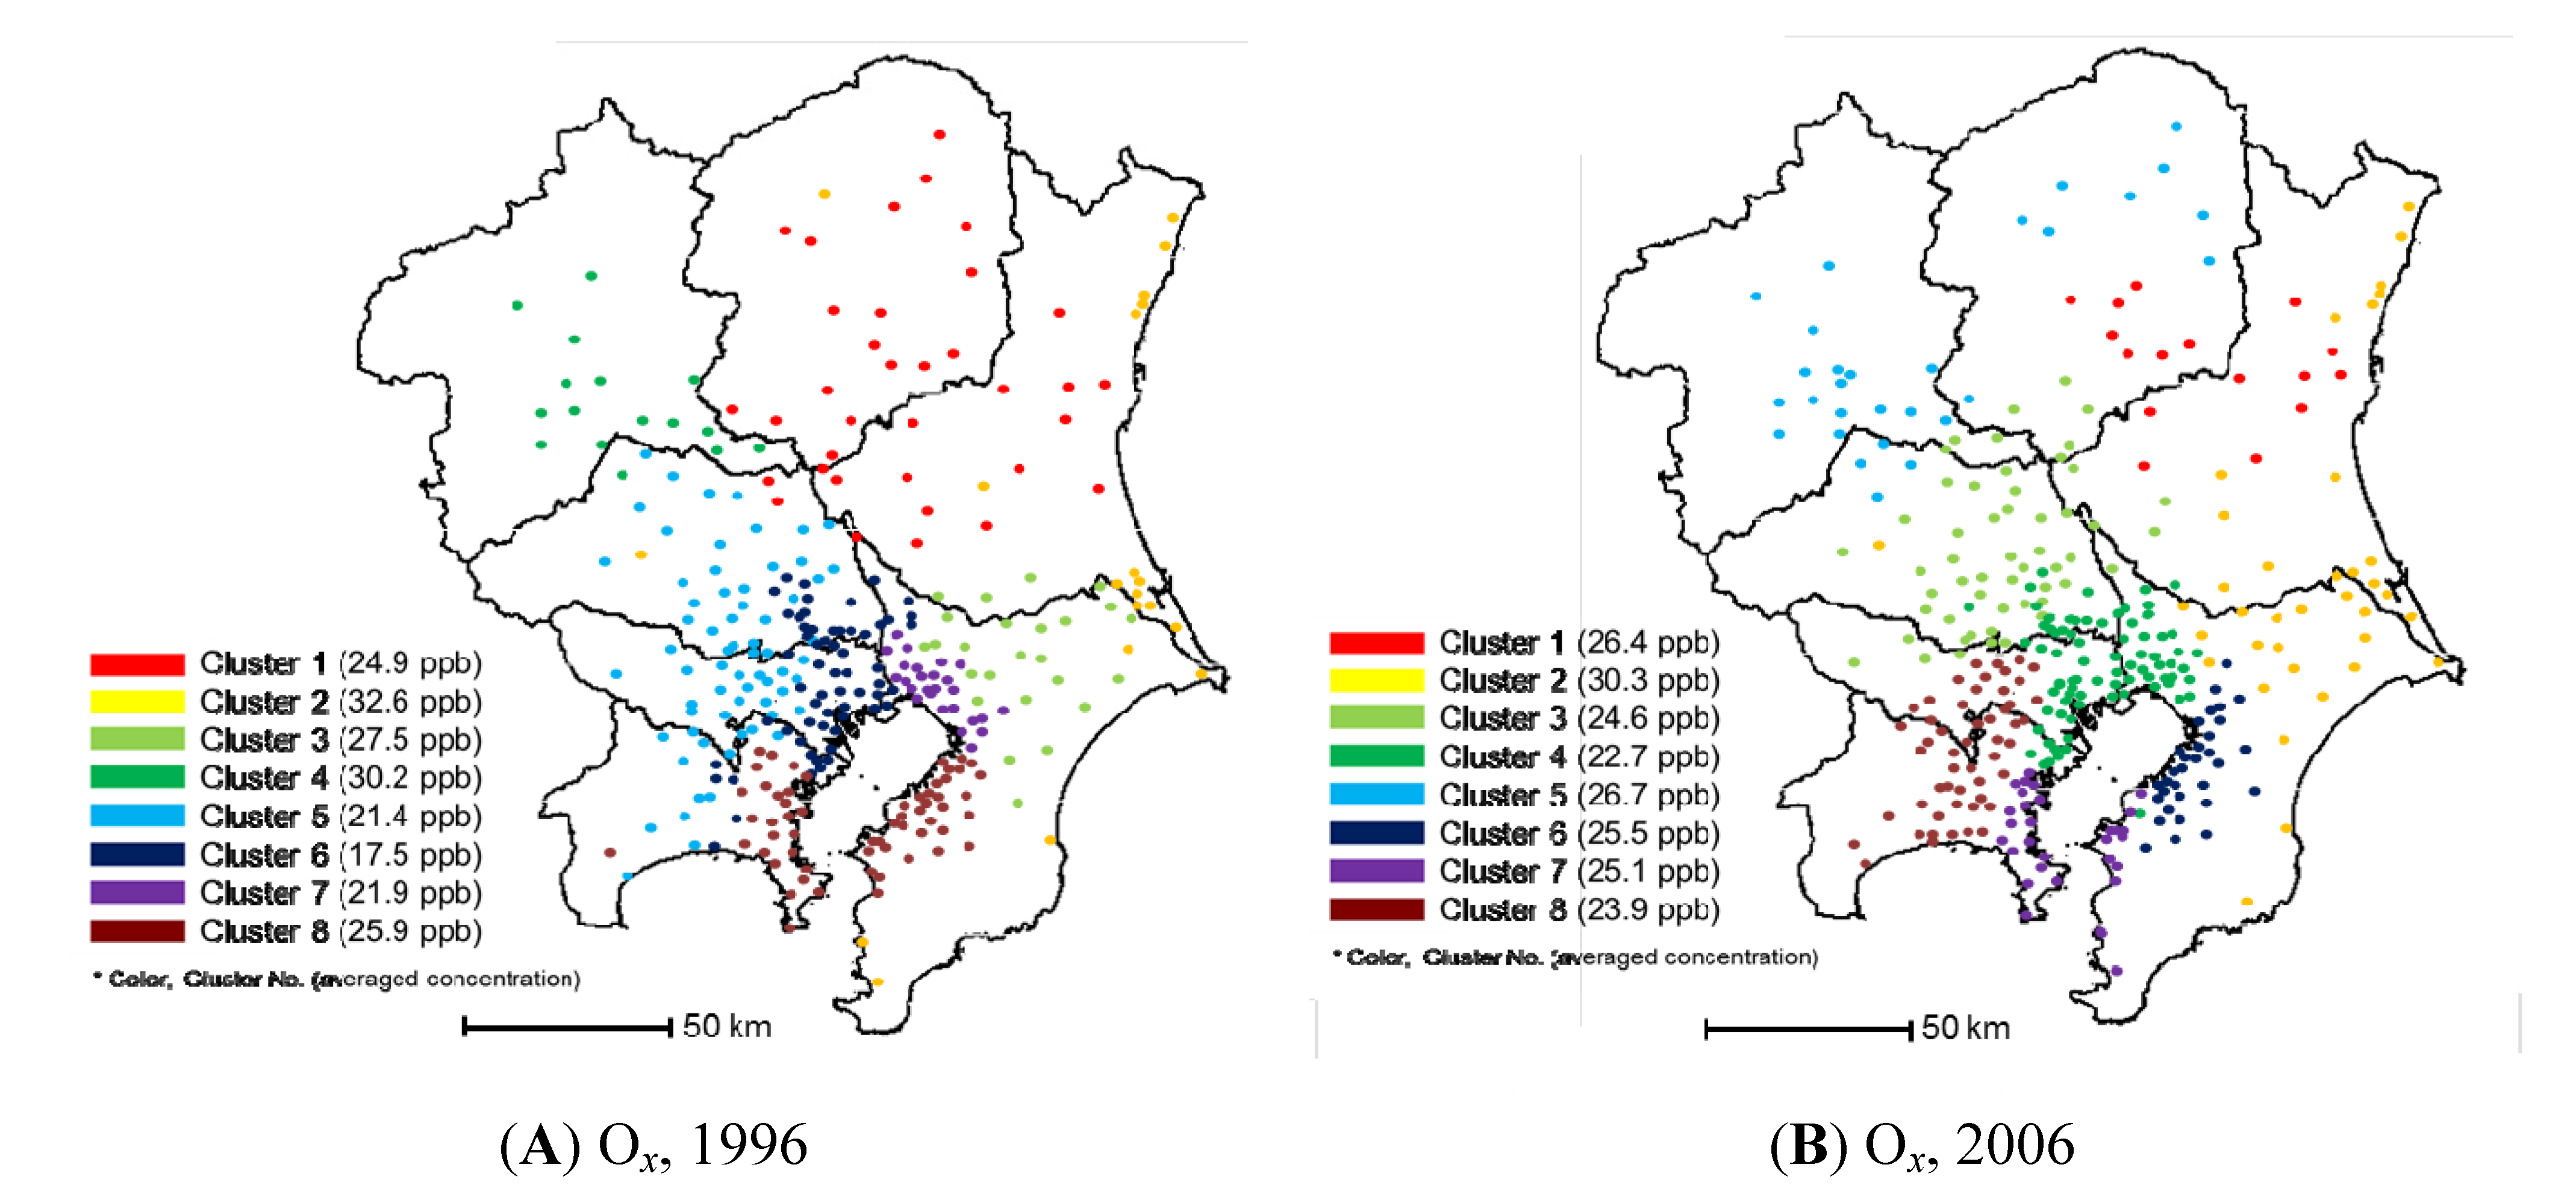
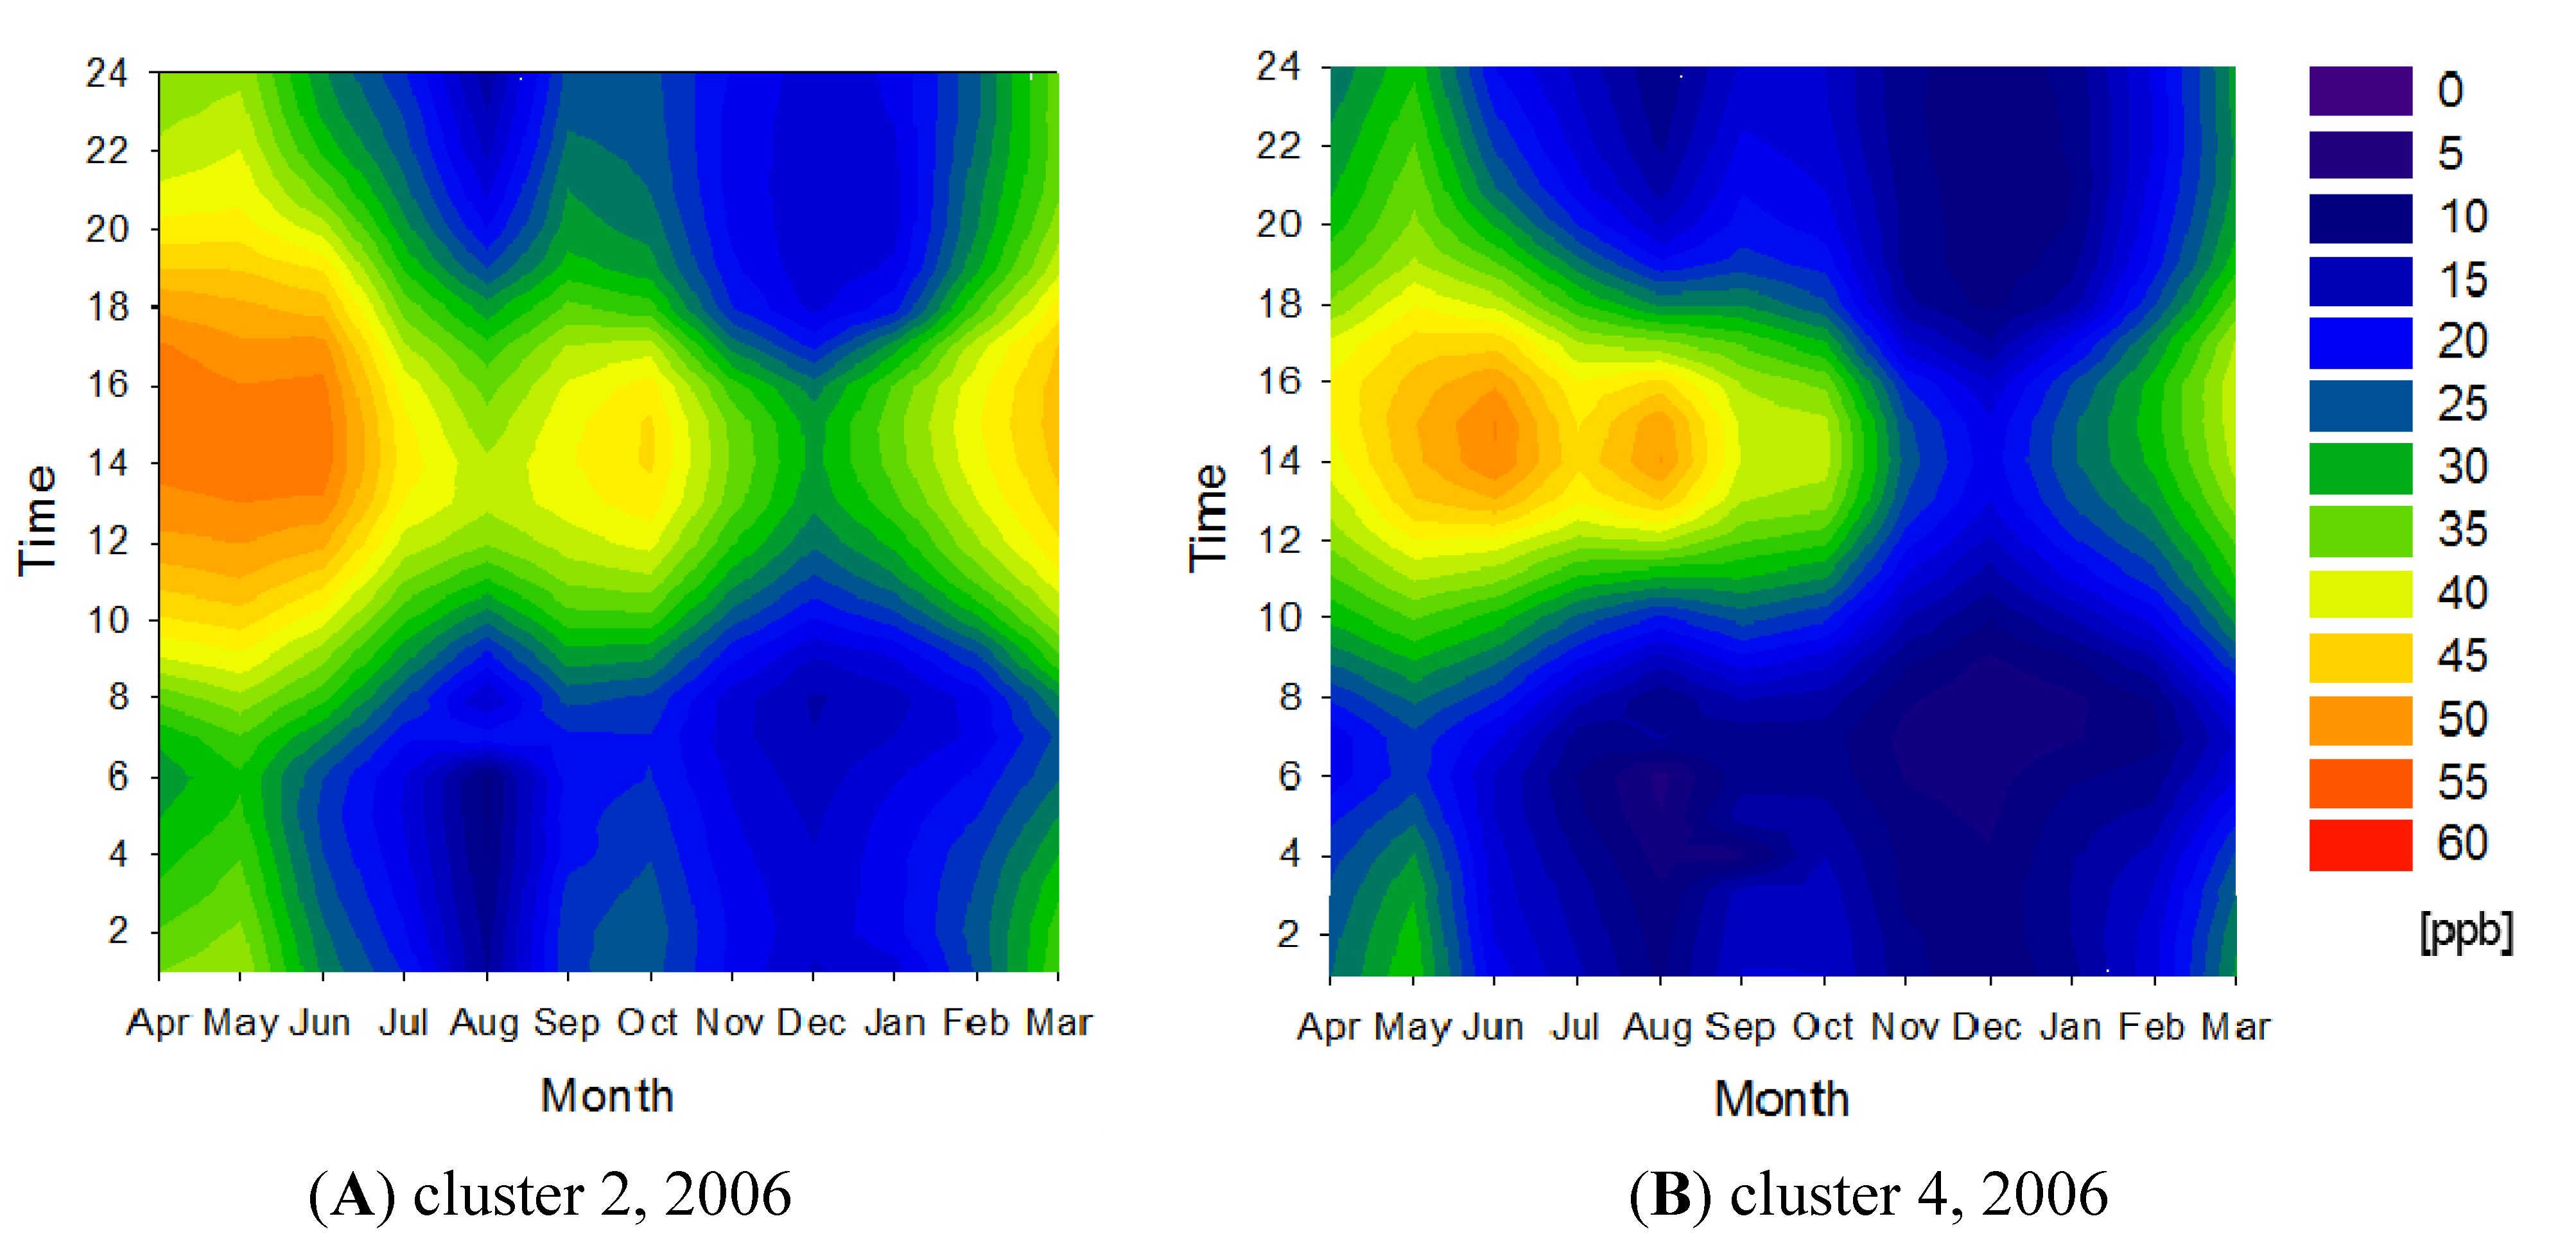
3.2. Ox


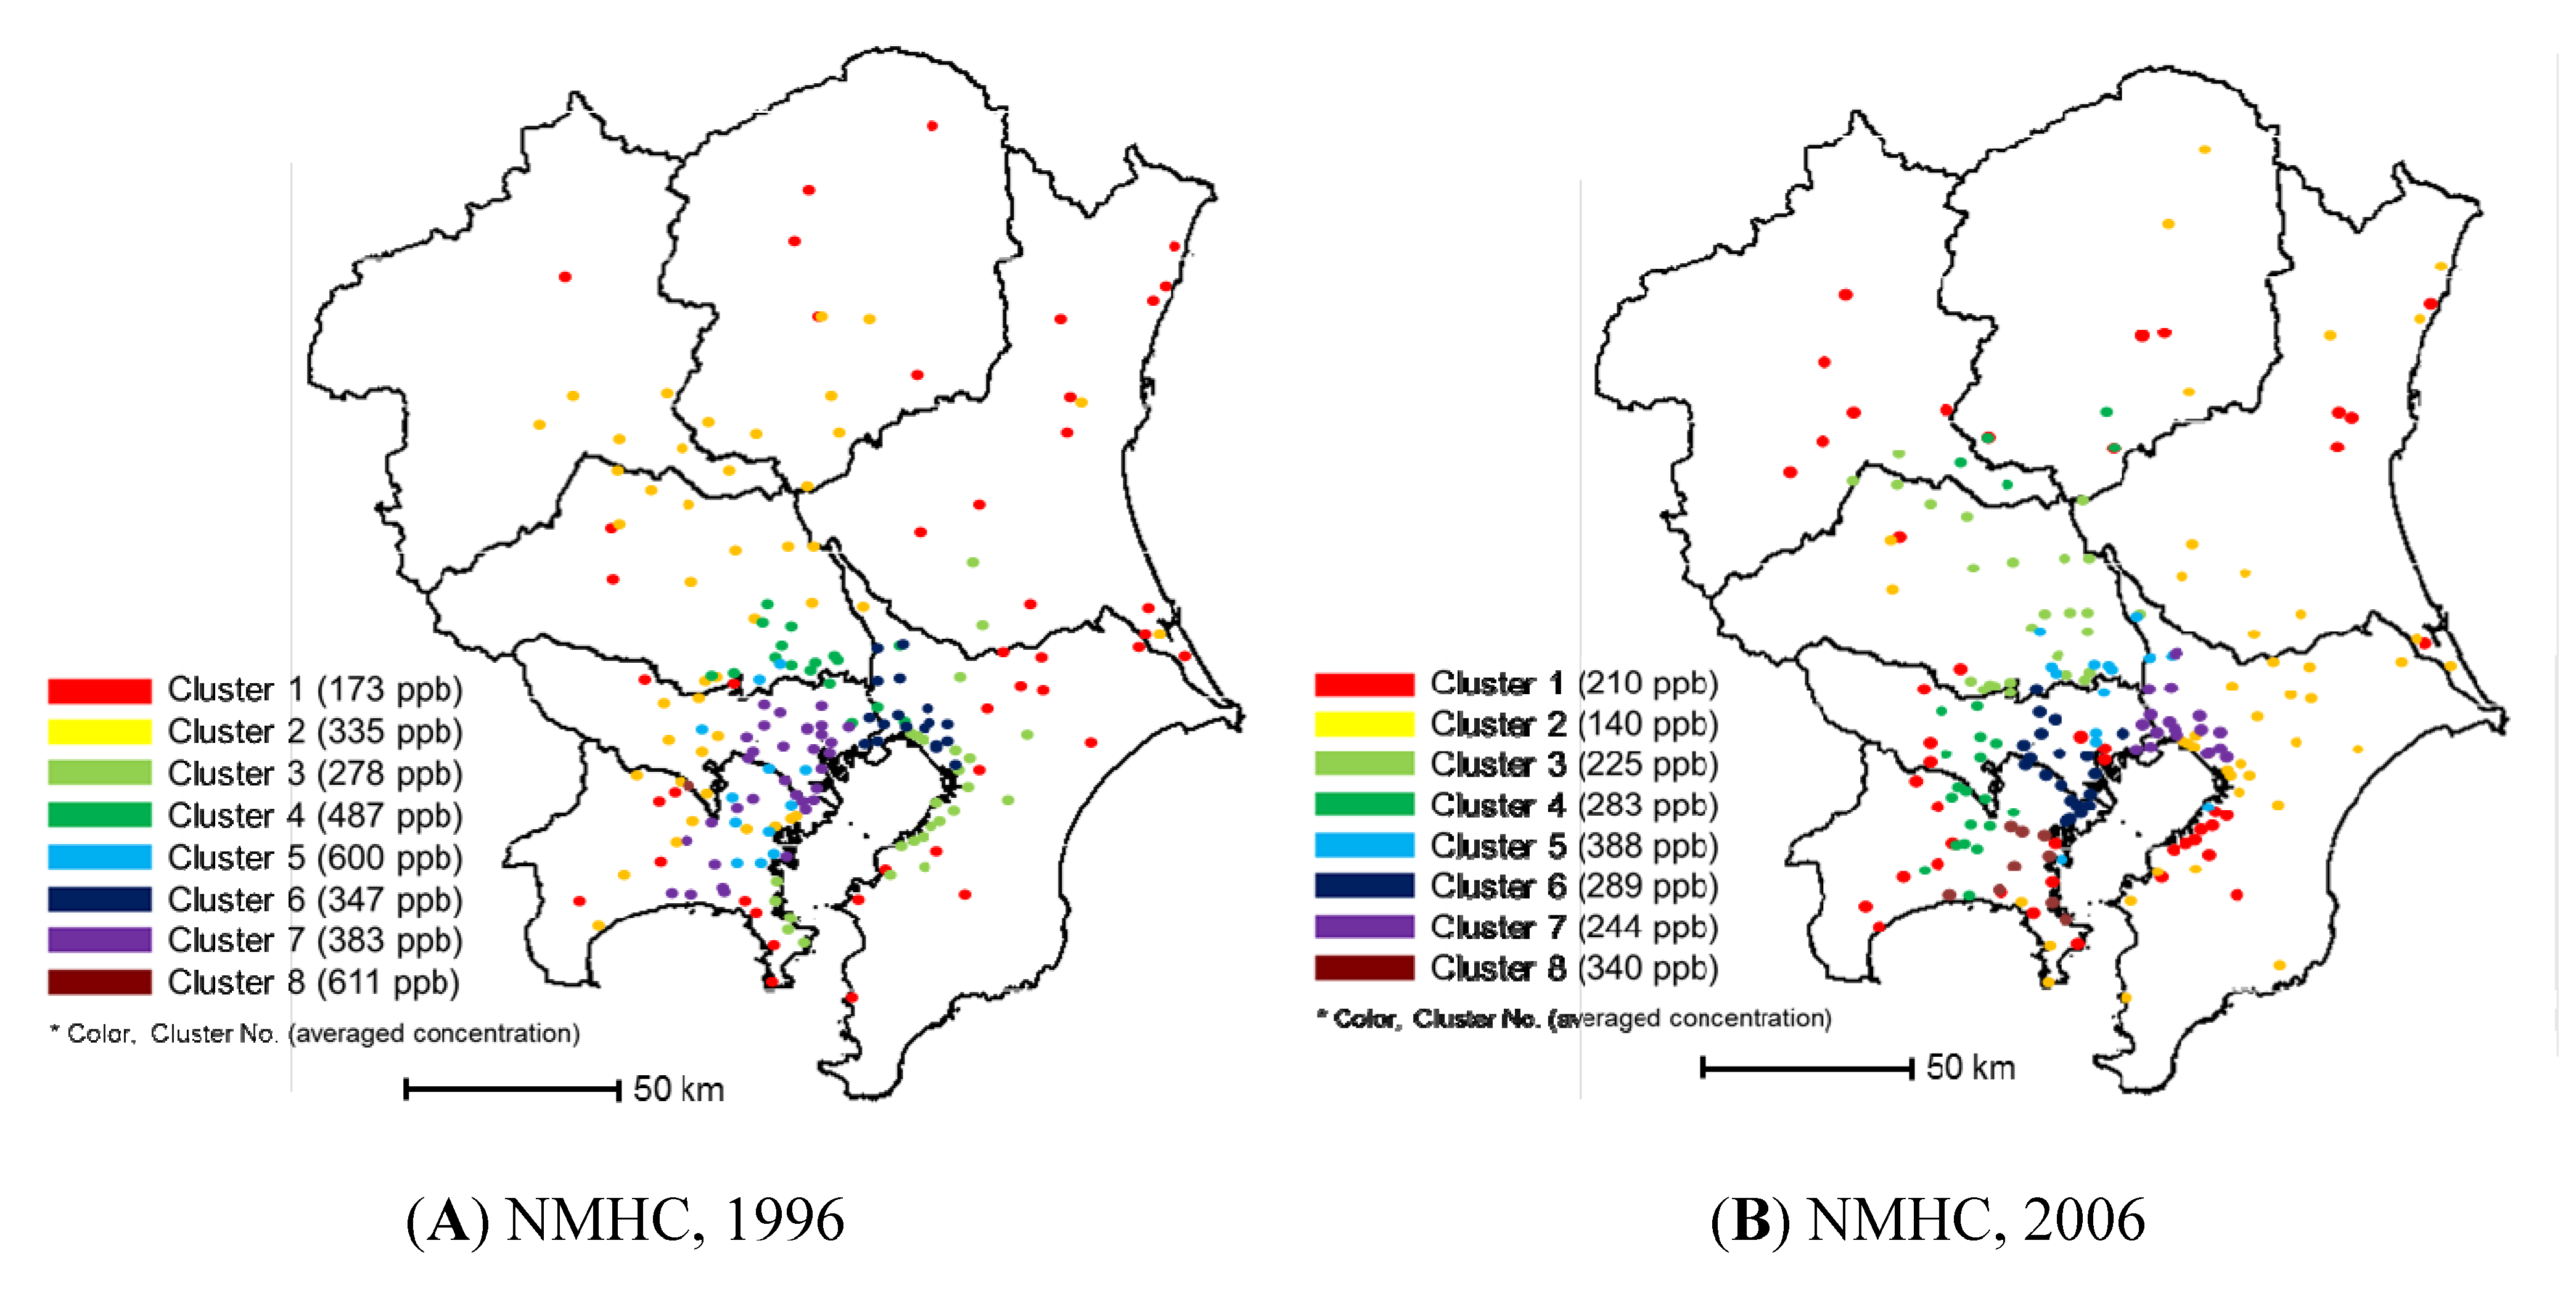
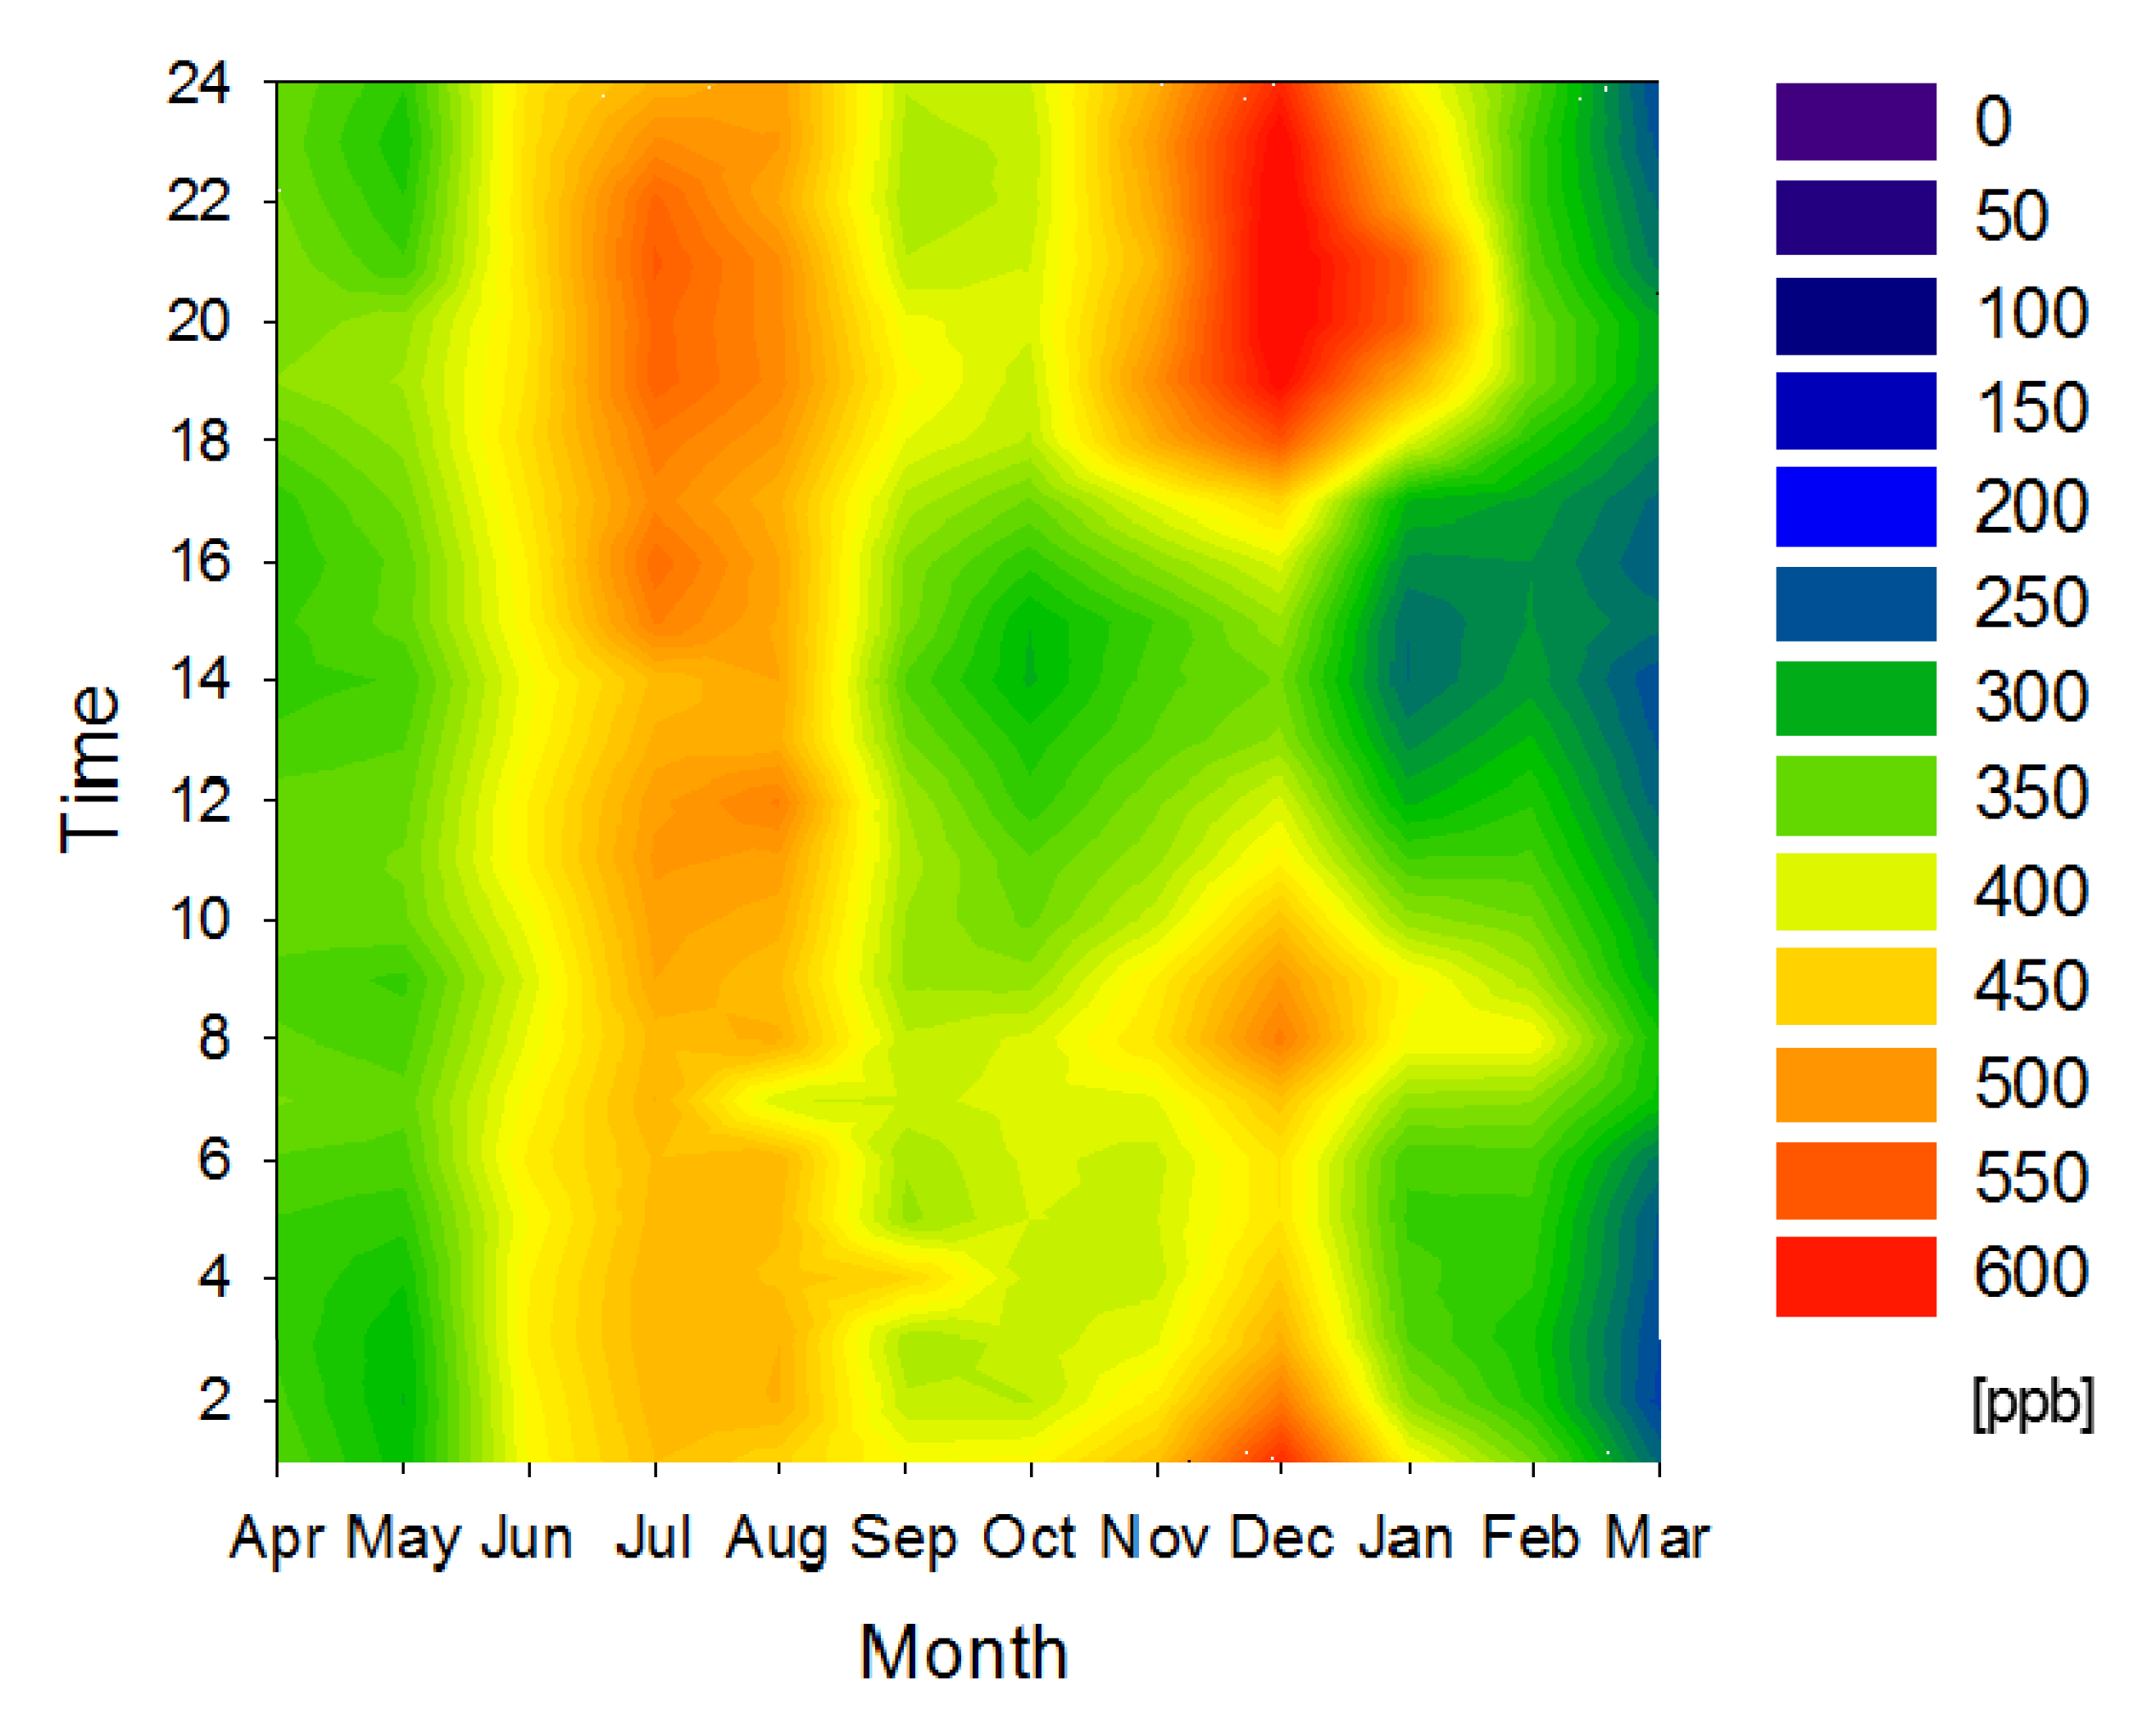
3.3. NMHC


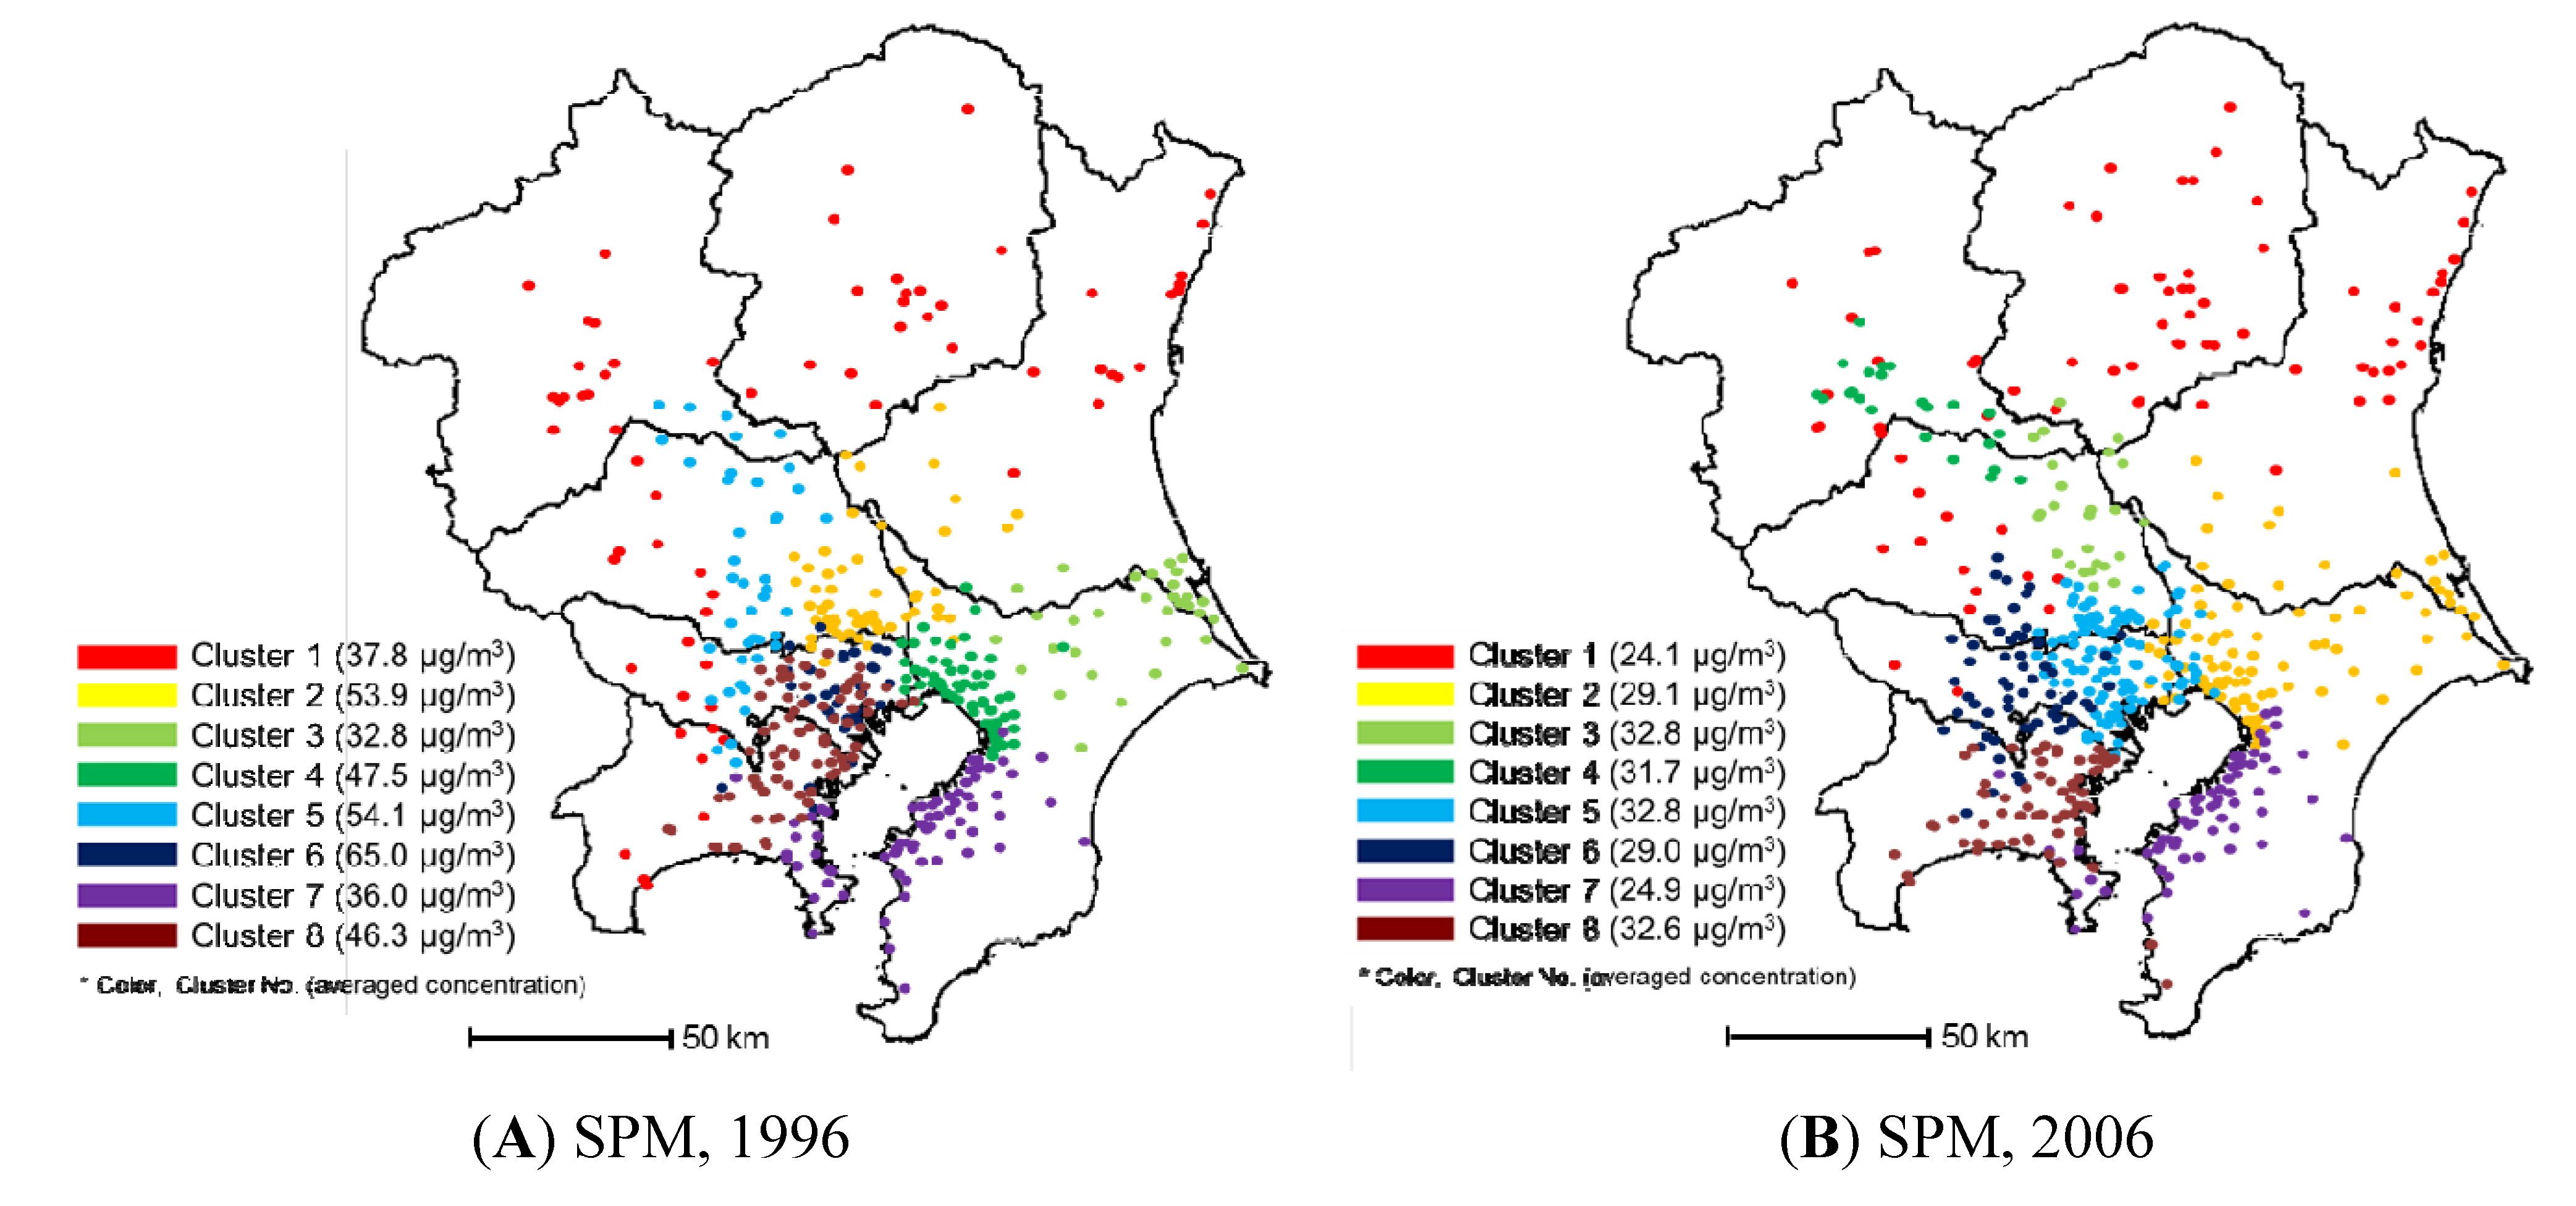
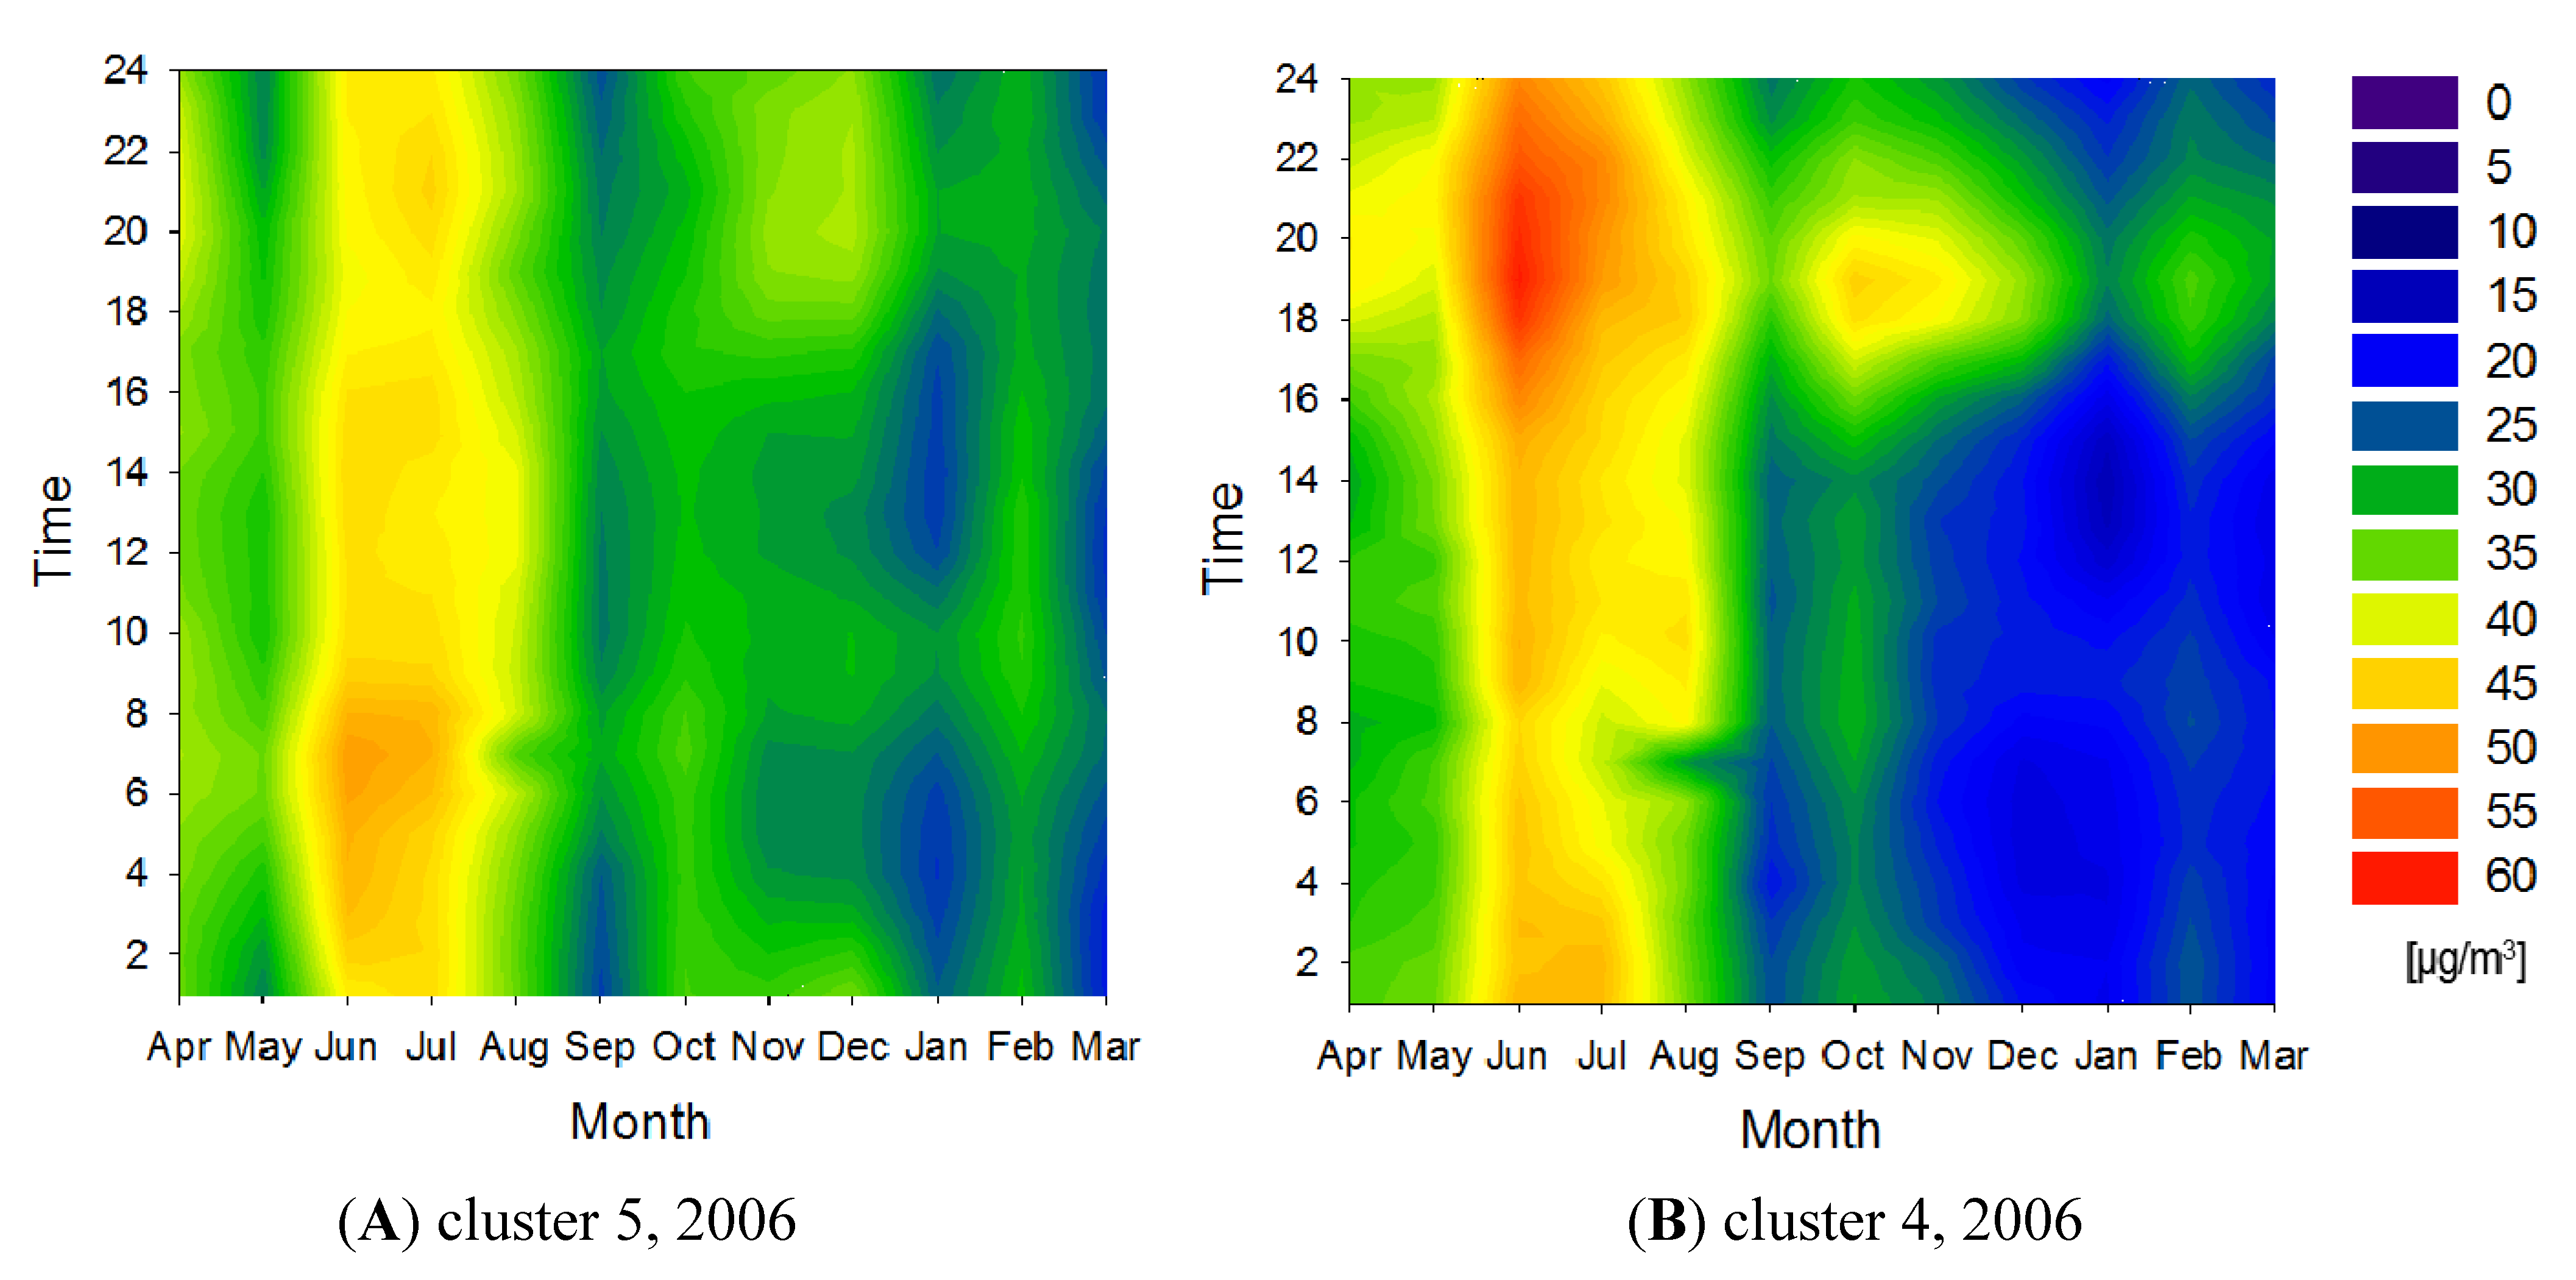
3.4. SPM


4. Conclusions
Acknowledgments
Author Contributions
Conflicts of Interest
References
- Ito, A.; Hirai, H.; Morikawa, T.; Hayashi, S. Application of multiple regression analysis to pollutant concentrations from roadside and ambient air quality monitoring stations. JARI Res. J. 2007, 29, 607–610. (In Japanese) [Google Scholar]
- Shimizu, G.; Yoshizawa, H.; Ishii, H.; Takahashi, T.; Hidaka, T.; Yamamoto, T.; Kotorii, S.; Horiuchi, T. Alteration of the SPM pollution in Pref.Yamanashi compared with the south Kanto area. Annu. Rep. Yamanashi Inst. Public Health 2006, 50, 55–60. (In Japanese) [Google Scholar]
- Shimizu, G.; Egashira, K.; Chisuwa, S. Results of air pollution monitoring for 1988–2007 in Pref. Yamanashi. Annu. Rep. Yamanashi Inst. Public Health 2008, 52, 74–80. (In Japanese) [Google Scholar]
- Everitt, B.S. Cluster Analysis, 3rd ed.; Heinemann Education: London, UK, 1993. [Google Scholar]
- Lavecchia, C.; Angelino, E.; Bedogni, M.; Bravetti, E.; Gualdi, R.; Lanzani, G.; Musitelli, A.; Valentini, M. The ozone patterns in the aerological basin of Milan (Italy). Environ. Software 1996, 11, 73–80. [Google Scholar] [CrossRef]
- Gramsch, E.; Cereceda-Balic, F.; Oyola, P.; Baer, D. Examination of pollution trends in Santiago de Chile with cluster analysis of PM10 and ozone data. Atmos. Environ. 2006, 40, 5464–5475. [Google Scholar] [CrossRef]
- Lu, H.-C.; Chang, C.-L.; Hsieh, J.-C. Classification of PM10 distributions in Taiwan. Atmos. Environ. 2006, 40, 1452–1463. [Google Scholar] [CrossRef]
- Giri, D.; Murthy, V.K.; Adhikary, P.R.; Khanal, S.N. Cluster analysis applied to atmospheric PM10 concentration data for determination of sources and spatial patterns in ambient air-quality of Kathmandu valley. Curr. Sci. 2007, 93, 684–688. [Google Scholar]
- Saksena, S.; Joshi, V.; Patil, R.S. Cluster analysis of Delhi's ambient air quality data. J. Environ. Monit. 2003, 5, 491–499. [Google Scholar] [CrossRef]
- Ignaccolo, R.; Ghigo, S.; Giovenali, E. Analysis of air quality monitoring networks by functional clustering. Environmetrics 2008, 19, 672–686. [Google Scholar] [CrossRef]
- Eneroth, K.; Aalto, T.; Hatakka, J.; Holmen, K.; Laurila, T.; Viisanen, Y. Atmospheric transport of carbon dioxide to a baseline monitoring station in northern Finland. Tellus 2005, 57, 366–374. [Google Scholar] [CrossRef]
- Rieux, C.; Personnaz, M.-B.; Thibaudon, M. Spatial variation of airborne pollen over south-east France: Characterization and implications for monitoring networks management. Aerobiologia 2008, 24, 43–52. [Google Scholar] [CrossRef]
- Sârbu, C.; Einax, J.W. Study of traffic-emitted lead pollution of soil and plants using different fuzzy clustering algorithms. Anal. Bioanal. Chem. 2008, 390, 1293–1301. [Google Scholar] [CrossRef]
- Ministry of the Environment of Japan. Manual for Environmental Air Constant Monitoring; Environmental Management Bureau: Japan, 2007, 5th ed. Available online: http://www.env.go.jp/air/osen/manual_5th/ (accessed on 1 July 2014).
- Tarasova, O.A.; Brenninkmeijer, C.A.M.; Jockel, P.; Zvyagintsev, A.M.; Kuznetsov, G.I. A climatology of surface ozone in the extra tropics: Cluster analysis of observations and model results. Atmos. Chem. Phys. 2007, 7, 6099–6117. [Google Scholar] [CrossRef]
- Zvyagintsev, A.M.; Tarasova, O.A.; Kuznetsov, G.I. Seasonal and daily cycles of surface ozone in the extratropical latitudes. Izv. Atmos. Ocean. Phys. 2007, 44, 474–485. [Google Scholar] [CrossRef]
- The Ministry of Land, Infrastructure and Transport, Kanto Regional Development Bureau. Road Investor Relations Site. Available online: http://www.mlit.go.jp/road/ir/ir-data/ir-data.html (accessed on 22 April 2014).
- Kaneyasu, N.; Suzuki, M.; Sugimoto, N.; Matsui, I.; Shimizu, A. Meteorological factors which causes high SPM concentrations in wide area in rainy season—Analysis of the case in July 1997. Earozoru Kenkyu 2005, 20, 313–322. [Google Scholar]
© 2014 by the authors; licensee MDPI, Basel, Switzerland. This article is an open access article distributed under the terms and conditions of the Creative Commons Attribution license (http://creativecommons.org/licenses/by/3.0/).
Share and Cite
Iizuka, A.; Shirato, S.; Mizukoshi, A.; Noguchi, M.; Yamasaki, A.; Yanagisawa, Y. A Cluster Analysis of Constant Ambient Air Monitoring Data from the Kanto Region of Japan. Int. J. Environ. Res. Public Health 2014, 11, 6844-6855. https://doi.org/10.3390/ijerph110706844
Iizuka A, Shirato S, Mizukoshi A, Noguchi M, Yamasaki A, Yanagisawa Y. A Cluster Analysis of Constant Ambient Air Monitoring Data from the Kanto Region of Japan. International Journal of Environmental Research and Public Health. 2014; 11(7):6844-6855. https://doi.org/10.3390/ijerph110706844
Chicago/Turabian StyleIizuka, Atsushi, Shintaro Shirato, Atsushi Mizukoshi, Miyuki Noguchi, Akihiro Yamasaki, and Yukio Yanagisawa. 2014. "A Cluster Analysis of Constant Ambient Air Monitoring Data from the Kanto Region of Japan" International Journal of Environmental Research and Public Health 11, no. 7: 6844-6855. https://doi.org/10.3390/ijerph110706844