Article

Association of Seasonal Climate Variability and Age-Specific Mortality in Northern Sweden before the Onset of Industrialization

1
Centre for Global Health Research, Department of Public Health and Clinical Medicine, Umeå University, Umeå 90187, Sweden
2
Demographic Database, Umeå University, Umeå 90187, Sweden
3
Department of Mathematics and Mathematical Statistics, Umeå University, Umeå 90187, Sweden
4
Ageing and Living Conditions Programme, Umeå University, Umeå 90187, Sweden
*
Author to whom correspondence should be addressed.
Int. J. Environ. Res. Public Health 2014, 11(7), 6940-6954; https://doi.org/10.3390/ijerph110706940
Submission received: 1 April 2014 / Revised: 19 June 2014 / Accepted: 24 June 2014 / Published: 7 July 2014

Abstract

:
Background and aims: Little is known about health impacts of climate in pre-industrial societies. We used historical data to investigate the association of temperature and precipitation with total and age-specific mortality in Skellefteå, northern Sweden, between 1749 and 1859. Methods: We retrieved digitized aggregated population data of the Skellefteå parish, and monthly temperature and precipitation measures. A generalized linear model was established for year to year variability in deaths by annual and seasonal average temperature and cumulative precipitation using a negative binomial function, accounting for long-term trends in population size. The final full model included temperature and precipitation of all four seasons simultaneously. Relative risks (RR) with 95% confidence intervals (CI) were calculated for total, sex- and age-specific mortality. Results: In the full model, only autumn precipitation proved statistically significant (RR 1.02; CI 1.00–1.03, per 1cm increase of autumn precipitation), while winter temperature (RR 0.98; CI 0.95–1.00, per 1 °C increase in temperature) and spring precipitation (RR 0.98; CI 0.97–1.00 per 1 cm increase in precipitation) approached significance. Similar effects were observed for men and women. The impact of climate variability on mortality was strongest in children aged 3–9, and partly also in older children. Infants, on the other hand, appeared to be less affected by unfavourable climate conditions. Conclusions: In this pre-industrial rural region in northern Sweden, higher levels of rain during the autumn increased the annual number of deaths. Harvest quality might be one critical factor in the causal pathway, affecting nutritional status and susceptibility to infectious diseases. Autumn rain probably also contributed to the spread of air-borne diseases in crowded living conditions. Children beyond infancy appeared most vulnerable to climate impacts.

Graphical Abstract

1. Introduction

In recent years, interest in the role of weather and climate on health of pre-industrial societies has increased. While a number of publications mention impacts of climate variability on agriculture [1,2], it appears that temperature was of less importance for hunters and gatherers in northern Finland [3]. However, the vast majority of studies are conducted on modern populations, and we lack detailed knowledge about the climate-mortality link before the 20th century. Investigations into causal processes and vulnerabilities across places and times might inform us about the potential consequences of ongoing climate change in contemporary societies.
In Europe, famines and great epidemics that had been reoccurring events in the centuries before became less frequent during the 18th and 19th century [4,5]. The end of the so-called little ice age in Europe [2] coincided with the slow beginning of the industrialization—urbanization, technological development and societal re-organization during the 18th and 19th century [6]. In Sweden, particularly in the northern parts, industrialization did not start before the 1850s, and most towns kept a rural character until the turn of the century [6]. This was the case also for Skellefteå during the 1700s and 1800s, the place of the present study, situated on the Gulf of Bothnia. The region of Skellefteå included the market place of Skellefteå, and a number of surrounding rural villages. The main income of the population consisted of farming and forestry. In this region, mortality was lower than the national average, especially among infants and children. The most frequent causes of death, like in other places in Sweden, were infectious diseases such as small pox (children), tuberculosis, dysentery and other diarrheal diseases [6,7,8]. During the 1800s, population numbers grew fast, due to high fertility and a rapid decline in mortality rates [9], although there were still occasional epidemics and years with many deaths as elsewhere in Sweden [6]. Major events affecting mortality during the 18th and 19th century were harvest failures in the 1750s–1780s, the Finnish war in 1808/09 (about one third of cattle in the Skellefteå region had to be slaughtered for the army, and epidemics were spread by soldiers marching through), and a number of famines in 1812, 1828–1838, and the 1850s [7,10]. External factors relevant for human health and survival were thus related to harvest, nutritional status and warfare.
While many scholars, particular historians, have looked at the role of social unrest, little attention has been paid to the natural environment. Much evidence is anecdotal or descriptive in nature, and could merely reflect coincidences. In particular, the impact of meteorological factors on human survival needs to be investigated with rigorous statistical testing and in-depth analyses, based on reliable quantitative data. Here it is relevant to look not only at extreme events—drought, storms or unusually cold winters—but also at normal-range variations in annual or seasonal precipitation and ambient temperature. In a study on reindeer herders in Lapland during the 18th and 19th century, Helle and Helama found that mean annual temperature was only weakly associated with a decreased number of burials and baptisms [3]. Guy [11] investigated as early as in 1881 the relationship between seasonal temperature and mortality in 18th century England. He reported excess death counts in colder months (December to March), and detected similar seasonal patterns across age-groups, with the exception of younger children. Catalano et al. [12] demonstrated with data from pre-industrial northern Europe that lower ambient temperature lead to a decreased survival of male foetuses, producing a more robust cohort characterized by a longer life span of boys surviving the first year.
We assume that precipitation may be at least as relevant for population health as temperature, as it is related to waterborne infectious diseases, crop growth during springtime and summer, and harvest quality in late summer and autumn. Rainfall thus might have been associated with food supply at a time when societies still were largely dependent on local food markets. Our assumption was also that the timing of rainfall and warmer temperatures during the year was relevant for survival, hypothesizing that it would affect harvest outcomes and the spread of infectious diseases. In a previous study [13], we showed that high rainfall levels during autumn significantly increased mortality in 18th–19th century Uppsala, southern Sweden, while springtime precipitation, on the other hand, had a protective effect. Temperature seemed less relevant for human survival in this pre-industrial town. Helle and Helama [3] hypothesized in their study of reindeer herders in pre-industrial Finnish Lapland that climate might affect young and old individuals more than middle-aged adults and that there also might be a gender difference. They did not, however, conduct age- or sex-stratified analyses. To our knowledge, there is no empirical evidence about age-specific climate impacts in pre-industrial societies. Since children of different ages and adults differ in respect to mortality rates and causes of death, there might also be differential vulnerability to climatic factors.
The aim of the present study was, first, to investigate the influence of annual and seasonal climate variability (temperature, precipitation) on annual total mortality in Skellefteå, a rural market place in northern Sweden, before and during the beginning of industrialization. The second aim was to analyse the influence of climate variability on age- and sex-specific mortality.
With the term “climate variability” we refer hereby to fluctuations in average meteorological conditions over a time span ranging from a couple of weeks to a year. This has to be differentiated from weather variability which addresses short-term changes in temperature and precipitation, and from climate change, which refers to changes in average climate stretching over several decades to centuries.

2. Methods

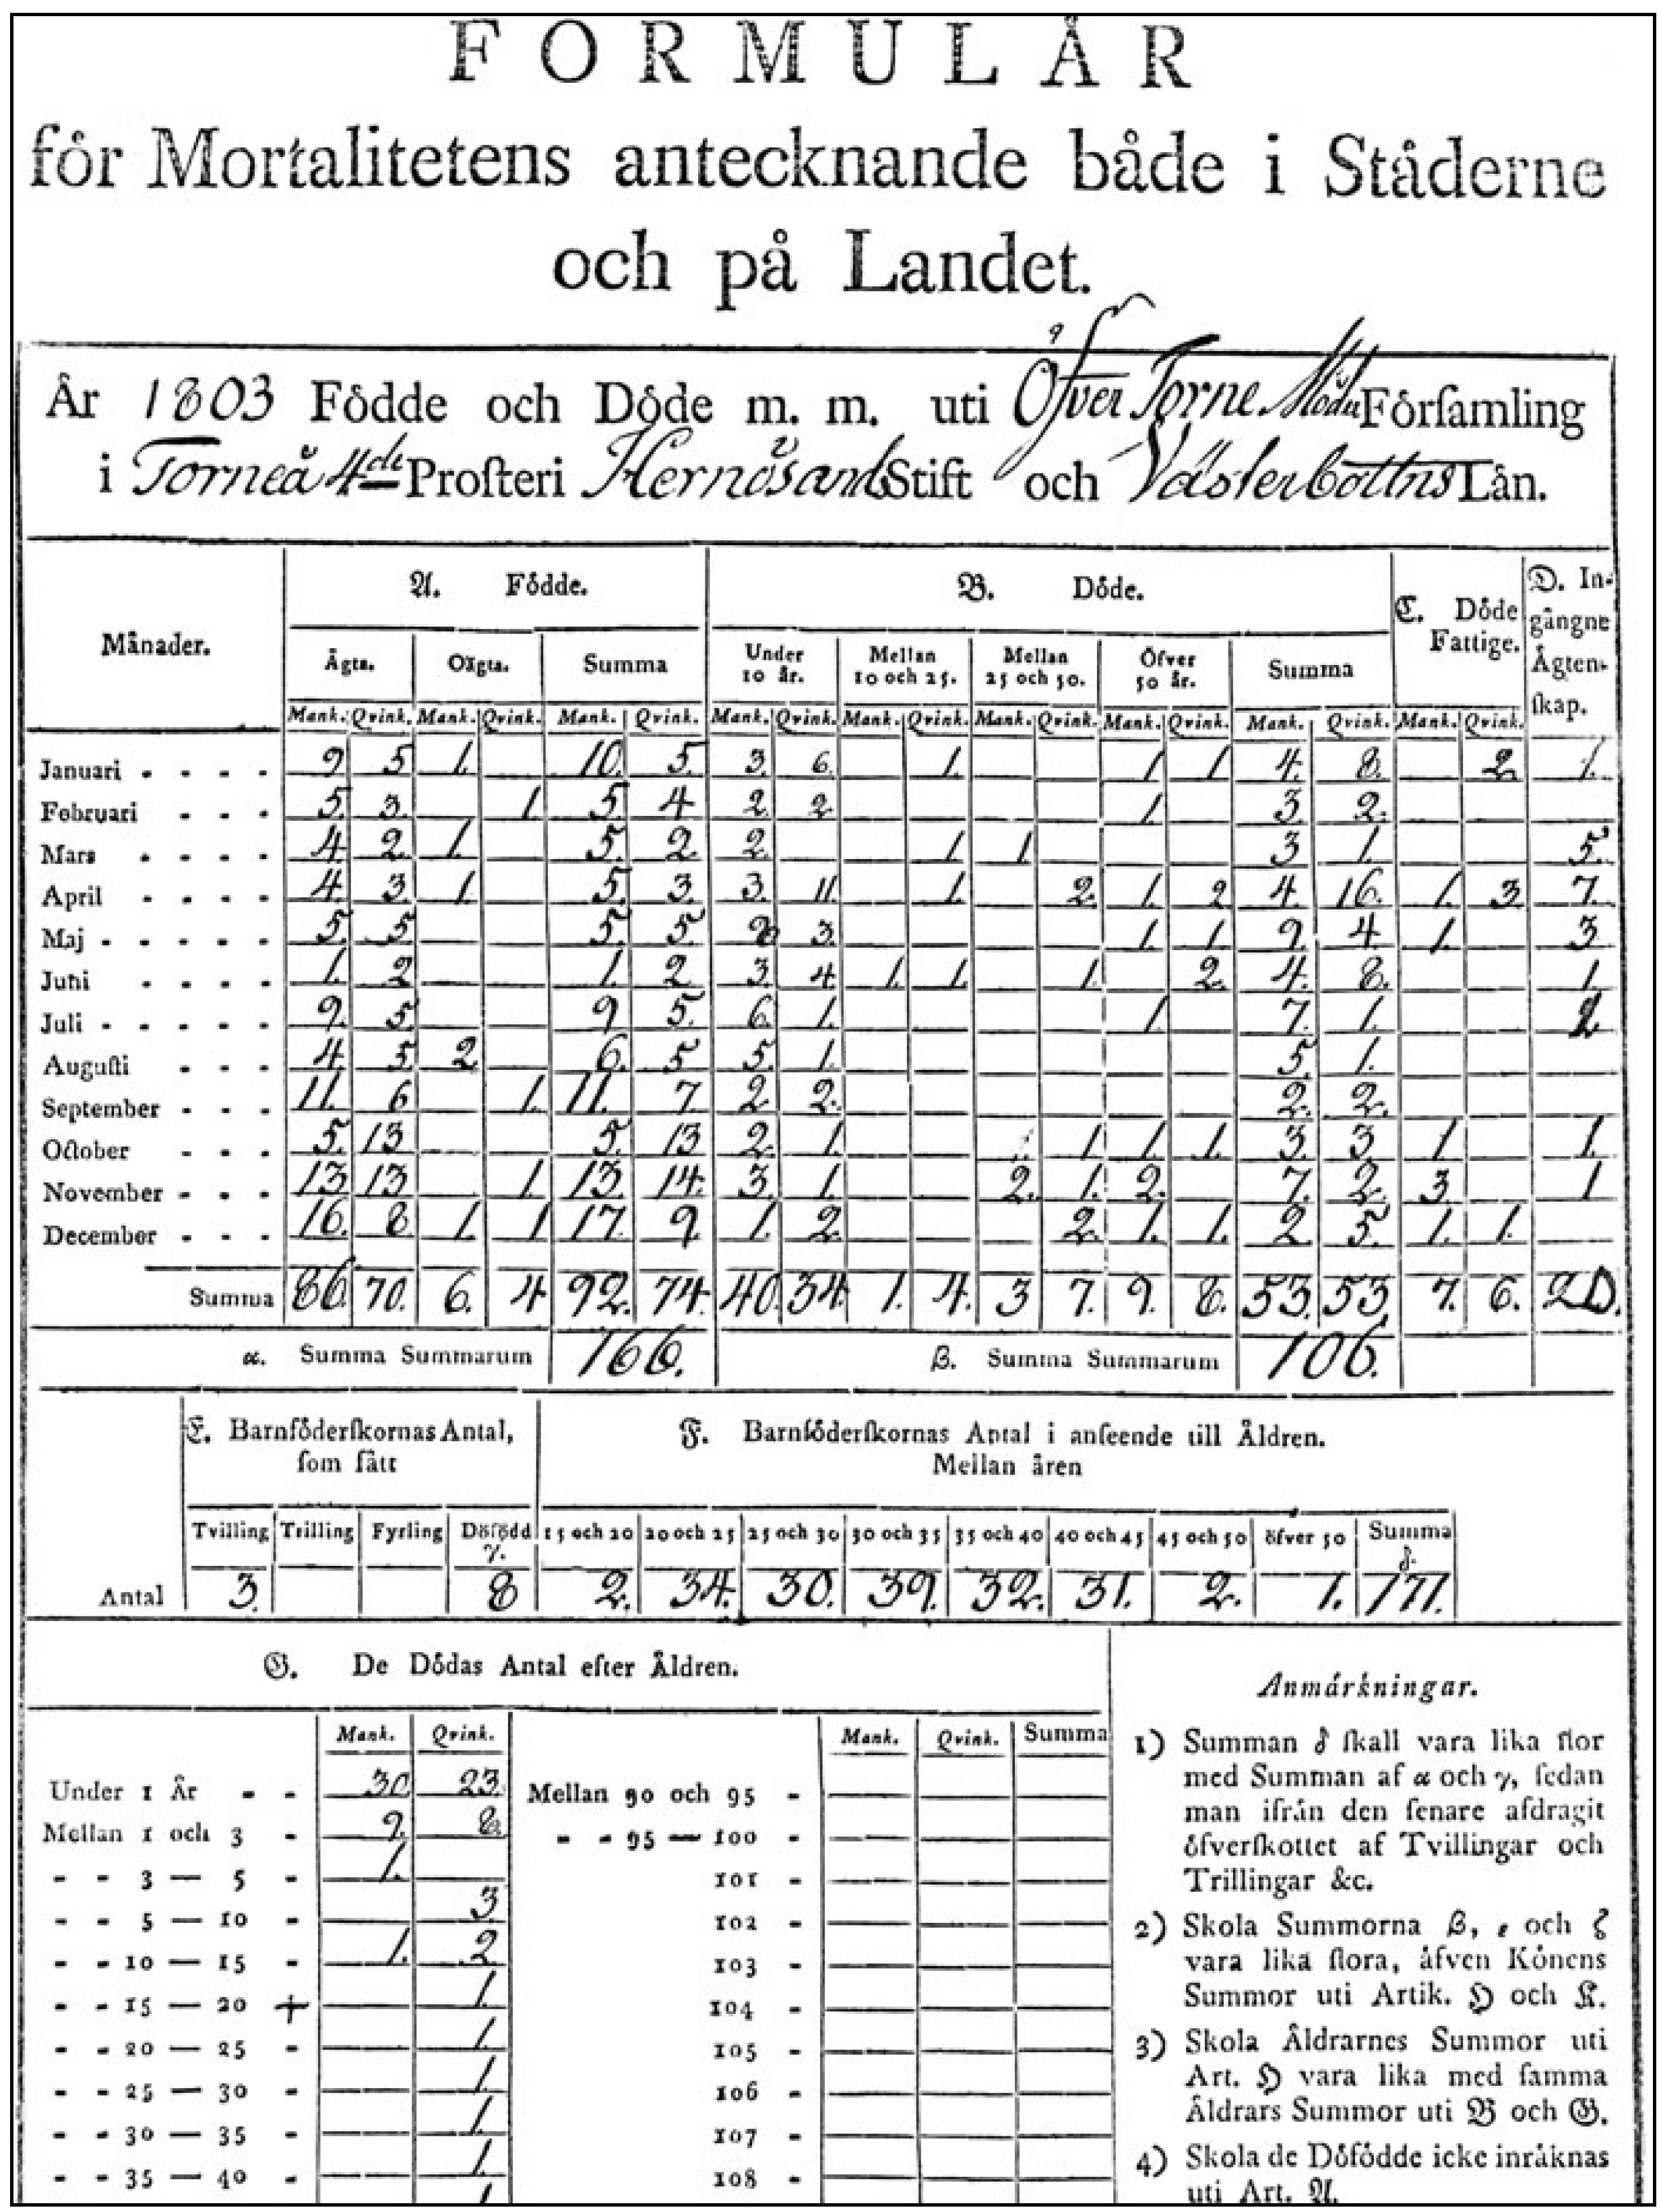
2.1. Demographic Data

Annual population numbers and death counts by sex and age-group for Skellefteå parish were obtained from the Demographic Database (DDB) at Umeå University. The DDB contains digitized vital data of all church parishes in Sweden that were documented annually by parish ministers and collected by the so-called Tabellverket commission between 1749 and 1859 [14,15]. These data include the number of annual births and deaths (Figure 1) as well as—on average for every fifth year—population counts by age-group and sex. The number of annual deaths were available for five year age-groups, but were accumulated for the present analyses into the categories <1 year, 1–2 years, 3–9 years, 10–14 years, 15–24 years, 25–49 years, and ≥50 years.
Figure 1. Reporting annual deaths in the Parish—Example of a Tabellverket form.
Ijerph 11 06940 g001

2.2. Meteorological Data

Monthly and annual data on average temperature and cumulative precipitation were obtained based on measurements in Uppsala (southern Sweden), Tornedalen (northern Sweden) and Umeå (140 km south of Skellefteå). The Uppsala data (1722–2009), the Umeå data (1860–2009) and the Tornedalen data (2003–2009 from Haparanda) were retrieved from the Swedish Meteorological and Hydrological Institute (SMHI). Earlier Tornedalen data (1802–1859) were taken from Klingbjer and Moberg [16]. Moberg and colleagues homogenised and validated the temperature measurements of Uppsala [17,18]. Umeå monthly temperature prior to 1860 was reconstructed based on the available data; see the Appendix for more details. The Uppsala precipitation data and the reconstructed temperature data for Umeå are used in this paper.
We considered annual average temperature and annual cumulative precipitation as independent variables, but the main variables of interest in this study were seasonal temperature and precipitation. The winter season included hereby January and February, springtime March to May, summer June to August, and autumn September to November. Note that the month of December was omitted from the seasonal models, since it was assumed to have little impact on annual mortality during the same calendar year. Delayed effects occurring during the following calendar year were not considered.
Seasonal cumulative precipitation was estimated from two months by multiplying their sum by 1.5, if measurement of one month was missing; in the case of two or three missing datapoints in one season, the value of this season was treated as missing data. No missing monthly temperature data occurred due to the statistical reconstruction. Temperature values are given in °C, and precipitation values in cm.

2.3. Statistical Methods

Annual mortality, the main outcome of this study, refers to the number of deaths in each calendar year between 1749 and 1859. Secondary outcomes were age-specific and sex-specific annual deaths. Independent variables were annual and seasonal temperature and precipitation, respectively. A generalized linear model using a negative binominal distribution was established for estimating year to year variability in annual death counts as predicted by seasonal average temperature and cumulative precipitation.
Due to increasing population numbers and decreasing mortality rates associated with socio-economic changes and improvement in living standard, death counts were assumed to change over time, which necessitated a de-trending function in the climate-mortality models. Therefore, the log numbers of the inter-decadal trend in expected death counts were included as an offset in the regression models. Expected deaths were estimated in a regression model with a smooth function based on year and observed deaths.
In the first climate-mortality model, annual temperature and precipitation were included to predict de-trended total annual death counts. Second, seasonal temperature and precipitation were included season-wise, hence adjusting for each other’s effects on mortality. In the final full model, seasonal temperature and precipitation of all four seasons were included simultaneously.
The same analyses—using annual, season-wise and all seasons’ climate—were further conducted stratified by sex and by age-group. Relative risks (RR) with 95% confidence intervals (CI) were calculated; significance was tested at the 5% level. P-values between 5% and 10% were considered approaching statistical significance. SPSS version 19.0 (Armonk, NY, IBM Corp.) was used to conduct the analyses.

3. Results and Discussion

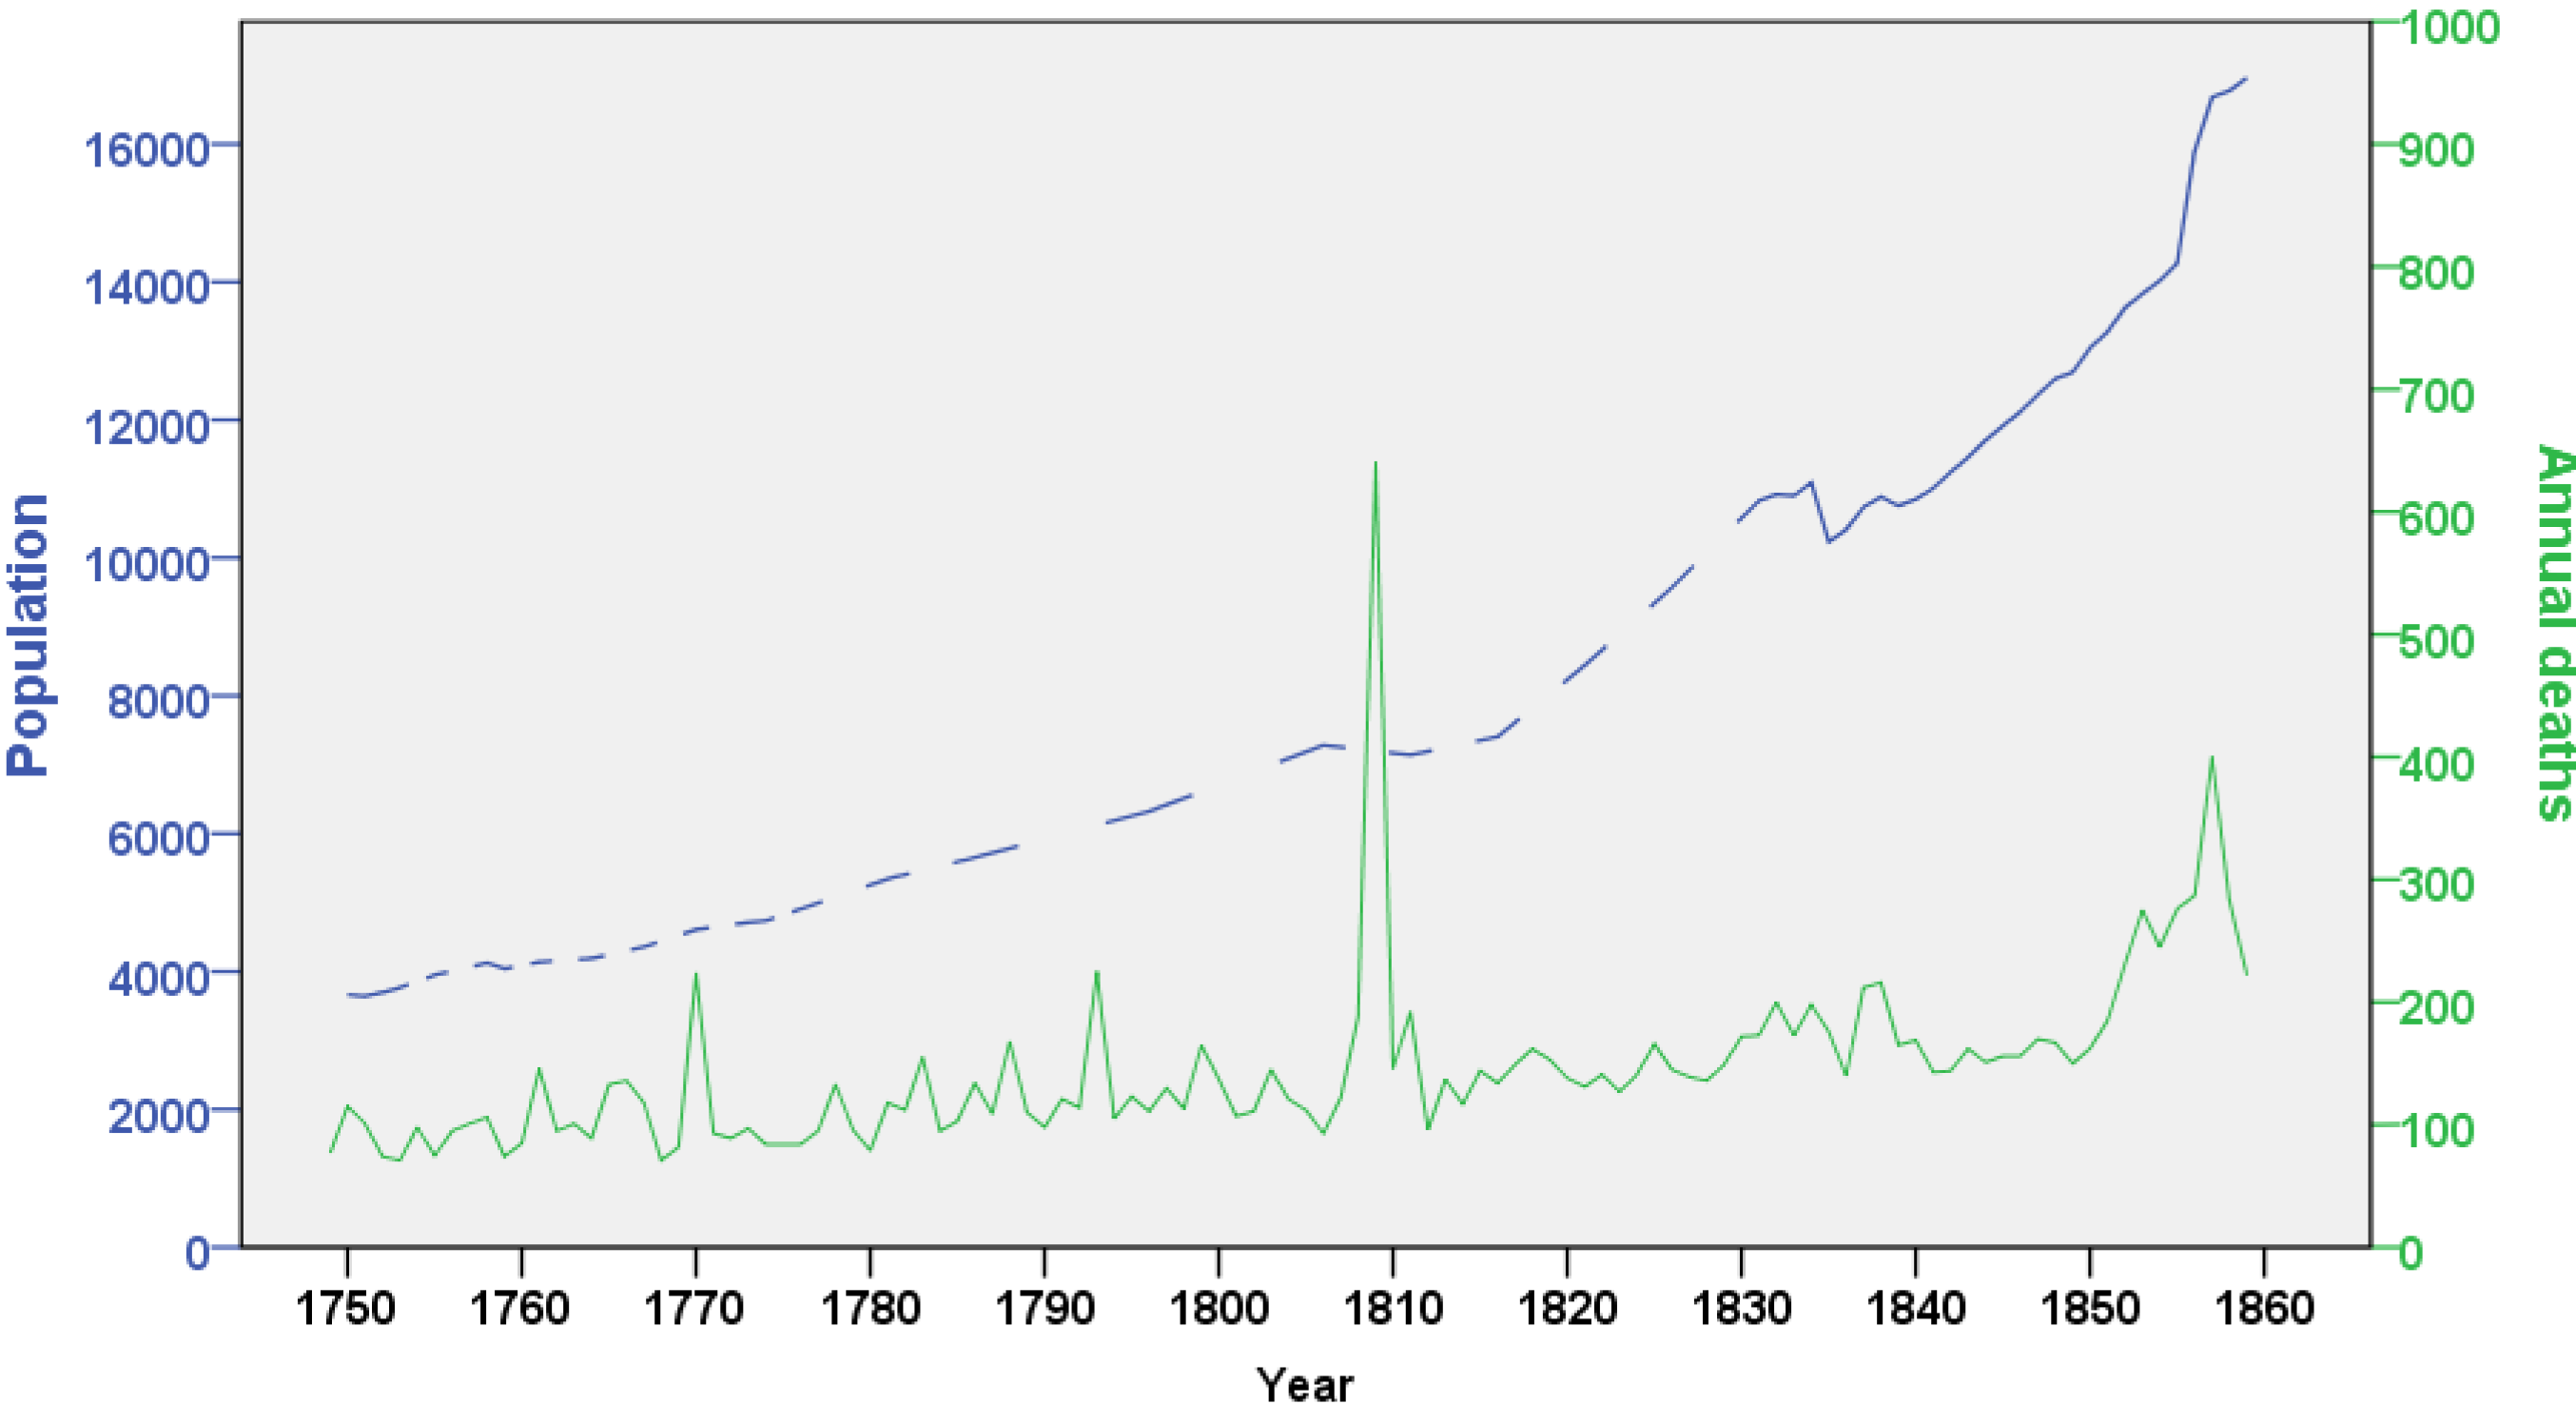
3.1. Demographic Changes over Time

During the observation period, the population in Skellefteå parish increased from 3665 in 1750 to 16,693 in 1859, owing to high fertility rates and rapidly decreasing mortality. Nevertheless, fluctuation of death counts was high, with several peaks related to war, famines and disease outbreaks. The highest number of annual deaths occurred in 1809, a consequence of the Finnish war, while in the 1850s, absolute death counts were high because of increased population numbers, but also because of famines (Figure 2).
Figure 2. Population changes over time, Skellefteå 1749–1859.
Ijerph 11 06940 g002
Mortality showed also seasonal fluctuations, with higher death rates during winter. The lowest average monthly death count was in September (median = 9 deaths), and the highest in January (median = 13), with an absolute minimum of two and a maximum of 288 deaths per month (which occurred during the war in September 1809) (data not shown).

3.2. Climate

The mean annual temperature in Umeå (estimated from measurements in Uppsala and Tornedalen) was 2.2 °C, ranging between 0.0 °C (in 1856) and 4.7 °C (in 1826). In January, the coldest month of the year, median temperature was −9.4 °C, and in July, the warmest month, it was +15.5 °C.
The climate became much wetter during the register period (measurements taken in Uppsala). Annual precipitation ranged between 25.1 cm (in 1793) and 74.8 cm (in 1851). Most seasons had medium levels of precipitation in the 1700s, low levels in the first decades of the 19th century, and high levels after that. This was the case also for annual precipitation (Figure 3). Rainfall levels were generally highest in the summer months, followed by autumn months.
Figure 3. Annual precipitation (cm), Skellefteå 1749–1859.
Ijerph 11 06940 g003

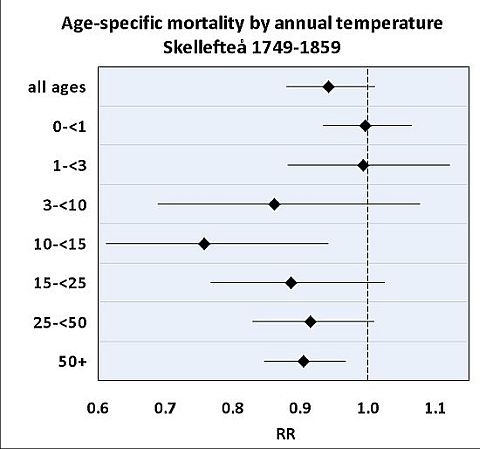
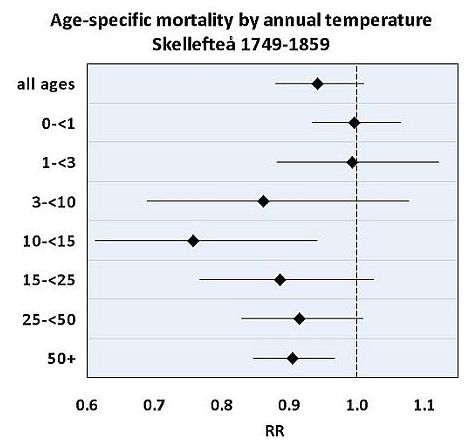
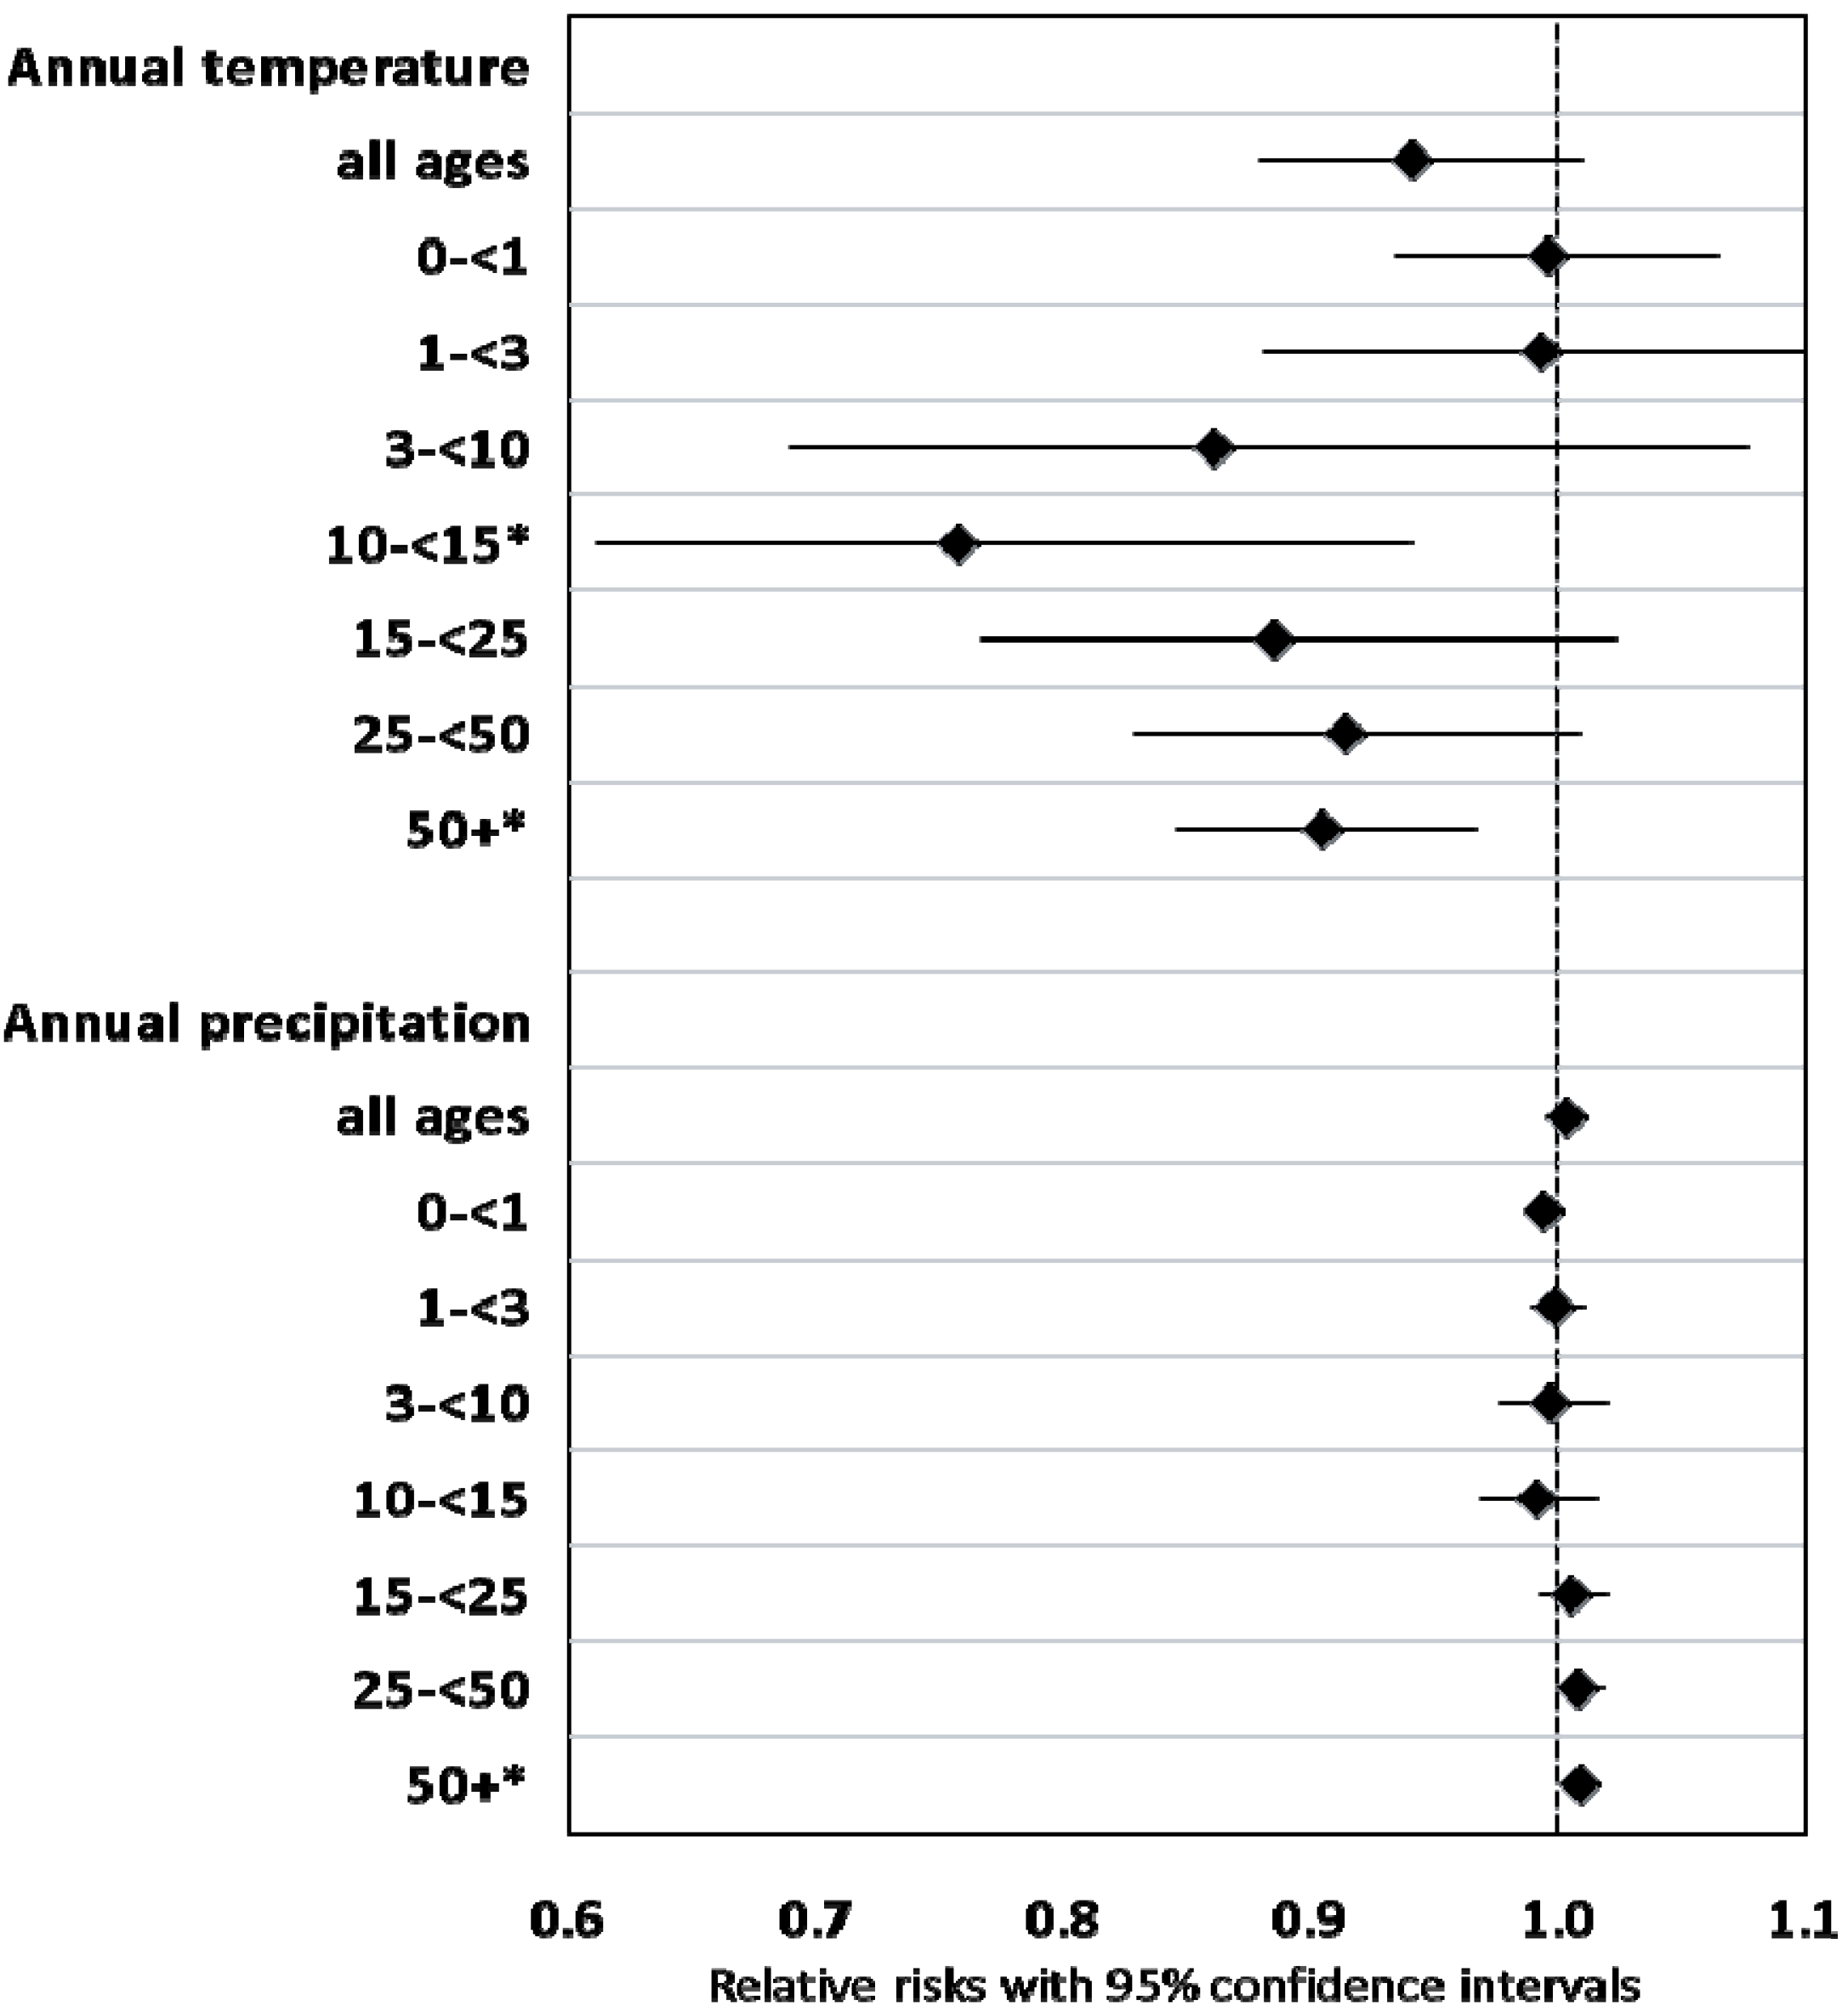
3.3. Association of Annual Climate Variability and Mortality

Neither annual temperature nor precipitation, mutually adjusted, were statistically associated with annual deaths, although the effect of temperature approached significance (p = 0.094), with slightly fewer deaths in warmer years (Figure 4). Effect estimates were similar in men and women (Supplementary material Table S1).
Figure 4. Association between annual climate variability and annual age-stratified mortality, Skellefteå 1749–1859.
Ijerph 11 06940 g004
Annual temperature and precipitation adjusted for each other. Relative risks indicate mortality risk by 1 °C increase in temperature resp. 1 cm increase in precipitation. * p-value < 0.05.
In age-stratified analyses, estimates for the impact of temperature on mortality generally pointed into the same direction. The largest effect was observed in age-group 10–14 years, which also was statistically significant (RR 0.76, CI 0.61–0.94, per 1 °C increase, indicating fewer deaths in warmer years). Infants (<3 years of age) appeared less vulnerable to temperature than older children and adults. The effect of annual precipitation on age-specific mortality was less clear. A small effect was found for adults 50 years and older, and on adults aged 25–49 years, with death counts increasing with higher levels of precipitation. Younger adults and children appeared unaffected by precipitation.

3.4. Association of Seasonal Climate Variability and Mortality

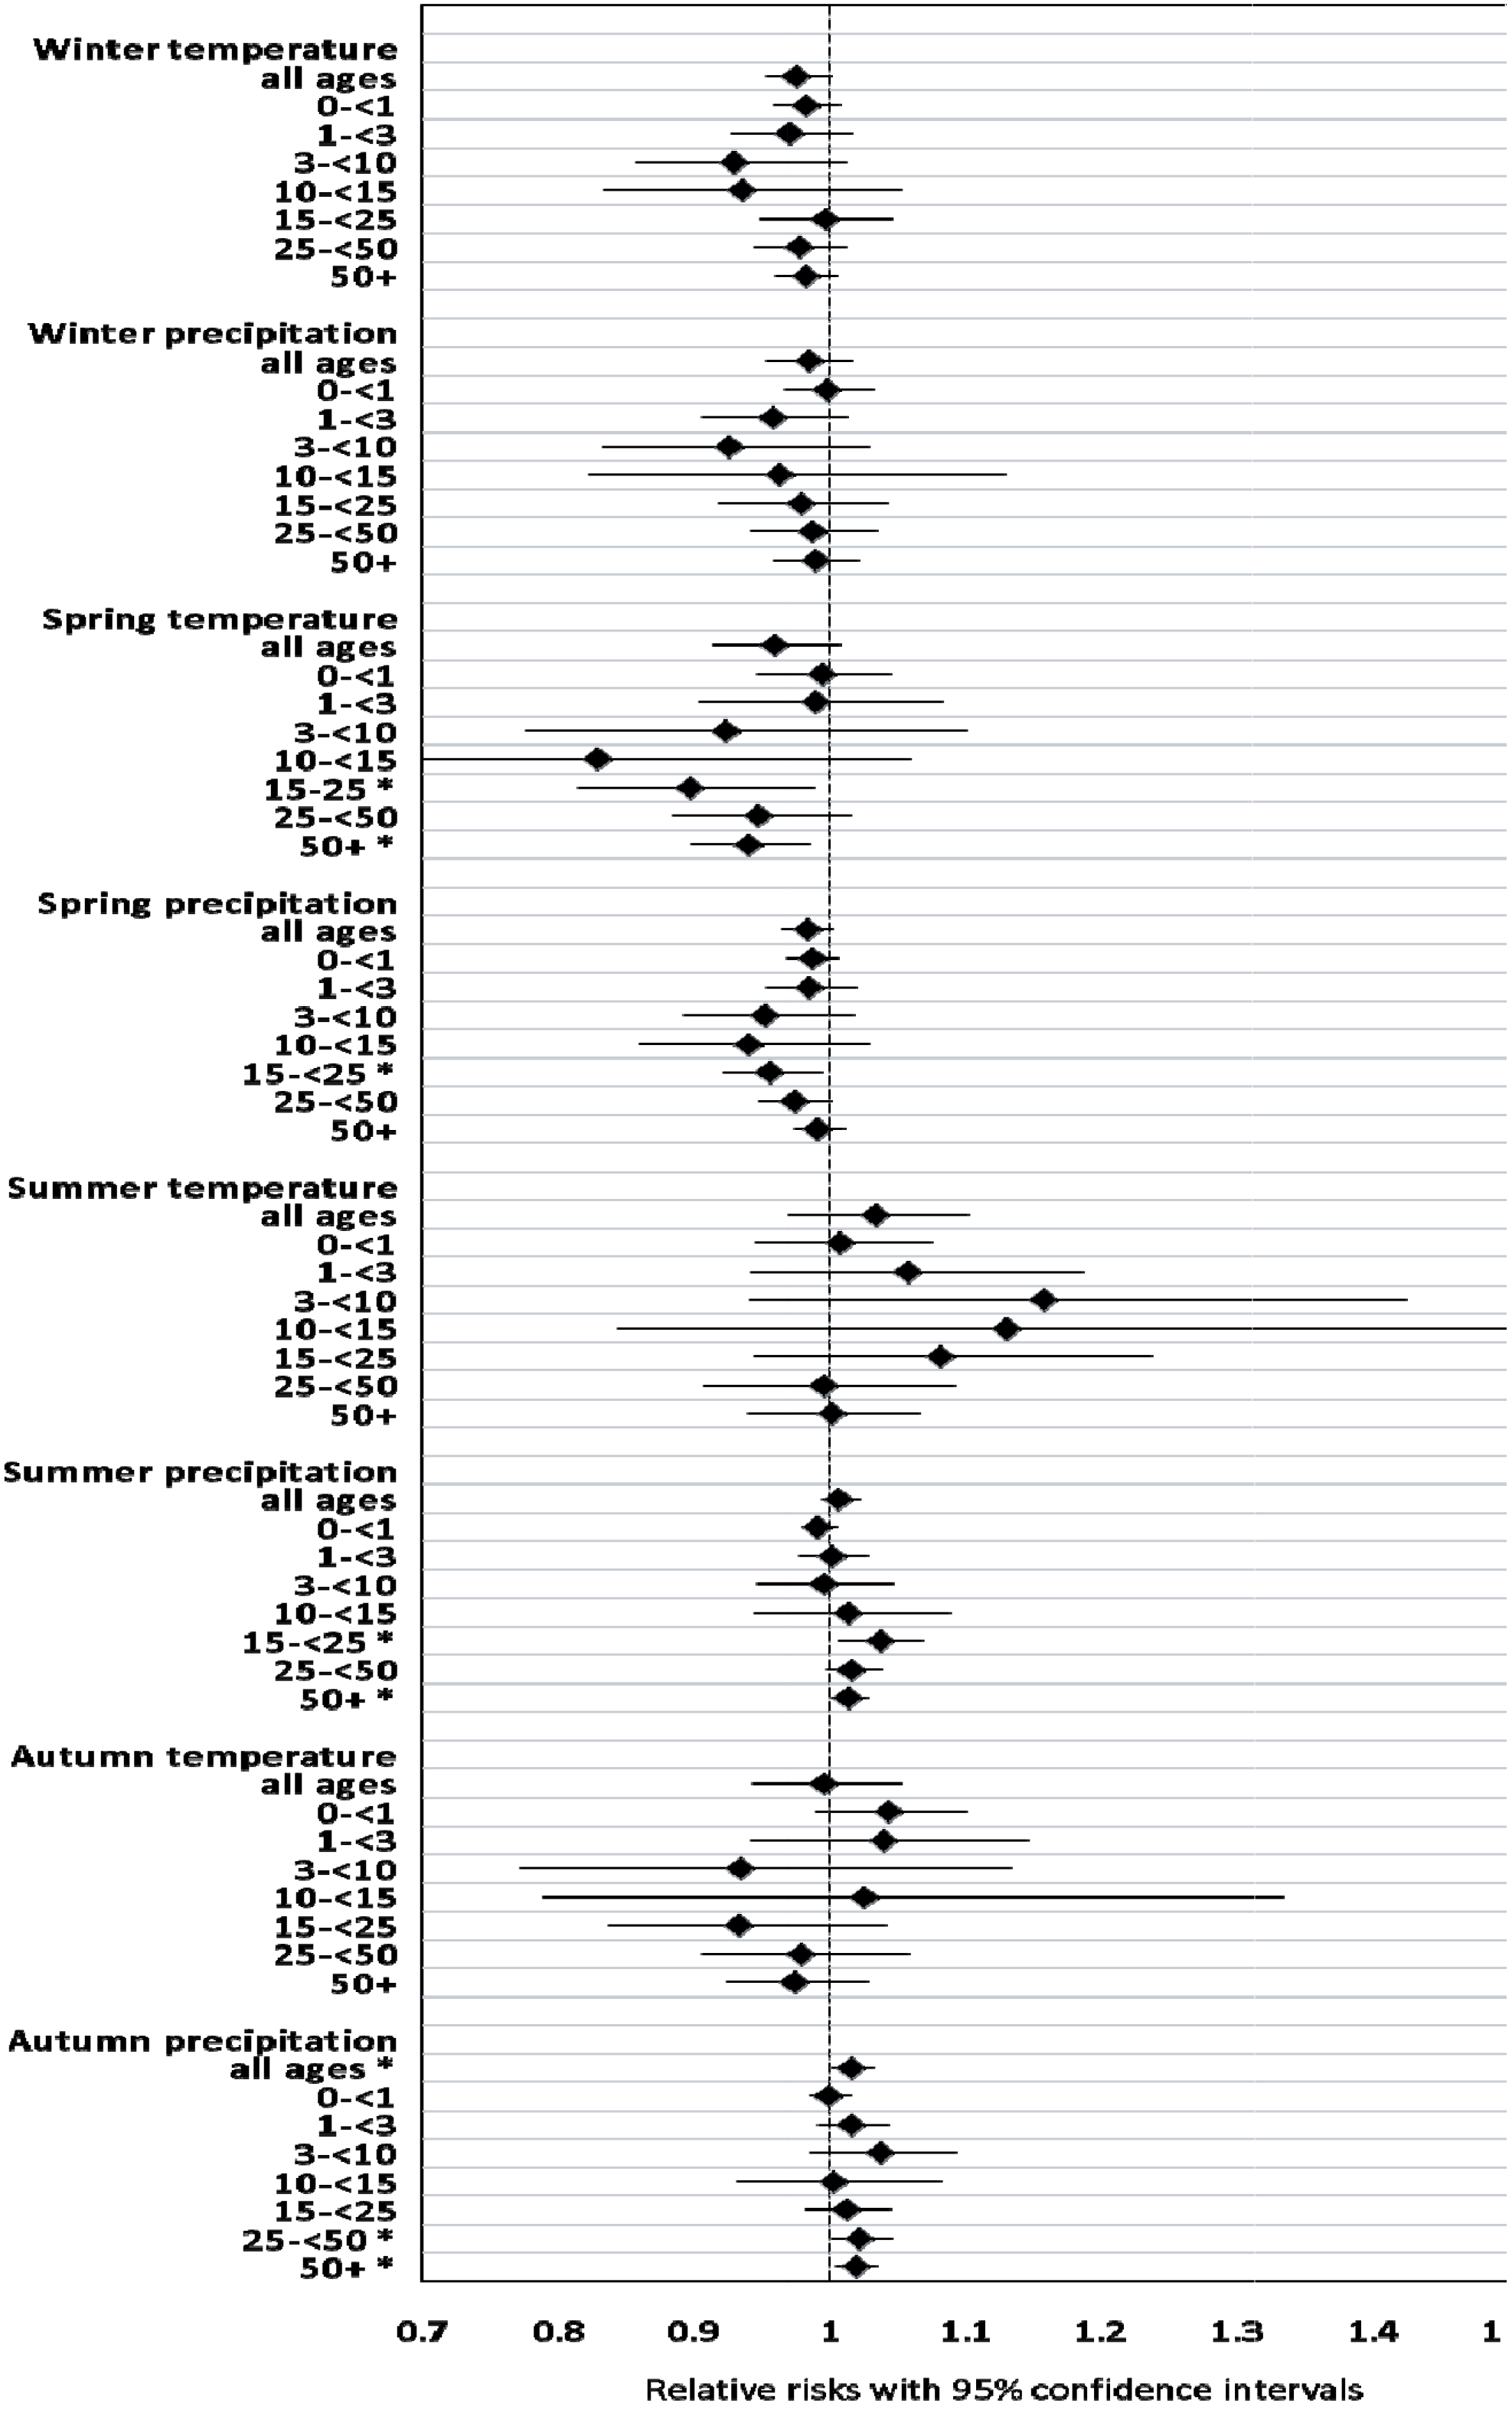
3.4.1. Season-Wise Models

Season-wise models were calculated with temperature and precipitation adjusted for each other. We found an inverse association of annual mortality with winter temperature (RR 0.97, CI 0.95–0.99, p ≤ 0.01), and with springtime temperature (RR 0.95, CI 0.91–0.98, p ≤ 0.01), meaning fewer deaths in years with a warmer winter or spring, respectively. There was no significant association between seasonal precipitation and mortality, although the effect of summer precipitation approached statistical significance (Table 1). Season-wise results were similar for men and women (data not shown).
Table 1. Association between seasonal climate variability and annual mortality, Skellefteå 1749–1859.
Simple Season-Wise Model* RR (CI)p-ValueFully Adjusted Model** RR (CI)p-Value
Winter temperature0.97 (0.95–0.99)0.0070.98 (0.95–1.00)0.057
Winter precipitation1.00 (0.97–1.03)0.7830.99 (0.95–1.02)0.343
Spring temperature0.95 (0.91–0.98)0.0050.96 (0.91–1.01)0.103
Spring precipitation0.99 (0.97–1.01)0.2000.98 (0.97–1.00)0.085
Summer temperature1.01 (0.95–1.08)0.6921.04 (0.97–1.10)0.300
Summer precipitation1.01 (1.00–1.03)0.0501.01 (0.99–1.02)0.294
Autumn temperature0.99 (0.94–1.04)0.6741.00 (0.94–1.05)0.898
Autumn precipitation1.01 (1.00–1.02)0.1201.02 (1.00–1.03)0.036
* Simple model: Seasonal temperature and precipitation adjusted for each other; each season separately. ** Fully adjusted model: Seasonal temperature and precipitation adjusted for each other; all seasons simultaneously included. RR, relative risk; CI, 95% confidence interval. RR indicate mortality risk by 1 °C increase in temperature resp. 1 cm increase in precipitation. Numbers in bold: significant (p-value < 0.05); numbers in italics: borderline significant (p-value < 0.10). Temperature: Mean temperature in °C. Precipitation: Cumulative precipitation in cm.

3.4.2. Full Model Including All Seasons

In the full model including temperature and precipitation of all four seasons simultaneously, most effect estimates were slightly attenuated or remained unchanged. Only autumn precipitation proved statistically significant for total mortality, with a relative risk of 1.02 (CI 1.00–1.03), per 1 cm increase of autumn precipitation, indicating higher mortality in years with wet autumns. Winter temperature (RR 0.98; CI 0.95–1.00) and spring precipitation (RR 0.98; CI 0.97–1.00) approached statistical significance. Sensitivity analyses showed that temperatures in winter and spring time were highly correlated, and that changes in their effect estimates and p-values when moving from the simple season-wise model to the fully adjusted model were mainly attributable to this collinearity. Sex-stratified analyses did not reveal large differences between men and women (Supplementary material Table S2).
In the next step we conducted age-stratified analyses for the association between seasonal climate variability, including all four seasons, and annual mortality. The models for age-group 15–24 were of uncertain validity, but are reported here for completeness. With the exception of autumn temperature, effect estimates for all age groups pointed in the same direction, although many confidence intervals were large (due to small frequencies), and effects for some ages were small. The largest effects were found for children between 3 and 14, and for some climate variables also for adults aged 25 and older (Figure 5).
Figure 5. Association between seasonal climate variability and annual age-stratified mortality, Skellefteå 1749–1859.
Ijerph 11 06940 g005
Full model: Seasonal temperature and precipitation adjusted for each other; all seasons simultaneously included. Relative risks indicate mortality risk by 1 °C increase in temperature resp. 1cm increase in precipitation. * p-value <0.05. Note: Validity of the model for age group 15–24 is uncertain.
Springtime temperature was associated with decreased death counts in the age-group 10–14 years, and in adults aged 50 or older. Also in other age groups, warmer springs meant generally lower mortality. The statistically significant effect of autumn precipitation on total mortality (RR 1.02, CI 1.00–1.03) was mirrored by high relative risks in children aged 3–9 (RR 1.04, CI 0.99–1.09), and in adults of the age groups 25–49 and 50+, with relative risks of ≥1.02 (both p < 0.05).

3.5. Discussion

This study investigated the role of seasonal climate on mortality in a predominantly rural pre-industrial society in northern Sweden still characterized by agricultural work and high mortality rates. We found a small, borderline significant impact of annual temperature, but not of annual precipitation on annual deaths. Seasonal analyses gave a more detailed picture: rainfall in springtime had a protective role, while higher levels of precipitation in the autumn increased annual death counts.
While there are direct effects of weather on health, e.g., heat strokes, drowning after heavy rainfalls and floods, many pathways are indirect—increased rainfall might lead to higher incidences of vector-borne diseases, and air-borne diseases such as influenza are common during the cold season due to overcrowding. Socio-economic pathways include famines after climate-related harvest failures, but also social unrest in long periods of unfavourable climate conditions like in the 17th century [1,19]. In the following we will argue that agricultural output and consequential nutritional status played a central role in the causal pathways from climate variability to mortality in pre-industrial societies.
We assume that springtime precipitation is associated with good growth of crops, leading to richer harvests and a better nutritional status of the population, hence reducing death numbers. Heavy rainfall in the autumn, on the other hand, would possibly increase the risk of harvest failures or rotting of potatoes and other food supply, causing starvation and food-borne diseases. It is documented that in northern Italy in 1629, extreme autumn precipitation levels destroyed almost completely the harvest, while invading troops consumed the little that was left. During the next two years, an estimated two million people died [19]. According to Scott et al. [20], inter-annual fluctuations in nutritive levels, rather than severe famines in pre-industrial northern England were a crucial factor for fertility and mortality. The situation in Skellefteå, northern Sweden was most likely similar. On a less dramatic scale, a wet (and maybe cold) autumn was also likely to keep people indoors, whereby facilitating the spread of air-borne diseases under crowded living conditions.
Results suggest that warmer winters and springs had a protective role for health (leading to fewer deaths). It appears plausible that mortality is lower in milder winters. A large number of contemporary analyses demonstrate excess mortality rates during winter, owing at least partly to lower ambient temperatures [21,22,23]. In a study on short-term fluctuations of vital rates in 18th–19th century England, Lee [24] found mortality to be associated negatively with winter temperature, and positively with summer temperature, thus showing similar impacts of seasonal climate as in our study. Interestingly, the impact of winter climate was rather immediate, while the impact in summer appeared with a lag of one to three months. Similar findings were reported from Scott et al. [20]. While no substantial gender differences were found, we saw generally larger impacts of seasonal climate variability (in terms of effect size) on older children (3 years or older) than on younger ones. This indicates that children beyond infancy were most vulnerable to unfavourable climate conditions. While the opposite would appear more plausible, there are some considerations regarding these results. Edvinsson et al. [25] showed a clustering of infant deaths in a rather small number of families in Skellefteå during the 18th and 19th century, hinting at genetic, social or behavioural factors such as feeding practices as important factors which might explain the lack of impact of climate variables. Another explanation might be that high infant mortality at that time, caused by non-climate related infectious diseases, disguised the comparably small impact of climate variability on death risk. According to Bengtsson and Broström [26], mortality rates during “crisis years” in pre-industrial southern Sweden were particularly high among older children and adults, while among infants, mortality followed a different pattern. Colder winters lead to higher death rates only in adults, but not in infants and children. This confirms our assumption that climate vulnerability differs by age group, indicating different pathways due to age-specific causes of death.
In a previous study [13] we investigated the role of climate variability for mortality in Uppsala, southern Sweden, 1749–1859, using the same historical sources and methods. Likewise in Skellefteå, this urban community saw increased mortality risks in years of high autumn precipitation; in both places, the effect was statistically significant. Springtime precipitation led to increased relative risks of almost the same size (RR 0.98 in Uppsala, and 0.98 in Skellefteå). Most of the relative risk estimates for seasonal climate were similar in both towns, giving us a higher degree of certainty despite large confidence intervals in some of the associations.
To date, there is a lack of studies on the role of climatic factors for human mortality in pre-industrial societies, using reliable climate and population data to compare to our findings. Helle and Helama [3] found only a small protective effect of annual temperature on mortality in Sami hunter and gatherer communities in Northern Finland during the 18th and 19th century, similar to our results. They did not, however, investigate monthly or seasonal temperature, nor did they include precipitation as a predictive factor.

3.5.1. Strengths and Limitations

The present work is, we believe, unique in that it investigates the role of seasonal climate on total and age-specific mortality in a pre-industrial town, using early meteorological recordings and population data retrieved from historical registers. Our analyses rely on temperature estimates for the Umeå region, not far from Skellefteå, based on measurements from Uppsala in southern Sweden, and Tornedalen in the North. For precipitation levels in Skellefteå, no such estimates exist, and we had to rely solely on measurements from Uppsala, therefore the true effect of local levels on mortality might be under- or overestimated. Comparing relative risks by seasonal precipitation in Skellefteå (the present study) and in Uppsala [13], it seemed, however, that effects were rather similar in the two places, giving confidence in the validity of results from Skellefteå.
While autumn precipitation was associated with mortality, its true effect might be underestimated, because most of the observed deaths during the year had already occurred. In seasonal analyses, the month of December was excluded; hence its impact on risk of death is not reflected in the results. Age-groups counts per year were rather small, which is why age-stratified results can give us only a rough impression of differential climate effects, with the risk of over-rating age differences.
When assessing the partial autocorrelation in the residuals of the fitted models up to 20 lags (years) we found only lag 0 to 1 indicating significant correlation. At longer lags the partial autocorrelation patterns appeared random. When testing the correlation of many lags at a 5% significance level, one would expect on average one false positive among 20 tests. However, given that the partial autocorrelation was observed at lag 0 to 1 only, one might expect this as an actual true correlation in health data. But in this case, one would expect such correlations to spill over in longer lags as well, which we did not observe. Thus, we argue that the underlying assumptions for the validity of the confidence intervals are satisfied. In this study, we used annual deaths as the dependent variable, an approach which cannot capture cross-annual effects of seasonal climate. Particularly autumn precipitation or temperature might be associated with undernutrition and infectious disease incidence the following winter or spring. The impact on monthly death counts might also vary considerably during one year, depending on the lags considered, and on the seasonality of mortality.

3.5.2. Future Studies

In future studies, we plan to use individual vital data from the Skellefteå region to investigate in more depth the association between monthly temperature and precipitation and monthly death counts, applying lags up to twelve months, thus accounting for effects on mortality in the following calendar year.
Our results give some hint that climatic impacts were largest on children between 3 and 14 years of age. There remains the necessity to validate these findings with a larger study sample, and with other populations in similar settings. It is also important to explore the pathways from climate to ill health, including death, keeping in mind that causal mechanisms might differ from one subgroup to another, and considering longer time lags.
Many of our tentative explanations of the climate-mortality association focus on the role of harvest gains which are highly dependent on the timing and amount of seasonal rainfall and on temperature. In early modern societies, food contributed to up to 50% of household expenditures, making particularly poorer people vulnerable to fluctuations of staple prices during years of harvest failures [19]. It is, however, not known enough about the association of harvest outcomes with climate variability and with total and age-specific mortality in Sweden during the last centuries. Our intention therefore is to investigate these links using historical documentations of harvest quality and crops prices in northern Sweden.
In our models, we did not test for interaction between seasonal temperature and precipitation or for cross-seasonal effects. It is not unlikely, that certain constellations, such as cold and wet autumns, were more hazardous for human health than single variables. Morand and colleagues [27] showed that the North Atlantic Oscillation (NAO) as a large scale seasonal climate index was related to a number of infectious disease outbreaks in contemporary Europe, e.g., gastroenteritis outbreaks. It would therefore be interesting to investigate the association of NAO fluctuations with annual mortality in pre-industrial Sweden.

4. Conclusions

In this pre-industrial rural town in northern Sweden, we found that higher levels of rain during the autumn increased the annual number of deaths. This might be due to rotting of harvest, causing food-borne diseases and malnutrition, and due to facilitated spread of air-borne diseases in crowded living conditions. There is some evidence that rainfall during springtime decreased annual mortality rates, possibly because it was linked to better harvest outcomes. In years with warmer winter and spring time, mortality tended to be lower. Children beyond infancy appeared most vulnerable to climate impacts, although high infant mortality due to epidemics might explain the lack of association with climate in the youngest age group. Future analyses will investigate the intermediate role of harvest outcomes, and long-term changes of the climate-mortality association in the course of the epidemiological transition.

Supplementary Files

  • Supplementary File 1:

    Supplementary Information (PDF, 126 KB)

  • Acknowledgments

    The authors are grateful to Sara Gustavsson for her assistance in the pre-processing of the meteorological data.

    Author Contributions

    Barbara Schumann conceived the study, conducted the analyses and wrote the manuscript. Joacim Rocklöv contributed to the statistical analyses and helped writing the manuscript. Sören Edvinsson provided information about the population data, contributed to the interpretation of study results from a historical perspective and helped writing the manuscript. Per Arnqvist and Sara Sjöstedt de Luna provided meteorological data, conducted the models for reconstructing monthly temperature in Umeå, and contributed to the manuscript.

    Conflicts of Interest

    This project was conducted with support of Riksbankens Jubileumsfond (Bank of Sweden Tercentenary Foundation). The Umeå Centre for Global Health Research at Umeå University receives support from FORTE (formerly FAS), the Swedish Council for Health, Working Life and Welfare (grant No. 2006-1512). The Ageing and Living Conditions programme (ALC) at Umeå University is supported by a grant from the Swedish Research Council (Vetenskapsrådet, VR).
    The authors declare no competing interests. They have not received any funding or benefits from industry to conduct this study.

    References

    1. McMichael, A.J. Insights from past millennia into climatic impacts on human health and survival. Proc. Natl. Acad. Sci. USA 2012, 109, 4730–4737. [Google Scholar] [CrossRef]
    2. Ljungkvist, F.C. Global Nedkylning—Klimatet Och Människan under 10000 År; Norstedts Förlag: Stockholm, Sweden, 2009. [Google Scholar]
    3. Helle, S.; Helama, S. Climatic variability and the population dynamics of historical hunter-gatherers: The case of Sami of Northern Finland. Am. J. Hum. Biol. 2007, 853, 844–853. [Google Scholar]
    4. Guy, W.A. On temperature and its relation to mortality: An illustration of the application of the numerical method to the discovery of truth. J. Stat. Soc. Lond. 1881, 44, 235–268. [Google Scholar] [CrossRef]
    5. Catalano, R.; Bruckner, T.; Smith, K.R. Ambient temperature predicts sex ratios and male longevity. Proc. Natl. Acad. Sci. USA 2008, 105, 2244–2247. [Google Scholar] [CrossRef]
    6. Appleby, A.B. Epidemics and famine in the little ice age 1550–1700. J. Interdiscip. Hist. 1980, 10, 643–663. [Google Scholar] [CrossRef]
    7. Omran, A.R. The epidemiologic transition. A theory of the epidemiology of population change. Milbank Mem. Fund Q. 1971, 49, 509–538. [Google Scholar] [CrossRef]
    8. Sundin, J.; Willner, S. Social Change and Health in Sweden: 250 Years of Politics and Practice; Swedish National Institute of Public Health: Östersund, Sweden, 2007. [Google Scholar]
    9. Stenflo, G.A. Demographic Description of the Skellefteå and Sundsvall Regions during the 19th Century; Demographic Data Base, Umeå University: Umeå, Sweden, 1994. [Google Scholar]
    10. Edvinsson, S.; Lindkvist, M. Wealth and health in 19th century Sweden: A study of social differences in adult mortality in the Sundsvall Region. Explor. Econ. Hist. 2011, 48, 376–388. [Google Scholar] [CrossRef]
    11. Lundevaller, E.H.; Edvinsson, S. The effect of Rh-negative disease on perinatal mortality: Some evidence from the Skellefteå region, Sweden, 1860–1900. Biodemography Soc. Biol. 2012, 58, 116–132. [Google Scholar] [CrossRef]
    12. Bygren, L.O.; Edvinsson, S.; Broström, G. Change in food availability during pregnancy: Is it related to adult sudden death from cerebro- and cardiovascular disease in offspring? Am. J. Hum. Biol. 2000, 12, 447–453. [Google Scholar] [CrossRef]
    13. Schumann, B.; Edvinsson, S.; Evengård, B.; Rocklöv, J. The influence of seasonal climate variability on mortality in pre-industrial Sweden. Glob. Health Action 2013, 6. [Google Scholar] [CrossRef]
    14. Umeå University Demographic Data Base. What Is Tabellverket? Available online: http://www.ddb.umu.se/digitalAssets/39/39441_tbvhistory100330.pdf (accessed on 20 November 2013).
    15. Demographic Database. Tabellverket 1749–1859. Description of Tabellverket Registration at the DDB and the Contents of Population and Mortality Form. Available online: http://www.ddb.umu.se/digitalAssets/118/118452_tabellverket-beskrivning-och-innehll--2013-03-25.pdf (accessed on 20 November 2013).
    16. Klingbjer, P.; Moberg, A. A composite monthly temperature record from Tornedalen in northern Sweden, 1802–2002. Int. J. Clim. 2003, 23, 1465–1494. [Google Scholar] [CrossRef]
    17. Moberg, A.; Bergström, H.; Alexandersson, H. Homogenization of Swedish temperature data. Part III: The long temperature records from Uppsala and Stockholm. Int. J. Clim. 1997, 17, 667–699. [Google Scholar] [CrossRef]
    18. Bergström, H.; Moberg, A. Daily air temperature and pressure series for Uppsala (1722–1998). Clim. Change 2002, 53, 213–252. [Google Scholar]
    19. Parker, G. Global Crisis—War, Climate Change and Catastrophe in the Seventeenth Century; Yale University Press: New Haven, CT, USA, 2013. [Google Scholar]
    20. Scott, S.; Duncan, S.R.; Duncan, C.J. The interacting effects of prices and weather on population cycles in a preindustrial community. J. Biosoc. Sci. 1998, 30, 15–32. [Google Scholar] [CrossRef]
    21. Näyhä, S. Environmental temperature and mortality. Int. J. Circumpolar Heal. 2005, 64, 451–458. [Google Scholar]
    22. Barnett, A.G.; Hajat, S.; Gasparrini, A.; Rocklöv, J. Cold and heat waves in the United States. Env. Res. 2012, 112, 218–224. [Google Scholar] [CrossRef] [Green Version]
    23. Gyllerup, S.; Lanke, J.; Lindholm, L.H.; Schersten, B. High coronary mortality in cold regions of Sweden. J. Intern. Med. 1991, 230, 479–485. [Google Scholar] [CrossRef]
    24. Lee, R. Short-Term Variation: Vital Rates, Prices, and Weather. In The Population History of England 1541–1871: A Reconstruction; Wrigley, E.A., Schofield, R.S., Eds.; Cambridge University Press: Cambridge, England, 1981; pp. 356–401. [Google Scholar]
    25. Edvinsson, S.; Brändström, A.; Rogers, J.; Broström, G. High-risk families: The unequal distribution of infant mortality in nineteenth-century Sweden. Popul. Stud. 2005, 59, 321–337. [Google Scholar] [CrossRef]
    26. Bengtsson, T.; Broström, G. Mortality Crises in Rural Southern Sweden 1766–1860. In Demographic Responses to Economic and Environmental Crises; Kurosu, S., Bengtsson, T., Campbell, C., Eds.; Reitaku University: Kashiwa, Japan, 2010; pp. 1–16. [Google Scholar]
    27. Morand, S.; Owers, K.; Waret-Szkuta, A.; McIntyre, K.M.; Baylis, M. Climate variability and outbreaks of infectious diseases in Europe. Sci. Rep. 2013, 3. [Google Scholar] [CrossRef] [Green Version]

    Appendix

    Reconstruction of Umeå Temperatures

    Monthly temperatures for Umeå city were (re)constructed as follows. Temperatures from Umeå city were available January 1860 until September 1979, and from Umeå airport since January 1965. City and airport temperatures differed somewhat. Therefore, we first established a linear relationship between the city and airport temperatures based on monthly data (January 1965 to September 1979) and used it to extend monthly Umeå city temperatures from October 1979 and onwards. The linear relationship was found by explaining the Umeå city data by a linear regression model with Umeå airport temperature as explanatory variable, using different intercepts for October, November and December, and different slopes for February and April (R2 = 0.9995). For the time period 1802–1859 (except for year 1815 where Tornedalen data were missing) monthly Umeå city temperatures were reconstructed using a linear regression model on monthly data (1860–2009) where Uppsala and Tornedalen temperatures were used as explanatory variables, and a separate intercept used for November (R2 = 0.99). For the time period 1722–1801 and year 1815 the Umeå city temperatures were reconstructed from a linear model of the Uppsala temperatures using different intercepts for each month and different slopes for April–September and December (R2 = 0.98).

    Share and Cite

    MDPI and ACS Style

    Rocklöv, J.; Edvinsson, S.; Arnqvist, P.; De Luna, S.S.; Schumann, B. Association of Seasonal Climate Variability and Age-Specific Mortality in Northern Sweden before the Onset of Industrialization. Int. J. Environ. Res. Public Health 2014, 11, 6940-6954. https://doi.org/10.3390/ijerph110706940

    AMA Style

    Rocklöv J, Edvinsson S, Arnqvist P, De Luna SS, Schumann B. Association of Seasonal Climate Variability and Age-Specific Mortality in Northern Sweden before the Onset of Industrialization. International Journal of Environmental Research and Public Health. 2014; 11(7):6940-6954. https://doi.org/10.3390/ijerph110706940

    Chicago/Turabian Style

    Rocklöv, Joacim, Sören Edvinsson, Per Arnqvist, Sara Sjöstedt De Luna, and Barbara Schumann. 2014. "Association of Seasonal Climate Variability and Age-Specific Mortality in Northern Sweden before the Onset of Industrialization" International Journal of Environmental Research and Public Health 11, no. 7: 6940-6954. https://doi.org/10.3390/ijerph110706940

    Article Metrics

    Back to TopTop