Detection of Legionella, L. pneumophila and Mycobacterium Avium Complex (MAC) along Potable Water Distribution Pipelines


Abstract
:1. Introduction
2. Experimental Section

3. Results

| Season Sampled and Average Water Temperature | Sample Point | A | B | C | D | E |
|---|---|---|---|---|---|---|
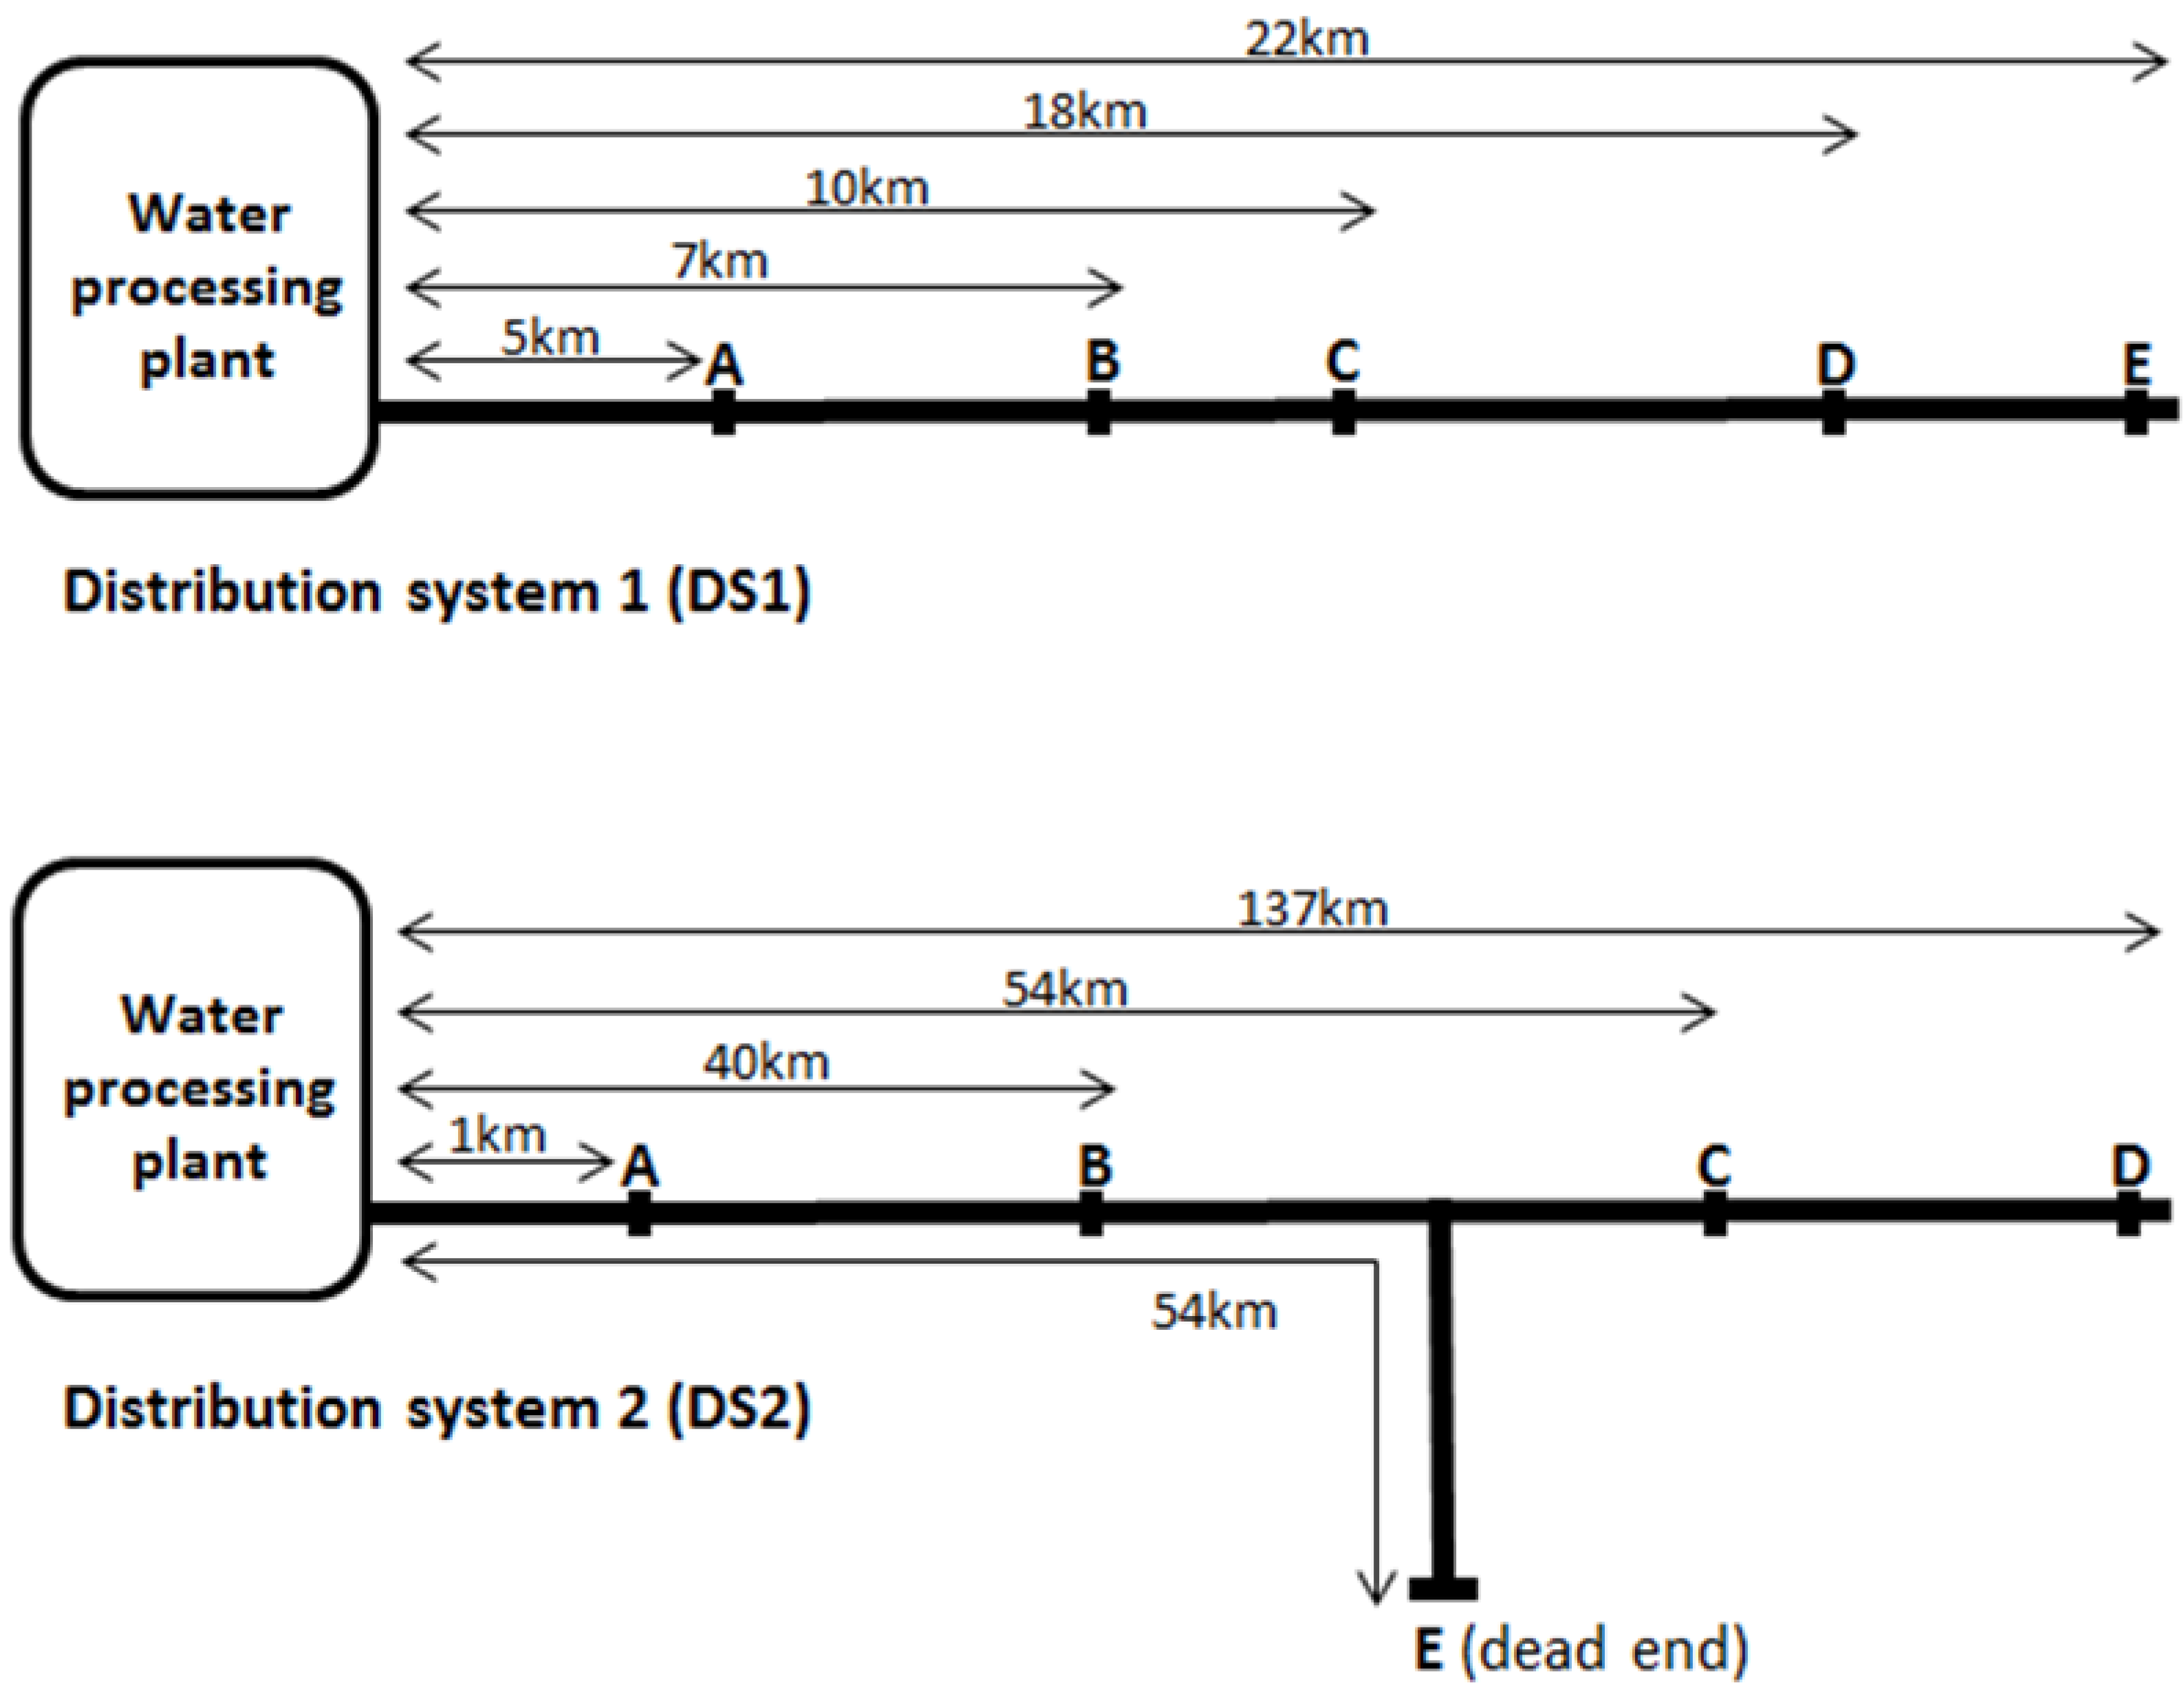
| Distance from treatment plant (km) | 5 | 7 | 10 | 18 | 22 | |
| Summer 4.3 °C (n = 8) | Total Chlorine (mg/L) | 1.4 | 0.7 | 1.1 | 0.4 | 0.4 |
| Free chlorine (mg/L) | 1.2 | 0.6 | 0.1 | 0.2 | 0.2 | |
| Average Legionella spp. (copies/mL) | 37 ± 53 | 9 ± 4 | 3 ± 0 | 187 ± 22 | + 1238 ± 47 | |
| Average L. pneumophila (copies/mL) | 10 ± 8 | 3 ± 0 | 3 ± 0 | 375 ± 305 | * 1981 ±298 | |
| Average MAC (copies/mL) | 36 ± 19 | 42 ± 19 | * 31,813 ± 17,017 | 116 ± 118 | + 4395 ± 2176 | |
| Autumn 18.6 °C (n = 8) | Total chlorine (mg/L) | 1.5 | N/A | 1.0 | 0.8 | 1.1 |
| Free chlorine (mg/L) | 1.3 | N/A | 0.8 | 0.6 | 0.9 | |
| Average Legionella spp. (copies/mL) | 5 ± 4 | N/A | 41 ± 21 | 47 ± 13 | 46 ± 17 | |
| Average L. pneumophila (copies/mL) | 3 ± 0 | N/A | 3 ± 0 | 46 ± 68 | + 487 ± 406 | |
| Average MAC (copies/mL) | 25 ± 0 | N/A | 25 ± 0 | 200 ± 157 | 25 ± 0 | |
| Winter 13.6 °C (n = 8) | Total chlorine (mg/L) | 1.2 | N/A | 1.3 | 0.4 | 0.7 |
| Free chlorine (mg/L) | 1.1 | N/A | 1.3 | 0.3 | 0.6 | |
| Average Legionella spp. (copies/mL) | 22 ± 31 | N/A | 3 ± 0 | 5 ± 1 | 3 ± 0 | |
| Average L. pneumophila (copies/mL) | 81 ± 134 | N/A | 3 ±1 | 3 ± 0 | 3 ± 0 | |
| Average MAC (copies/mL) | 25 ±0 | N/A | 25 ± 0 | 25 ± 0 | 25 ± 0 | |
| Spring 20.3 °C (n = 8) | Total chlorine (mg/L) | 1.0 | 0.7 | 0.3 | 0.4 | 0.7 |
| Free chlorine (mg/L) | 0.9 | 0.6 | 0.2 | 0.3 | 0.6 | |
| Average Legionella spp. (copies/mL) | 43 ± 69 | 120 ± 151 | 8 ± 3 | 93 ± 139 | 6 ± 6 | |
| Average L. pneumophila (copies/mL) | 36 ± 34 | 15 ± 12 | 9 ± 1 | 166 ± 122 | 3 ± 0 | |
| Average MAC (copies/mL) | 2468 ± 317 | 2224 ± 2342 | 1112 ± 328 | 294 ± 58 | 101 ± 69 |
| Season Sampled and Average Water Temperature | Sample Point | A | B | C | D | E |
|---|---|---|---|---|---|---|
| Distance from treatment plant (km) | 1 | 40 | 54 | 137 | 54 | |
| Summer 27.3 °C (n = 10) | Monochloramine (mg/L) | 3.6 | 3.0 | 3.6 | 2.7 | <0.05 |
| Average Legionella spp. (copies/mL) | 444 ± 96 | 161 ± 19 | 134 ± 94 | 423 ± 399 | * 316,956 ± 169,8982 | |
| Average L. pneumophila (copies/mL) | 105 ± 8 | 712 ± 158 | 479 ± 177 | 12 ± 16 | 941 ± 154 | |
| Average MAC (copies/mL) | 9755 ± 7808 | 6910 ± 6128 | 2803 ± 584 | 1739 ± 539 | 5362 ± 1612 | |
| Autumn 14.7 °C (n = 13) | Monochloramine (mg/L) | 3.8 | 2.3 | 2.4 | 1.5 | <0.05 |
| Average Legionella spp. (copies/mL) | # 24,238 ± 2918 | 260 ± 10 | 24 ± 19 | 1597 ± 600 | 1094 ± 284 | |
| Average L. pneumophila (copies/mL) | 238 ± 232 | 87 ± 14 | 26 ± 40 | 666 ± 73 | 333 ± 86 | |
| Average MAC (copies/mL) | 542 ± 103 | 663 ± 325 | 4068 ± 1193 | 586 ± 0 | + 1424 ± 482 | |
| Winter 13.0 °C (n = 9) | Monochloramine (mg/L) | 3.6 | 3.7 | 2.3 | 0.8 | 0.2 |
| Average Legionella spp. (copies/mL) | 2016 ± 60 | 883 ± 143 | 303 ± 34 | 197 ± 99 | * 17,7727 ± 10,2437 | |
| Average L. pneumophila (copies/mL) | 248 ± 31 | 566 ± 220 | 573 ± 133 | 281 ± 185 | * 3176 ± 1950 | |
| Average MAC (copies/mL) | 367 ± 395 | 277 ± 144 | 4228 ± 3607 | 433 ± 271 | + 9526 ± 3271 | |
| Spring 21.2 °C (n = 10) | Monochloramine (mg/L) | 2.0 | 2.8 | 3.9 | 2.1 | <0.05 |
| Average Legionella spp. (copies/mL) | 913 ± 88 | 1780 ± 251 | 914 ± 48 | 1111 ± 1359 | * 128,9587 ± 53,042 | |
| Average L. pneumophila (copies/mL) | 10 ± 2 | 3 ± 0 | 4 ± 2 | 38 ± 31 | 19 ± 17 | |
| Average MAC (copies/mL) | 5184 ± 1464 | 2577 ± 483 | 2507 ± 1615 | 2039 ± 475 | 11,445 ± 3478 |
4. Discussion
5. Conclusions
Acknowledgments
Author Contributions
Conflicts of Interest
References
- Lehtola, M.J.; Torvinen, E.; Kusnetsov, J.; Pitkänen, T.; Maunula, L.; von Bonsdorff, C.-H.; Martikainen, P.J.; Wilks, S.A.; Keevil, C.W.; Miettinen, I.T. Survival of Mycobacterium avium, Legionella pneumophila, Escherichia coli, and Caliciviruses in drinking water-associated biofilms grown under high-shear turbulent flow. Appl. Environ. Microbiol. 2007, 73, 2854–2859. [Google Scholar] [CrossRef]
- Wang, H.; Edwards, M.A.; Falkinham, J.O.; Pruden, A. Molecular survey of occurrence of Legionella spp., Mycobacterium spp., Pseudomonas aeruginosa and amoeba hosts in two chloraminated drinking water distribution systems. Appl. Environ. Microbiol. 2012, 78, 6285–6294. [Google Scholar] [CrossRef]
- Szewzyk, U.; Szewzyk, R.; Manz, W.; Schleifer, K.-H. Microbiological safety of drinking water. Ann. Rev. Microbiol. 2000, 54, 81–127. [Google Scholar] [CrossRef]
- Stevens, M.; Ashbolt, A.; Cunliffe, D. Review of Coliforms as Microbial Indicators of Drinking Water Quality; National Health and Medical Research Council: Canberra, ACT, Australia, 2003. [Google Scholar]
- Hörman, A.; Rimhanen-Finne, R.; Maunula, L.; von Bonsdorff, C.-H.; Torvela, N.; Heikinheimo, A.; Hänninen, M.-L. Campylobacter spp., Giardia spp., Cryptosporidium spp., noroviruses, and indicator organisms in surface water in southwestern Finland, 2000–2001. Appl. Environ. Microbiol. 2004, 70, 87–95. [Google Scholar] [CrossRef]
- Harwood, V.J.; Levine, A.D.; Scott, T.M.; Chivukula, V.; Lukasik, J.; Farrah, S.R.; Rose, J.B. Validity of the indicator organism paradigm for pathogen reduction in reclaimed water and public health protection. Appl. Environ. Microbiol. 2005, 71, 3163–3170. [Google Scholar] [CrossRef]
- Hsu, S.C.; Martin, R.; Wentworth, B.B. Isolation of Legionella species from drinking water. Appl. Environ. Microbiol. 1984, 48, 830–832. [Google Scholar]
- Buchbinder, S.; Trebesius, K.; Heesemann, J.R. Evalution of detection of Legionella spp. in water samples by fluorescence in situ hybridization, PCR amplification and bacterial culture. Int. J. Med. Microbiol. 2002, 292, 241–245. [Google Scholar] [CrossRef]
- Tobin, J.O.; Dunnill, M.S.; French, M.; Morris, P.J.; Beare, J.; Fisher-Hoch, S.; Mitchell, R.G.; Muers, M.F. Legionnaires’ diseases in a transplant unit: Isolation of the causative agent from shower baths. Lancet 1980, 316, 118–121. [Google Scholar] [CrossRef]
- Neil, K.; Berkelman, R. Increasing incidence of legionellosis in the United States, 1990–2005: Changing epidemiologic trends. Clin. Infect. Dis. 2008, 47, 591–599. [Google Scholar] [CrossRef]
- Centers for Disease Control and Prevention. Surveillance for Waterborne disease outbreaks associated with drinking water and other nonrecreational water—United States, 2009–2010. In MMWR; 2013; 62, pp. 714–720. [Google Scholar]
- Schulze-Robbecke, R.; Janning, B.; Fischeder, R. Occurrence of mycobacteria in biofilm samples. Tuber. Lung Dis. 1992, 73, 141–144. [Google Scholar] [CrossRef]
- Thomson, R.M.; Carter, R.; Tolson, C.; Coulter, C.; Huygens, F.; Hargreaves, M. Factors associated with the isolation of Nontuberculous mycobacteria (NTM) from a large municipal water sys in Brisbane, Australia. BMC Microbiol. 2013, 13. [Google Scholar] [CrossRef]
- Thomson, R.M. Changing epidemiology of pulmonary nontuberculous mycobacteria infections. Emerg. Infect. Dis. 2010, 16, 1576–1583. [Google Scholar] [CrossRef]
- Shin, S.J.; Lee, B.S.; Koh, W.-J.; Manning, E.J.B.; Anklam, K.; Sreevatsan, S.; Lambrecht, R.S.; Collins, M.T. Efficient differentiation of Mycobacterium avium complex species and subspecies by use of five-target multiplex PCR. J. Clin. Microbiol. 2010, 48, 4057–4062. [Google Scholar] [CrossRef]
- O’Brien, D.P.; Currie, B.J.; Krause, V.L. Nontuberculous mycobacterial disease in northern Australia: A case series and review of the literature. Clin. Infect. Dis. 2000, 31, 958–967. [Google Scholar] [CrossRef]
- Field, S.K.; Fisher, D.; Cowie, R.L. Mycobacterium avium complex pulmonary disease in patients without HIV infection. Chest 2004, 126, 566–581. [Google Scholar] [CrossRef]
- Huang, J.H.; Kao, P.N.; Adi, V.; Ruoss, S.J. Mycobacterium avium-intracellulare pulmonary infection in HIV-negative patients without preexisting lung disease. Chest 1999, 115, 1033–1040. [Google Scholar] [CrossRef]
- Lakhanpal, A.; Arfon, S.; McKeon, D.J. So, they thought it was all over. BMJ Case Rep. 2011. [Google Scholar] [CrossRef]
- Marras, T.K.; Wallace, R.J.; Koth, L.L.; Stulbarg, M.S.; Cowl, C.T.; Daley, C.L. Hypersensitivity pneumonitis reaction to Mycobacterium avium in household water. Chest 2005, 127, 664–671. [Google Scholar] [CrossRef]
- Sugita, Y. Familial cluster of cutaneous Mycobacterium avium infection resulting from use of a circulating, constantly heated bath water system. Br. J. Dermatol. 2000, 142, 789–793. [Google Scholar] [CrossRef]
- Karakousis, P.C.; Moore, R.D.; Chaisson, R.E. Mycobacterium avium complex in patients with HIV infection in the era of highly active antiretroviral therapy. Lancet Infect. Dis. 2004, 4, 557–565. [Google Scholar] [CrossRef]
- Thegerstrom, J.; Romanus, V.; Friman, V.; Brudin, L.; Haemig, P.; Olsen, B. Mycobacterium avium lymphadenopathy among children, Sweden. Emerg. Infect. Dis. 2008, 14. [Google Scholar] [CrossRef]
- Nightingale, S.D.; Byrd, L.T.; Southern, P.M.; Jockusch, J.D.; Cal, S.X.; Wynne, B.A. Incidence of Mycobacterium avium-intracellulare complex bacteremia in human immunodeficiency virus-positive patients. J. Infect. Dis. 1992, 165, 1082–1085. [Google Scholar] [CrossRef]
- Naser, S.A.; Ghobrial, G.; Romero, C.; Valentine, J.F. Culture of Mycobacterium avium subspecies paratuberculosis from the blood of patients with Crohn’s disease. Lancet 2004, 364, 1039–1044. [Google Scholar] [CrossRef]
- Whiley, H.; Keegan, A.; Giglio, S.; Bentham, R. Mycobacterium avium complex—The role of potable water in disease transmission. J. Appl. Microbiol. 2012, 113, 223–232. [Google Scholar] [CrossRef]
- Von Reyn, C.F.; Marlow, J.N.; Arbeit, R.D.; Barber, T.W.; Falkinham, J.O. Persistent colonisation of potable water as a source of Mycobacterium avium infection in AIDS. Lancet 1994, 343, 1137–1141. [Google Scholar]
- Aronson, T. Comparison of large restriction fragments of Mycobacterium avium isolates recovered from AIDS and non-AIDS patients with those of isolates from potable water. J. Clin. Microbiol. 1999, 37, 1008–1012. [Google Scholar]
- Tobin-D’Angelo, M.J.; Blass, M.A.; del Rio, C.; Halvosa, J.S.; Blumberg, H.M.; Horsburgh, C.R. Hospital water as a source of Mycobacterium avium complex isolates in respiratory specimens. J. Infect. Dis. 2004, 189, 98–104. [Google Scholar] [CrossRef]
- Falkinham, J.O. Nontuberculous mycobacteria from household plumbing of patients with nontuberculous mycobacteria disease. Emerg. Infect. Dis. 2011, 17, 419. [Google Scholar] [CrossRef]
- NHMRC, N. Australian Drinking Water Guidelines; National Health and Medical Research Council and Natural Resource Managment Ministerial Council: Canberra, Australia, 2011. [Google Scholar]
- Giglio, S.; Monis, P.T.; Saint, C.P. Legionella confirmation using real-time PCR and SYTO9 is an alternative to current methodology. Appl. Environ. Microbiol. 2005, 71, 8944–8948. [Google Scholar] [CrossRef]
- Giglio, S.; Monis, P.T.; Saint, C.P. Demonstration of preferential binding of SYBR Green I to specific DNA fragments in real-time multiplex PCR. Nucleic Acids Res. 2003, 31. [Google Scholar] [CrossRef]
- Park, H.; Jang, H.; Kim, C.; Chung, B.; Chang, C.; Park, S.K.; Song, S. Detection and identification of Mycobacteria by amplification of the internal transcribed spacer regions with genus- and species-specific PCR primers. J. Clin. Microbiol. 2000, 38, 4080. [Google Scholar]
- Livak, K.J. Analysis of relative gene expression data using real-time quantitative PCR and the 2-[Delta][Delta] CT method. Methods 2001, 25, 402. [Google Scholar] [CrossRef]
- Staroscik, A. Calculator for Determining the Number of Copies of a Template. Available online: http://cels.uri.edu/gsc/cndna.html (accessed on 6 January 2012).
- Bartram, J.; Chartier, Y.; Lee, J.V.; Pond, K.; Surman-Lee, S. Legionella and the Prevention of Legionellosis; World Health Organization: Geneva, Switzerland, 2007. [Google Scholar]
- Nuzzo, R. Scientific method: Statistical errors p values, the “gold standard” of statistical validity, are not as reliable as many scientists assume. Nature 2014, 506, 150–152. [Google Scholar] [CrossRef]
- Whiley, H.; Taylor, M. Legionella detection by culture and qPCR: Comparing apples and oranges. Crit. Rev. Microbiol. 2014; in press. [Google Scholar]
- Chang, C.W.; Hwang, Y.H.; Cheng, W.Y.; Chang, C.P. Effects of chlorination and heat disinfection on long-term starved Legionella pneumophila in warm water. J. Appl. Microbiol. 2007, 102, 1636–1644. [Google Scholar] [CrossRef]
- Alleron, L.; Merlet, N.; Lacombe, C.; Frère, J. Long-term survival of Legionella pneumophila in the viable but nonculturable state after monochloramine treatment. Curr. Microbiol. 2008, 57, 497–502. [Google Scholar] [CrossRef]
- Chang, B.; Sugiyama, K.; Taguri, T.; Amemura-Maekawa, J.; Kura, F.; Watanabe, H. Specific detection of viable Legionella cells by combined use of photoactivated ethidium monoazide and PCR/real-time PCR. Appl. Environ. Microbiol. 2009, 75, 147–153. [Google Scholar] [CrossRef]
- Delgado-Viscogliosi, P.; Solignac, L.; Delattre, J.-M. Viability PCR, a culture-independent method for rapid and selective quantification of viable Legionella pneumophila Cells in environmental water samples. Appl. Environ. Microbiol. 2009, 75, 3502–3512. [Google Scholar] [CrossRef]
- Yáñez, M.A.; Nocker, A.; Soria-Soria, E.; Múrtula, R.; Martínez, L.; Catalán, V. Quantification of viable Legionella pneumophila cells using propidium monoazide combined with quantitative PCR. J. Microbiol. Methods 2011, 85, 124–130. [Google Scholar] [CrossRef] [Green Version]
- Qin, T.; Tian, Z.; Ren, H.; Hu, G.; Zhou, H.; Lu, J.; Luo, C.; Liu, Z.; Shao, Z. Application of EMA-qPCR as a complementary tool for the detection and monitoring of Legionella in different water systems. World J. Microbiol. Biotechnol. 2012, 28, 1881–1890. [Google Scholar] [CrossRef]
- Flekna, G.; Štefanič, P.; Wagner, M.; Smulders, F.J.M.; Možina, S.S.; Hein, I. Insufficient differentiation of live and dead Campylobacter jejuni and Listeria monocytogenes cells by ethidium monoazide (EMA) compromises EMA/real-time PCR. Res. Microbiol. 2007, 158, 405–412. [Google Scholar] [CrossRef]
- Kobayashi, H.; Oethinger, M.; Tuohy, M.J.; Hall, G.S.; Bauer, T.W. Unsuitable distinction between viable and dead Staphylococcus aureus and Staphylococcus epidermidis by ethidium bromide monoazide. Lett. Appl. Microbiol. 2009, 48, 633–638. [Google Scholar] [CrossRef]
- Fittipaldi, M.; Codony, F.; Adrados, B.; Camper, A.; Morató, J. Viable real-time PCR in environmental samples: Can all data be interpreted directly? Microb. Ecol. 2011, 61, 7–12. [Google Scholar] [CrossRef] [Green Version]
- Robertson, W.; Stanfield, G.; Howard, G.; Bartram, J. Monitoring the Quality of Drinking Water during Storage and Distribution. In Water Sanitation and Health; The International Water Association: London, UK, 2006; Chapter 6; pp. 179–204. [Google Scholar]
© 2014 by the authors; licensee MDPI, Basel, Switzerland. This article is an open access article distributed under the terms and conditions of the Creative Commons Attribution license (http://creativecommons.org/licenses/by/3.0/).
Share and Cite
Whiley, H.; Keegan, A.; Fallowfield, H.; Bentham, R. Detection of Legionella, L. pneumophila and Mycobacterium Avium Complex (MAC) along Potable Water Distribution Pipelines. Int. J. Environ. Res. Public Health 2014, 11, 7393-7405. https://doi.org/10.3390/ijerph110707393
Whiley H, Keegan A, Fallowfield H, Bentham R. Detection of Legionella, L. pneumophila and Mycobacterium Avium Complex (MAC) along Potable Water Distribution Pipelines. International Journal of Environmental Research and Public Health. 2014; 11(7):7393-7405. https://doi.org/10.3390/ijerph110707393
Chicago/Turabian StyleWhiley, Harriet, Alexandra Keegan, Howard Fallowfield, and Richard Bentham. 2014. "Detection of Legionella, L. pneumophila and Mycobacterium Avium Complex (MAC) along Potable Water Distribution Pipelines" International Journal of Environmental Research and Public Health 11, no. 7: 7393-7405. https://doi.org/10.3390/ijerph110707393