Prevalence and Antibiogram Profiling of Escherichia coli Pathotypes Isolated from the Kat River and the Fort Beaufort Abstraction Water


Abstract
:1. Introduction
2. Experimental Section
2.1. Description of Study Site

2.2. Sample Collection
2.3. Pathotype Identification

| Target Strains | Target Genes | Primer sequence (5’→3’) | Amplicon Size (bp) | Annealing Temp (ºC) | References |
|---|---|---|---|---|---|
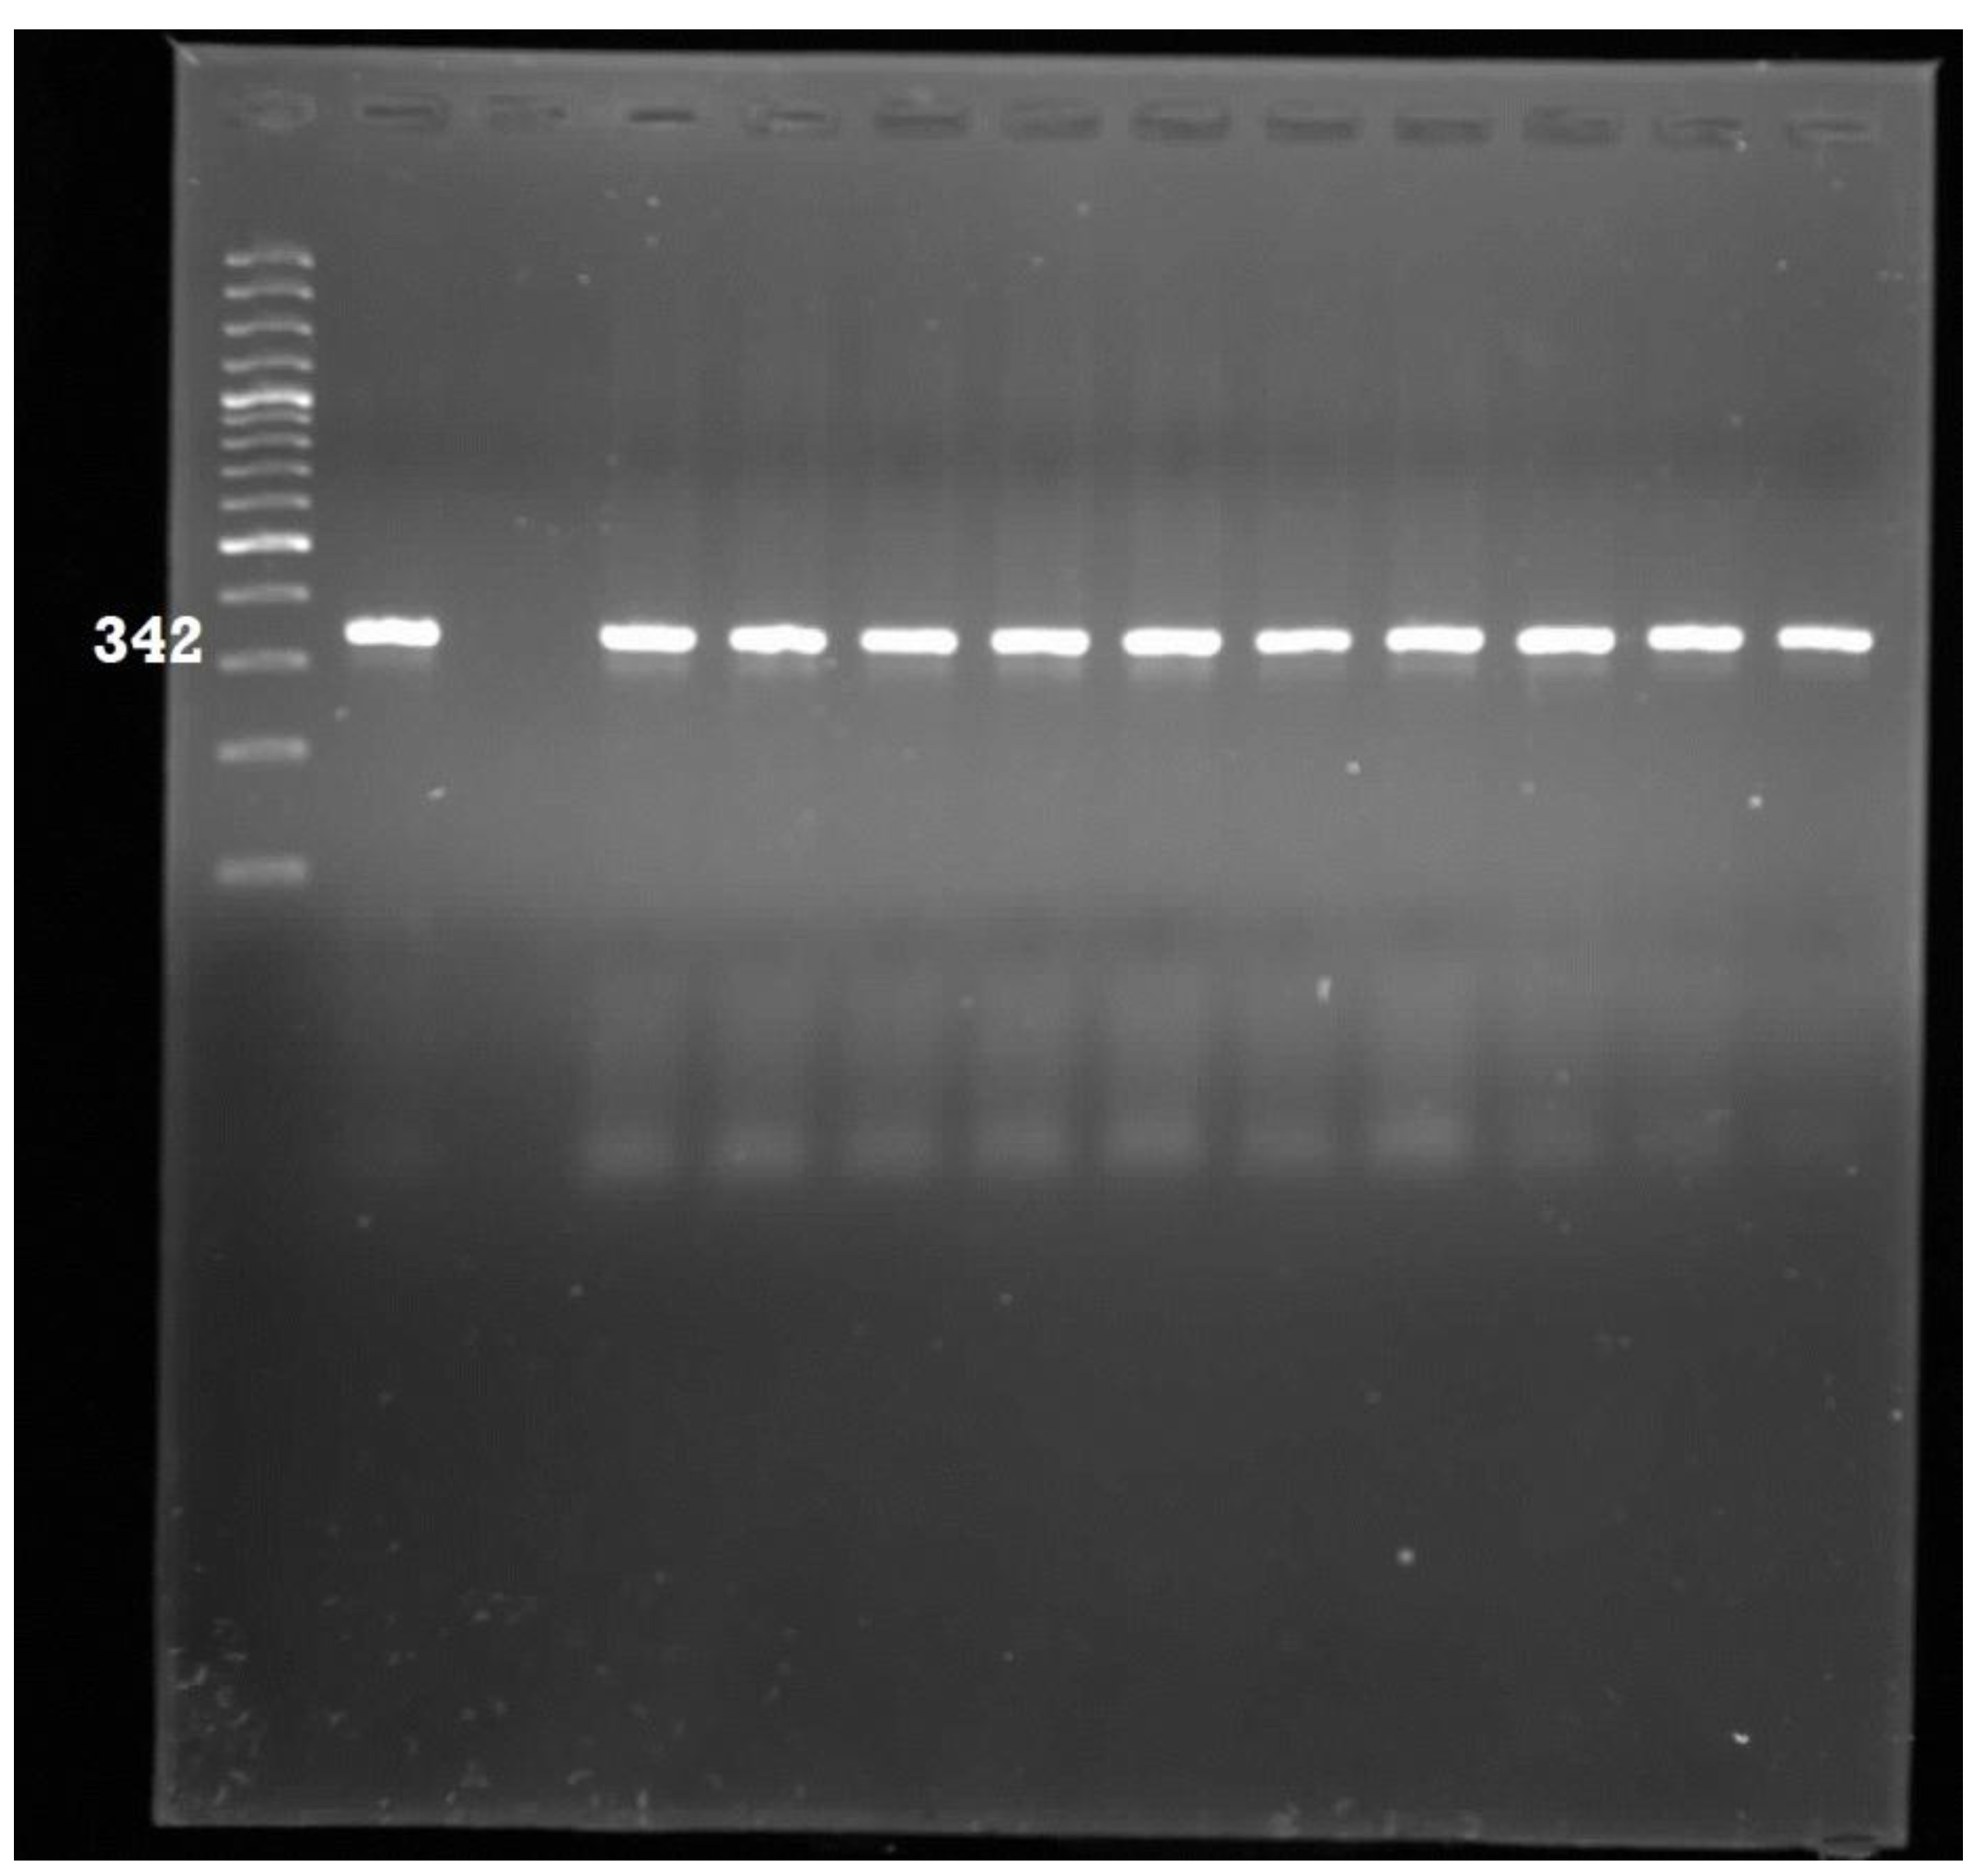
| EHEC | Shiga toxin 1 (stx1) | F-CAGTTAATGTGGTGGCGAAGG R-CACCAGACAATGTAACCGCTG | 348 | 55 | [21] |
| EPEC | Intimin (Eae) gene | F-TCAATGCAGTTCCGTTATCAGTT R-GTAAAGTCCGTTACCCCAACCTG | 482 | 54 | [23] |
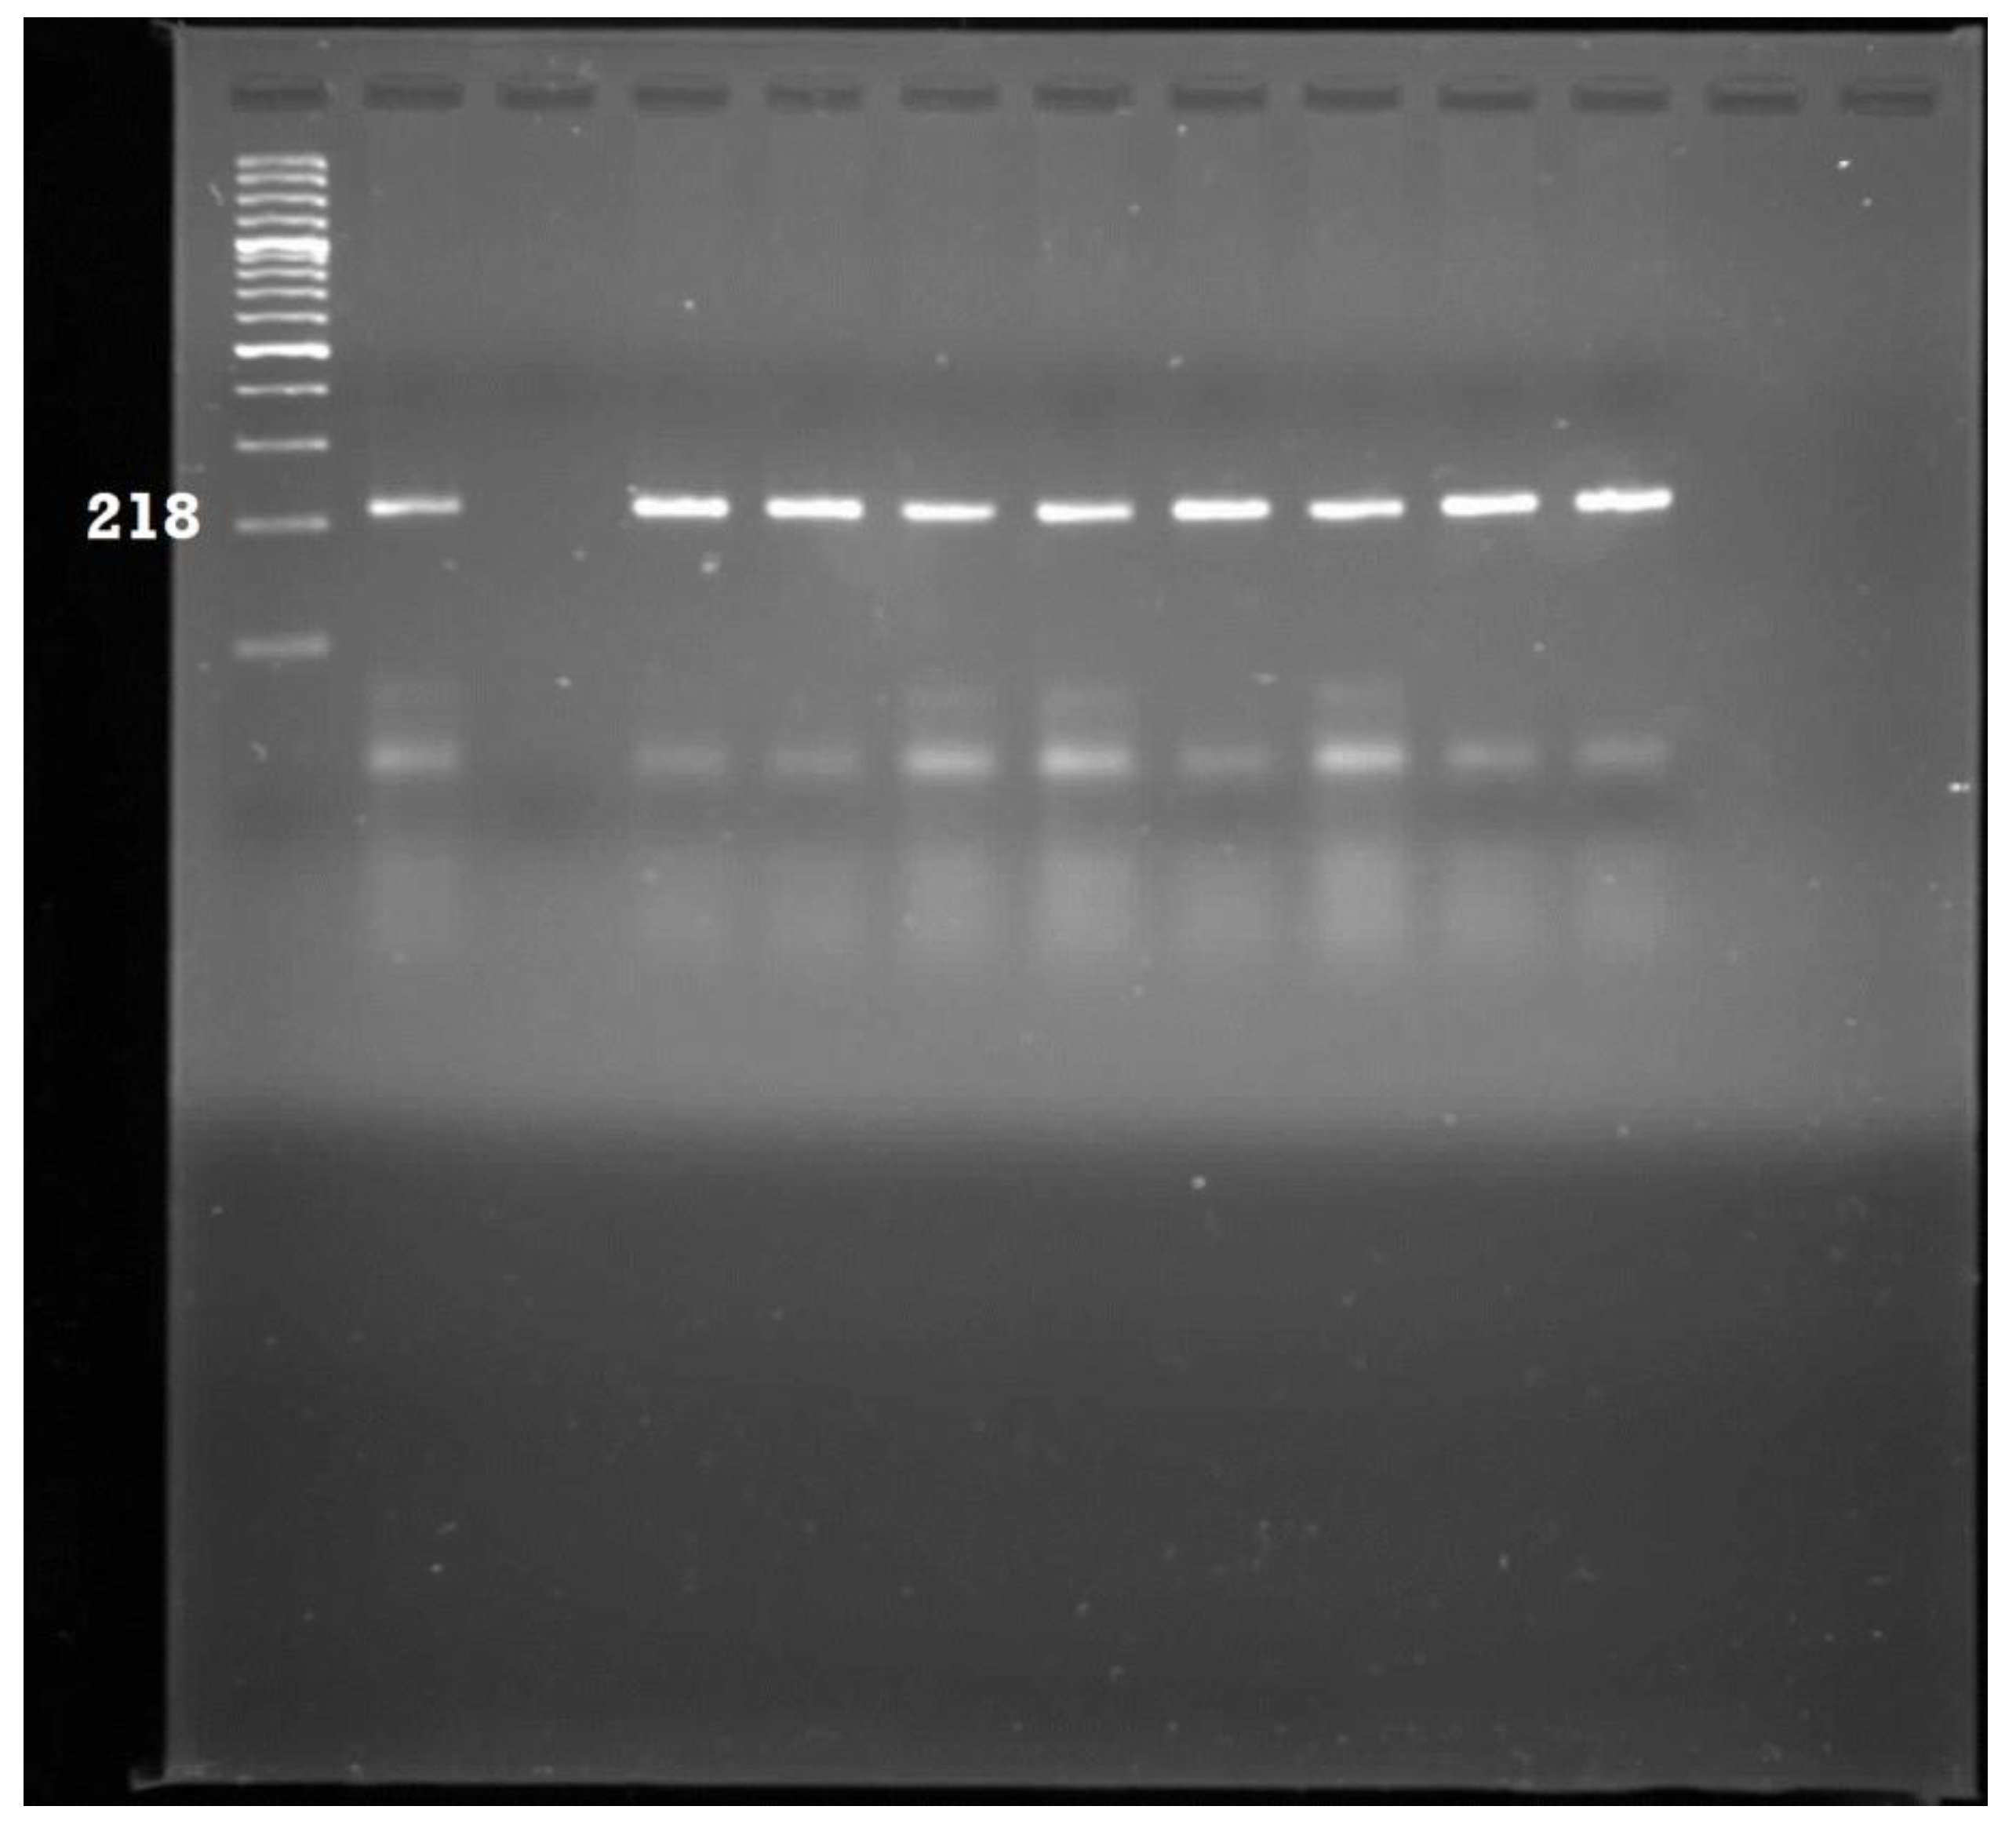
| ETEC | Heat-labile toxin (lt) | F-GCACACGGAGCTCCTCAGTC R-TCCTTCATCCTT TCA ATG GCT TT | 218 | 58 | [23] |
| EIEC | Invasin plasmid antigen (ipaH) | F-CTC GGC ACG TTT TAA TAG TCTGG R-GTGGAG AGC TGA AGT TTC TCTGC | 933 | 53 | [24] |
| EAEC | Aggregative adherent fimbriae (aafII) | F-CACAGGCAACTGAAATAAGTCTGG R-ATT CCC ATG ATG TCA AGC ACT TC | 378 | 56 | [24] |
| DAEC | F1845 Fimbriae (daaE) | F-GAACGT TGG TTA ATG TGG GGT AA R-TAT TCA CCG GTC GGT TAT CAG T | 542 | 54 | [24] |
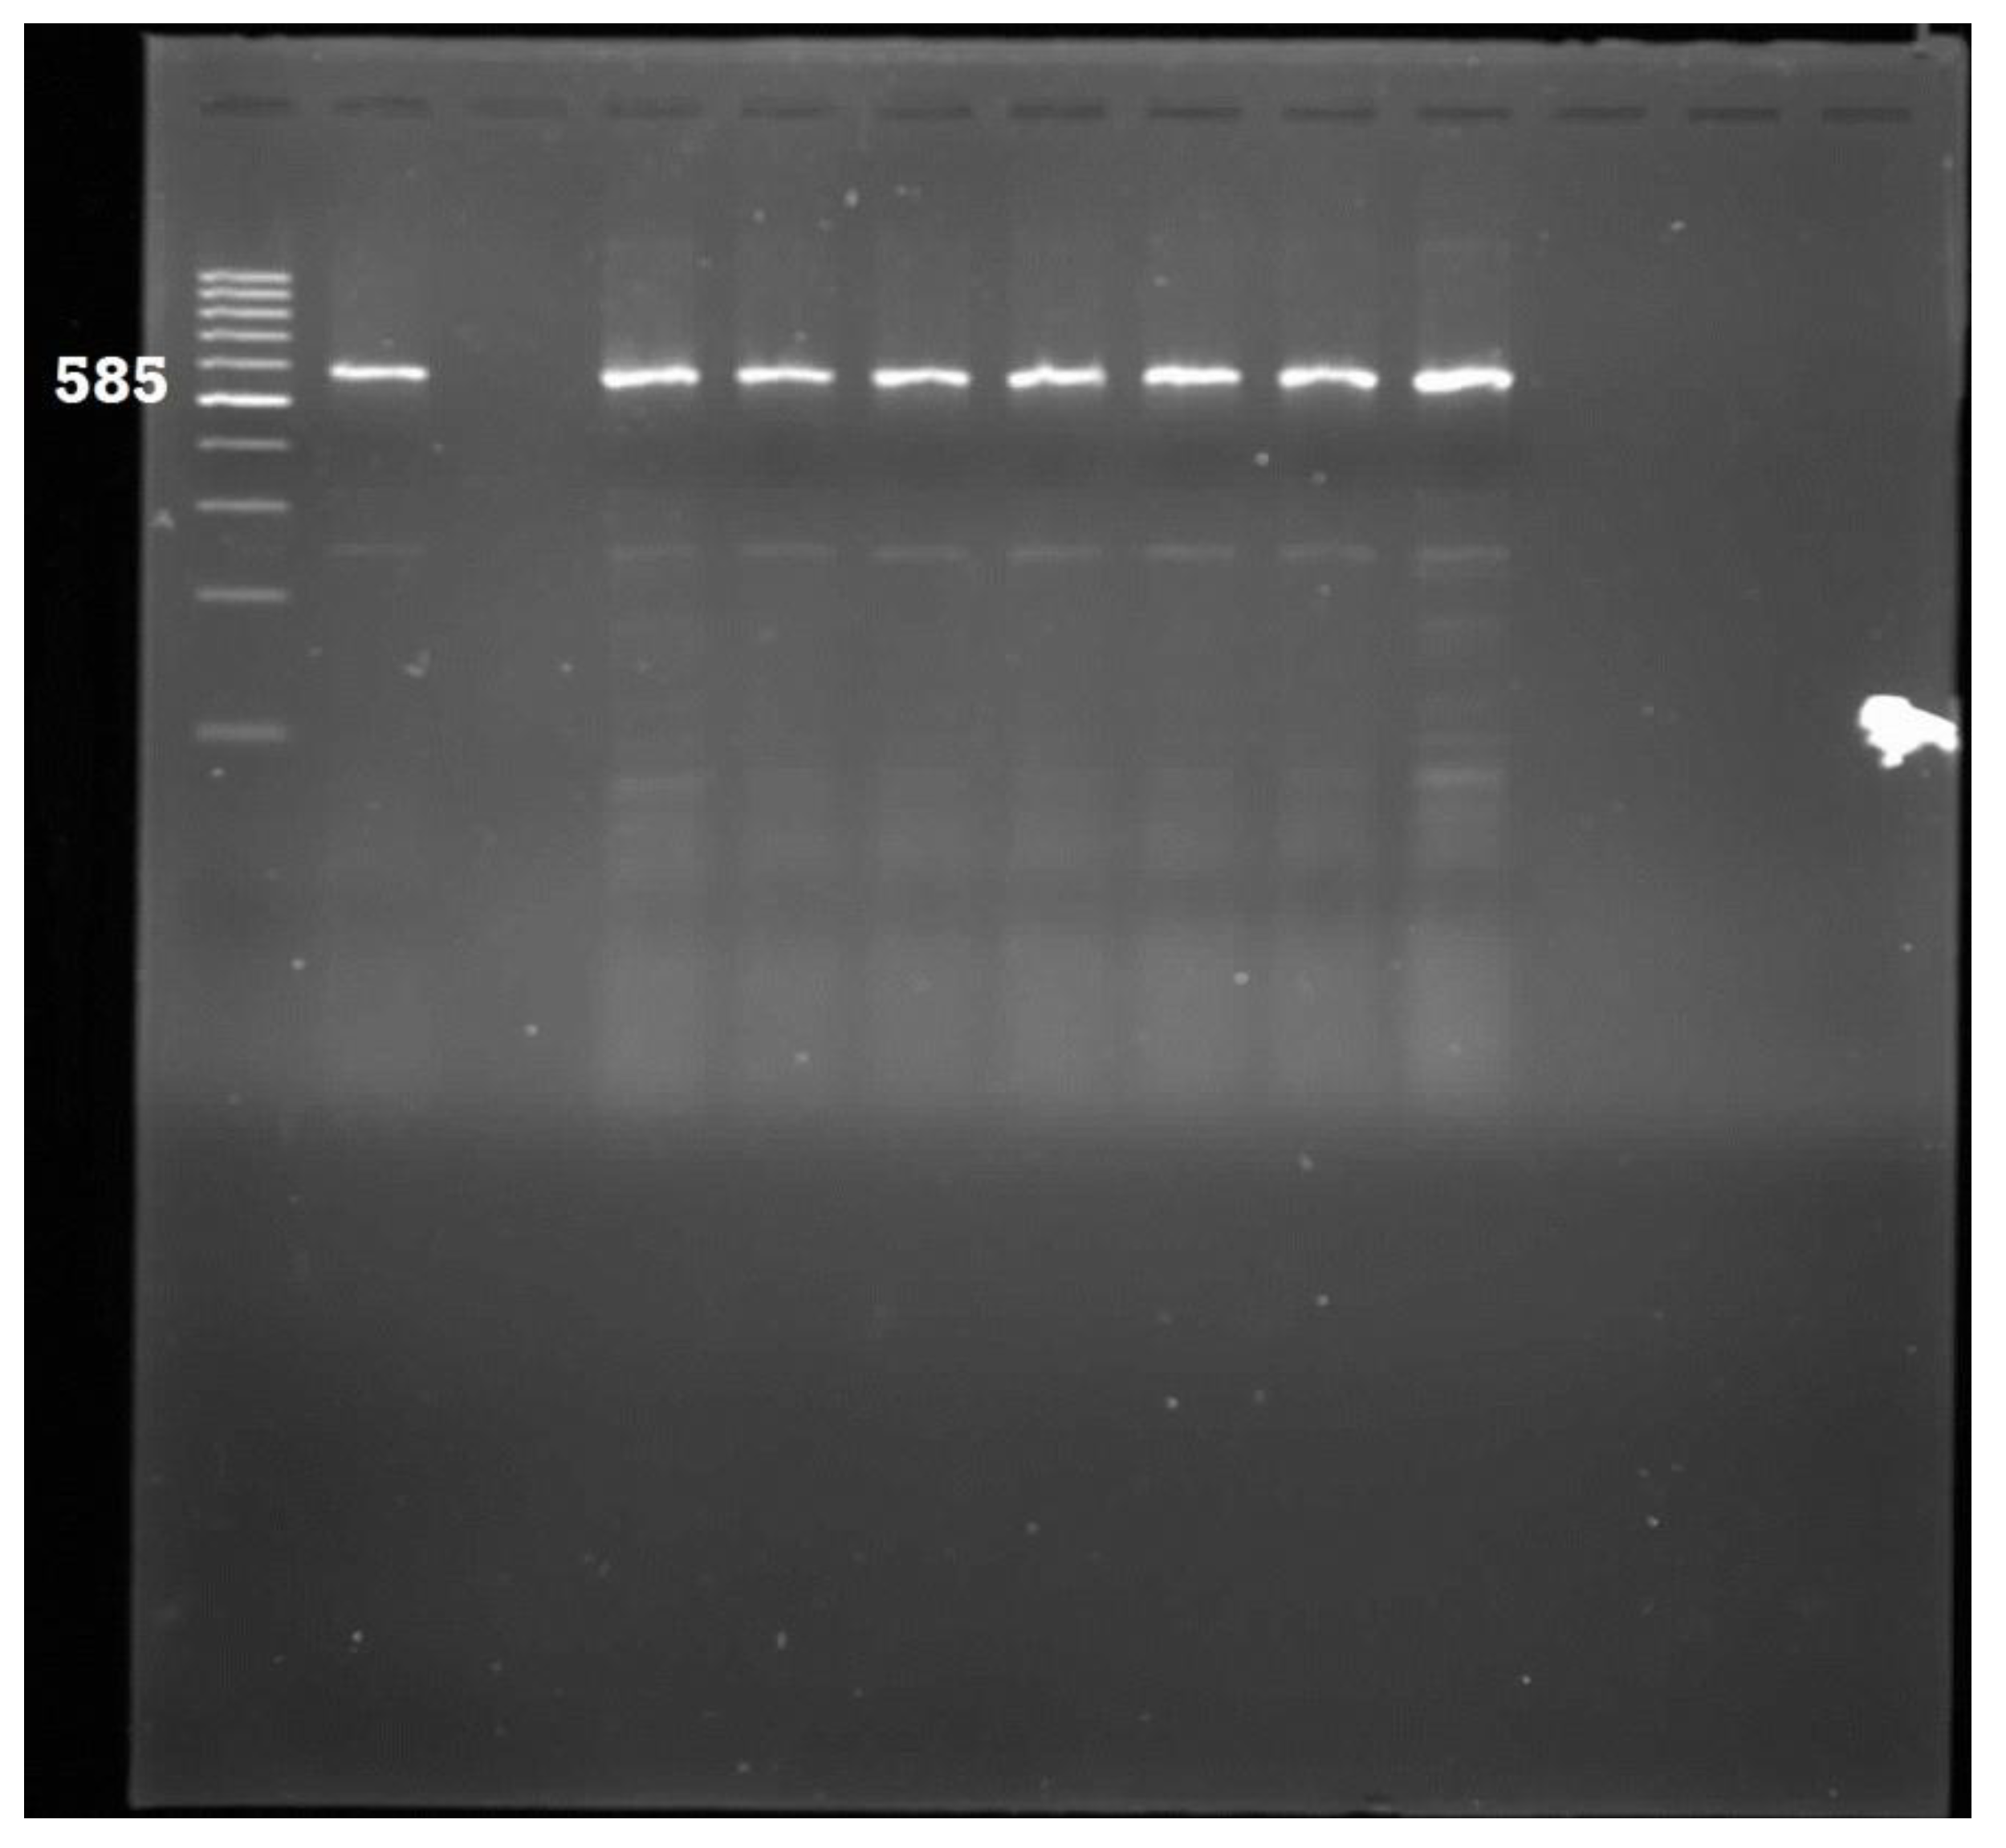
| UPEC | Pyelonephritis-associated pili (pap) | F-AAC CTGGCTTACGCAACTGTACCC GT R-CTG CAA AAT CAT GGA T | 585 | 58 | [21] |
| NMEC | Invasion of brain endothelial (IbeA) gene | F-TGGAACCCGCTCGTAATATAC R-CTGCCTGTTCAAGCATTGCA | 900 | 58 | [21] |
2.4. Antibiotic Susceptibility Test
| Test/Reportgroup | Antimicrobialagent | DiskContent (µg) | Zone Diameter Breakpoints, Nearest Whole mm | MIC Interpretive Standard (µg/mL) | ||||
|---|---|---|---|---|---|---|---|---|
| S | I | R | S | I | R | |||
| A | Ampicillin | 10 | ≥17 | 14–16 | ≤13 | ≤6 | 16 | ≥32 |
| A | Gentamycin | 10 | ≥15 | 13–14 | ≤12 | ≤4 | 8 | ≥16 |
| B | Amikacin | 30 | ≥17 | 15–16 | ≤14 | ≤16 | 32 | ≥64 |
| O | Streptomycin | 10 | ≥15 | 12–14 | ≤11 | - | - | - |
| O | Kanamycin | 30 | ≥18 | 14–17 | ≤13 | ≤16 | 32 | ≥64 |
| C | Tetracycline | 30 | ≥15 | 12–14 | ≤11 | ≤4 | 8 | ≥16 |
| B | Ciproflaxacin | 5 | ≥21 | 16–20 | ≤15 | ≤1 | 2 | ≥4 |
| U | Norflaxacin | 10 | ≥17 | 13–16 | ≤12 | ≤4 | 8 | ≥16 |
| B | Trimethoprime-sulfamethoxazole | 1.25/23.75 | ≥16 | 11–15 | ≤10 | ≤2/38 | - | ≥4/76 |
| C | Chloramfenicol | 30 | ≥18 | 13–17 | ≤12 | ≤8 | 16 | ≥32 |
2.5. Evaluation of Antibiotic Resistance Genes
| Antibacterial Agent | Resistance Gene | Sequence | Amplicon size (bp) | Annealing Temp. (°C) | References |
|---|---|---|---|---|---|
| Streptomycin | aadA1 | (F)TATCCAGCTAAGCGCGAACT | 147 | 58 | [26] |
| (R)ATTTGCCGACTACCTTGGTC | |||||
| β-Lactams | Bla | (F)TCGCCTGTGTATTATCTCCC | 198 | 52 | [26] |
| (R)CGCAGATAAATCACCACAATG | |||||
| Tetracycline | tetA | (F)CCTCAGCTTCTCAACGCGTG | 402 | 56 | [27] |
| (R)GCACCTTGCTGATGACTCTT | |||||
| TMP-SMX | dfrA1 | (F)GGAGTGCCAAAGGTGAACAGC | 721 | 45 | [28] |
| (R)GAGGCGAAGTCTTGGGTAAAAAC |
3. Results and Discussion
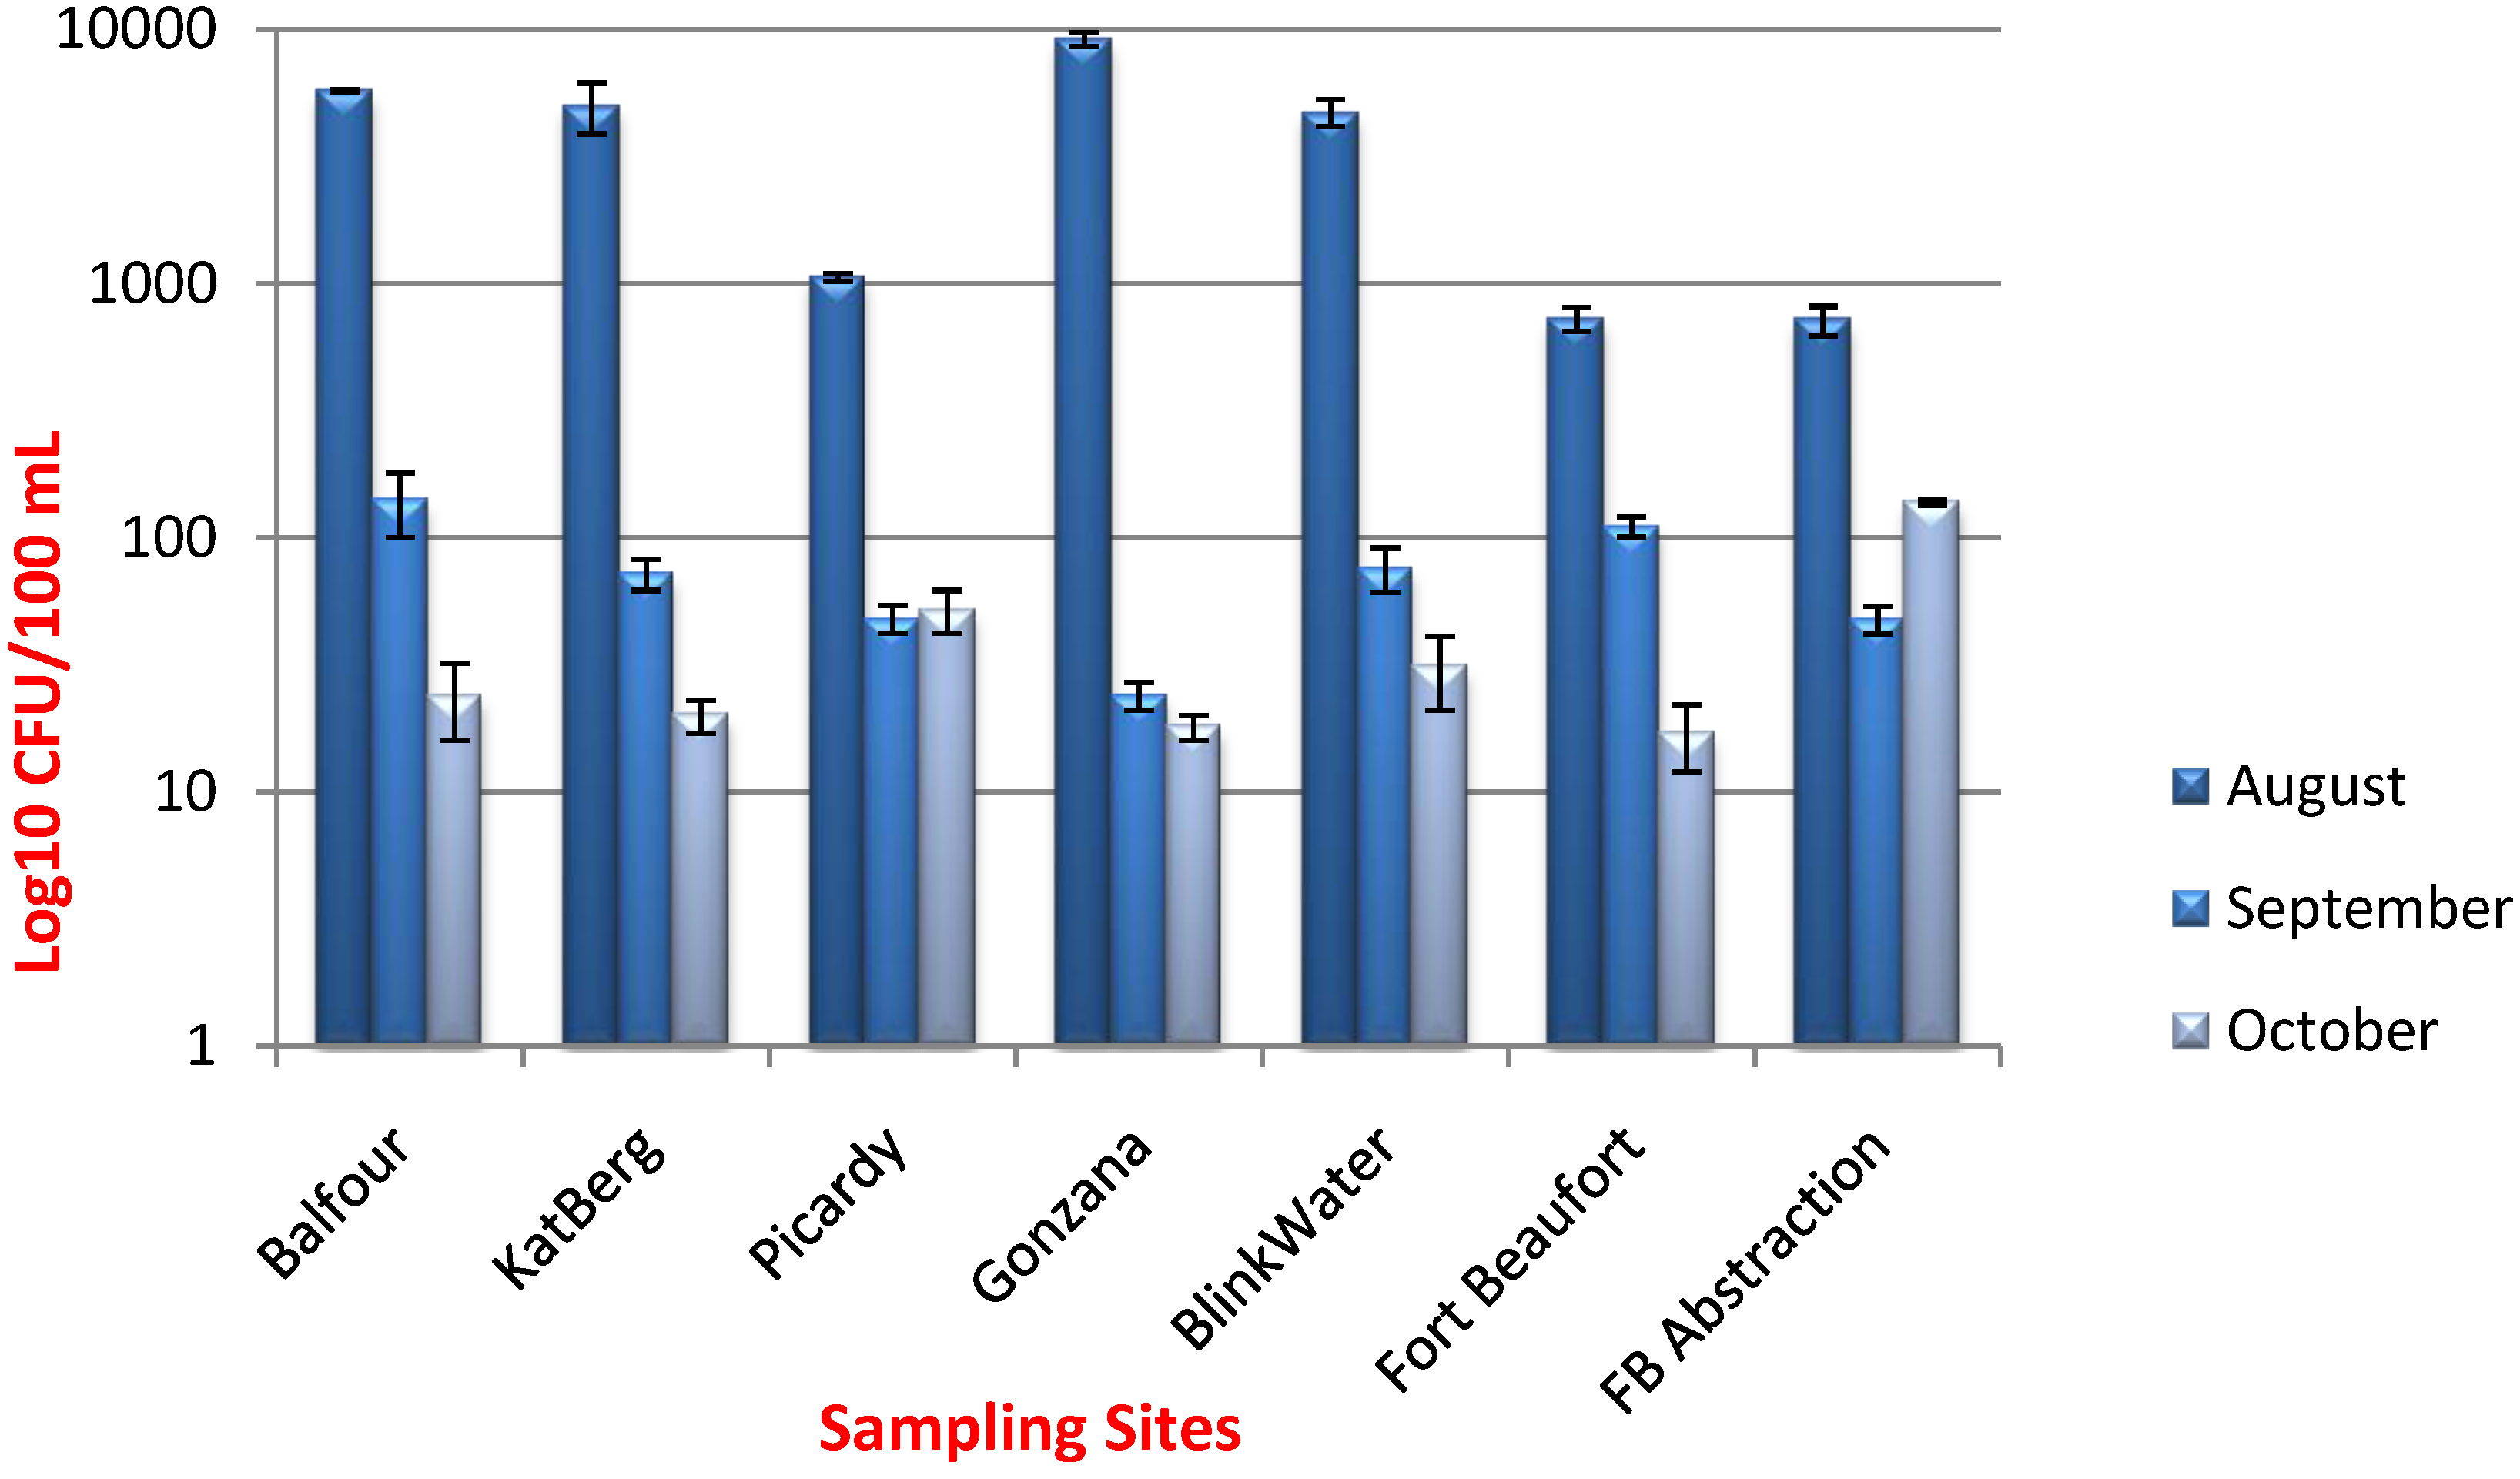
3.1. Enumeration of E. coli

3.2. Pathotype Characterization


3.3. Antibiotic Susceptibility Testing
| Antibacterial Agent | Number of Isolates ( n = 278); Percentages in Parenthesis | ||
|---|---|---|---|
| Resistant | Intermediate | Susceptible | |
| Ampicillin (AP) | 272 (98%) | 0 (0%) | 6 (2%) |
| Penicillin G (PG) | 278 (100%) | 0 (0%) | 0 (0%) |
| Tetracycline (T) | 37 (13%) | 33 (12%) | 208 (75%) |
| Gentamycin (G) | 0 (0%) | 20 (7%) | 258 (93%) |
| Chloramphenicol (C) | 0 (0%) | 75 (27%) | 203 (73%) |
| Trimethoprim-Sulphamethoxazole (TS) | 105 (38%) | 23 (8%) | 150 (54%) |
| Streptomycin (S) | 22 (8%) | 44 (16%) | 212 (77%) |
| Ciprofloxacin (CIP) | 0 (0%) | 19 (7%) | 259 (93%) |
| Norofloxacin (NOR) | 0 (0%) | 8 (2%) | 272 (98%) |
| Amikacin (AM) | 0 (0%) | 9 (3%) | 269 (97%) |
3.4 Antibiotic Resistance Determinants
| Antibiotic Determinant Screened | Resistance Encoded | Number of Isolates Tested | Positives (%) |
|---|---|---|---|
| aadA | Streptomycin | 22 | 100 |
| tetA | Tetracycline | 37 | 0 |
| Bla | β-Lactamase | 272 | 54 |
4. Conclusions
Acknowledgments
Author Contributions
Conflicts of Interest
References
- Okeke, I.N.; Fayinka, S.T.; Lamikanra, A. Antibiotic resistance trends in Escherichia coli from apparently healthy Nigerian students (1986–1998). Emerg. Infect. Dis. 2000, 6, 393–396. [Google Scholar] [CrossRef] [PubMed]
- Iwalokum, B.A.; Gbenle, G.O.; Smith, S.I.; Ogunledum, A.; Akinsinde, K.A.; Omonigbehin, E.A. Epidemiology of shigellosis in Lagos, Nigeria: Trends in antimicrobial resistance. J. Health Popul. Nutr. 2001, 19, 183–190. [Google Scholar] [PubMed]
- Kinge, N.W.; Ateba, C.N.; Kawadza, D.T. Antibiotic rsistance profiles of Escherichia coli isolated from different water sources in the Mmabatho locality, North-West province, South Africa. S. Afr. J. Sci. 2010, 106, 44–49. [Google Scholar]
- Mead, P.; Griffin, P. Escherichia coli O157:H7. Lancet 1998, 352, 1207–1212. [Google Scholar] [PubMed]
- Swerdlow, D.L.; Woodruff, B.A.; Brady, R.C.; Griffin, P.M.; Tippen, S.; Donnell, H.D. A waterborne outbreak in Missouri of Escherichia coli O157:H7 associated with bloody diarrhea and death. Ann. Intern. Med. 1992, 117, 812–819. [Google Scholar] [PubMed]
- Brunkhard, J.M.; Wash, C.; Duffy, G.; O’Mahony, R.; Fanning, S.; Blain, I.S.; McDowell, D.A. Antimicrobial resistance in Irish isolates of verocytotoxigenic Escherichia coli- VTEC. Int. J. Food Microbiol. 2005, 109, 173–178. [Google Scholar]
- World Health Organization (WHO). Public Health Importance of Antimicrobial Resistance. Available online: http://www.who.int/drugresistance/AMR_Importance/en/ (accessed on 4 May 2014).
- World Health Organization (WHO). New frontiers in the development of vaccines against enterotoxigenic (ETEC) and enteroheamorrhagic (EHEC) E. coli infections. Weekly Epidemiol. Rec. 1999, 74, 98–100. [Google Scholar]
- Samie, A.; Guerrant, R.L.; Barrett, L.; Bessong, P.O.; Igumbor, E.O.; Obi, C.L. Prevalence of intestinal parasitic and bacterial pathogens in diarrhoeal and non-diarrhoeal human stools from Vhembe district, South Africa. J. Health Popul. Nutr. 2012, 27, 739–745. [Google Scholar]
- Chopra, I.; Roberts, M. Tetracycline antibiotics: Mode of action, applications, molecular biology, and epidemiology of bacterial resistance. Microbiol. Mol. Biol. Rev. 2001, 65, 232–260. [Google Scholar] [CrossRef] [PubMed]
- Fasehun, F. The antibacterial paradox: Essential drugs, effectiveness and cost. Bull World Health Organ. 1999, 56, 353–356. [Google Scholar]
- Fridkin, S.K.; Edwards, J.R.; Tenover, F.C.; Gaynes, R.P.; McGowan, J.E. Antimicrobial resistance prevalence rates in hospital antibiograms reflect prevalence rates among pathogens associated with hospital-acquired infections. Clin. Infect. Dis. 2001, 33, 324–330. [Google Scholar]
- Chin, A.E.; Hedberg, K.; Cieslak, P.R.; Cassidy, M.; Stefonek, K.R.; Fleming, D.W. Tracking Drug-Resistant Streptococcus pneumoniae in Oregon: An Alternative Surveillance Method. Emerg. Infect. Dis. 1999, 5, 688–693. [Google Scholar] [CrossRef] [PubMed]
- Van Beneden, C.A.; Lexau, C.; Baugham, W.; Barnes, B.; Bennet, N.; Cassidy, P.M.; Pass, M.; Gelling, L.; Barrett, N.L.; Zell, E.R.; Whitney, C.G. Aggregated antibiograms and monitoring of drug-resistant Streptococcus pneumoniae. Emerg. Infect. Dis. 2003, 9, 1089–1095. [Google Scholar] [CrossRef] [PubMed]
- NCCLS. Performance Standards for Antimicrobial Susceptibility Testing: Twelfth Informational Supplement. NCCLS document M100-S12; NCCLS: Wayne, PA, USA, 2003. [Google Scholar]
- McMaster, A. GIS in participatory catchment: A case study in the Kat River Valley, Eastern Cape, South Africa. Rhodes University, 2002. [Google Scholar]
- Obi, A.; Fraser, G.; Jari, B. Influence of institutional factors on smallholder farmers’ marketing channel choices. In Institutional Constraints to Small Farmer Development in Southern Africa; Wageningen Academic publishers: Wageningen, The Netherlands, 2011; pp. 101–117. [Google Scholar]
- Standard Methods. Standard Methods for the Examination of Water and Wastewater, 20th Ed. ed; American Public Health Association (APHA): Washington, DC, USA, 2005. [Google Scholar]
- Maugeri, T.L.; Carbone, M.; Fera, M.T.; Irrera, G.P.; Gugliandolo, C. Distribution of potentially pathogenic bacteria as free living and plankton associated in a marine coastal zone. J. Appl. Microbiol. 2004, 97, 354–361. [Google Scholar] [CrossRef] [PubMed]
- Moyo, S.J.; Maselle, S.Y.; Matee, M.I.; Langeland, N.; Mylvaganam, H. Identification of diarrheagenic Escherichia coli isolated from infants and children in Dares Salaam, Tanzania. BMC Infect. Dis. 2007, 7. [Google Scholar] [CrossRef]
- Cebula, T.A.; Payne, W.L.; Feng, P. Simultaneous identification of strains of Escherichia coli serotype O157:H7 and their Shiga-like toxin type by mismatch amplification mutation assay-multiplex PCR. J. Clin. Microbiol. 1995, 33, 248–250. [Google Scholar] [PubMed]
- Gannon, V.P.D.; Souza, S.; Graham, T.; King, R.K.; Rahn, K.; Read, S. Use of flagellar H7 gene as a target in multiplex PRC assays and improved specificity in identification of enterohemorrhagic E. coli strains. J. Clin. Microbiol. 1997, 35, 656–662. [Google Scholar]
- Stacy-Phipps, S.; Mecca, J.J.; Weiss, J.B. Multiplex PCR assay and simple preparation method for stool specimens detect enterotoxigenic Escherichia coli DNA during the course of infection. J. Clin. Microbiol. 1995, 33, 1054–1059. [Google Scholar] [PubMed]
- Vidal, M.; Kruger, E.; Duran, C.; Lagos, R.; Levine, M.; Prado, V.; Toro, C.; Vidal, R. Single multiplex PCR assay to identify simultaneously the six categories of diarrheagenic Escherichia coli associated with enteric infections. J Clin Microbiol. 2005, 43, 5362–5365. [Google Scholar] [PubMed]
- Clinical and Laboratory Standards Institute (formerly National Committee for Clinical Laboratory Standards). Performance Standards for Antimicrobial Susceptibility Testing; Fifteenth Informational Supplement, M100- S15; CLSI: Wayne, PA, USA, 2011. [Google Scholar]
- Van, T.T.H.; Chin, J.; Chapman, T. Safety of raw meat and shellfish in Vietnam: An analysis of Escherichia coli isolations for antibiotic resistance and virulence genes. Int. J. Food Microbiol. 2008, 124, 217–223. [Google Scholar] [CrossRef] [PubMed]
- Randall, L.P.; Cooles, S.W.; Osborn, M.K.; Piddock, L.J.; Woodward, M.J. Antibiotic resistance genes, integrons and multiple antibiotic resistance in thirty-five serotypes of Salmonella enterica isolated from humans and animals in the UK. J. Antimicrob. Chemother. 2004, 53, 208–216. [Google Scholar] [CrossRef] [PubMed]
- Toro, C.S.; Farfan, M.; Contreras, I.; Flores, O.; Navarro, N.; Mora, G.C.; Prado, V. Genetic analysis of antibiotic- resistance determinants in multidrug-resistant Shigella strains isolated from Chilean children. Epidemiol. Infect. 2005, 133, 81–86. [Google Scholar] [CrossRef] [PubMed]
- BLACKSASH. Eastern Cape Provincial Health Consultative Workshop: A Community Consultation Workshop Report. Available online: http://www.blacksash.org.za/files/ec_consultworkshp_10052010.pdf (accessed on 10 May 2010).
- ECSECC. District Demographic and Socio-Economic Indicators: Census 1996; 2001; 2011. Available online: http://www.ecsecc.org/files/library/documents/ECSECC_Census.pdf (accessed on 1 June 2014).
- The South African National Road Agency. Special Development Project: Pondoland—Community Empowerment Impact Assessment Report: Phase 1. Available online: http://www.nra.co.za/content/Pondo1.pdf (accessed on 1 June 2014).
- Hall, R.; Barlow, M. What antimicrobial resistance has taught us about horizontal gene transfer: Methods in Molecular Biology (N.J. Clifton). Methods in Mol. Biol. 2004, 532, 397–411. [Google Scholar]
- Sayah, R.S.; Kaneene, J.B.; Johnson, Y.; Miller, R. Patterns of antimicrobial resistance observed in Escherichia coli isolates obtained from domestic- and wild-animal fecal samples, human septage, and surface water. Appl. Environ. Microbiol. 2005, 71, 1394–1404. [Google Scholar] [CrossRef] [PubMed]
- Yoh, M.; Honda, T. The stimulating effect of fosfomycin: An antibiotic in common use in Japan, on production⁄release of verotoxin-1 from enterohaemorrhagic Escherichia coli O157: H7 in vitro. Epidemiol. Infect. 1997, 119, 101–103. [Google Scholar] [CrossRef] [PubMed]
- Ram, S.; Vajpayee, P.; Shanker, R. Contamination of potable water distribution systems by multi-antimicrobial-resistant enterohemorrhagic Escherichia coli. Environ. Health Perspect. 2007, 116, 448–452. [Google Scholar]
- Carattoli, A. Importance of integrons in the diffusion of resistance. Vet. Res. 2002, 3, 243–259. [Google Scholar]
- Martinez, J.L. Natural antibiotic resistance and contamination by antibiotic resistance determinants: the two ages in the evolution of resistance to antimicrobials. FEMS Microbiol. Rev. 2012, 33, 44–65. [Google Scholar] [CrossRef]
- D’Costa, V.M.; King, C.E.; Kalan, L.; Morar, M.; Sung, W.W.; Schwarz, C.; Froese, D.; Zazula, G.; Calmels, F.; Debruyne, R.; et al. Antibiotic resistance is ancient. Nature 2011, 477, 457–461. [Google Scholar] [CrossRef] [PubMed]
- Sommer, M.O.; Dantas, G.; Church, G.M. Functional characterization of the antibiotic resistance reservoir in the human microflora. Science 2009, 325, 1128–1131. [Google Scholar] [CrossRef] [PubMed]
- Davies, J.E. Origins, acquisition and dissemination of antibiotic resistance determinants. Ciba Found Symp. 1997, 207, 15–27. [Google Scholar] [PubMed]
© 2014 by the authors; licensee MDPI, Basel, Switzerland. This article is an open access article distributed under the terms and conditions of the Creative Commons Attribution license (http://creativecommons.org/licenses/by/3.0/).
Share and Cite
Nontongana, N.; Sibanda, T.; Ngwenya, E.; Okoh, A.I. Prevalence and Antibiogram Profiling of Escherichia coli Pathotypes Isolated from the Kat River and the Fort Beaufort Abstraction Water. Int. J. Environ. Res. Public Health 2014, 11, 8213-8227. https://doi.org/10.3390/ijerph110808213
Nontongana N, Sibanda T, Ngwenya E, Okoh AI. Prevalence and Antibiogram Profiling of Escherichia coli Pathotypes Isolated from the Kat River and the Fort Beaufort Abstraction Water. International Journal of Environmental Research and Public Health. 2014; 11(8):8213-8227. https://doi.org/10.3390/ijerph110808213
Chicago/Turabian StyleNontongana, Nolonwabo, Timothy Sibanda, Elvis Ngwenya, and Anthony I. Okoh. 2014. "Prevalence and Antibiogram Profiling of Escherichia coli Pathotypes Isolated from the Kat River and the Fort Beaufort Abstraction Water" International Journal of Environmental Research and Public Health 11, no. 8: 8213-8227. https://doi.org/10.3390/ijerph110808213