Size Matters — Determinants of Modern, Community-Oriented Mental Health Services

 ,
,
Abstract
:
1. Introduction
2. Methods
2.1. The Study Area
2.2. Data Collection

2.3. Measures
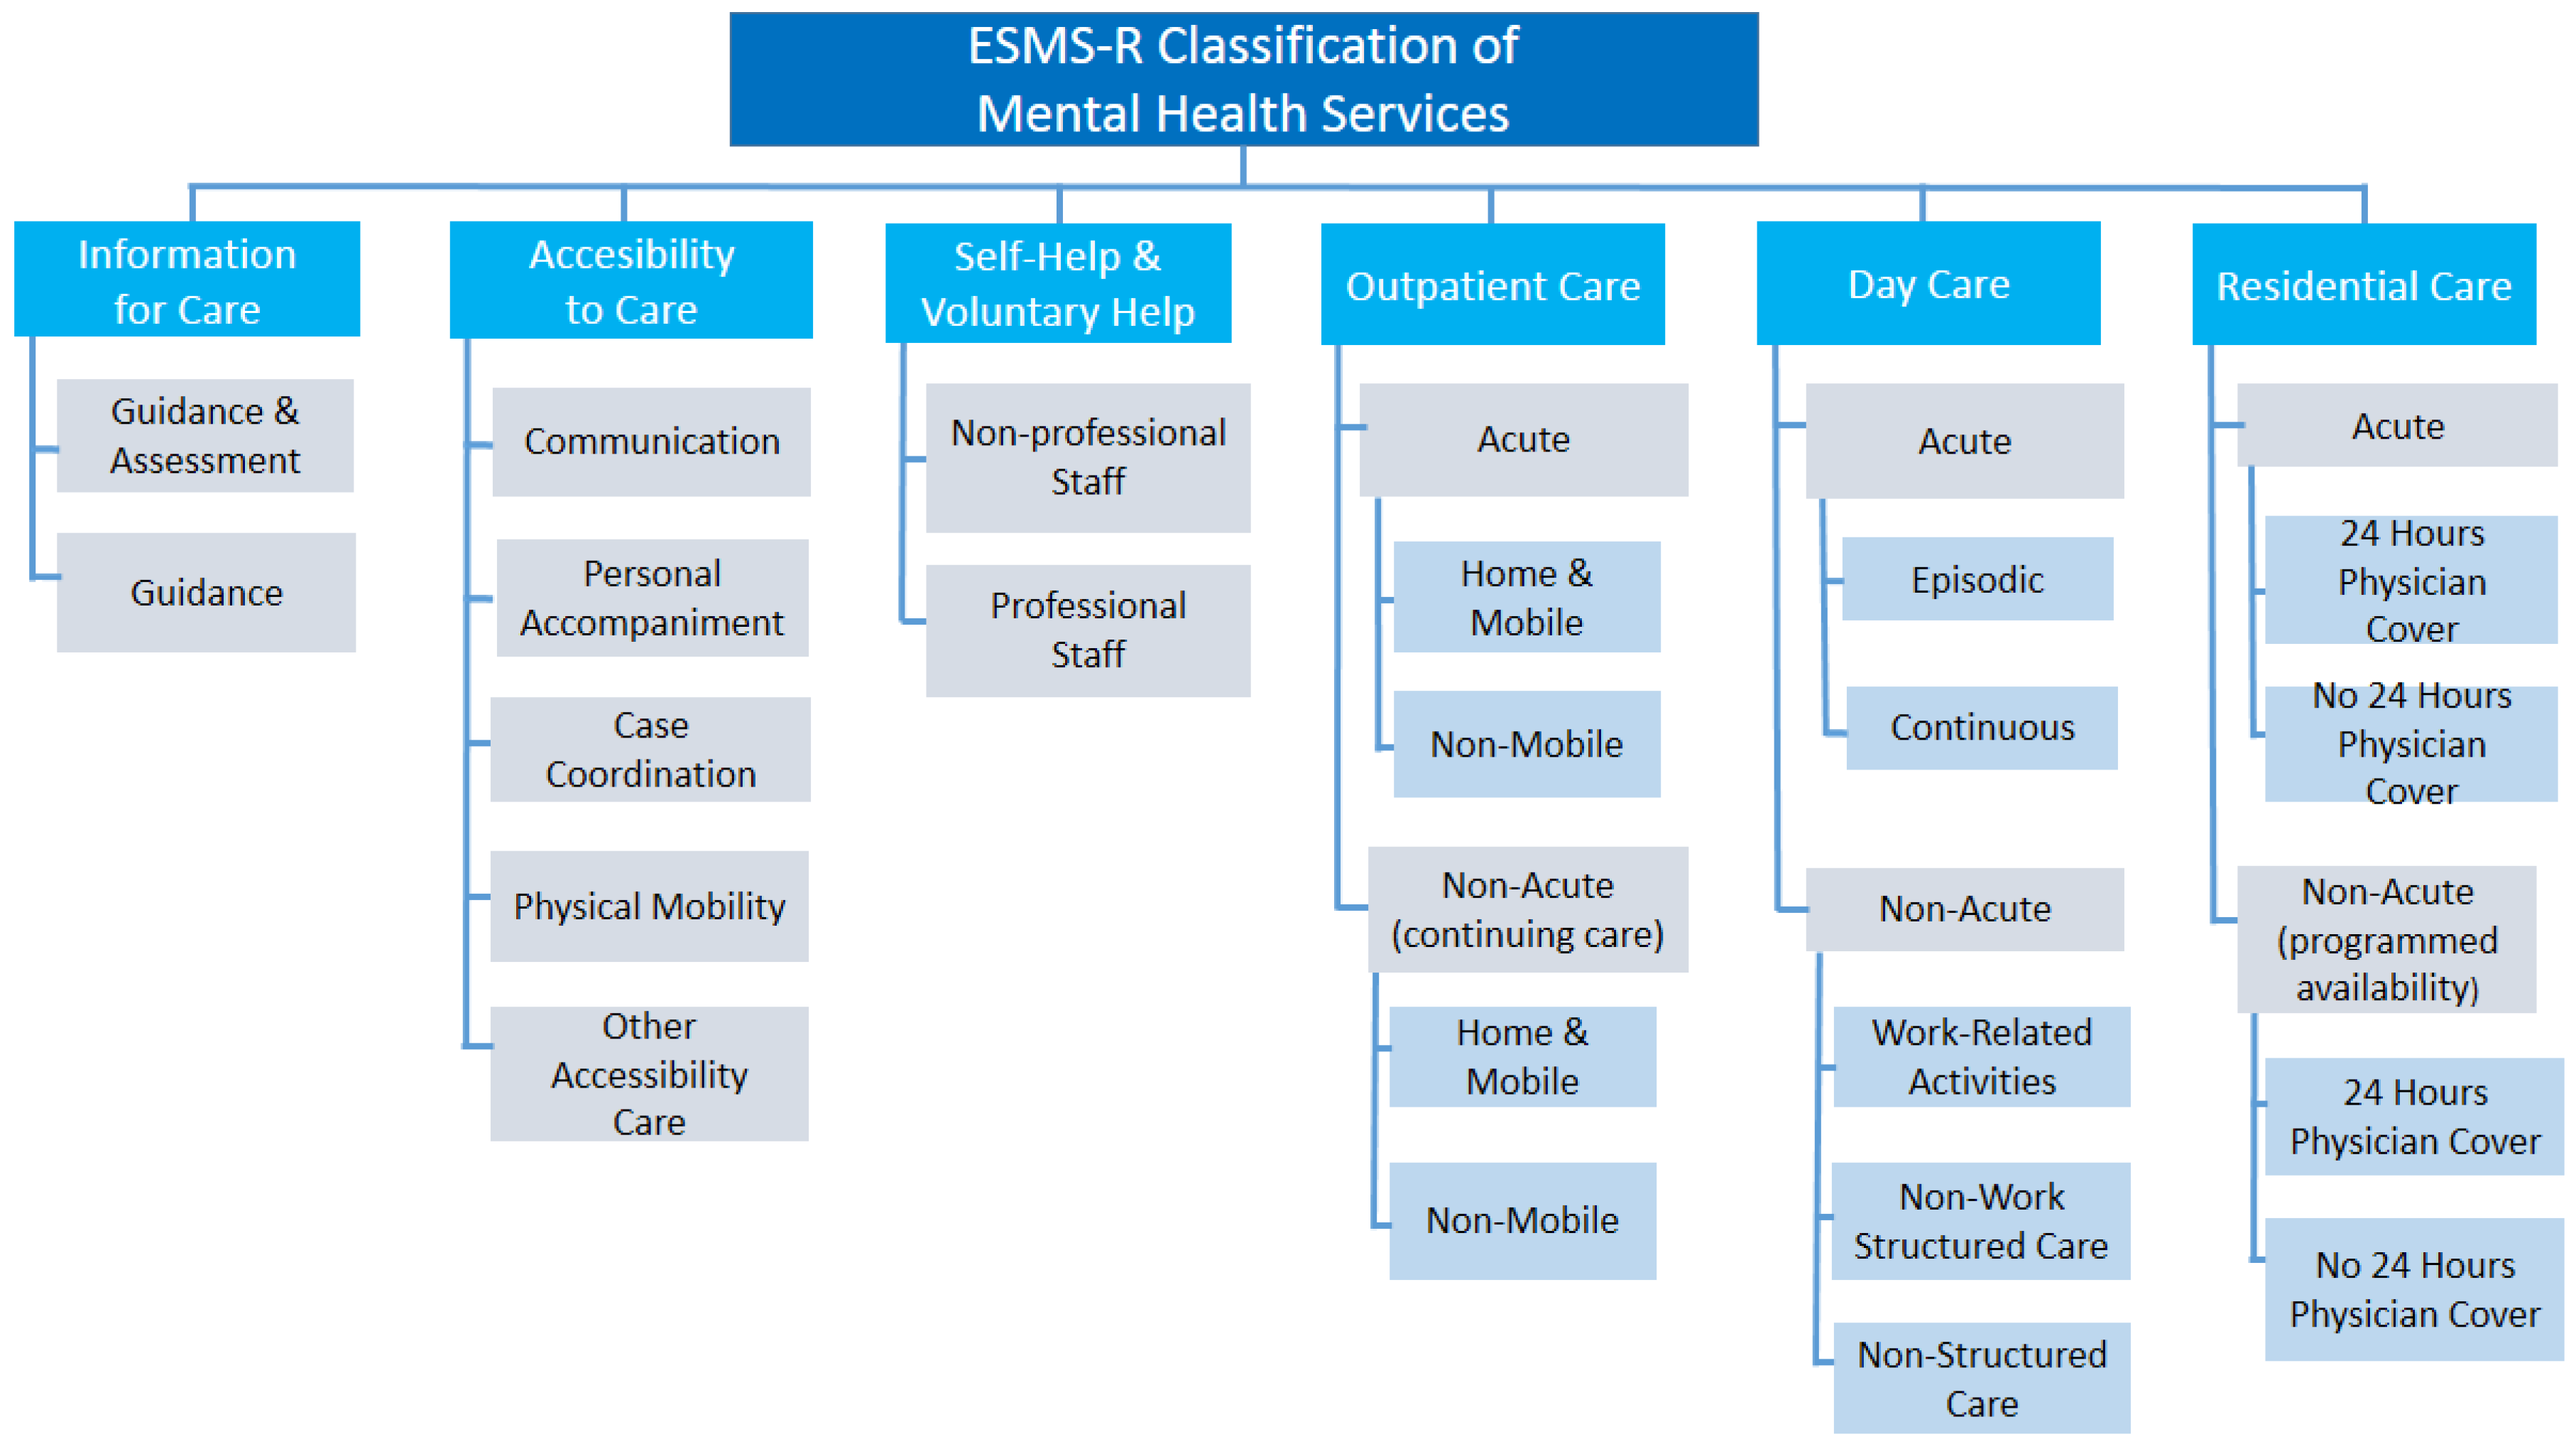
2.3.1. Diversity and Community Orientation
2.3.2. Mental Health Needs
2.4. Data Analysis

| Catchment area | Länsi-Uusimaa | Lohja | Hyvinkää | Porvoo | Helsinki | Jorvi | Peijas | Kymen-laakso | Etelä-Karjala | Weighted Mean | SD | Finland |
|---|---|---|---|---|---|---|---|---|---|---|---|---|
| Area number | 1 | 2 | 3 | 4 | 5 | 6 | 7 | 8 | 9 | |||
| Population (≥18 year) | 35,316 | 70,192 | 138,973 | 74,079 | 497,814 | 227,605 | 185,984 | 141,085 | 107,612 | 164,295 | 138,626 | 4,202,852 |
| Mental health index (not age adjusted) | 82 | 84.5 | 72.1 | 73.5 | 83.9 | 65.9 | 78 | 110.8 | 104.7 | 83.4 | 13.1 | 100 |
| Education ** | 3 | 3.2 | 3.5 | 3.3 | 4.1 | 4.6 | 3.4 | 3 | 3 | 3.4 | 0.6 | 3.4 |
| Average age of retirement | 60.2 | 59 | 58.6 | 59.3 | 59.3 | 58.9 | 58.9 | 58.4 | 58.8 | 59 | 0.5 | 58.7 |
| Unemployment % | 7.2 | 7.1 | 6 | 7.1 | 7.5 | 5.5 | 8 | 12.2 | 11.8 | 7.8 | 2.4 | 9.4 |
| Single households (%) | 40.1 | 34.8 | 34.2 | 35.2 | 49 | 34.4 | 38.1 | 43.9 | 43.6 | 41.5 | 5.3 | 41.2 |
| Alcohol, sold (100%/ltr/inhabi-tant) | 8.8 | 8 | 7.3 | 7.2 | 9.4 | 6.3 | 8.1 | 8.6 | 9.4 | 8.3 | 1 | 8.2 |
3. Results
3.1. Characteristics of the Catchment Areas
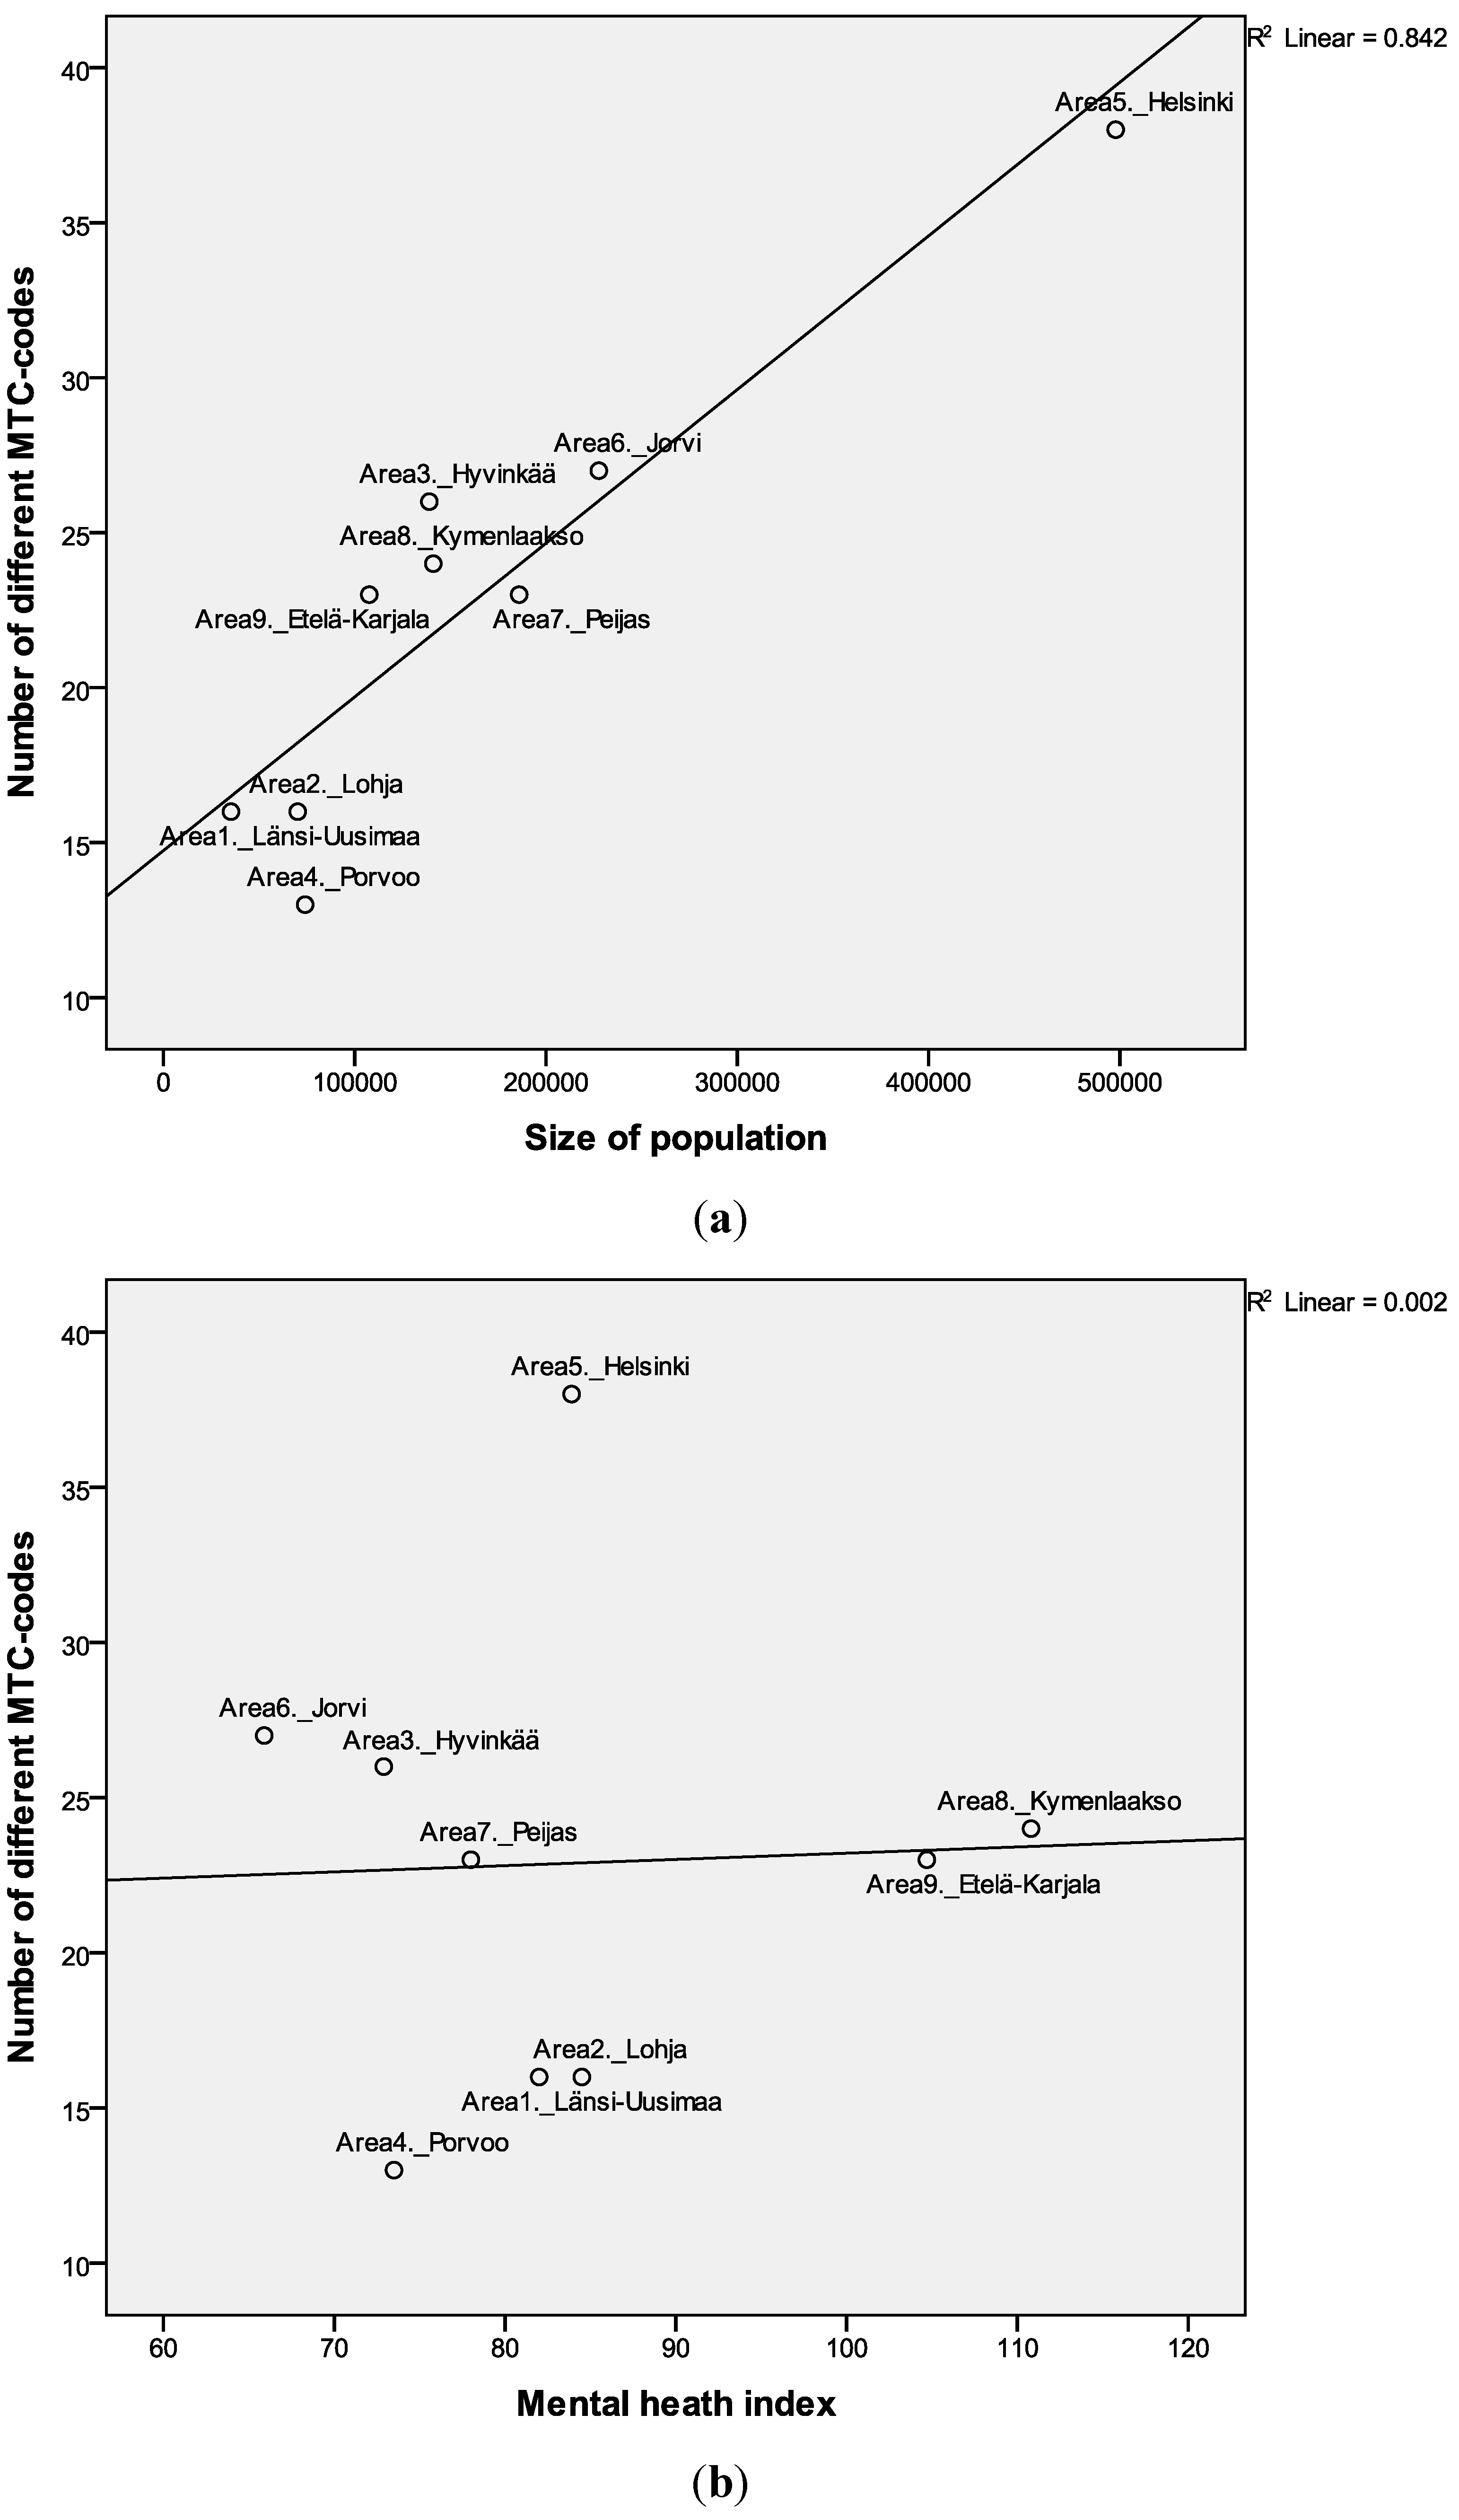
3.2. Diversity

| Catchment area | Länsi-Uusimaa | Lohja | Hyvinkää | Porvoo | Helsinki | Jorvi | Peijas | Kymen-laakso | Etelä-Karjala | Total | Mean | SD | ||||
|---|---|---|---|---|---|---|---|---|---|---|---|---|---|---|---|---|
| Area number | 1 | 2 | 3 | 4 | 5 | 6 | 7 | 8 | 9 | |||||||
| Quantity of services (Number of BSIC by ESMS-R main branches and resource allocation (FTE) | ||||||||||||||||
| I Information for care | - | 1 | - | - | 6 | 1 | 4 | 2 | 0 | 14 | 2.33 | 2.3 | ||||
| D Day care | 6 | 3 | 10 | 7 | 29 | 9 | 10 | 16 | 16 | 106 | 11.8 | 7.7 | ||||
| S Self-help and voluntary care | 4 | 9 | 24 | 9 | 29 | 15 | 11 | 23 | 18 | 142 | 15.8 | 8.3 | ||||
| O Outpatient care | 6 | 11 | 19 | 12 | 55 | 19 | 22 | 31 | 19 | 194 | 21.6 | 14 | ||||
| R Residential care | 7 | 16 | 41 | 15 | 72 | 25 | 30 | 44 | 20 | 270 | 30 | 20 | ||||
| Number of service units/BSIC | 23 | 40 | 94 | 43 | 191 | 69 | 77 | 116 | 73 | 726 | 80.6 | 50 | ||||
| Day care (D) FTE | 20.7 | 13 | 49.2 | 18.4 | 134.5 | 24.5 | 14 | 30 | 65.2 | 369 | 41.1 | 39 | ||||
| Outpatient care (O) FTE | 44.6 | 49.3 | 131.9 | 48.2 | 563.9 | 198.7 | 173 | 128.3 | 90.11 | 1428 | 159 | 162 | ||||
| Residential care (R) FTE | 113 | 179.2 | 396.7 | 130.2 | 983.0 | 252.9 | 283.5 | 397.4 | 176.5 | 2912 | 324 | 268 | ||||
| Total FTE | 178.3 | 242.5 | 577.7 | 196.7 | 1701.4 | 479.1 | 477.5 | 557.7 | 331.7 | 4741 | 527 | 466 | ||||
| Total FTE/1000 adults | 5.1 | 3.5 | 4.2 | 2.7 | 3.4 | 2.1 | 2.6 | 4.0 | 3.1 | 3.2 | 3.4 | 0.7 | ||||
| Quality of services (Number of different MTC by ESMS-R main branches (diversity) and community orientation) | ||||||||||||||||
| Number of different MTC | 16 | 16 | 26 | 13 | 38 | 27 | 23 | 24 | 23 | 56 | 22.8 | 7.5 | ||||
| Community-based services =FTE D + O | 65.3 | 62.3 | 181.1 | 66.58 | 420 | 223.2 | 187 | 158.3 | 155.3 | 1519 | 164 | 101 | ||||
| Community-based services =FTE D + O/1000 adult | 1.85 | 0.89 | 1.3 | 0.9 | 0.84 | 0.98 | 1.01 | 1.12 | 1.44 | 1.03 | 1.13 | 0.3 | ||||
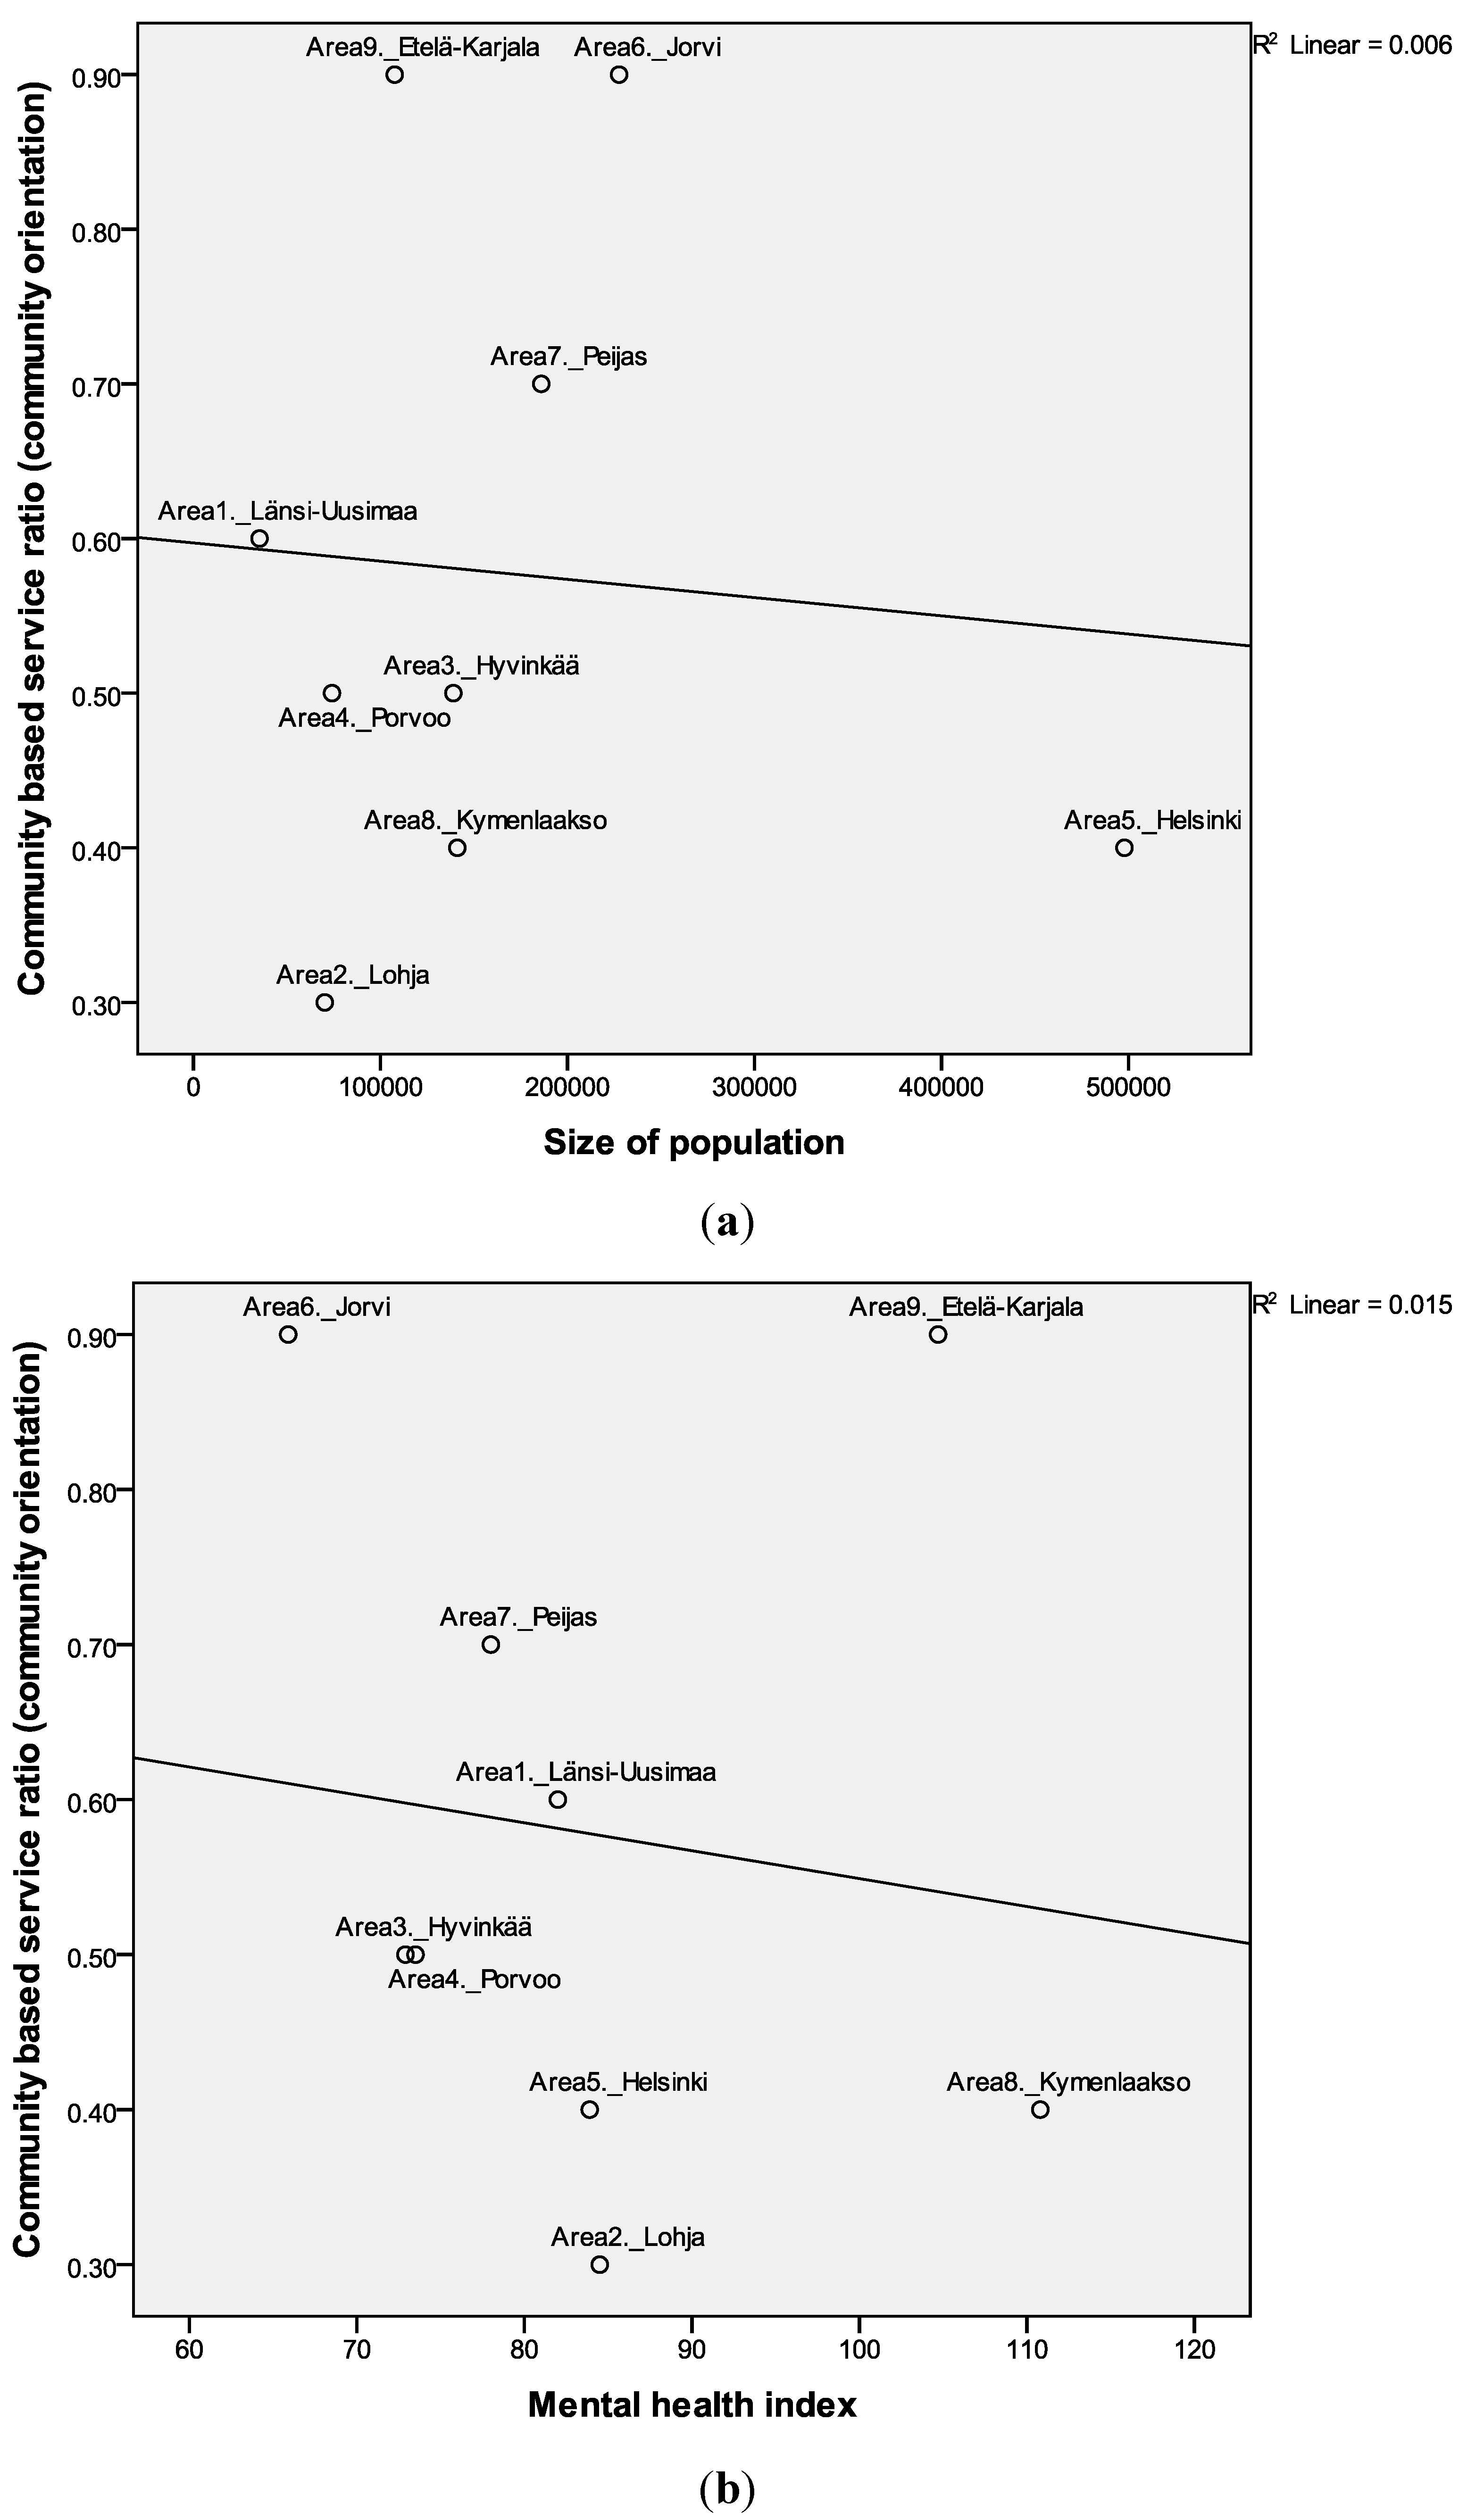
| Community orientation ratio *** | 0.58 | 0.35 | 0.46 | 0.51 | 0.43 | 0.88 | 0.66 | 0.4 | 0.88 | 0.52 | 0.58 | 0.2 | ||||
3.3. Community Orientation
| Variables | 1 | 2 | 3 | 4 | 5 | 6 | 7 | 8 | 9 | 10 | |
|---|---|---|---|---|---|---|---|---|---|---|---|
| 1 | Population (+18years) | 1 | |||||||||
| 2 | Mental Health Index | −0.18 | 1.00 | ||||||||
| 3 | Education | 0.73 * | −0.67 * | 1.00 | |||||||
| 4 | Unemployment | 0.08 | 0.82 ** | −0.56 | 1.00 | ||||||
| 5 | Age of retirement | −0.31 | −0.19 | −0.03 | −0.25 | 1.00 | |||||
| 6 | Single households | 0.20 | 0.73 * | −0.38 | 0.85 ** | 0.12 | 1.00 | ||||
| 7 | Alcohol sold | 0.01 | 0.74 * | −0.44 | 0.77 * | 0.09 | 0.85 ** | 1.00 | |||
| 8 | Different MTC-codes | 0.86 ** | −0.13 | 0.64 | −0.05 | −0.39 | 0.13 | 0.11 | 1.00 | ||
| 9 | Total FTE/1000 inhabitants | −0.50 | 0.35 | −0.57 | 0.13 | 0.01 | 0.13 | 0.36 | −0.11 | 1.00 | |
| 10 | Community-based care FTE/1000 inhabitants | −0.40 | 0.09 | −0.56 | 0.19 | −0.31 | −0.03 | 0.23 | −0.13 | 0.45 | 1.00 |
| 11 | Community orientation (Community/residential service FTE ratio) | 0.13 | −0.40 | 0.14 | −0.06 | −0.10 | −0.16 | −0.08 | 0.06 | −0.49 | 0.50 |
3.4. Resource Allocation


3.5. Associations between Needs of Services and Service Provision
4. Discussion
4.1. Comparison to Previous Studies
4.2. Strengths and Limitations
5. Conclusions and Recommendations
Acknowledgements
Author Contributions
Conflicts of Interest
References
- Lehtinen, V.; Taipale, V.; Wahlbeck, K.; Pirkola, S. Mental Health Work and Psychiatric Care. In Health in Finland; Koskinen, S., Aromaa, A., Huttunen, J., Teperi, J., Eds.; KTL, Stakes: Helsinki, Finland, 2006. [Google Scholar]
- Harjajärvi, M.; Pirkola, S.; Wahlbeck, K. Aikuisten Mielenterveyspalvelut Muutoksessa. In Merttu-Tutkimuksen Palvelukatsaus; Acta No. 187; Kuntaliitto: Helsinki, Finland, 2006. [Google Scholar]
- Pirkola, S.; Sund, R.; Sailas, E.; Wahlbeck, K. Community mental-health services and suicide rate in Finland: A nationwide small-area analysis. Lancet 2009, 373, 147–153. [Google Scholar] [CrossRef]
- Rocha, K.B.; Rodriguez-Sanz, M.; Perez, K.; Obiols, J.E.; Borrell, C. Inequalities in the utilization of psychiatry and psychological services in Catalonia: A multilevel approach. Adm. Policy Ment. Health 2013, 40, 255–363. [Google Scholar] [CrossRef]
- Ministry of the Social Affairs and Health. Plan for Mental Health and Substance Abuse Work. Proposals of the Mieli 2009 Working Group to Develop Mental Health and Substance Abuse Work until 2015; Ministry of the Social Affairs and Health: Helsinki, Finland, 2009; pp. 11–13. [Google Scholar]
- Social Welfare and Health Care Reform. Available online: http://www.stm.fi/en/ministry/strategies/service_structures (accessed on 6 November 2013).
- Pirkola, S.; Sohlman, B.; Heilä, H.; Wahlbeck, K. Reduction in postdischarge suicide after deinstitutionalization and decentralization: A nationwide register study in Finland. Psychiatr. Serv. 2007, 58, 221–226. [Google Scholar] [CrossRef]
- Westman, J.; Gissler, M.; Wahlbeck, K. Successful deinstitutionalization of mental health care; Increase life expectancy among people with mental disorders in Finland. Eur. J. Public Health 2012, 22, 604–606. [Google Scholar] [CrossRef]
- Westman, J.; Gissler, M.; Laursen, T.M. Outcomes of Nordic mental health systems: Life expectancy of patients with mental disorders. Br. J. Psychiatr. 2011, 199, 453–458. [Google Scholar] [CrossRef]
- Wahlbeck, K. European comparisons between mental health services. Epidemiol. Psychiatr. Sci. 2011, 20, 15–18. [Google Scholar] [CrossRef]
- Kontio, R.; Malin, M.; Joffe, G.; Vastamäki, M.; Wahlbeck, K. HUS-alueen mielenterveys ja päihdepalvelut liian laitoskeskeisiä. Suomen Lääkärilehti 2013, 7, 496–501. (In Finnish) [Google Scholar]
- Thornicroft, G.; Tansella, M. The balanced care model: The care for both hospital- and community-based mental healthcare. Br. J. Psychiatr. 2013, 202, 246–248. [Google Scholar] [CrossRef]
- Thornicroft, G.; Tansella, M.; Law, A. Steps, challenges and lessons in developing community mental health care. World Psychiatr. 2008, 7, 87–92. [Google Scholar]
- Thornicroft, G.; Tansella, M. Components of a modern mental health service: A pragmatic balance of community and hospital care. Overview of systematic evidence. Br. J. Psychiatr. 2004, 185, 283–290. [Google Scholar] [CrossRef]
- Jacob, K.S.; Sharan, P.; Mirza, I.; Garrido-Cumbrera, M.; Seedat, S.; Mari, J.J.; Saxena, S. Mental health systems in countries: Where are we now? Lancet 2007, 370, 1061–1077. [Google Scholar] [CrossRef]
- Saxena, S.; Lora, A.; van Ommeren, M.; Barrett, T.; Morris, J.; Saraceno, B. WHO’s Assessment Instrument for Mental Health Systems: Collecting essential information for policy and service delivery. Psychiatr. Serv. 2007, 58, 816–821. [Google Scholar] [CrossRef]
- Rezvyy, G.; Oiesvold, T.; Parniakov, A.; Ponomarev, O.; Lazurko, O.; Olstad, R. The Barents project in psychiatry: A systematic comparative mental health services study between Northern Norway and Archangelsk County. Soc. Psychiatr. Psychiatr. Epidemiol. 2007, 42, 131–139. [Google Scholar] [CrossRef]
- Johnson, S.; Kuhlmann, R.; EPCAT Group; European Psychiatric Assessment Team. The European Service Mapping Schedule (ESMS): Development of an instrument for the description and classification of mental health services. Acta Psychiatr. Scand. 2000, 102, 14–23. [Google Scholar]
- Salvador-Carulla, L.; Romero, C.; Martinez, A.; Haro, J.M.; Bustillo, G.; Ferreira, A.; Gaite, L.; Johnson, S.; PSICOST Group. Assessment instruments; standardization of the European Service Mapping Schedule (ESMS) in Spain. Acta Psychiatr. Scand. 2000, 102, 24–32. [Google Scholar]
- Salvador-Carulla, L.; Saldivia, S.; Martinez-Leal, R.; Vicente, B.; Garcia-Alonso, C.; Grandon, P.; Haro, J.M. Meso-level comparison of mental health service availability and use in Chile and Spain. Psychiatr. Serv. 2008, 59, 421–428. [Google Scholar] [CrossRef]
- REFINEMENT Consortium. Research on Financing Systems’ Effect on the Quality of Mental Health Care (Project Ref. No. 261459) 2013. Available online: http://www.refinementproject.eu/ (accessed on 30 November 2013).
- The Refinement Project Group. REFINEMENT Work Package 9: Building Optimal Models of Mental Health Care Financing. 2013. Available online: http://www.refinementproject.eu/ (accessed on 22 November 2013).
- Salvador-Carulla, L.; Ruiz, M.; Romero, C.; Poole, M.; DESDE-LTC 2.0 Group. ESMS-R European Service Mapping Schedule-Revised; Terveyden ja Hyvinvoinnin Laitos (THL): Helsinki, Finland, 2012. (In Finnish) [Google Scholar]
- Salvador-Carulla, L.; Tibaldi, G.; Johnson, S.; Scala, E.; Romero, C.; Munizza, C. (for the CSRP/RIRAG Groups). Patterns of mental health Service utilization in Italy and Spain. An investigation using the European Service Mapping Schedule. Soc. Psychiatr. Psychiatr. Epidemiol. 2005, 40, 149–159. [Google Scholar] [CrossRef]
- Salvador-Carulla, L.; Poole, M.; Bendect, M.; Romero, C.; Salinas, J.A.; The eDESDE-LTC Group. Coding long-term care services: eDESDE-LTC. Int. J. Integr. Care 2009, 9, e63:1–e63:1. [Google Scholar]
- Salvador-Carulla, L.; Alvarez-Galvez, J.; Romero, C.; Gutierrez-Colosia, M.R.; Weber, G.; McDaid, D.; Dimitrov, H.; Sprah, L.; Kalseth, B.; Tibaldi, G.; et al. Evaluation of an integrated system for classification, assessment and comparison of services for long-term care in Europe: The eDESDE-LTC study. BMC Health Serv. Res. 2013, 13, 13. [Google Scholar] [CrossRef]
- Mental Health Index, not Age-Standardised (ID: 254). Available online: http://uusi.sotkanet.fi/portal/page/portal/etusivu/hakusivu/metadata?type=I&indicator=254 (accessed on 28 July 2014).
- SOTKAnet Statistics and Indicator Bank. Available online: www.sotkanet.fi (accessed on 30 July 2014).
- Tibaldi, G.; Munizza, C.; Pasian, S.; Johnson, S.; Salvador-Carulla, L.; Zucchi, S.; Cesano, S.; Testa, C.; Scala, E.; Pinciaroli, L. Indicators predicting use of mental health services in Piedmont, Italy. J. Mental Health Policy Econ. 2005, 8, 95–106. [Google Scholar]
- Becker, T.; Kilian, R. Psychiatric services for people with severe mental illness across Western Europe: What can be generalized from current knowledge about differences in provision, costs and outcomes of mental health care? Acta Psychiatr. Scand. Suppl. 2006, 429, 9–16. [Google Scholar] [CrossRef]
- Wilkinson, J.; Bywaters, J.; Simms, S.; Chappel, D.; Glover, G. Developing mental health indicators in England. Public Health 2008, 122, 897–905. [Google Scholar] [CrossRef]
- Kutash, K.; Greenbaum, P.E.; Wang, W.; Boothroyd, R.A.; Friedman, R.M. Levels on system of care implementation. J. Behav. Health Serv. Res. 2011, 38, 342–357. [Google Scholar] [CrossRef]
- Wang, W.; Saldana, L.; Brown, H.; Chamberlain, P. Factors that influenced county systems leaders to implement an evidence-based program: A baseline survey within randomized controlled trail. Implement. Sci. 2010, 5, 72. [Google Scholar] [CrossRef]
- Porter, M.E.; Lee, T.H. The strategy that will fix health care. Harv. Bus. Rev. 2013, 2–19. [Google Scholar]
- Fleury, M.J. Quebec mental health services networks: Models and implementation. Int. J. Integr. Care 2005, 13, e07. Available online: www.ncbi.nlm.nih.gov/pmc/articles/PMC1395508/pdf/ijic2005-200507.pdf (accessed on 12 January 2014). [Google Scholar]
© 2014 by the authors; licensee MDPI, Basel, Switzerland. This article is an open access article distributed under the terms and conditions of the Creative Commons Attribution license (http://creativecommons.org/licenses/by/3.0/).
Share and Cite
Ala-Nikkola, T.; Pirkola, S.; Kontio, R.; Joffe, G.; Pankakoski, M.; Malin, M.; Sadeniemi, M.; Kaila, M.; Wahlbeck, K. Size Matters — Determinants of Modern, Community-Oriented Mental Health Services. Int. J. Environ. Res. Public Health 2014, 11, 8456-8474. https://doi.org/10.3390/ijerph110808456
Ala-Nikkola T, Pirkola S, Kontio R, Joffe G, Pankakoski M, Malin M, Sadeniemi M, Kaila M, Wahlbeck K. Size Matters — Determinants of Modern, Community-Oriented Mental Health Services. International Journal of Environmental Research and Public Health. 2014; 11(8):8456-8474. https://doi.org/10.3390/ijerph110808456
Chicago/Turabian StyleAla-Nikkola, Taina, Sami Pirkola, Raija Kontio, Grigori Joffe, Maiju Pankakoski, Maili Malin, Minna Sadeniemi, Minna Kaila, and Kristian Wahlbeck. 2014. "Size Matters — Determinants of Modern, Community-Oriented Mental Health Services" International Journal of Environmental Research and Public Health 11, no. 8: 8456-8474. https://doi.org/10.3390/ijerph110808456