A Synthetic Method for Atmospheric Diffusion Simulation and Environmental Impact Assessment of Accidental Pollution in the Chemical Industry in a WEBGIS Context

Abstract
:1. Introduction
2. Numerical Simulation of the Accidental Air Pollution in the Chemical Industry
2.1. Leakage

| Parameter | Value | Parameter | Value |
|---|---|---|---|
| Leakage Type (%idspl) | 1 | Height of source (%hs) | 0 |
| Molecular weight of source air (%wms) | 0.0709 | Concentration of average time (%tav) | 30 |
| Heat capacity in the fixed pressure (%cps) | 499.1 | Largest distance calculation (%xffm) | 20000 |
| Boiling point temperature (%tbp) | 239.1 | Height of the concentration calculated (%zp) | 1/0/0/0 |
| Evaporation heat consumption (%dhe) | 287840 | Initial water content (%cmed0) | 0.88 |
| Liquid heat capacity (%cpsl) | 926.3 | Source temperature (%ts) | 239.1 |
| Liquid density of source gas (%rhosl) | 1574 | Release intensity of source (%qs) | 10 |
| Saturated vapor pressure parameter (%spb) | 1978.34 | Source area (%as) | 0.02 |
| Unsaturated vapor pressure parameter (%spc) | -27.01 | Release duration (%tsd) | 1200 |
| Environmental height — stations (%za) | 10 | Relative position x of source (%xx) | 326.7 |
| Environment temperature (%ta) | 293.16 | Relative position y of source (%yy) | 758.1 |
| Relative humidity (%rh) | 70 | Surface roughness (%z0) | S |
| Stability(%stab) | 4 | ||
| Wind direction (%wd) | 90 | ||
| Environmental wind speed (%ua) | 4 |
2.2. Conflagration

| Name | Chemical Formula | ΔH (kJ/mol) | Name | Chemical Formula | ΔH (kJ/mol) |
|---|---|---|---|---|---|
| Hydrogen | H2(g) | −285.8 | Ethane | C2H6(g) | −1559.8 |
| Carbon monoxide | CO(g) | −283.0 | Ethylene | C2H4(g) | −1411.0 |
| Methane | CH4(g) | −890.31 | Acetylene | C2H2(g) | −1299.6 |
| Methanol | CH3OH(l) | −726.51 | Ethanol | C2H5OH(l) | −1366.8 |
| Benzene | C6H6(l) | −3267.5 | Propane | C3H8(g) | −2219.9 |
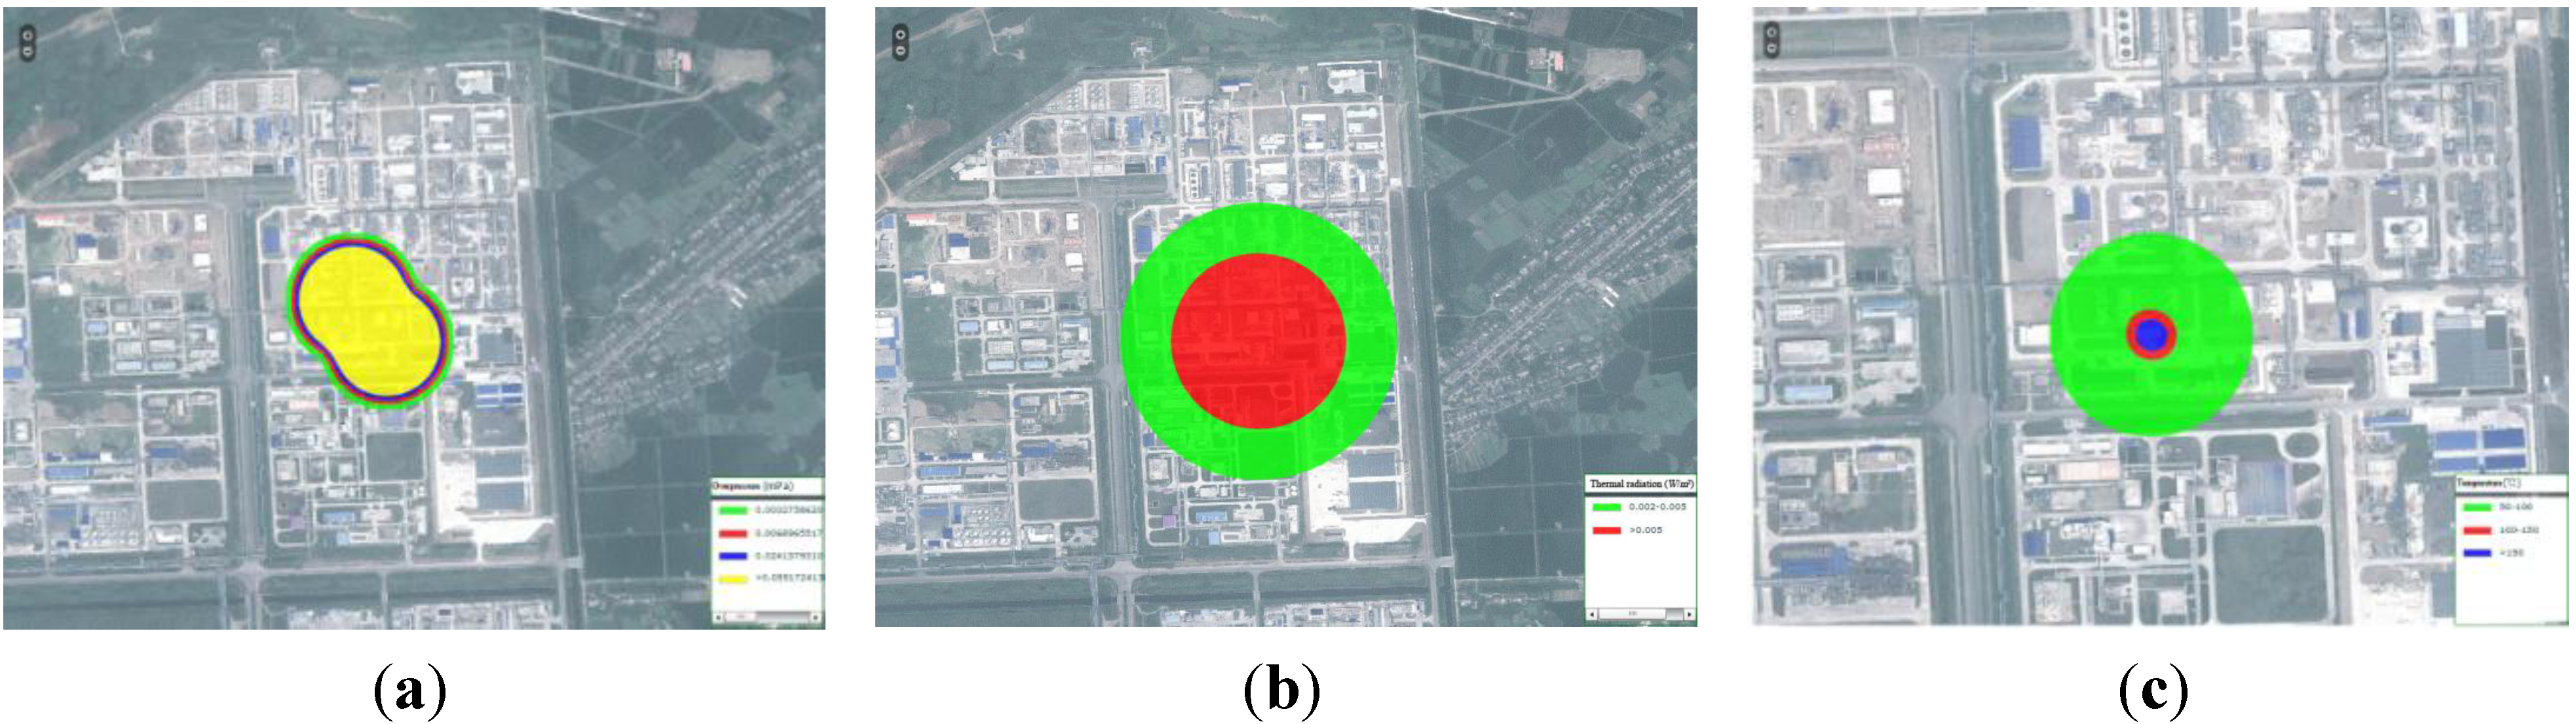
2.3. Explosions


| Distance/m | Overpressure/MPa | Distance/m | Overpressure/MPa | Distance /m | Overpressure/MPa |
|---|---|---|---|---|---|
| 5 | 2.94 | 16 | 0.235 | 50 | 0.0235 |
| 6 | 2.06 | 18 | 0.170 | 55 | 0.0205 |
| 7 | 1.67 | 20 | 0.126 | 60 | 0.0180 |
| 8 | 1.27 | 25 | 0.079 | 65 | 0.0160 |
| 9 | 0.95 | 30 | 0.057 | 70 | 0.0143 |
| 10 | 0.76 | 35 | 0.043 | 75 | 0.0130 |
| 12 | 0.50 | 40 | 0.033 | ||
| 14 | 0.33 | 45 | 0.027 |
| Serial Number | Overpressure/MPa | Damage to the Buildings | Damage to the Human Health |
|---|---|---|---|
| 1 | 0.000–0.005 | / | / |
| 2 | 0.005–0.006 | Partly broken doors and windows | / |
| 3 | 0.006–0.015 | Majority broken of doors and windows broken | / |
| 4 | 0.015–0.020 | Complete damage to doors and windows | / |
| 5 | 0.020–0.030 | Wall cracks | Slight injury |
| 6 | 0.040–0.050 | Serious wall cracks, roofing tile damage | Auditory organs injury or fracture |
| 7 | 0.060 and above | Wood beams broken,room frames loose | Visceral serious injury or death |


2.4. Environmental Impact Assessment
| Substance | AEGLs 0/ppm | AEGLs 1/ppm | AEGLs 2/ppm | AEGLs 3/ppm |
|---|---|---|---|---|
| CS2 | 2 | 17 | 200 | 600 |
| NH3 | 3 | 30 | 220 | 2700 |
| MSH | 0.5 | 5 | 59 | 120 |
| H2S | 0.07 | 0.75 | 41 | 76 |
| HCN | 0.25 | 2.5 | 17 | 27 |
| CH3OH | 60 | 670 | 11,000 | 40,000 |
| SO2 | 0.02 | 0.2 | 0.75 | 30 |
| CH2CHCOOH | 0.15 | 1.5 | 68 | 480 |
| CH2O | 0.09 | 0.9 | 14 | 100 |
| C2H3CHO | 0.003 | 0.03 | 0.44 | 6.2 |
3. The Organization Mechanisms of Model-Sets and Presentation of Simulation Results
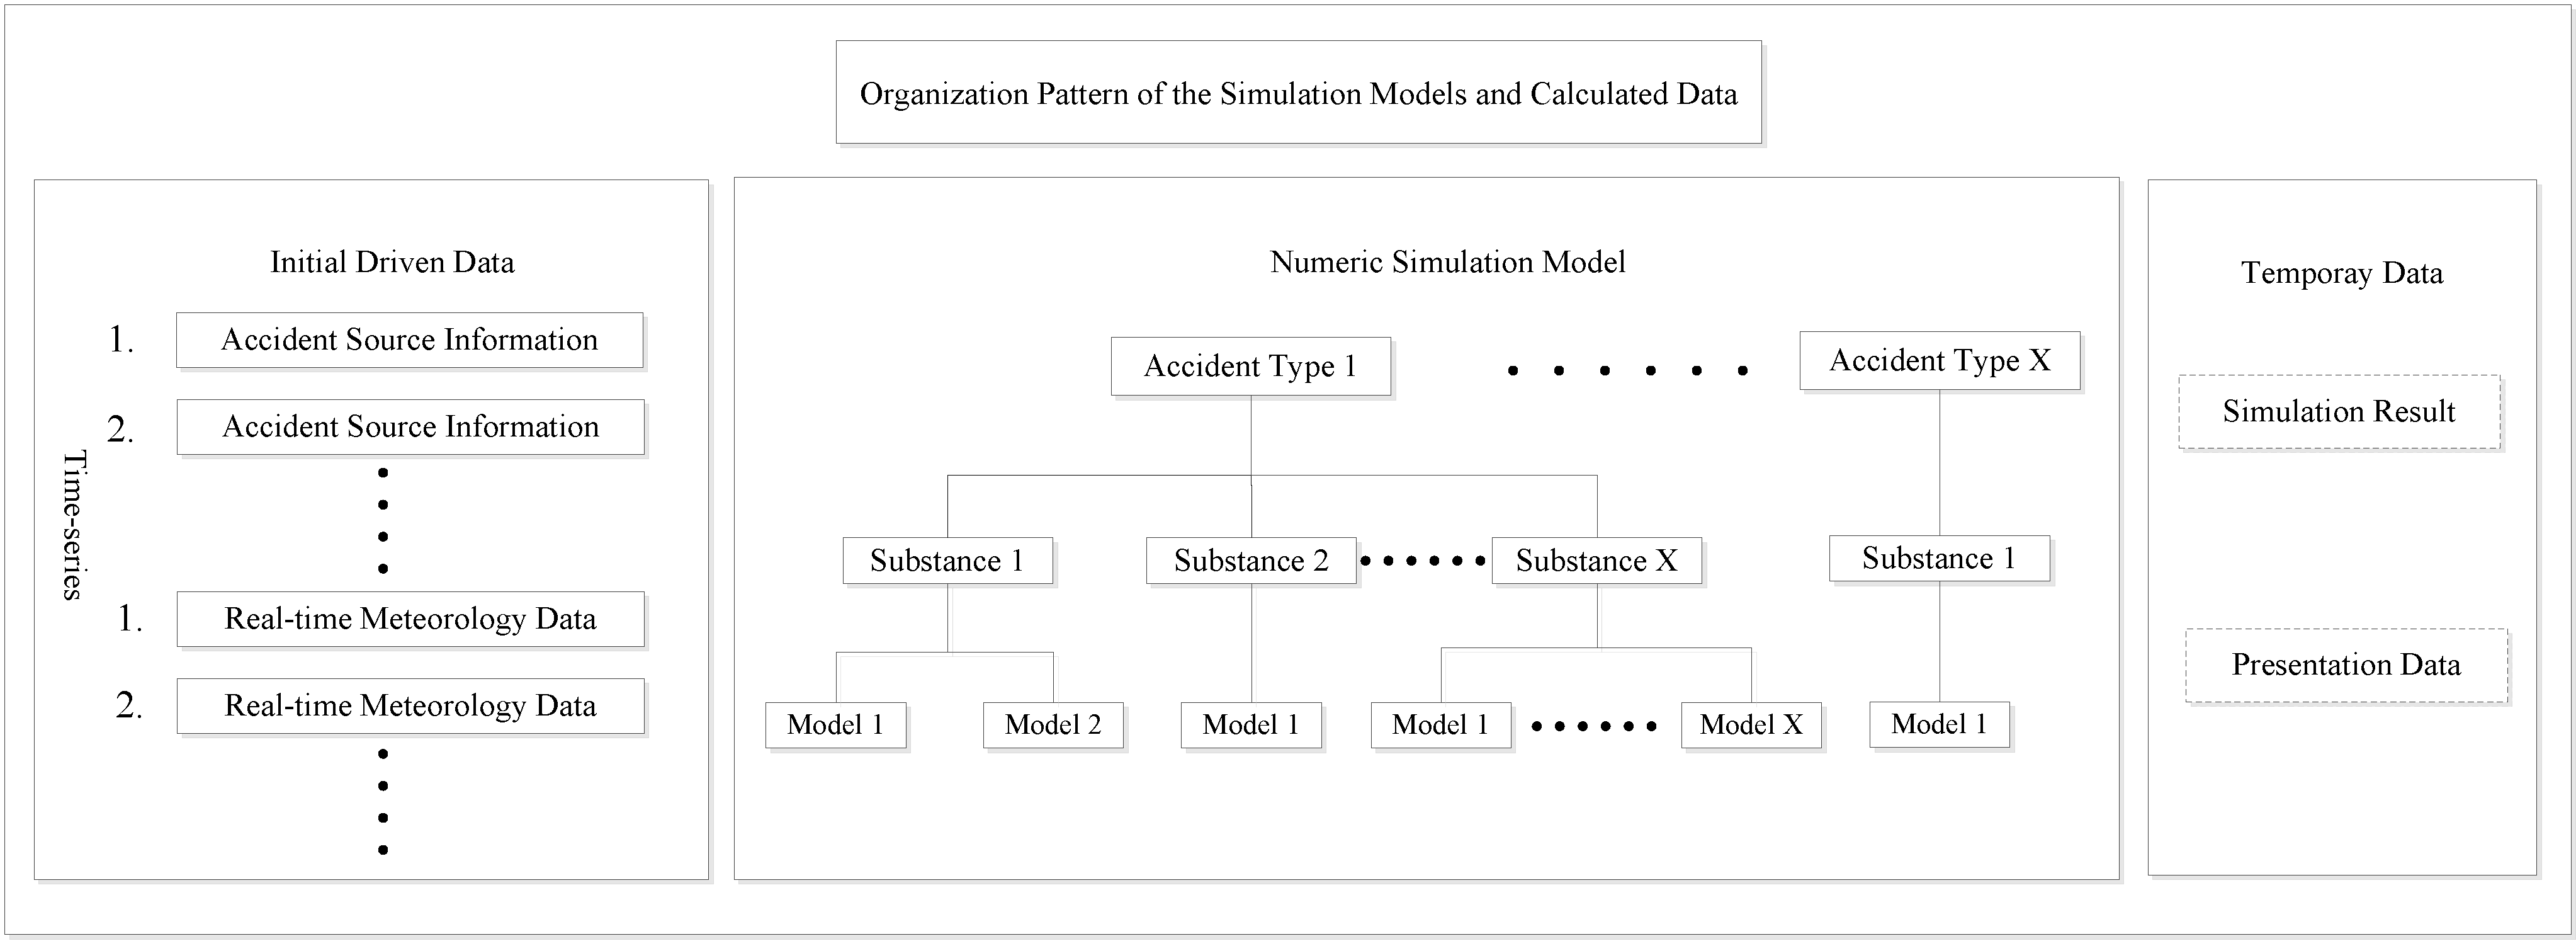
3.1. Organization Pattern of the Simulation Models and Calculated Data

3.2. Scheduling Scheme of the Model-Set and Data Flow
3.2.1. Pollution Source Analysis
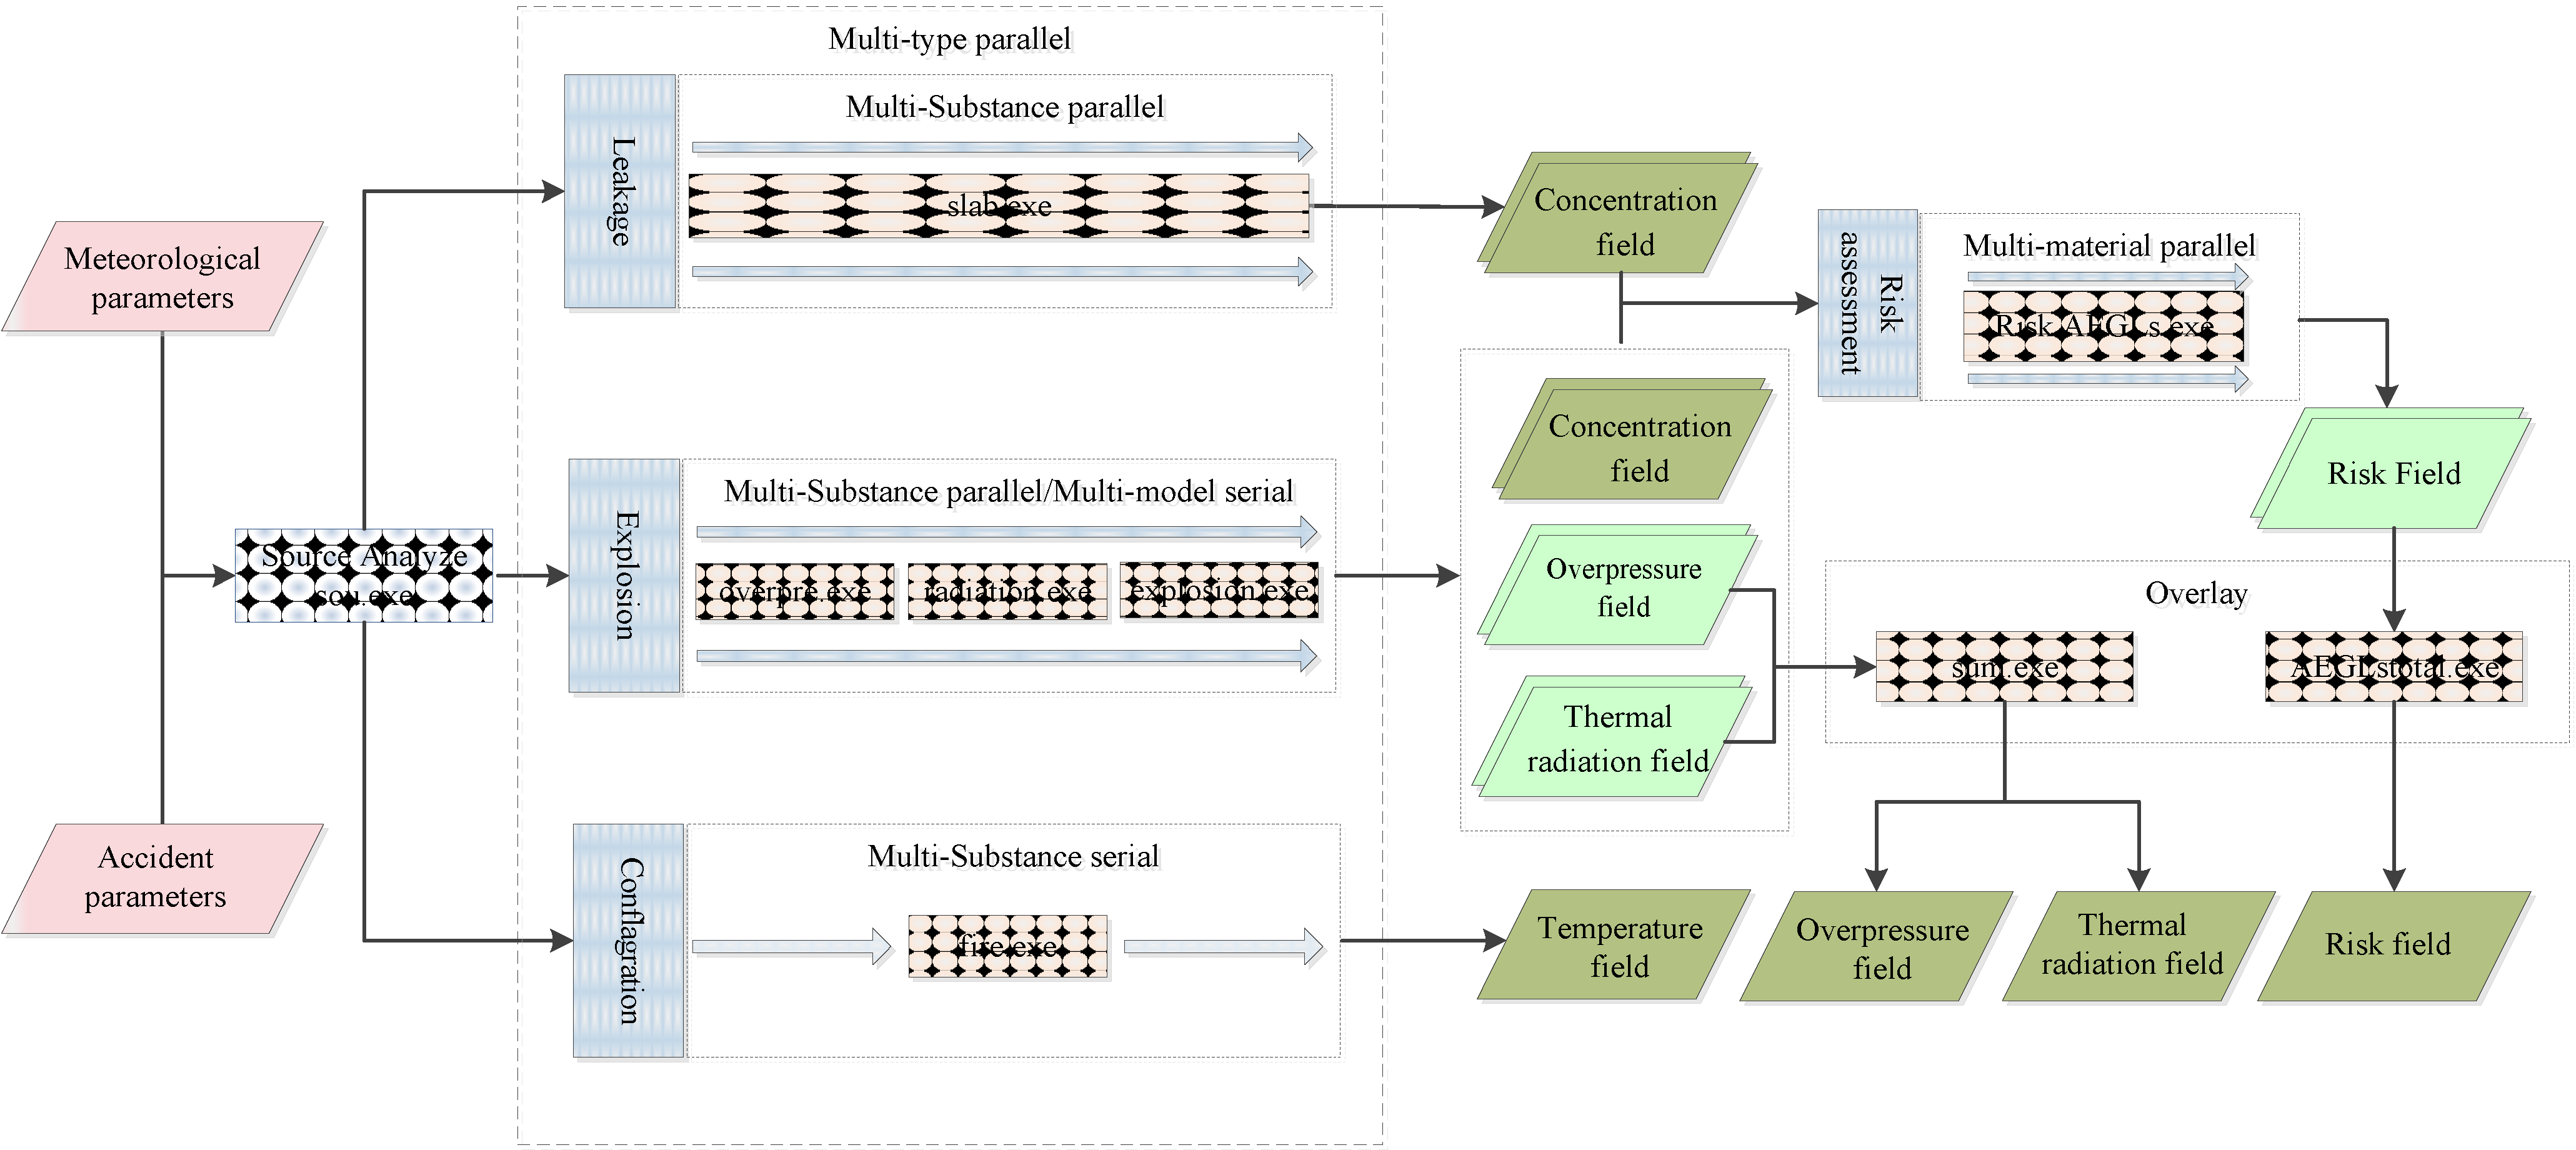
3.2.2. Environmental Impact Simulation
3.2.3. Processing of Simulation Results
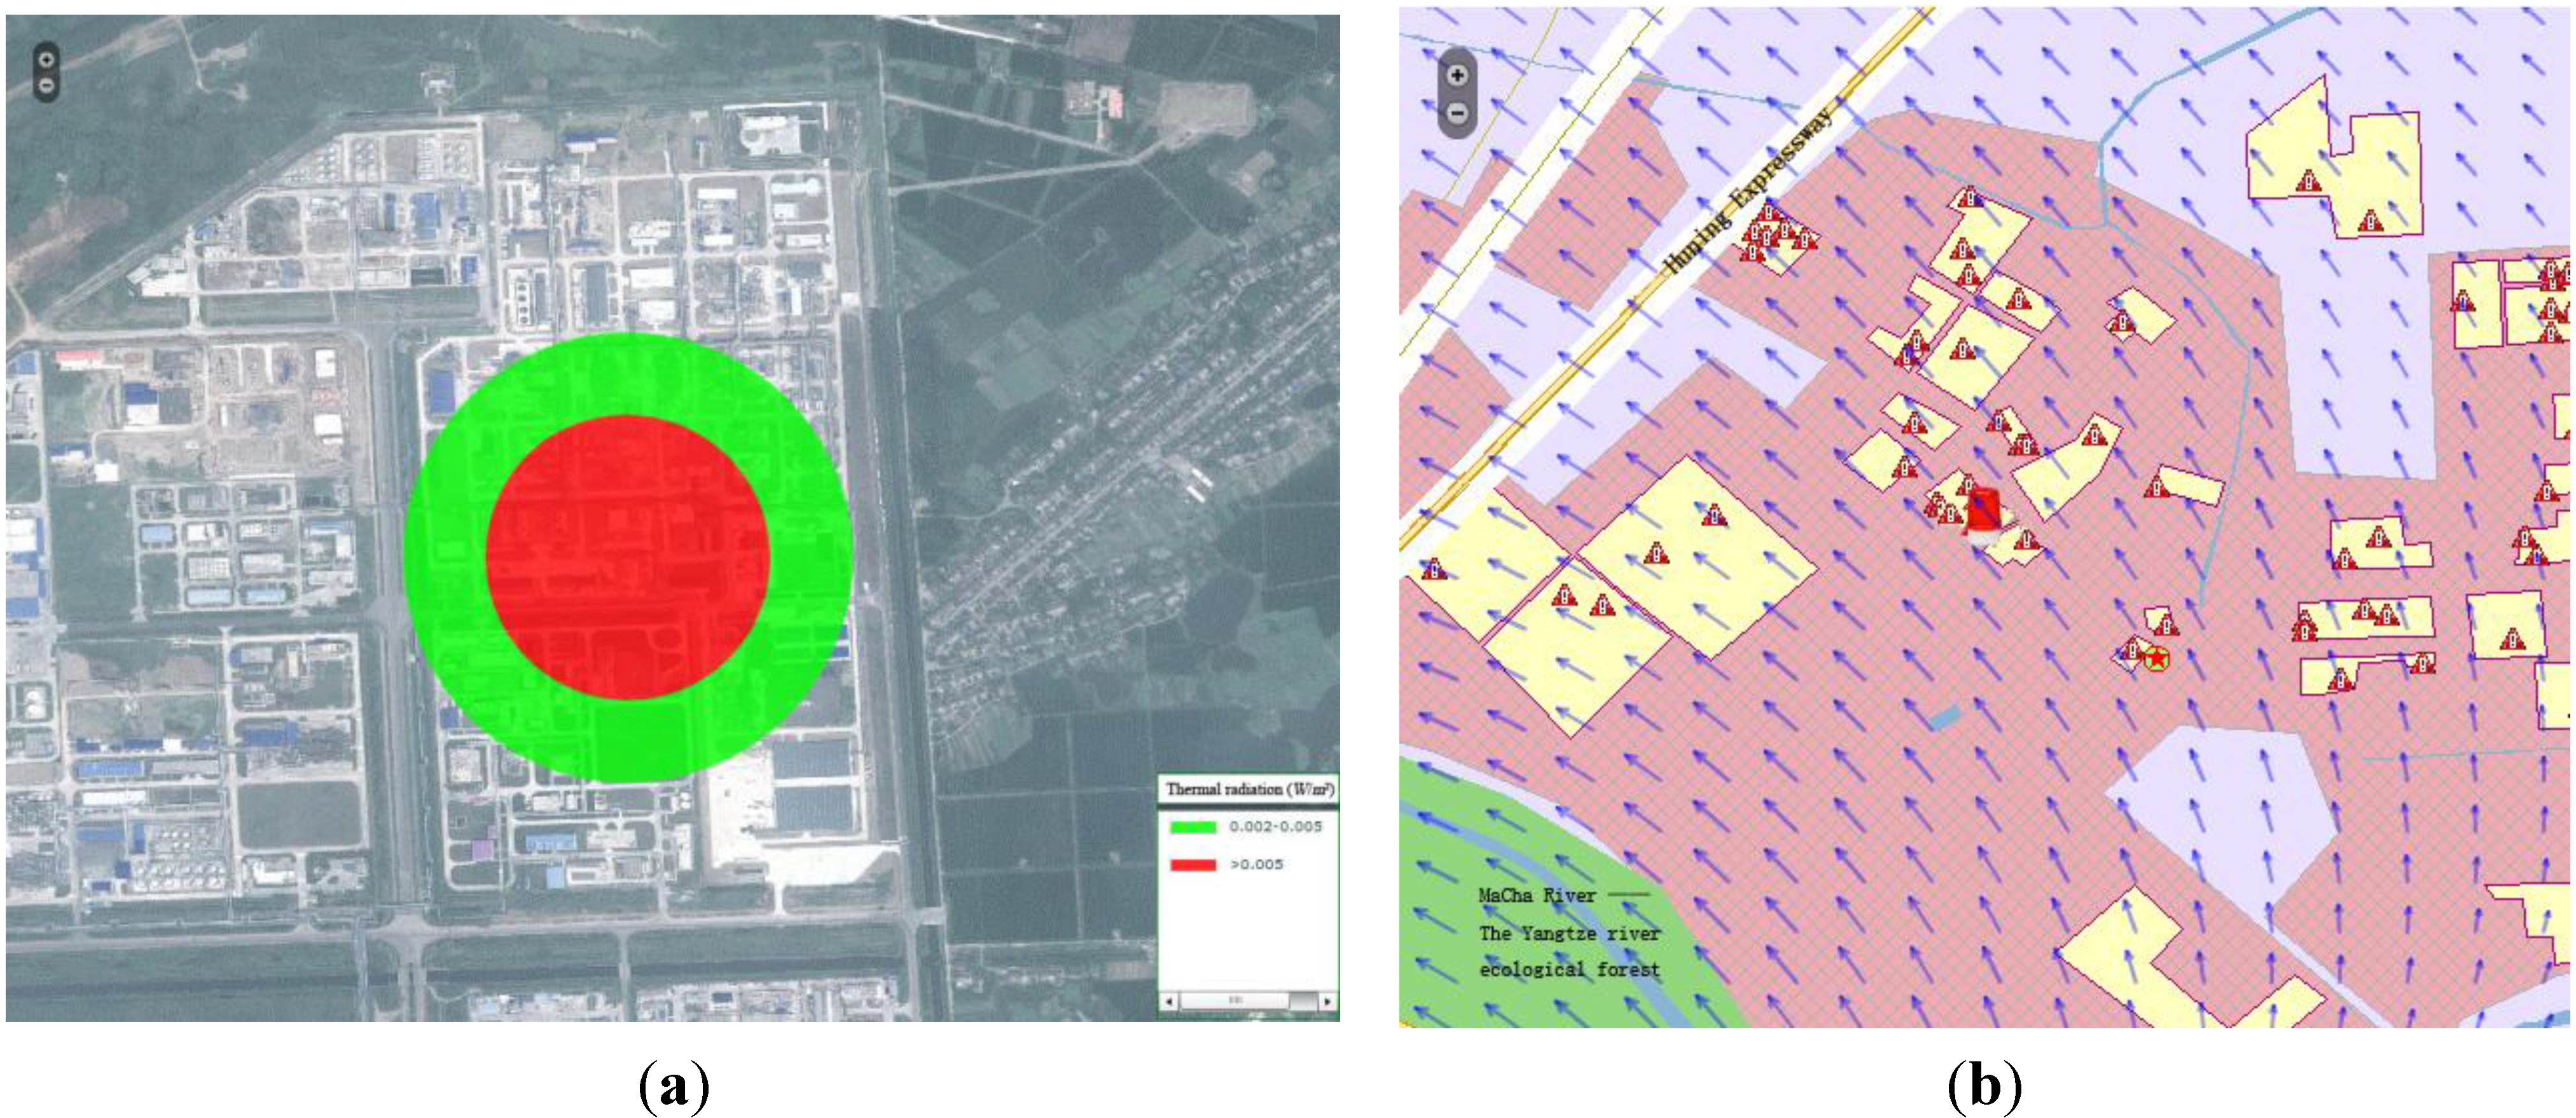
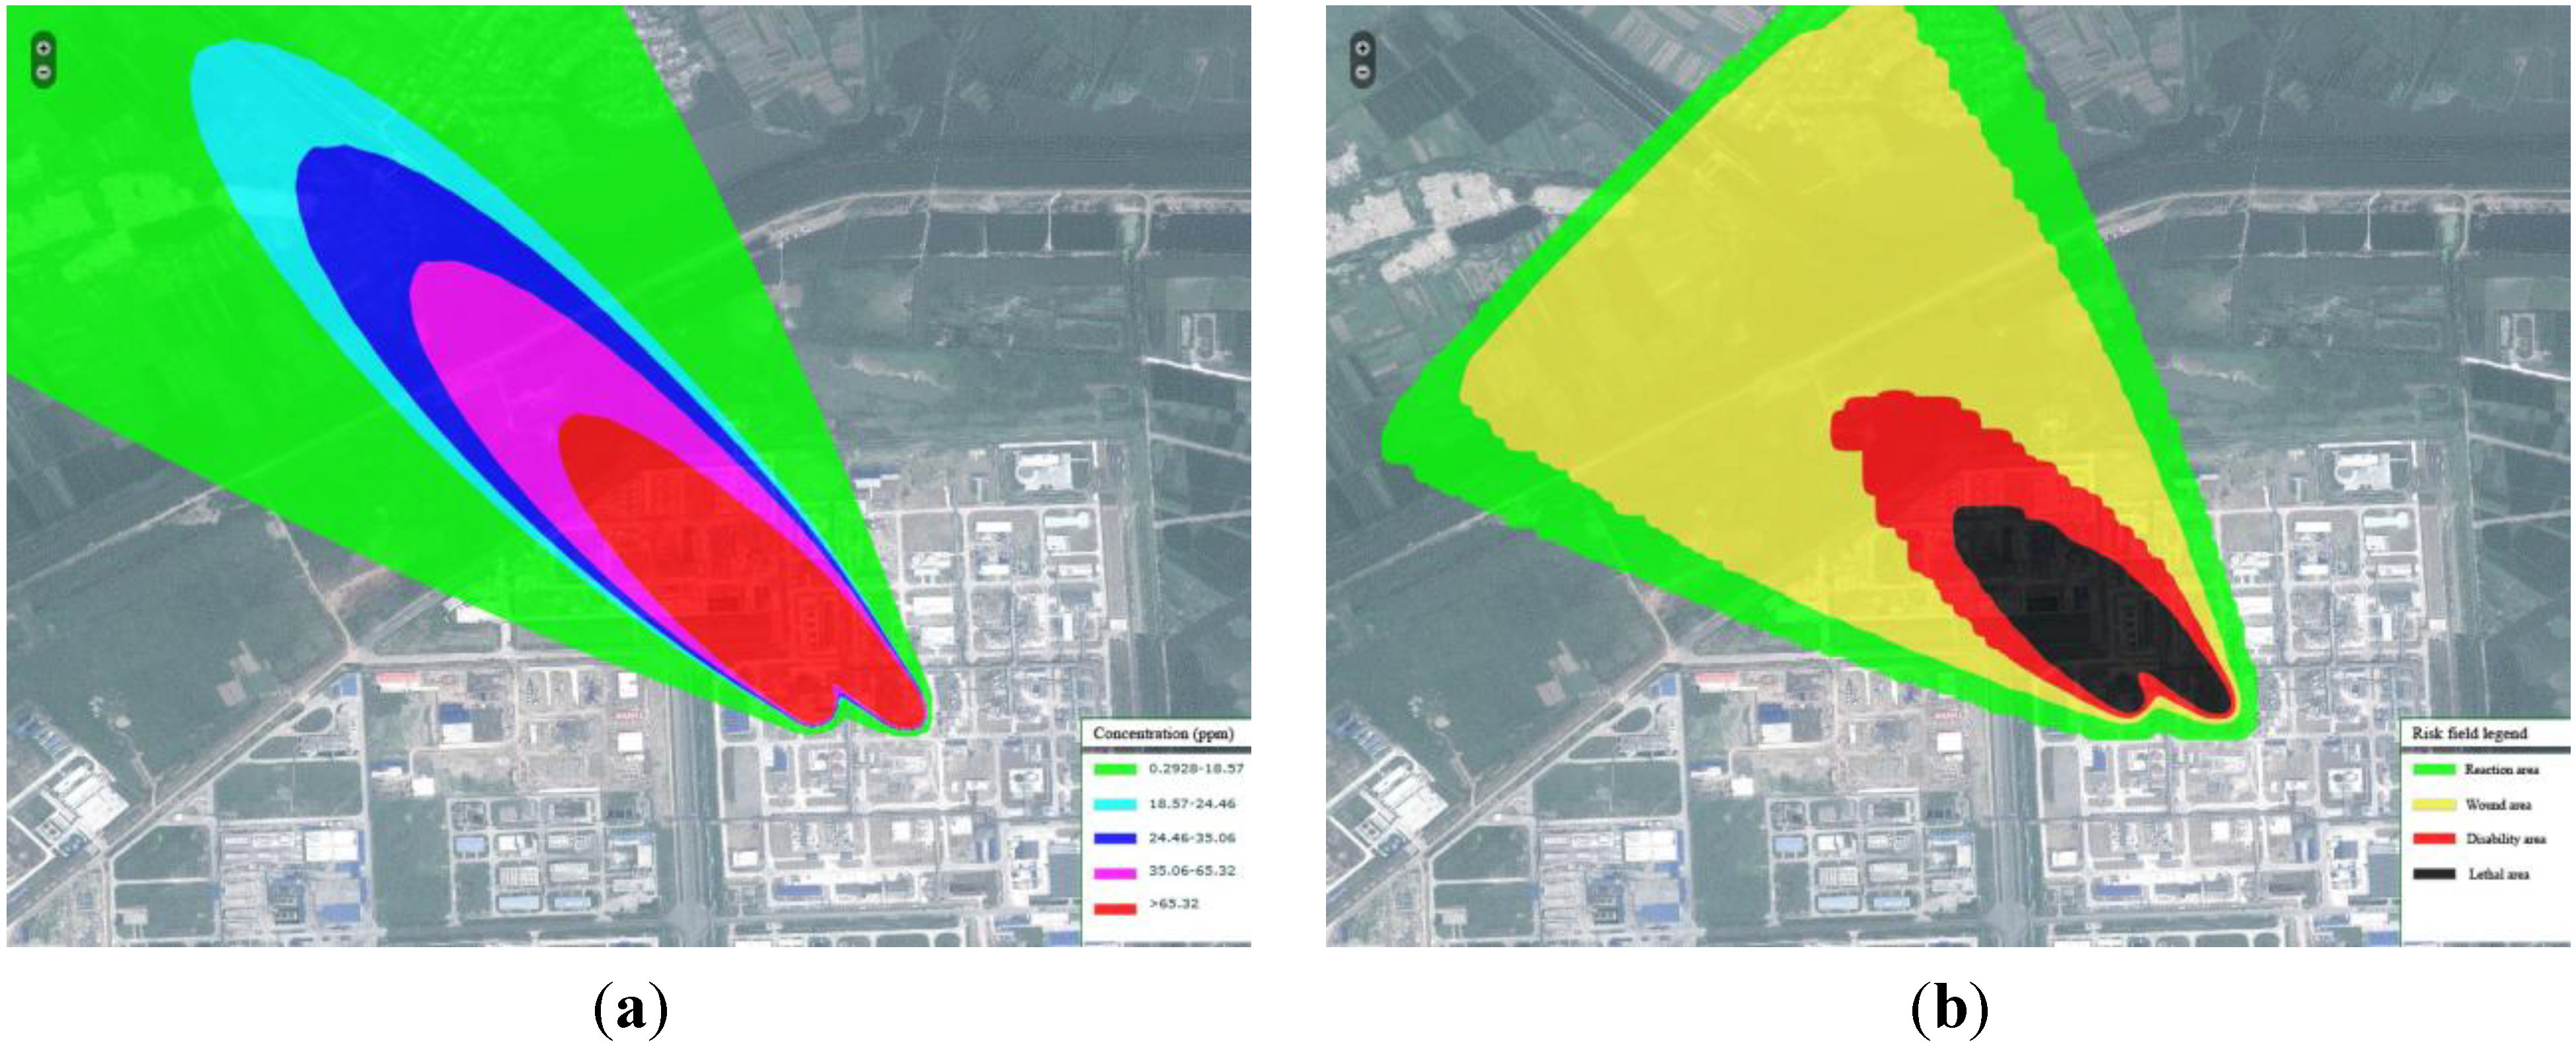
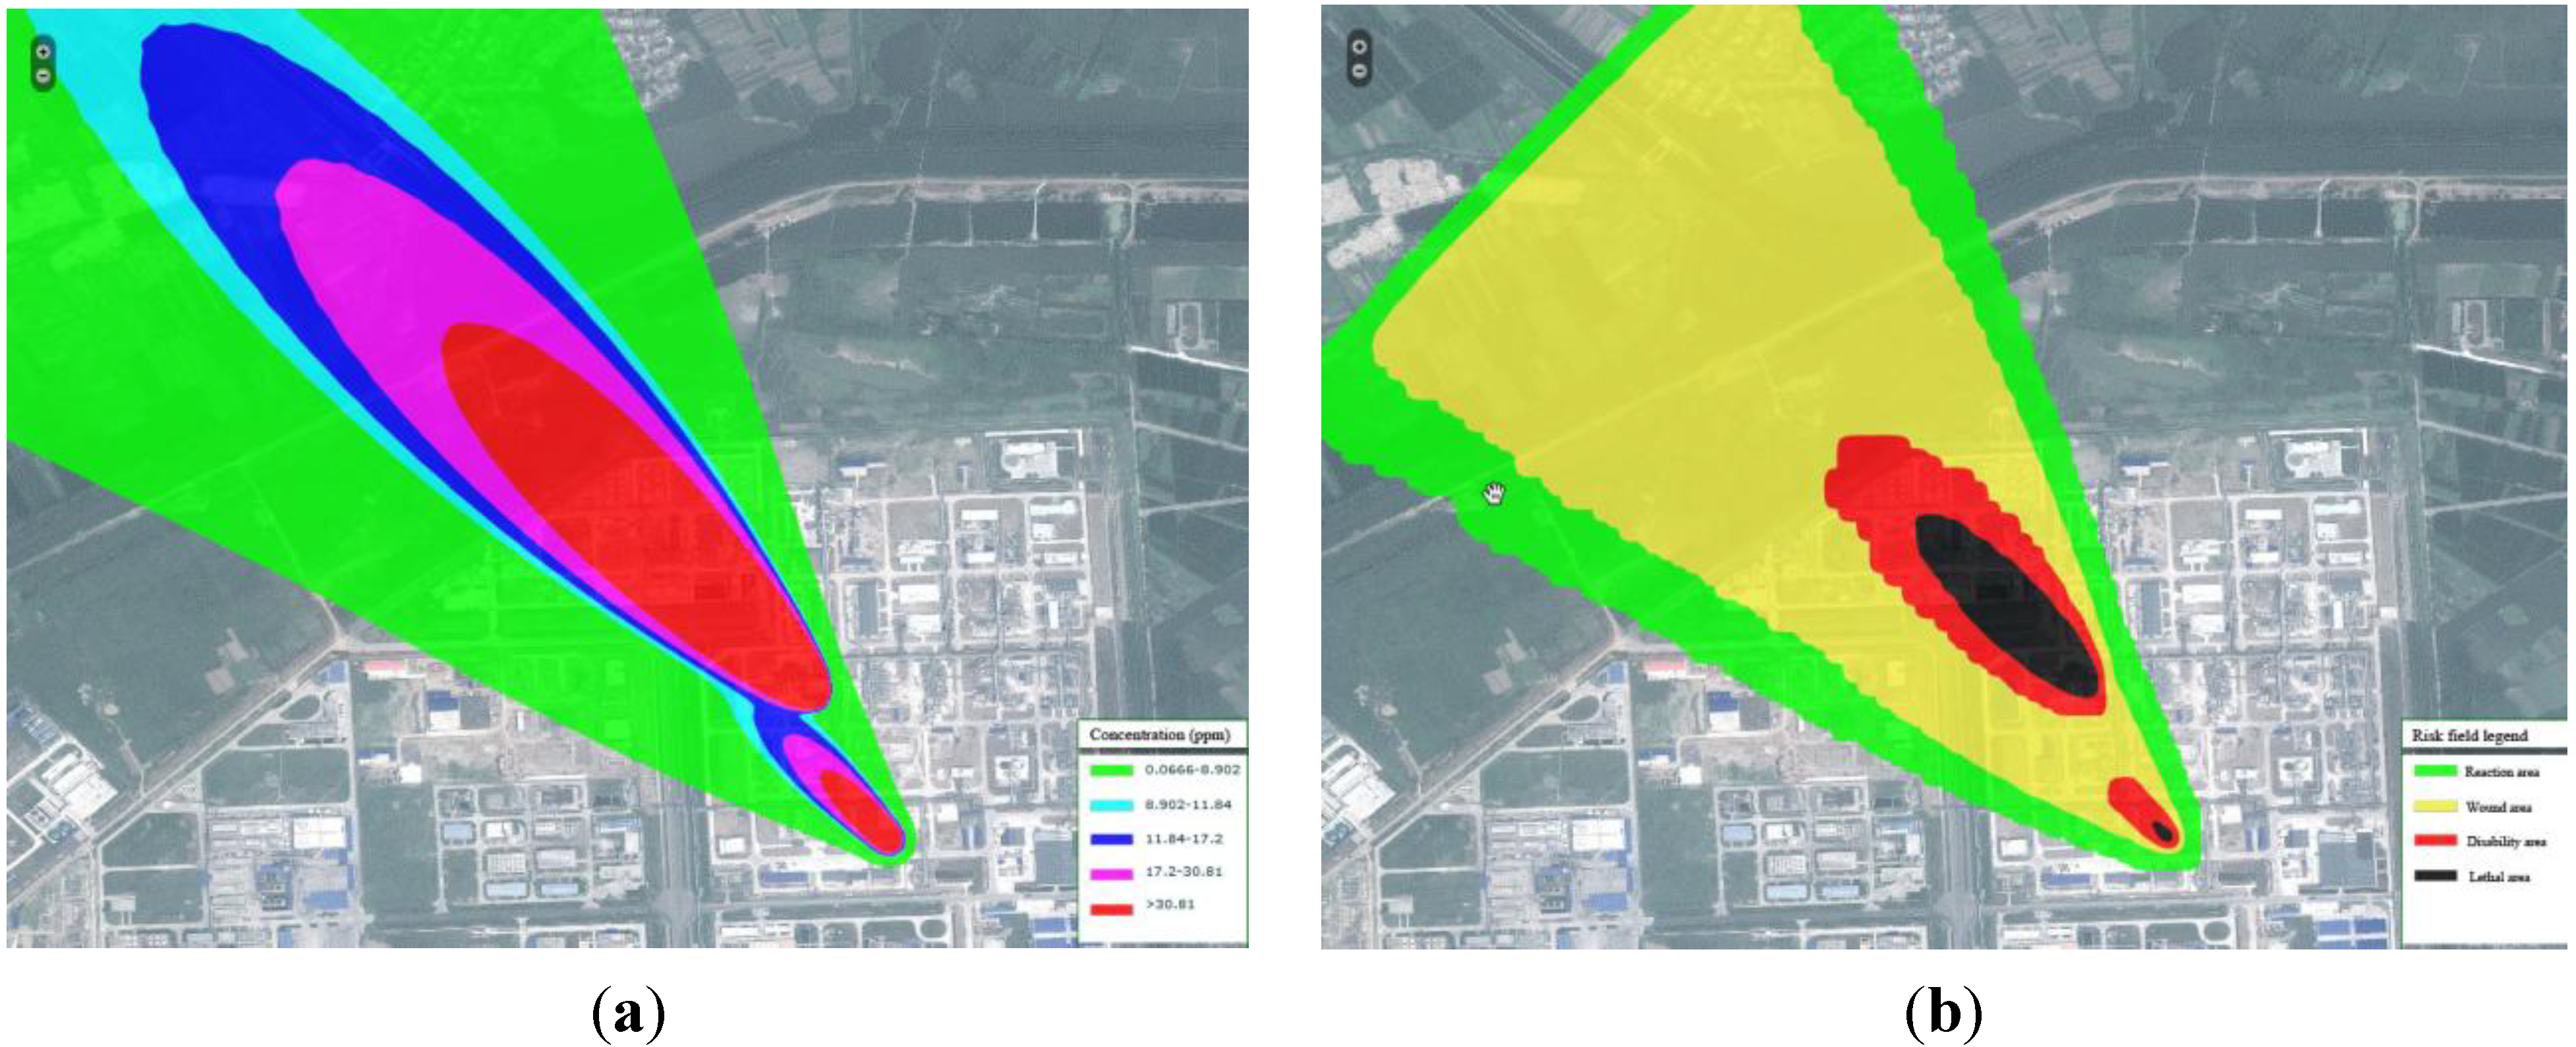
3.3. Representation Mode of Different Numerical Simulation Results


4. Application and Discussion


5. Conclusions
Acknowledgments
Author Contributions
Conflicts of Interest
References
- Elliott, M.R.; Wang, Y.; Lowe, R.A.; Kleindorfer, P.R. Environmental justice: Frequency and severity of U.S. chemical industry accidents and the socioeconomic status of surrounding communities. J. Epidemiol. Community Health 2004, 58, 24–30. [Google Scholar]
- Kleindorfer, P.R.; Belke, J.C.; Elliott, M.R.; Lee, K.; Lowe, R.A.; Feldman, H.I. Accident epidemiology and the U.S. chemical industry: Accident history and worst-case data from RMP*Info. Risk Anal. 2003, 23, 865–881. [Google Scholar]
- Duan, W.L.; Chen, G.H.; Ye, Q.; Chen, Q.G. The situation of hazardous chemical accidents in China between 2000 and 2006. J. Hazard. Mater. 2011, 186, 1489–1494. [Google Scholar] [CrossRef]
- Lin, C.P.; Chang, H.K.; Chang, Y.M.; Chen, S.W.; Shu, C.M. Emergency response study for chemical releases in the high-tech industry in Taiwan—A semiconductor plant example. Process. Saf. Environ. Prot. 2009, 87, 353–360. [Google Scholar] [CrossRef]
- Rogers, G.O. The timing of emergency decisions—Modeling decisions by community officials during chemical accidents. J. Hazard. Mater. 1994, 37, 353–373. [Google Scholar] [CrossRef]
- Graber, W.K.; Gassmann, F. Real time modelling as an emergency decision support system for accidental release of air pollutants. Math. Comput. Simulat. 2000, 52, 413–426. [Google Scholar] [CrossRef]
- Blewitt, D.N.; Yohn, J.F.; Ermak, D.L. An Evaluation of SLAB and DEGADIS Heavy Gas Dispersion Models Using the HF Spill Test Data. In Proceedings of the AIChE International Conference on Vapor Cloud Modeling, Cambridge, MA, USA, 2–4 November 1987; pp. 2–4.
- Bruckner, J.V.; Keys, D.A.; Fisher, J.W. The Acute Exposure Guideline Level (AEGL) program: Applications of physiologically based pharmacokinetic modeling. J. Toxicol. Environ. Health Pt. A 2004, 67, 621–634. [Google Scholar] [CrossRef]
- Ludwig, F.L.; Gasiorek, L.S.; Ruff, R.E. Simplification of a Gaussian puff model for real-time minicomputer use. Atmos. Environ. 1977, 11, 431–436. [Google Scholar] [CrossRef]
- Argent, R.M. An overview of model integration for environmental application—Components, frameworks and semantics. Environ. Modell. Softw. 2004, 19, 219–234. [Google Scholar] [CrossRef]
- Rizzoli, A.E.; Young, W.J. Delivering environmental decision support systems: software tools and techniques. Environ. Modell. Softw. 1997, 12, 237–249. [Google Scholar] [CrossRef]
- Reniers, G.L.L.; Ale, B.J.M.; Dullaert, W.; Foubert, B. Decision support systems for major accident prevention in the chemical process industry: A developers’ survey. J. Loss Prevent. Proc. Ind. 2006, 19, 604–620. [Google Scholar] [CrossRef]
- Alhajraf, S.; Al-Awadhi, L.; Al-Fadala, S.; Al-Khubaizi, A.; Khan, A.R.; Baby, S. Real-time response system for the prediction of the atmospheric transport of hazardous materials. J. Loss Prevent. Proc. Ind. 2005, 18, 520–525. [Google Scholar] [CrossRef]
- Quaranta, N.; DeMartini, A.; Bellasio, R.; Bianconi, R.; Marioni, M. A decision support system for the simulation of industrial accidents. Environ. Modell. Softw. 2002, 17, 497–504. [Google Scholar] [CrossRef]
- Zhu, Q.W.; Stillman, M.J. Design of an expert-system for emergency response to a chemical spill .2. ERexpert module design and development. J. Chem. Inform. Comput. Sci. 1995, 35, 956–968. [Google Scholar]
- Kim, C.H.; Park, J.H.; Park, C.J.; Na, J.G. Operational atmospheric modeling system CARIS for effective emergency response associated with hazardous chemical releases in Korea. Environ. Manage. 2004, 33, 345–354. [Google Scholar] [CrossRef]
- Chang, N.; Wei, Y.L.; Tseng, C.C.; Kao, C. The design of a GIS-based decision support system for chemical emergency preparedness and response in an urban environment. Comput. Environ. Urban Syst. 1997, 21, 67–94. [Google Scholar] [CrossRef]
- Elbir, T. A GIS based decision support system for estimation, visualization and analysis of air pollution for large Turkish cities. Atmos. Environ. 2004, 38, 4509–4517. [Google Scholar] [CrossRef]
- Goodchild, M.F.; Steyaert, L.T.; Parks, B.O.; Johnston, C. GIS and Environmental Modeling: Progress and Research Issues; John Wiley & Sons: Hoboken, NY, USA, 1996. [Google Scholar]
- Yang, C.; Wong, D.W.; Yang, R.X.; Kafatos, M.; Li, Q. Performance-improving techniques in web-based GIS. Int. J. Geogr. Inf. Sci. 2005, 19, 319–342. [Google Scholar] [CrossRef]
- Peng, Z.; Zhang, C. The roles of geography markup language (GML), scalable vector graphics (SVG), and Web feature service (WFS) specifications in the development of Internet geographic information systems (GIS). J. Geogr. Syst. 2004, 6, 95–116. [Google Scholar] [CrossRef]
- Richter, J. Applied Microsoft: NET Framework Programming; Microsoft Press Redmond: Redmond, WA, USA, 2002; Volume 1. [Google Scholar]
- Lloyd, W.; David, O.; Ascough, J.C.; Rojas, K.W.; Carlson, J.R.; Leavesley, G.H.; Krause, P.; Green, T.R.; Ahuja, L.R. Environmental modeling framework invasiveness: Analysis and implications. Environ. Modell. Softw. 2011, 26, 1240–1250. [Google Scholar] [CrossRef]
- Booch, G. Object-oriented design. ACM SIGAda Ada Lett. 1982, 1, 64–76. [Google Scholar] [CrossRef]
- Ramabrahmam, B.V.; Sreenivasulu, B.; Mallikarjunan, M.M. Model on-site emergency plan. Case study: Toxic gas release from an ammonia storage terminal. J. Loss. Prevent. Proc. Ind. 1996, 9, 259–265. [Google Scholar]
- Ermak, D.L. User’s Manual for SLAB: An Atmospheric Dispersion Model for Denser-Than-Air Releases; Lawrence Livermore Laboratory: Livermore, CA, USA, 1990. [Google Scholar]
- Hanna, S.R.; Strimaitis, D.G.; Chang, J.C. Evaluation of 14 hazardous gas models with ammonia and hydrogen-fluoride field data. J. Hazard. Mater. 1991, 26, 127–158. [Google Scholar] [CrossRef]
- Kuchta, J.M. Investigation of Fire and Explosion Accidents in the Chemical, Mining, and Fuel-Related Industries: A Manual; U.S. Department of the Interior, Bureau of Mines: Washington, DC, USA, 1985. [Google Scholar]
- Tixier, J.; Dusserre, G.; Salvi, O.; Gaston, D. Review of 62 risk analysis methodologies of industrial plants. J. Loss Prevent. Proc. Ind. 2002, 15, 291–303. [Google Scholar] [CrossRef] [Green Version]
- Ferguson, H.D.; Townsend, D.I.; Hofelich, T.C.; Russell, P.M. Reactive chemicals hazard evaluation—Impact of thermal-characteristics of transportation storage vessels. J. Hazard. Mater. 1994, 37, 285–302. [Google Scholar] [CrossRef]
- Kinney, G.F.; Graham, K.J. Explosive Shocks in Air; Springer: Berlin, Germany, 1985. [Google Scholar]
- Fu, Z.M.; Huang, J.Y.; Zang, N. Quantitative analysis for consequence of explosion shock wave. Fire Sci. Technol. 2009, 6, 390–395. [Google Scholar]
- Chen, K.Y.; Chen, W.T.; Chiu, C.W.; Wu, T.C.; Shu, C.M. Thermal explosion simulation of methyl ethyl ketone peroxide in three types of vessel under the same volume by explosion models. J. Therm. Anal. Calorim. 2011, 106, 235–241. [Google Scholar] [CrossRef]
- Liu, M.B.; Liu, G.R.; Zong, Z.; Lam, K.Y. Computer simulation of high explosive explosion using smoothed particle hydrodynamics methodology. Comput. Fluids 2003, 32, 305–322. [Google Scholar] [CrossRef]
- Guidelines for Environmental Impact Assessment Atmospheric Environment; Ministry of Environmental Protection of the People’s Republic of China: Beijing, China, 2008.
- Hillar, G. Professional Parallel Programming with C#: Master Parallel Extensions with NET 4; John Wiley & Sons: Hoboken, NY, USA, 2010. [Google Scholar]
- Huang, H.S.; Li, Y.; Gartner, G.; Wang, Y.P. An SVG-based method to support spatial analysis in XML/GML/SVG-based WebGIS. Int. J. Geogr. Inf. Sci. 2011, 25, 1561–1574. [Google Scholar] [CrossRef]
- Fain, Y.; Rasputnis, V.; Tartakovsky, A. Rich Internet Applications with Adobe Flex & Java: Secrets of the Masters; SYS-CON Media: Woodcliff Lake, NJ, USA, 2007. [Google Scholar]
© 2014 by the authors; licensee MDPI, Basel, Switzerland. This article is an open access article distributed under the terms and conditions of the Creative Commons Attribution license (http://creativecommons.org/licenses/by/3.0/).
Share and Cite
Ni, H.; Rui, Y.; Wang, J.; Cheng, L. A Synthetic Method for Atmospheric Diffusion Simulation and Environmental Impact Assessment of Accidental Pollution in the Chemical Industry in a WEBGIS Context. Int. J. Environ. Res. Public Health 2014, 11, 9238-9255. https://doi.org/10.3390/ijerph110909238
Ni H, Rui Y, Wang J, Cheng L. A Synthetic Method for Atmospheric Diffusion Simulation and Environmental Impact Assessment of Accidental Pollution in the Chemical Industry in a WEBGIS Context. International Journal of Environmental Research and Public Health. 2014; 11(9):9238-9255. https://doi.org/10.3390/ijerph110909238
Chicago/Turabian StyleNi, Haochen, Yikang Rui, Jiechen Wang, and Liang Cheng. 2014. "A Synthetic Method for Atmospheric Diffusion Simulation and Environmental Impact Assessment of Accidental Pollution in the Chemical Industry in a WEBGIS Context" International Journal of Environmental Research and Public Health 11, no. 9: 9238-9255. https://doi.org/10.3390/ijerph110909238