
Impact of Heat and Cold on Total and Cause-Specific Mortality in Vadu HDSS—A Rural Setting in Western India


Abstract
:1. Introduction
2. Methods
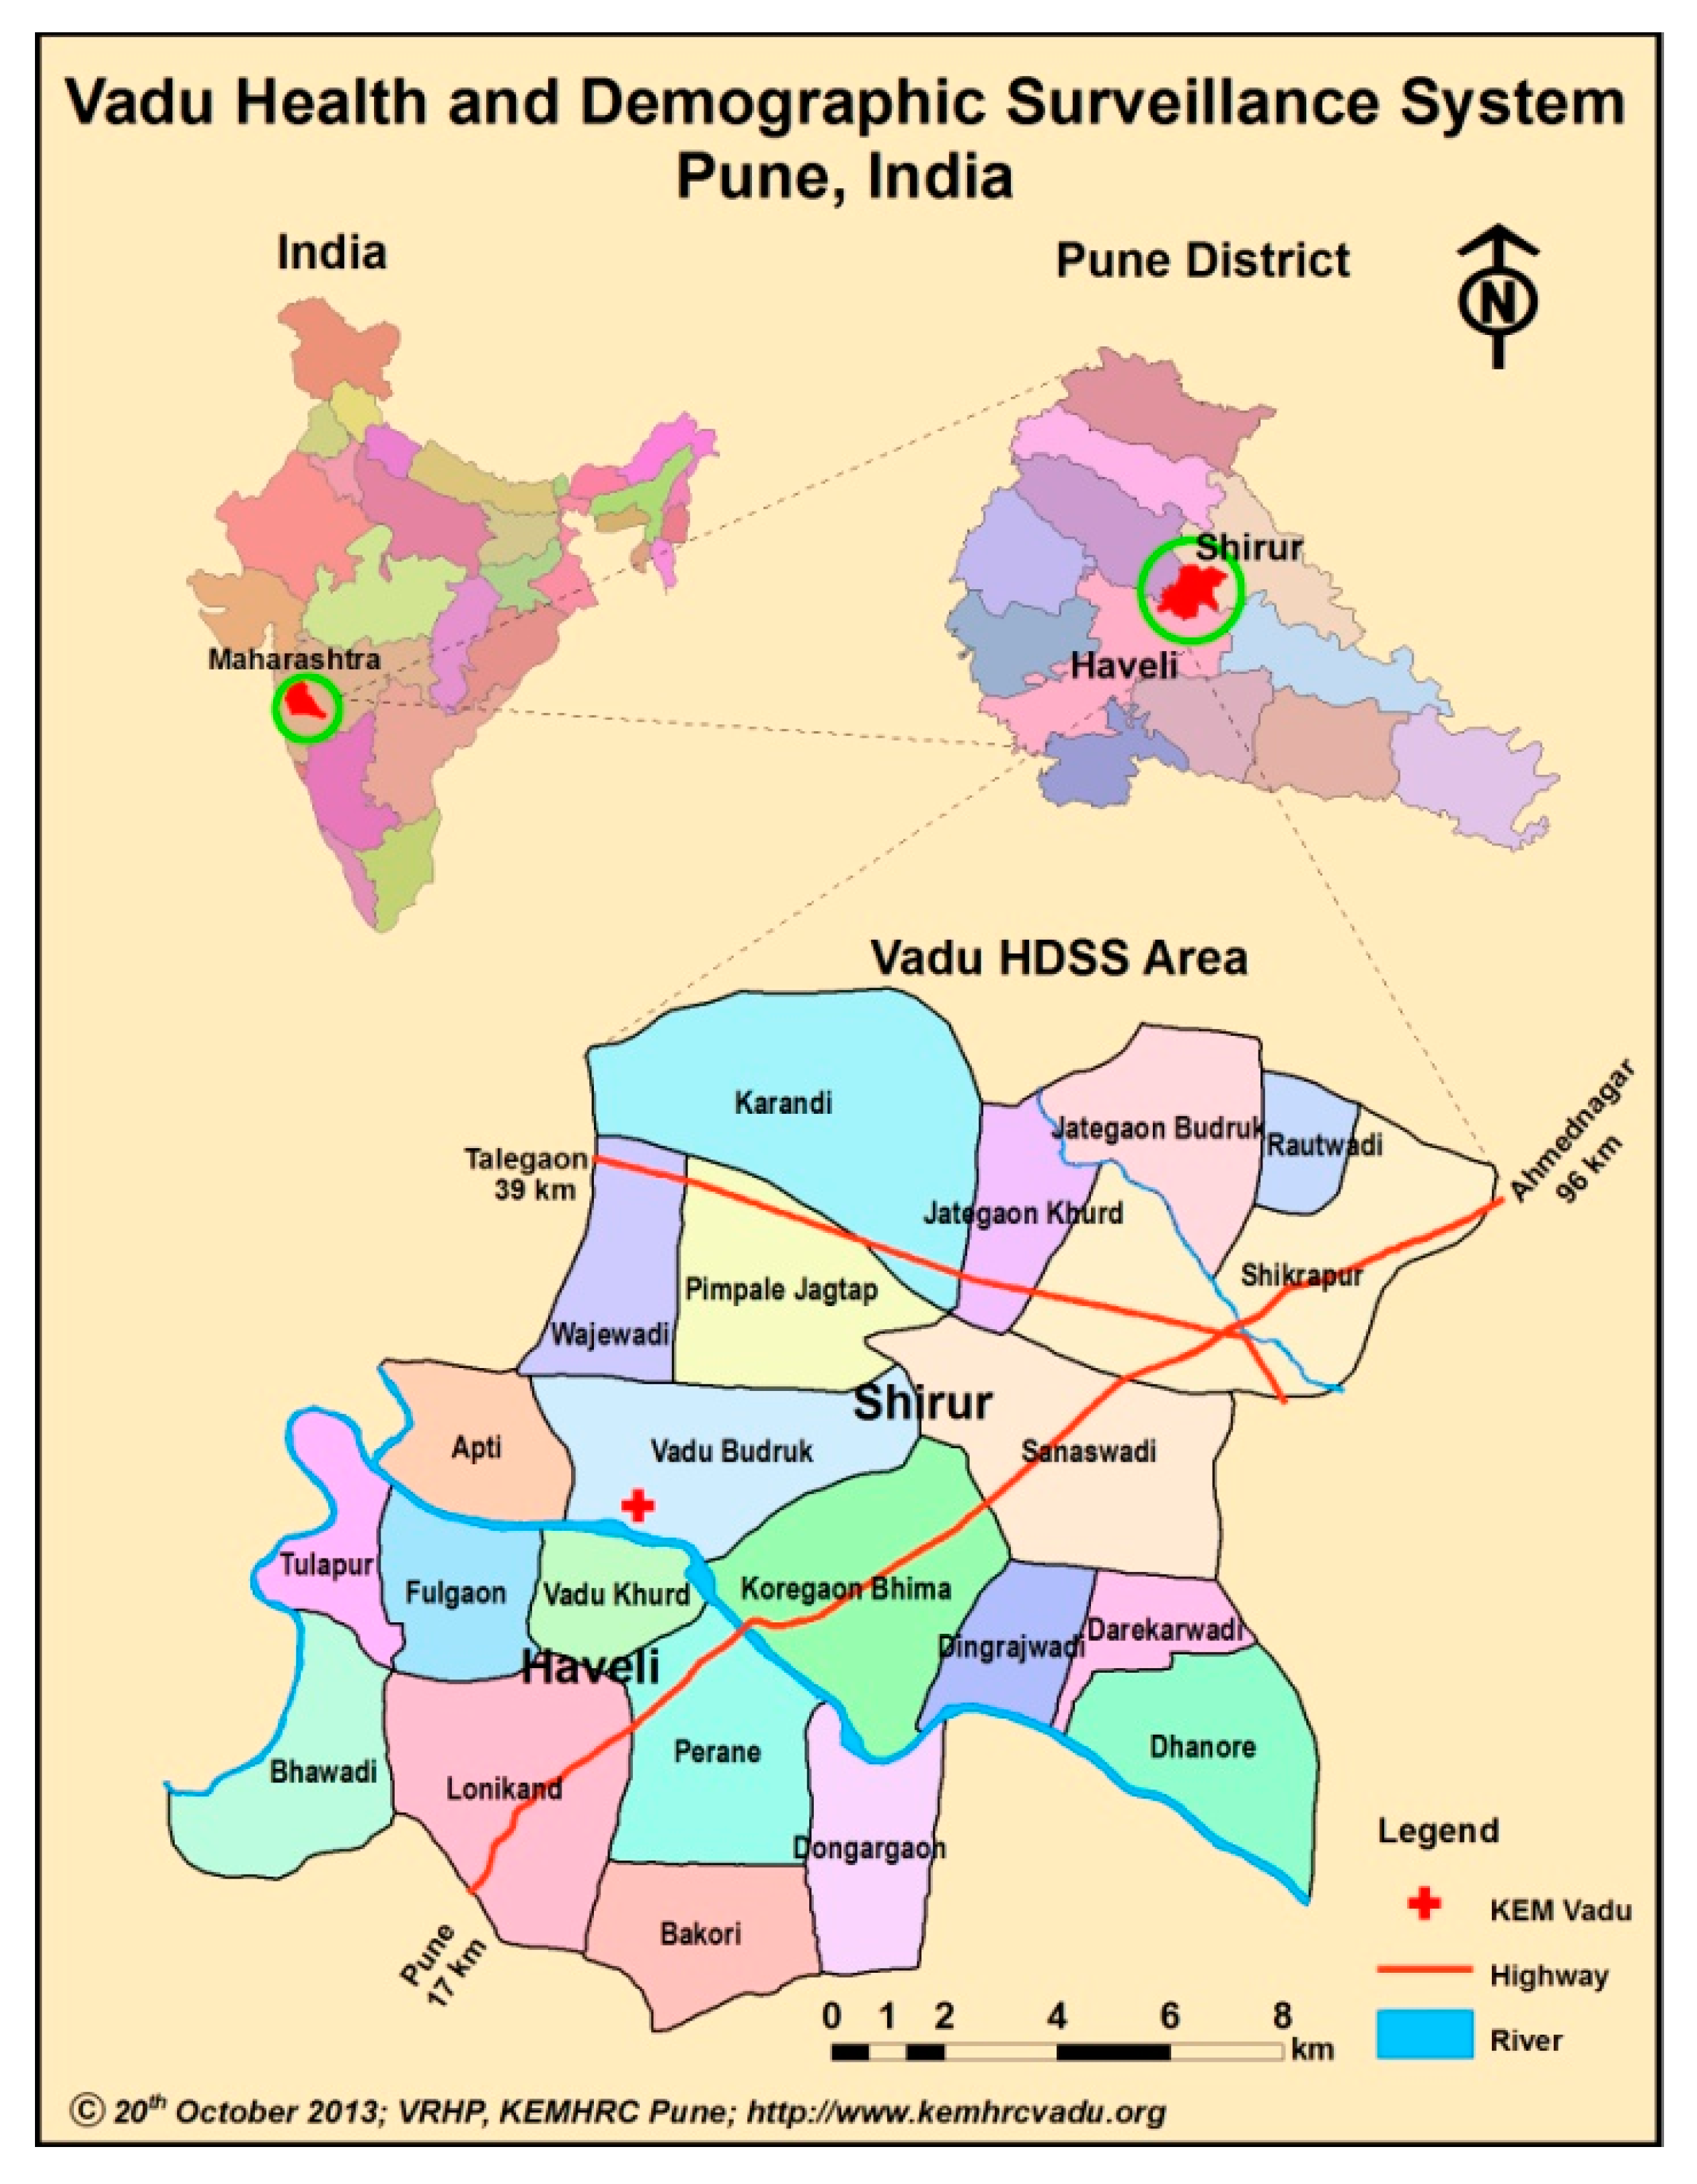
2.1. Study Area and HDSS Setting

2.2. Mortality and Verbal Autopsy Data
2.3. Weather Data
2.4. Definition of Heat Days and Cold Days
2.5. Statistical Analysis
3. Results

| Minimum | Maximum | Mean | Median | 2nd Percentile | 5th Percentile | 95th Percentile | 98th Percentile |
|---|---|---|---|---|---|---|---|
| 21.1 | 42.4 | 32.0 | 31.2 | 25.4 | 26.6 | 38.8 | 39.9 |
| Causes of Death | N | % |
|---|---|---|
| Non-infectious diseases | 1175 | 51.04 |
| Infectious diseases | 296 | 12.86 |
| External causes | 309 | 13.42 |
| Unspecified causes | 522 | 22.68 |
| Total deaths | 2303 | 100 |


4. Discussion
Strengths and Limitations of the Study
5. Conclusions
Appendix
| Heat Days | Lag 0 | Lag 0–4 Days | ||
| OR | 95% CI | OR | 95% CI | |
| All cause mortality | 1.40 | 0.95–2.06 | 1.17 | 0.87–1.59 |
| Non-infectious disease mortality | 1.70 | 1.13–2.54 | 1.44 | 1.03–2.00 |
| Infectious disease mortality | 1.21 | 0.55–2.42 | 0.96 | 0.51–1.73 |
| External causes of death | 1.75 | 0.96–3.06 | 1.10 | 0.65–1.84 |
| All cause mortality in men | 1.10 | 0.72–1.65 | 1.02 | 0.73–1.42 |
| All cause mortality in women | 1.12 | 0.70–1.77 | 1.12 | 0.77–1.61 |
| All cause mortality in age group 12–59 years | 1.42 | 0.92–2.17 | 1.19 | 0.84–1.70 |
| All cause mortality in age group 60+ years | 1.34 | 0.88–2.01 | 1.34 | 0.88–2.01 |
| Cold Days | Lag 0 | Lag 0–4 days | ||
| OR | 95% CI | OR | 95% CI | |
| All cause mortality | 1.71 | 0.89–3.32 | 1.26 | 0.88–1.81 |
| Non-infectious disease mortality | 0.87 | 0.39–1.78 | 1.11 | 0.75–1.64 |
| Infectious disease mortality | 1.72 | 0.62–4.05 | 0.89 | 0.46–1.60 |
| External causes of death | 0.26 | 0.03–1.95 | 1.21 | 0.66–2.22 |
| All cause mortality in men | 1.48 | 0.75–2.82 | 1.24 | 0.85–1.79 |
| All cause mortality in women | 0.88 | 0.38–1.84 | 0.97 | 0.63–1.46 |
| All cause mortality in age group 12–59 years | 1.37 | 0.69–2.72 | 1.28 | 0.87–1.88 |
| All cause mortality in age group 60+ years | 1.35 | 0.67–2.62 | 1.04 | 0.70–1.52 |
| Cold Days | Lag 0–14 | |||
| OR | 95% CI | |||
| All cause mortality | 1.07 | 0.82–1.39 | ||
| Non-infectious disease mortality | 1.08 | 0.81–1.44 | ||
| Infectious disease mortality | 0.92 | 0.59–1.44 | ||
| External causes of death | 0.73 | 0.44–1.18 | ||
| All cause mortality in men | 0.99 | 0.75–1.31 | ||
| All cause mortality in women | 1.08 | 0.80–1.46 | ||
| All cause mortality in age group 12–59 years | 1.13 | 0.84–1.52 | ||
| Total mortality in age group 60+ years | 1.04 | 0.78–1.37 | ||
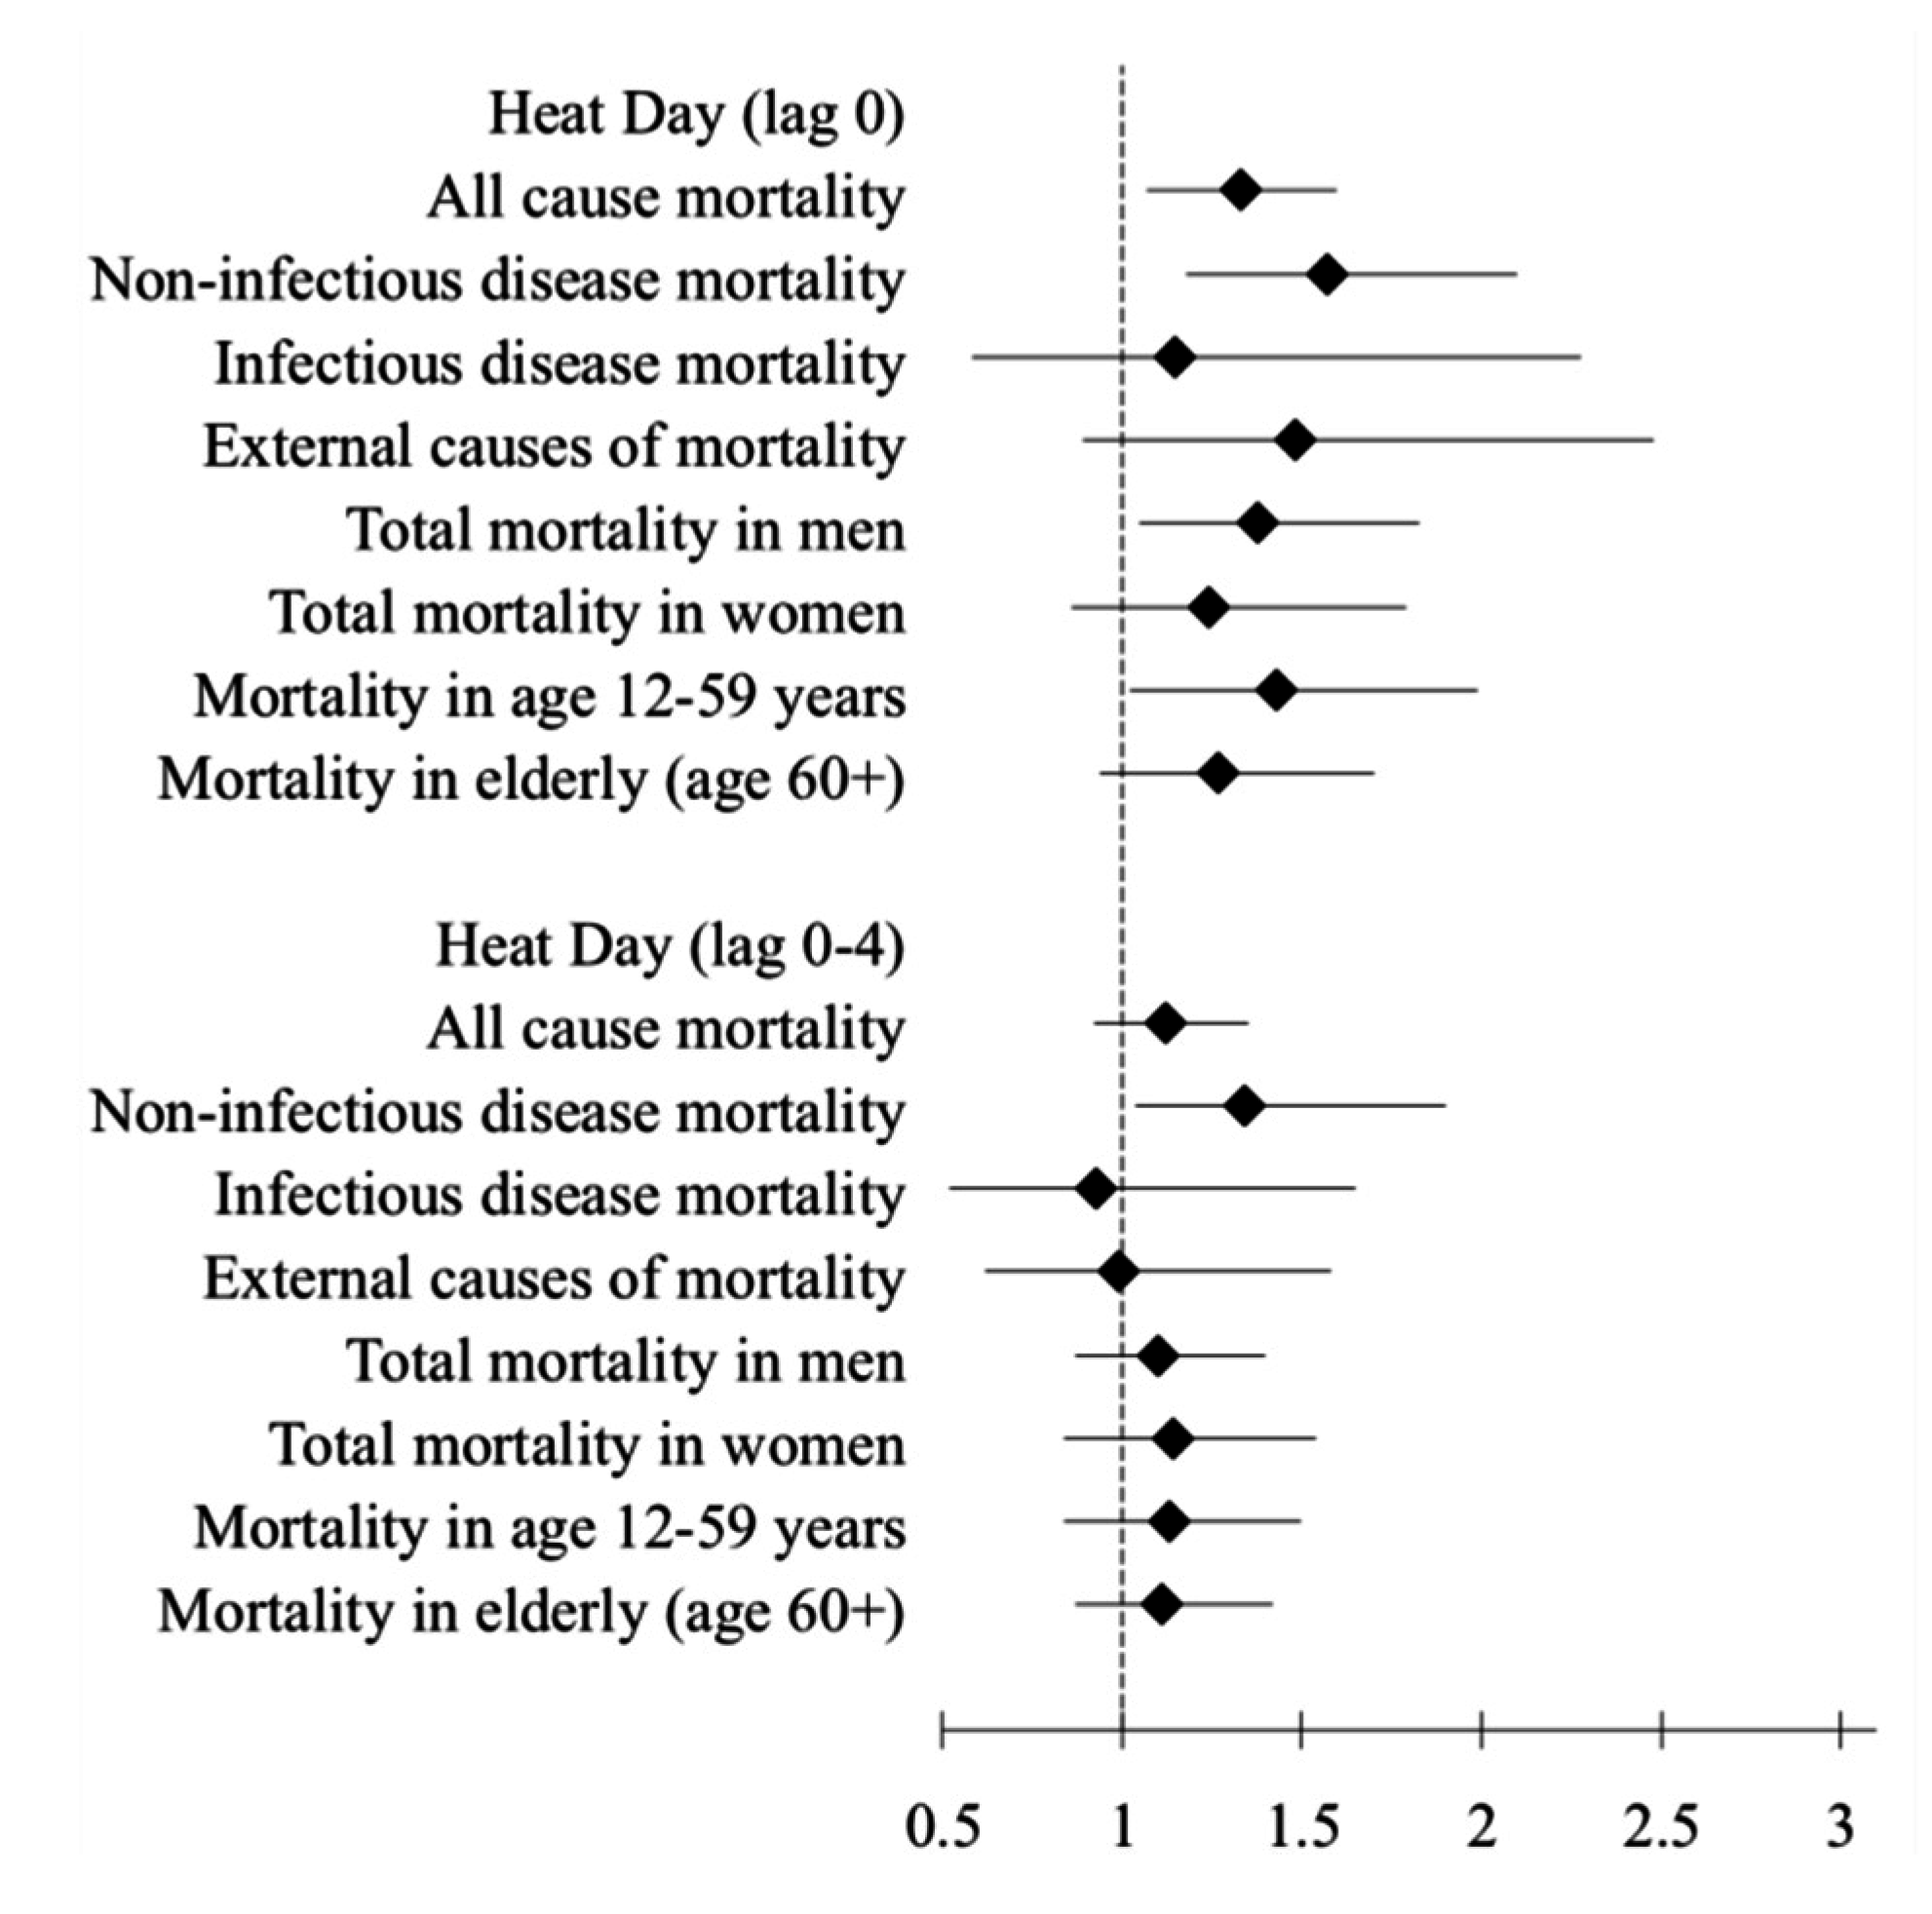
| Heat Days | Lag 0 | Lag 0–4 Days | ||
| RR | 95% CI | RR | 95% CI | |
| All cause mortality | 1.33 | 1.07–1.60 | 1.12 | 0.92–1.35 |
| Non-infectious disease mortality | 1.57 | 1.18–2.10 | 1.34 | 1.04–1.90 |
| Infectious disease mortality | 1.15 | 0.58–2.28 | 0.93 | 0.52–1.65 |
| External causes of mortality | 1.48 | 0.89–2.48 | 0.99 | 0.62–1.58 |
| All cause mortality in men | 1.38 | 1.05–1.83 | 1.10 | 0.87–1.40 |
| All cause mortality in women | 1.24 | 0.86–1.79 | 1.14 | 0.84–1.54 |
| All cause mortality in age group 12–59 years | 1.43 | 1.02–1.99 | 1.13 | 0.84–1.50 |
| All cause mortality in age group 60+ years | 1.27 | 0.94–1.70 | 1.11 | 0.87–1.42 |
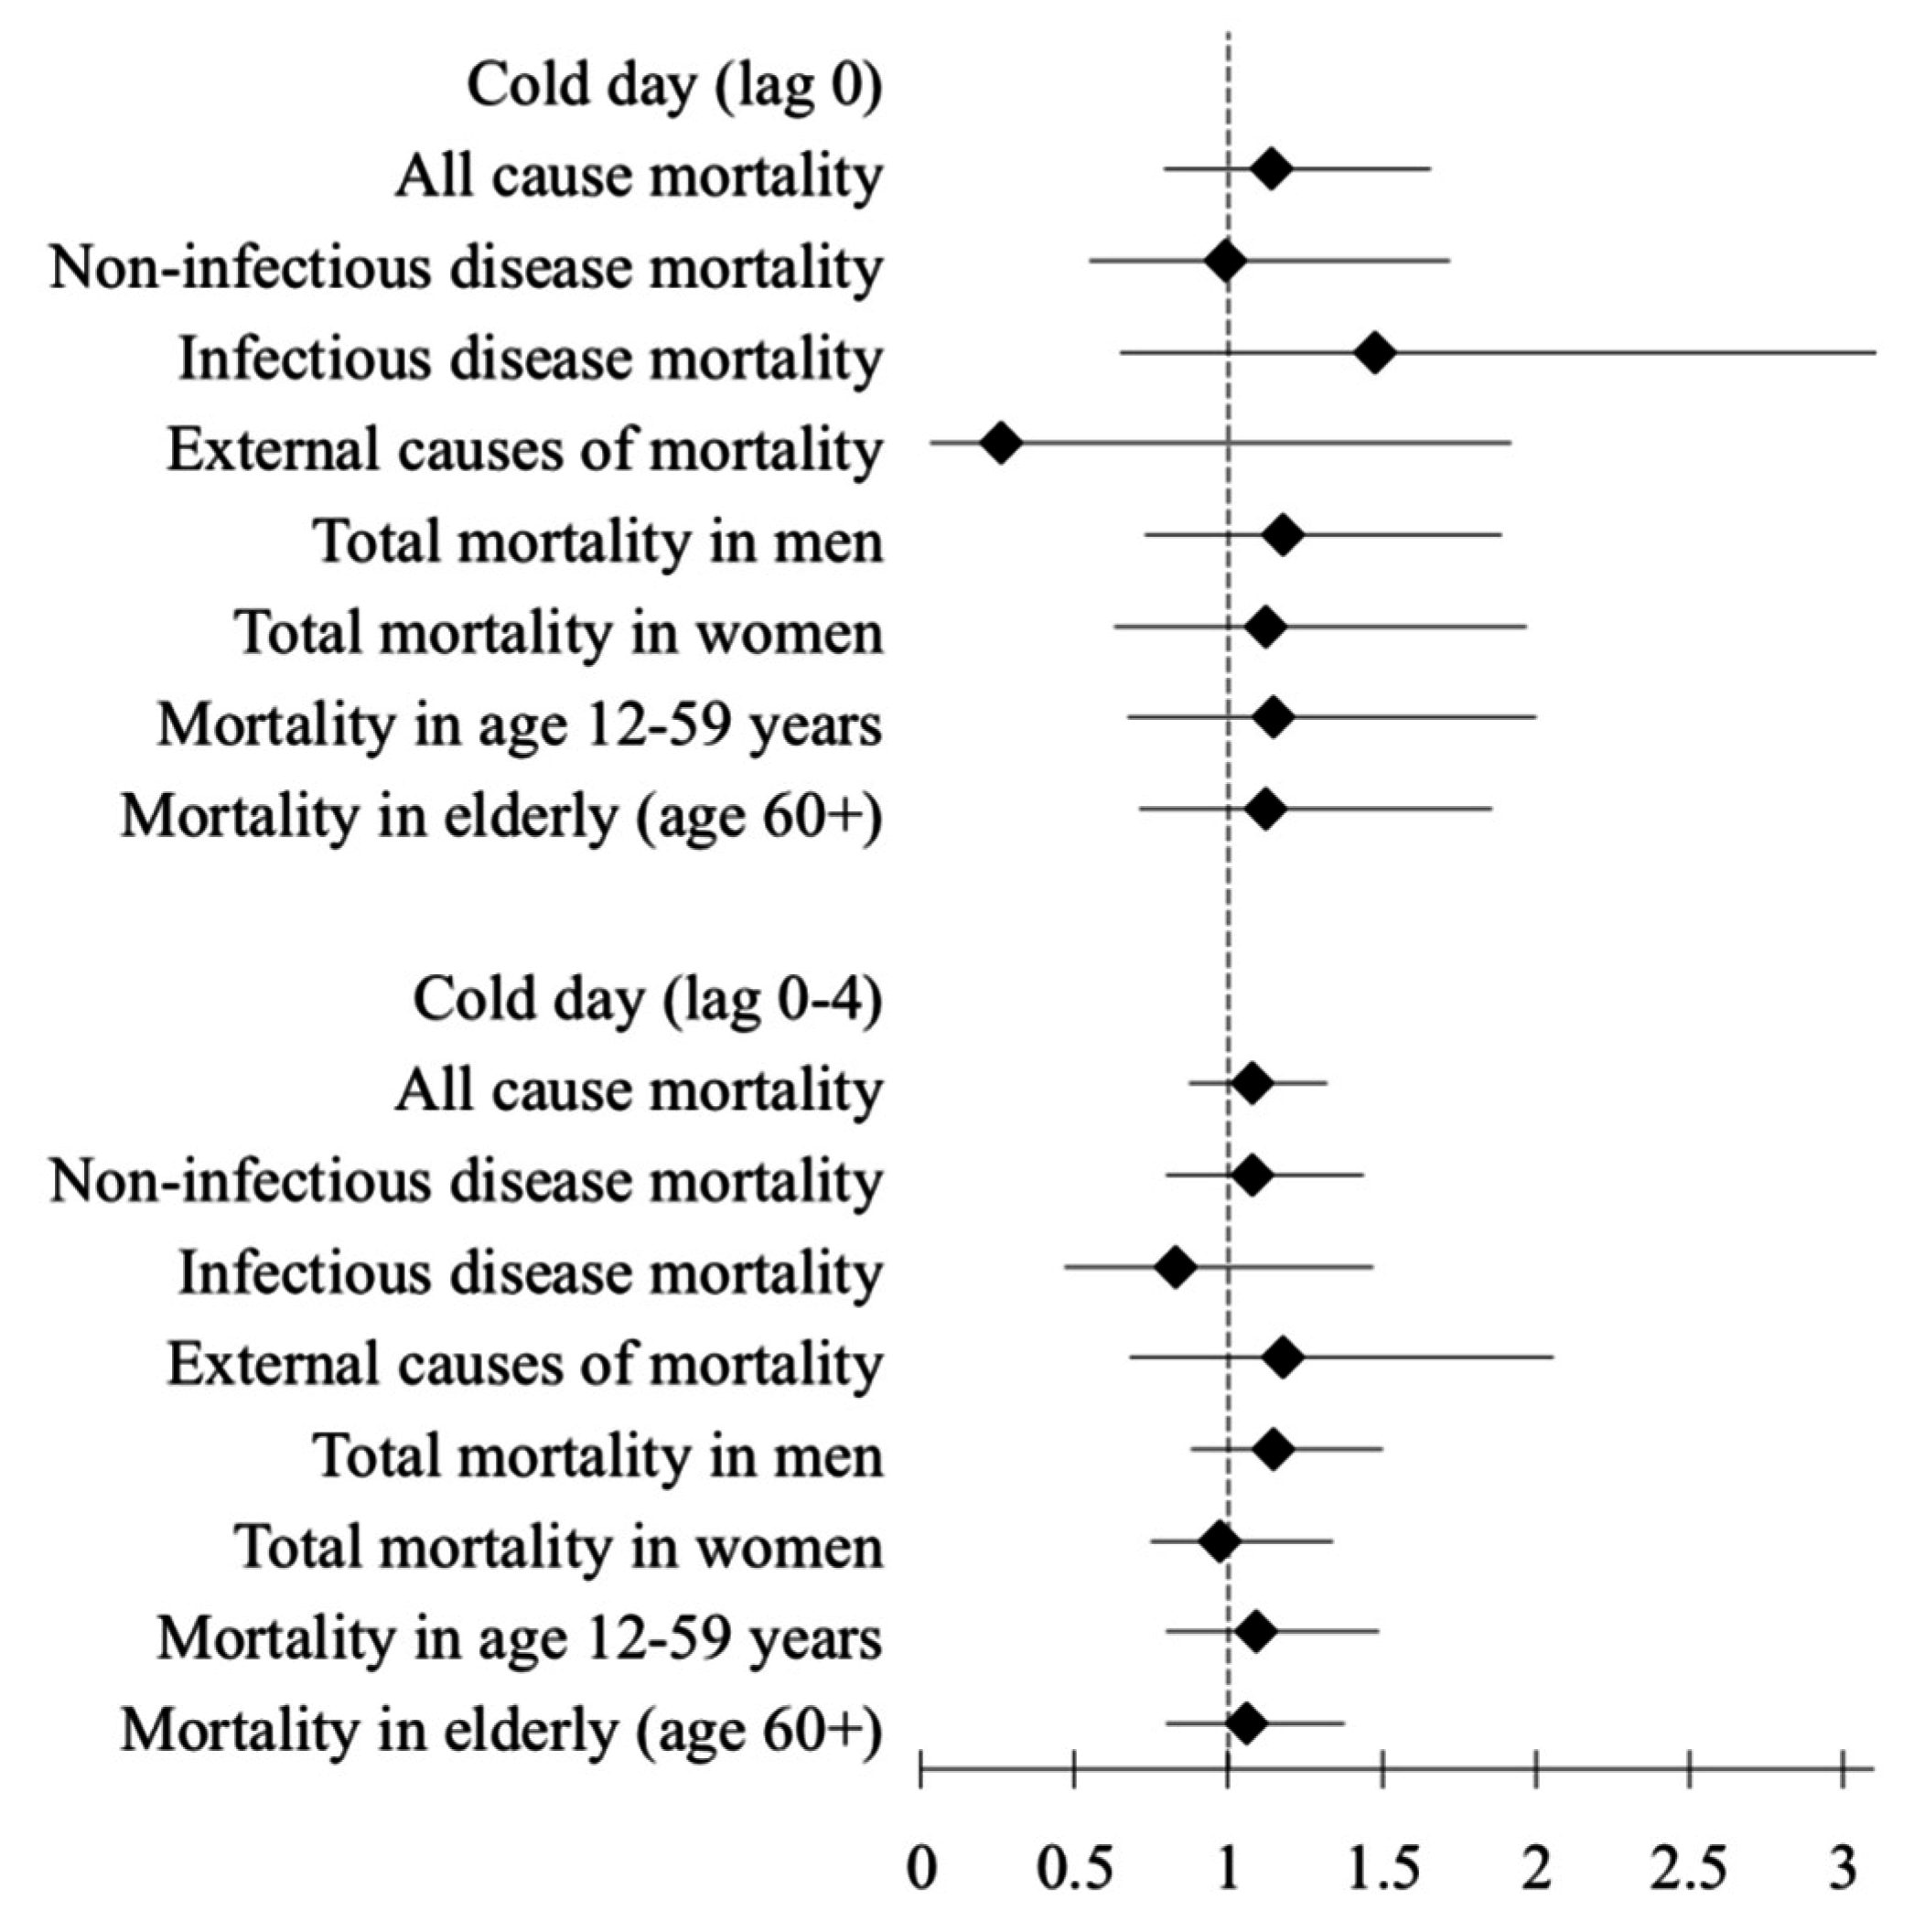
| Cold Days | Lag 0 | Lag 0–4 days | ||
| RR | 95% CI | RR | 95% CI | |
| All cause mortality | 1.14 | 0.79–1.66 | 1.08 | 0.87–1.32 |
| Non-infectious disease mortality | 0.99 | 0.55–1.72 | 1.08 | 0.80–1.44 |
| Infectious disease mortality | 1.48 | 0.65–3.38 | 0.83 | 0.47–1.47 |
| External causes of mortality | 0.26 | 0.03–1.92 | 1.18 | 0.68–2.06 |
| All cause mortality in men | 1.18 | 0.73–1.89 | 1.15 | 0.88–1.50 |
| All cause mortality in women | 1.12 | 0.63–1.97 | 0.97 | 0.75–1.34 |
| All cause mortality in age group 12–59 years | 1.15 | 0.67–2.00 | 1.09 | 0.80–1.49 |
| All cause mortality in age group 60+ years | 1.12 | 0.71–1.86 | 1.06 | 0.80–1.38 |
| Cold Days | Lag 0–14 | |||
| RR | 95% CI | |||
| All cause mortality | 1.01 | 0.86–1.18 | ||
| Non-infectious disease mortality | 1.08 | 0.87–1.33 | ||
| Infectious disease mortality | 0.88 | 0.59–1.33 | ||
| External causes of death | 0.72 | 0.46–1.14 | ||
| All cause mortality in men | 0.98 | 0.80–1.21 | ||
| All cause mortality in women | 1.03 | 0.82–1.30 | ||
| All cause mortality in age group 12–59 years | 1.03 | 0.82–1.29 | ||
| All cause mortality in age group 60+ years | 0.99 | 0.81–1.21 | ||
Acknowledgments
Author Contributions
Conflicts of Interest
References
- Field, C.B.; Barros, V.; Stocker, T.F.; Qin, D.; Dokken, D.J.; Ebi, K.L.; Mastrandrea, M.D.; Mach, K.J.; Plattner, G.-K.; Allen, S.K.; et al. Managing the Risks of Extreme Events and Disasters to Advance Climate Change Adaptation. A Special Report of Working Groups I and II of the Intergovernmental Panel on Climate Change; IPCC: Geneva, Switzerland, 2012. [Google Scholar]
- Confalonieri, U.; Menne, B.; Akhtar, R.; Ebi, K.L.; Hauengue, M.; Kovats, R.S.; Revich, B.; Woodward, A. Human health. In Climate Change 2007: Impacts, Adaptation and Vulnerability, Contribution of Working Group II to the Fourth Assessment Report of the Intergovernmental Panel on Climate Change; IPCC: Geneva, Switzerland, 2007. [Google Scholar]
- Burkart, K.; Breitner, S.; Schneider, A.; Khan, M.M.; Kramer, A.; Endlicher, W. An analysis of heat effects in different subpopulations of Bangladesh. Int. J. Biometeorol. 2014, 58, 227–237. [Google Scholar] [CrossRef] [PubMed]
- Ellis, F.P. Heat illness. II. Pathogenesis. Trans. R. Soc. Tropical Med. Hyg. 1976, 70, 412–418. [Google Scholar] [CrossRef]
- Guha-Sapir, D.; Below, R.; Hoyois, P. EM-DAT: International Disaster Database; Catholic University of Louvain: Brussels, Belgium, 2015. [Google Scholar]
- Chaudhury, S.K.; Gore, J.M.; Ray, K.C.S. Impact of heat waves over India. Curr. Sci. India 2000, 79, 153–155. [Google Scholar]
- Azhar, G.S.; Mavalankar, D.; Nori-Sarma, A.; Rajiva, A.; Dutta, P.; Jaiswal, A.; Sheffield, P.; Knowlton, K.; Hess, J.J.; Ahmedabad HeatClimate Study Group. Heat-related mortality in India: Excess all-cause mortality associated with the 2010 Ahmedabad heat wave. PLoS ONE 2014, 9. [Google Scholar] [CrossRef] [PubMed]
- Ingole, V.; Juvekar, S.; Muralidharan, V.; Sambhudas, S.; Rocklov, J. The short-term association of temperature and rainfall with mortality in Vadu health and demographic surveillance system: A population level time series analysis. Glob. Health Action 2012, 5, 44–52. [Google Scholar] [CrossRef] [PubMed]
- Lindeboom, W.; Alam, N.; Begum, D.; Streatfield, P.K. The association of meteorological factors and mortality in rural Bangladesh, 1983–2009. Glob. Health Action 2012, 5, 61–73. [Google Scholar] [CrossRef] [PubMed]
- Basu, R. High ambient temperature and mortality: A review of epidemiologic studies from 2001 to 2008. Environ. Health: Glob. Access Sci. Source 2009, 8. [Google Scholar] [CrossRef] [PubMed]
- Mercer, J.B. Cold—An underrated risk factor for health. Environ. Res. 2003, 92, 8–13. [Google Scholar] [CrossRef]
- INDEPTH Network. Available online: http://www.indepth-network.org/index.php?option=com_content&task=view&id=13&Itemid=28 (accessed on 11 June 2015).
- Sankoh, O.; Byass, P. Time for civil registration with verbal autopsy. Lancet Glob. Health 2014, 2, e693–e694. [Google Scholar] [CrossRef]
- Streatfield, P.K.; Khan, W.A.; Bhuiya, A.; Alam, N.; Sie, A.; Soura, A.B.; Bonfoh, B.; Ngoran, E.K.; Weldearegawi, B.; Jasseh, M.; et al. Cause-specific mortality in Africa and Asia: Evidence from indepth health and demographic surveillance system sites. Glob. Health Action 2014, 7. [Google Scholar] [CrossRef]
- Hajat, S.; Kovats, R.S.; Atkinson, R.W.; Haines, A. Impact of hot temperatures on death in London: A time series approach. J. Epidemiol. Community Health 2002, 56, 367–372. [Google Scholar] [CrossRef] [PubMed]
- Hajat, S.; Armstrong, B.; Baccini, M.; Biggeri, A.; Bisanti, L.; Russo, A.; Paldy, A.; Menne, B.; Kosatsky, T. Impact of high temperatures on mortality: Is there an added heat wave effect? Epidemiology 2006, 17, 632–638. [Google Scholar] [CrossRef] [PubMed]
- Egondi, T.; Kyobutungi, C.; Rocklov, J. Temperature variation and heat wave and cold spell impacts on years of life lost among the urban poor population of Nairobi, Kenya. Int. J. Environ. Res. Public Health 2015, 12, 2735–2748. [Google Scholar] [CrossRef] [PubMed]
- Nitschke, M.; Tucker, G.R.; Bi, P. Morbidity and mortality during heatwaves in Metropolitan Adelaide. Med. J. Aust. 2007, 187, 662–665. [Google Scholar] [PubMed]
- Gosling, S.N.; Lowe, J.A.; McGregor, G.R.; Pelling, M.; Malamud, B.D. Associations between elevated atmospheric temperature and human mortality: A critical review of the literature. Clim. Change 2009, 92, 299–341. [Google Scholar] [CrossRef]
- Fowler, D.R.; Mitchell, C.S.; Brown, A.; Pollock, T.; Bratka, L.A.; Paulson, J.; Noller, A.C.; Mauskapf, R.; Oscanyan, K.; Vaidyanathan, A.; et al. Heat-related deaths after an extreme heat event—Four states, 2012, and United States, 1999–2009. MMWR 2013, 62, 433–436. [Google Scholar]
- Meehl, G.A.; Tebaldi, C. More intense, more frequent, and longer lasting heat waves in the 21st century. Science 2004, 305, 994–997. [Google Scholar] [CrossRef] [PubMed]
- Robinson, P.J. On the definition of a heat wave. J. Appl. Meteorol. 2001, 40, 762–775. [Google Scholar] [CrossRef]
- Sankoff, J. Heat illnesses: A hot topic in the setting of global climate change. Aust. Fam. Physician 2015, 44, 22–26. [Google Scholar] [PubMed]
- Kovats, R.S.; Hajat, S. Heat stress and public health: A critical review. Annu. Rev. Public Health 2008, 29, 41–55. [Google Scholar] [CrossRef] [PubMed]
- Petitti, D.B.; Harlan, S.L.; Chowell-Puente, G.; Ruddell, D. Occupation and environmental heat-associated deaths in Maricopa County, Arizona: A case-control study. PLoS ONE 2013, 8. [Google Scholar] [CrossRef] [PubMed]
- Tran, K.V.; Azhar, G.S.; Nair, R.; Knowlton, K.; Jaiswal, A.; Sheffield, P.; Mavalankar, D.; Hess, J. A cross-sectional, randomized cluster sample survey of household vulnerability to extreme heat among slum dwellers in Ahmedabad, India. Int. J. Environ. Res. Public Health 2013, 10, 2515–2543. [Google Scholar] [CrossRef] [PubMed]
- Hajat, S.; Kovats, R.S.; Lachowycz, K. Heat-related and cold-related deaths in England and Wales: Who is at risk? Occup. Environ. Med. 2007, 64, 93–100. [Google Scholar] [CrossRef] [PubMed]
- Gomez-Acebo, I.; Llorca, J.; Dierssen, T. Cold-related mortality due to cardiovascular diseases, respiratory diseases and cancer: A case-crossover study. Public Health 2013, 127, 252–258. [Google Scholar] [CrossRef] [PubMed]
- Yu, W.; Hu, W.; Mengersen, K.; Guo, Y.; Pan, X.; Connell, D.; Tong, S. Time course of temperature effects on cardiovascular mortality in Brisbane, Australia. Heart 2011, 97, 1089–1093. [Google Scholar] [CrossRef] [PubMed] [Green Version]
- McMichael, A.J.; Wilkinson, P.; Kovats, R.S.; Pattenden, S.; Hajat, S.; Armstrong, B.; Vajanapoom, N.; Niciu, E.M.; Mahomed, H.; Kingkeow, C.; et al. International study of temperature, heat and urban mortality: The “ISOTHURM” project. Int. J. Epidemiol. 2008, 37, 1121–1131. [Google Scholar] [CrossRef] [PubMed]
- Huq, S.; Kovats, S.; Reid, H.; Satterthwaite, D. Editorial: Reducing risks to cities from disasters and climate change. Environ. Urban. 2007, 19, 3–15. [Google Scholar] [CrossRef]
- Wang, X.Y.; Barnett, A.G.; Yu, W.; FitzGerald, G.; Tippett, V.; Aitken, P.; Neville, G.; McRae, D.; Verrall, K.; Tong, S. The impact of heatwaves on mortality and emergency hospital admissions from non-external causes in Brisbane, Australia. Occup. Environ. Med. 2012, 69, 163–169. [Google Scholar] [CrossRef] [PubMed]
- Hajat, S.; Haines, A.; Atkinson, R.W.; Bremner, S.A.; Anderson, H.R.; Emberlin, J. Association between air pollution and daily consultations with general practitioners for allergic rhinitis in London, United Kingdom. Am. J. Epidemiol. 2001, 153, 704–714. [Google Scholar] [CrossRef] [PubMed]
- Buckley, J.P.; Samet, J.M.; Richardson, D.B. Commentary: Does air pollution confound studies of temperature? Epidemiology 2014, 25, 242–245. [Google Scholar] [CrossRef] [PubMed]
© 2015 by the authors; licensee MDPI, Basel, Switzerland. This article is an open access article distributed under the terms and conditions of the Creative Commons by Attribution (CC-BY) license (http://creativecommons.org/licenses/by/4.0/).
Share and Cite
Ingole, V.; Rocklöv, J.; Juvekar, S.; Schumann, B. Impact of Heat and Cold on Total and Cause-Specific Mortality in Vadu HDSS—A Rural Setting in Western India. Int. J. Environ. Res. Public Health 2015, 12, 15298-15308. https://doi.org/10.3390/ijerph121214980
Ingole V, Rocklöv J, Juvekar S, Schumann B. Impact of Heat and Cold on Total and Cause-Specific Mortality in Vadu HDSS—A Rural Setting in Western India. International Journal of Environmental Research and Public Health. 2015; 12(12):15298-15308. https://doi.org/10.3390/ijerph121214980
Chicago/Turabian StyleIngole, Vijendra, Joacim Rocklöv, Sanjay Juvekar, and Barbara Schumann. 2015. "Impact of Heat and Cold on Total and Cause-Specific Mortality in Vadu HDSS—A Rural Setting in Western India" International Journal of Environmental Research and Public Health 12, no. 12: 15298-15308. https://doi.org/10.3390/ijerph121214980