
An Innovative Approach to Addressing Childhood Obesity: A Knowledge-Based Infrastructure for Supporting Multi-Stakeholder Partnership Decision-Making in Quebec, Canada

Abstract
:1. Introduction

| Number | 2007 | 2008 | 2009 | 2010 | 2011 | 2012 | 2013 |
|---|---|---|---|---|---|---|---|
| Local partners groups (regroupements locaux de partenaires, RLPs) | 35 | 35 | 71 | 110 | 140 | 152 | 157 |
| Administrative regions | 8 | 8 | 16 | 17 | 17 | 17 | 17 |
| Regional projects | NA | NA | NA | NA | 19 | 25 | 25 |
| Province-wide projects | NA | NA | NA | NA | 18 | 19 | 36 |
| Amount invested (Millions of Canadian Dollars) | 5.7 | 4.5 ** | 8.1 | 15.5 | 16.6 | NA | NA |
2. The Quebec Context and the Value of Conceptual Mapping and Ontology Development
3. Existing Methodologies
4. Method
| Aspect of Study | Approach |
|---|---|
| Process analysis for assessing needs | Participant-observations of meetings (N = 12), including informal discussions with meetings participants (between 4–28 participants in each meeting); Structured interviews (N = 8); Focus group discussions with community networks and QEF agents (N = 3) |
| Mapping of QEF and community knowledge processes, data, and concepts | Focus group discussions with community network & QEF domain & process experts (N = 4) |
5. Results and Discussion of Community Network Processes
| Aspect of Community Processes | Description |
|---|---|
| Embeddedness | MSP processes are embedded in multiple levels of inter-related structures |
| Interaction between human agency & structures | During community network processes, there are interactions between human agency (i.e., participants in processes) and structures (i.e., QEF guidelines for community network processes, data sources available, time allotted) |
| Temporal interconnectedness & Non-linearity | At each structural level, community network processes are temporally connected, in that past, present, and future processes are related to each other The links between the multiple levels of structures, events that occur, and community network decision-makers’ roles emerge over time, in a complex manner that linear explanations are unable to account for |
| Complex links between processes and outcomes | Community network processes are linked to outcomes at multiple levels in multiple domains, such as changes in children’s food purchase, eating and physical activity behavior that may be linked with economic, health, and educational factors. Conceptual mapping enables decision-makers to more easily visualize the linkages between determinant of such behaviors, and outcomes such as health (e.g., obesity), educational (e.g., drop-out), and economic (e.g., cost burden) |
5.1. Embeddedness of Processes

| Stakeholder | Description of Roles |
|---|---|
| Community network coordinators | Each community network has a coordinator, who is the key actor that incorporates data and information into community epidemiological profiles. |
| Community network members | They have multiple roles in their respective community networks, which vary greatly in size and organization, and include representatives from early childhood centers; primary and secondary schools; local, municipal, and regional education and health boards and agencies; community and voluntary organizations; municipal government; etc. Members have expertise in one or more of the following areas: healthy eating; physical activity; child development; urban development; transport; agrifood; planning and evaluation; communication; and issues of poverty |
| QEF development agents | Each agent typically works with about 5 community networks, and is embedded in a QEF regional office, which oversees the partnerships in a region (e.g., the QEF Montreal region office where our study drew its sample oversees 25 community networks) |
| QEF evaluation team | Provides data and information for community networks to use for developing epidemiological profiles |
| Lucie & André Chagnon Foundation | Canada’s largest private family foundation, which is the provincial government’s partner in developing QEF as funding mechanism. Has six members that serve on the board of QEF. |
| Quebec provincial government | The provincial government has six members that serve on the board of QEF. |

5.2. Interactions between Structures and Human Agency
| Categories | Types of Data |
|---|---|
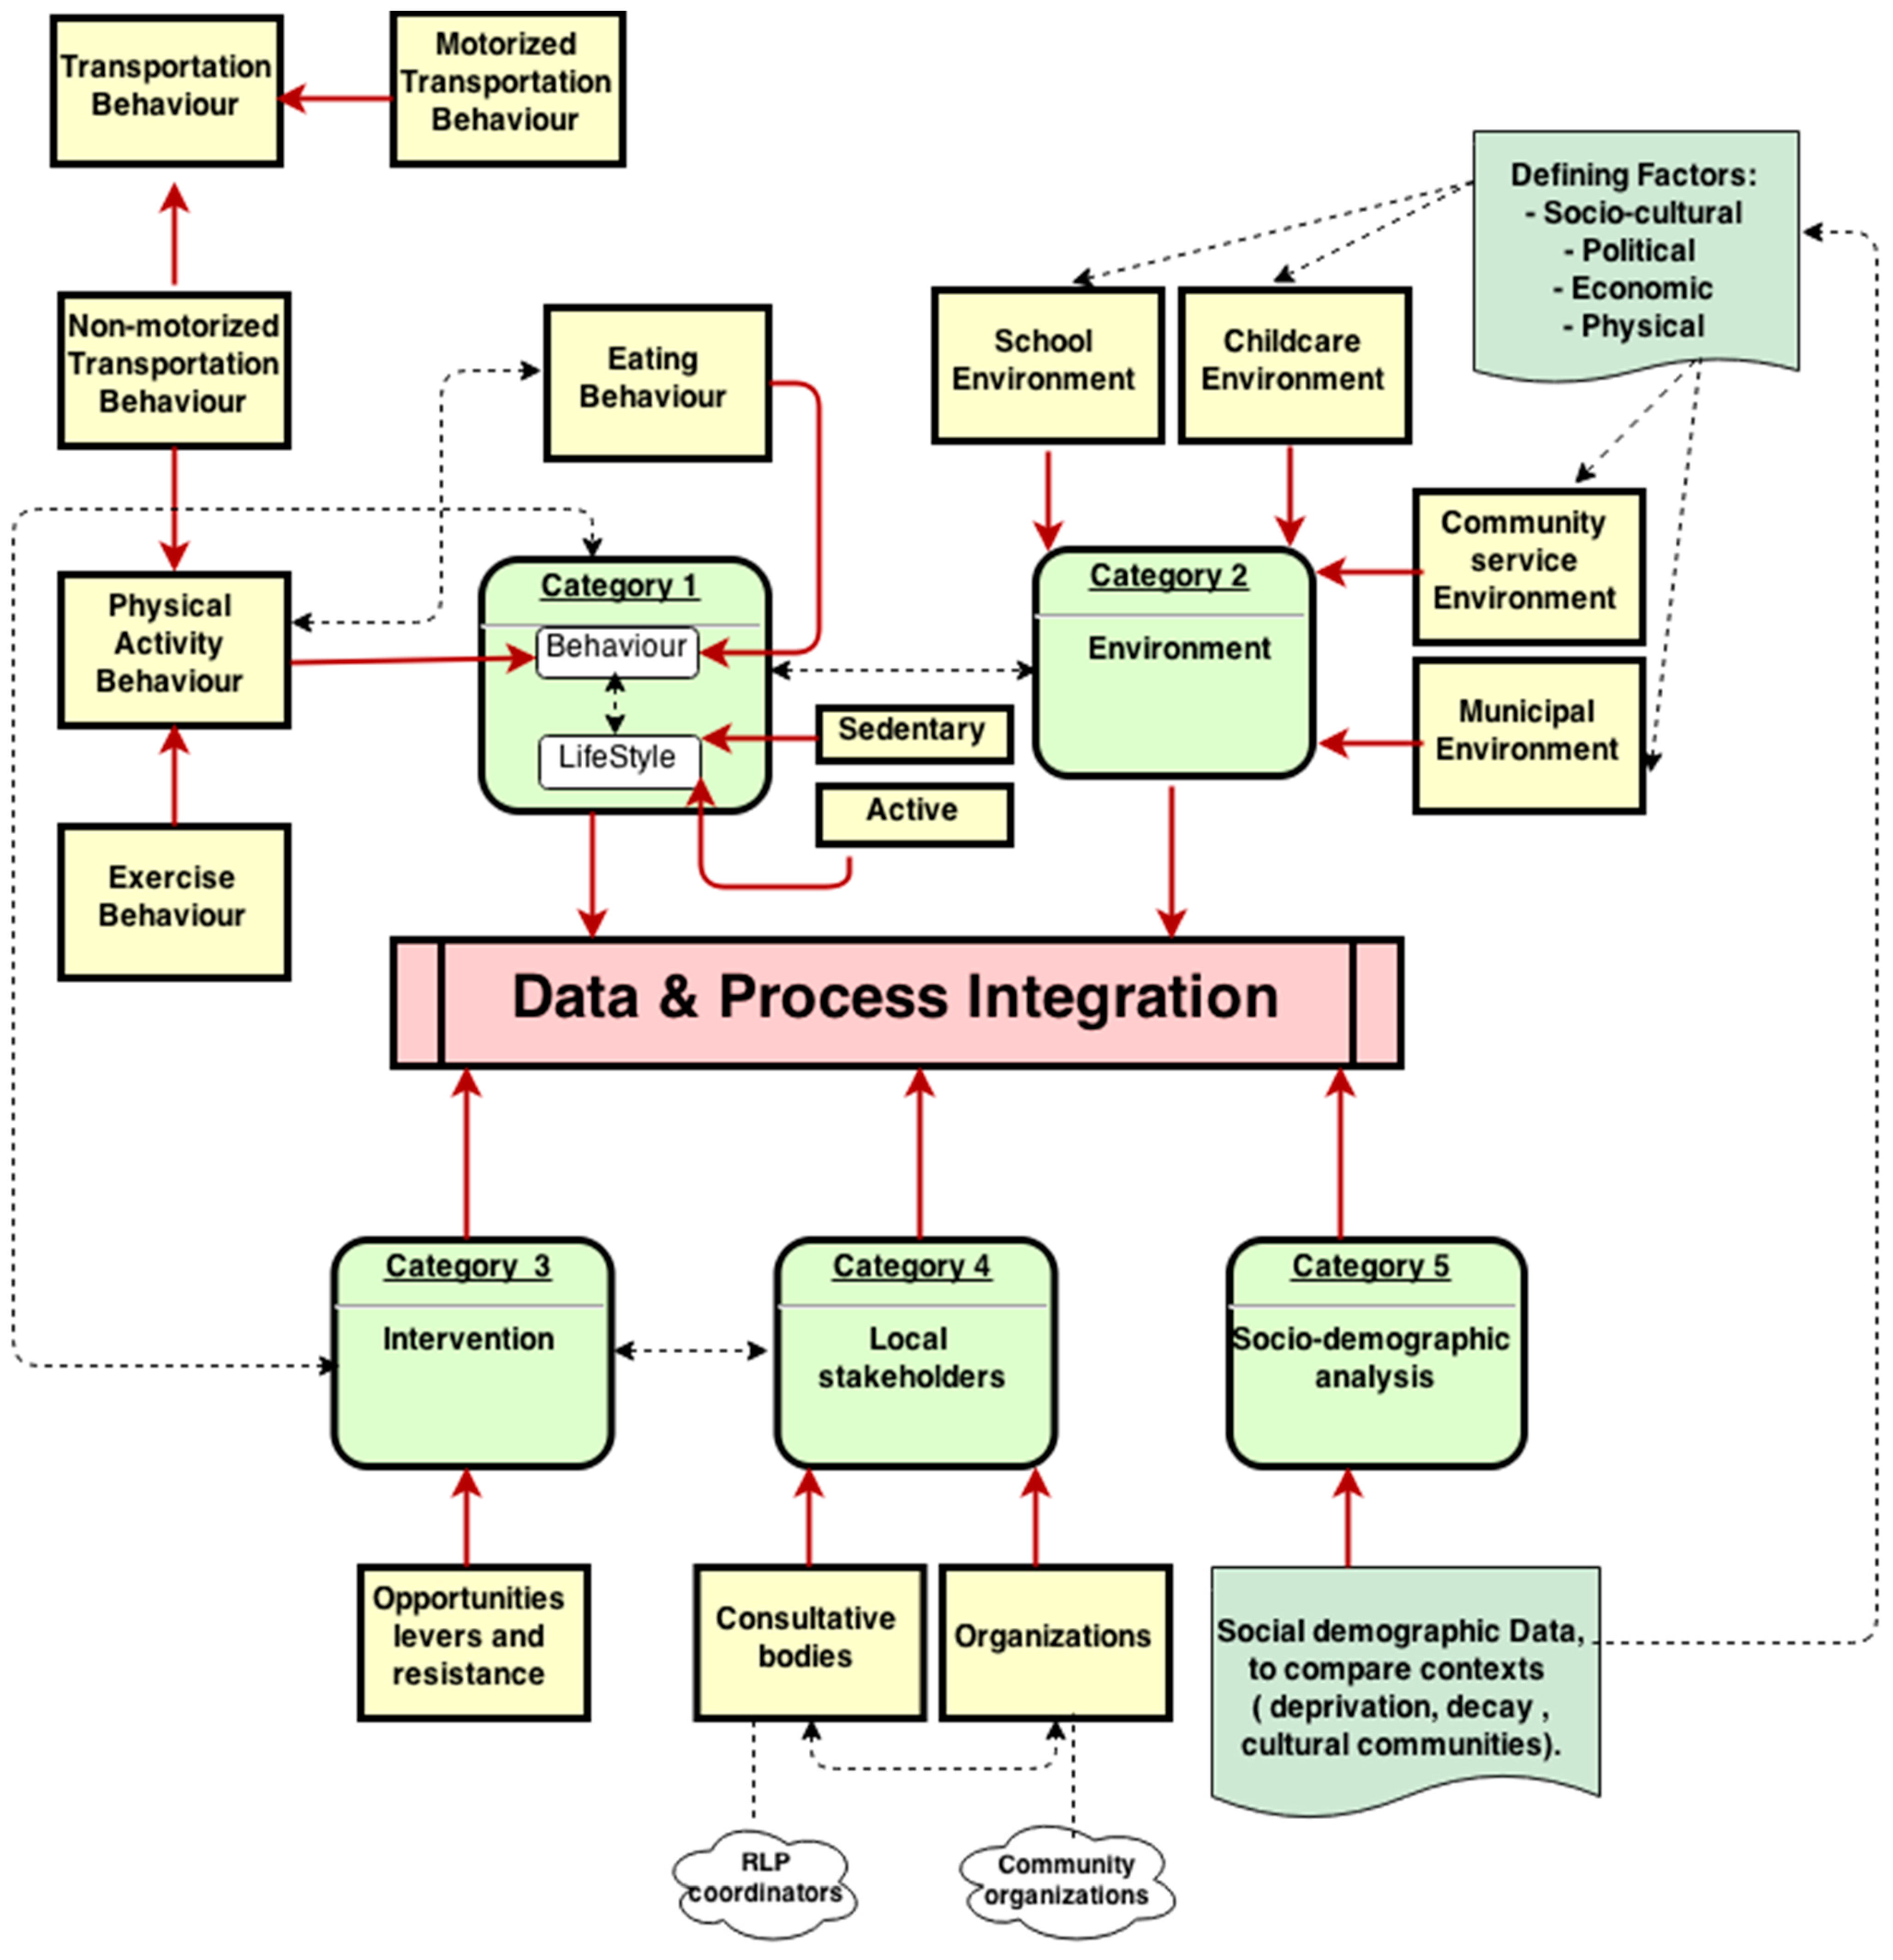
| Category 1 | Behaviors and lifestyles of young people in healthy eating and physical activity |
| Category 2 | Characteristics of environments (i.e., childcare, school, community services, municipal) that influence healthy eating and physical activity (political, economic, socio-cultural, physical) |
| Category 3 | Opportunities, levers and resistance faced in the community for influencing healthy eating and physical activity |
| Category 4 | Information on local stakeholders and their roles (organizations, consultative bodies, etc.) |
| Category 5 | Socio-demographic data, information and knowledge to compare contexts (deprivation, decay, cultural communities) |
5.3. Temporal Interconnectedness and Non-Linearity of Processes
5.4. Complex Links between Processes and Outcomes
6. Results and Discussion of Mappings
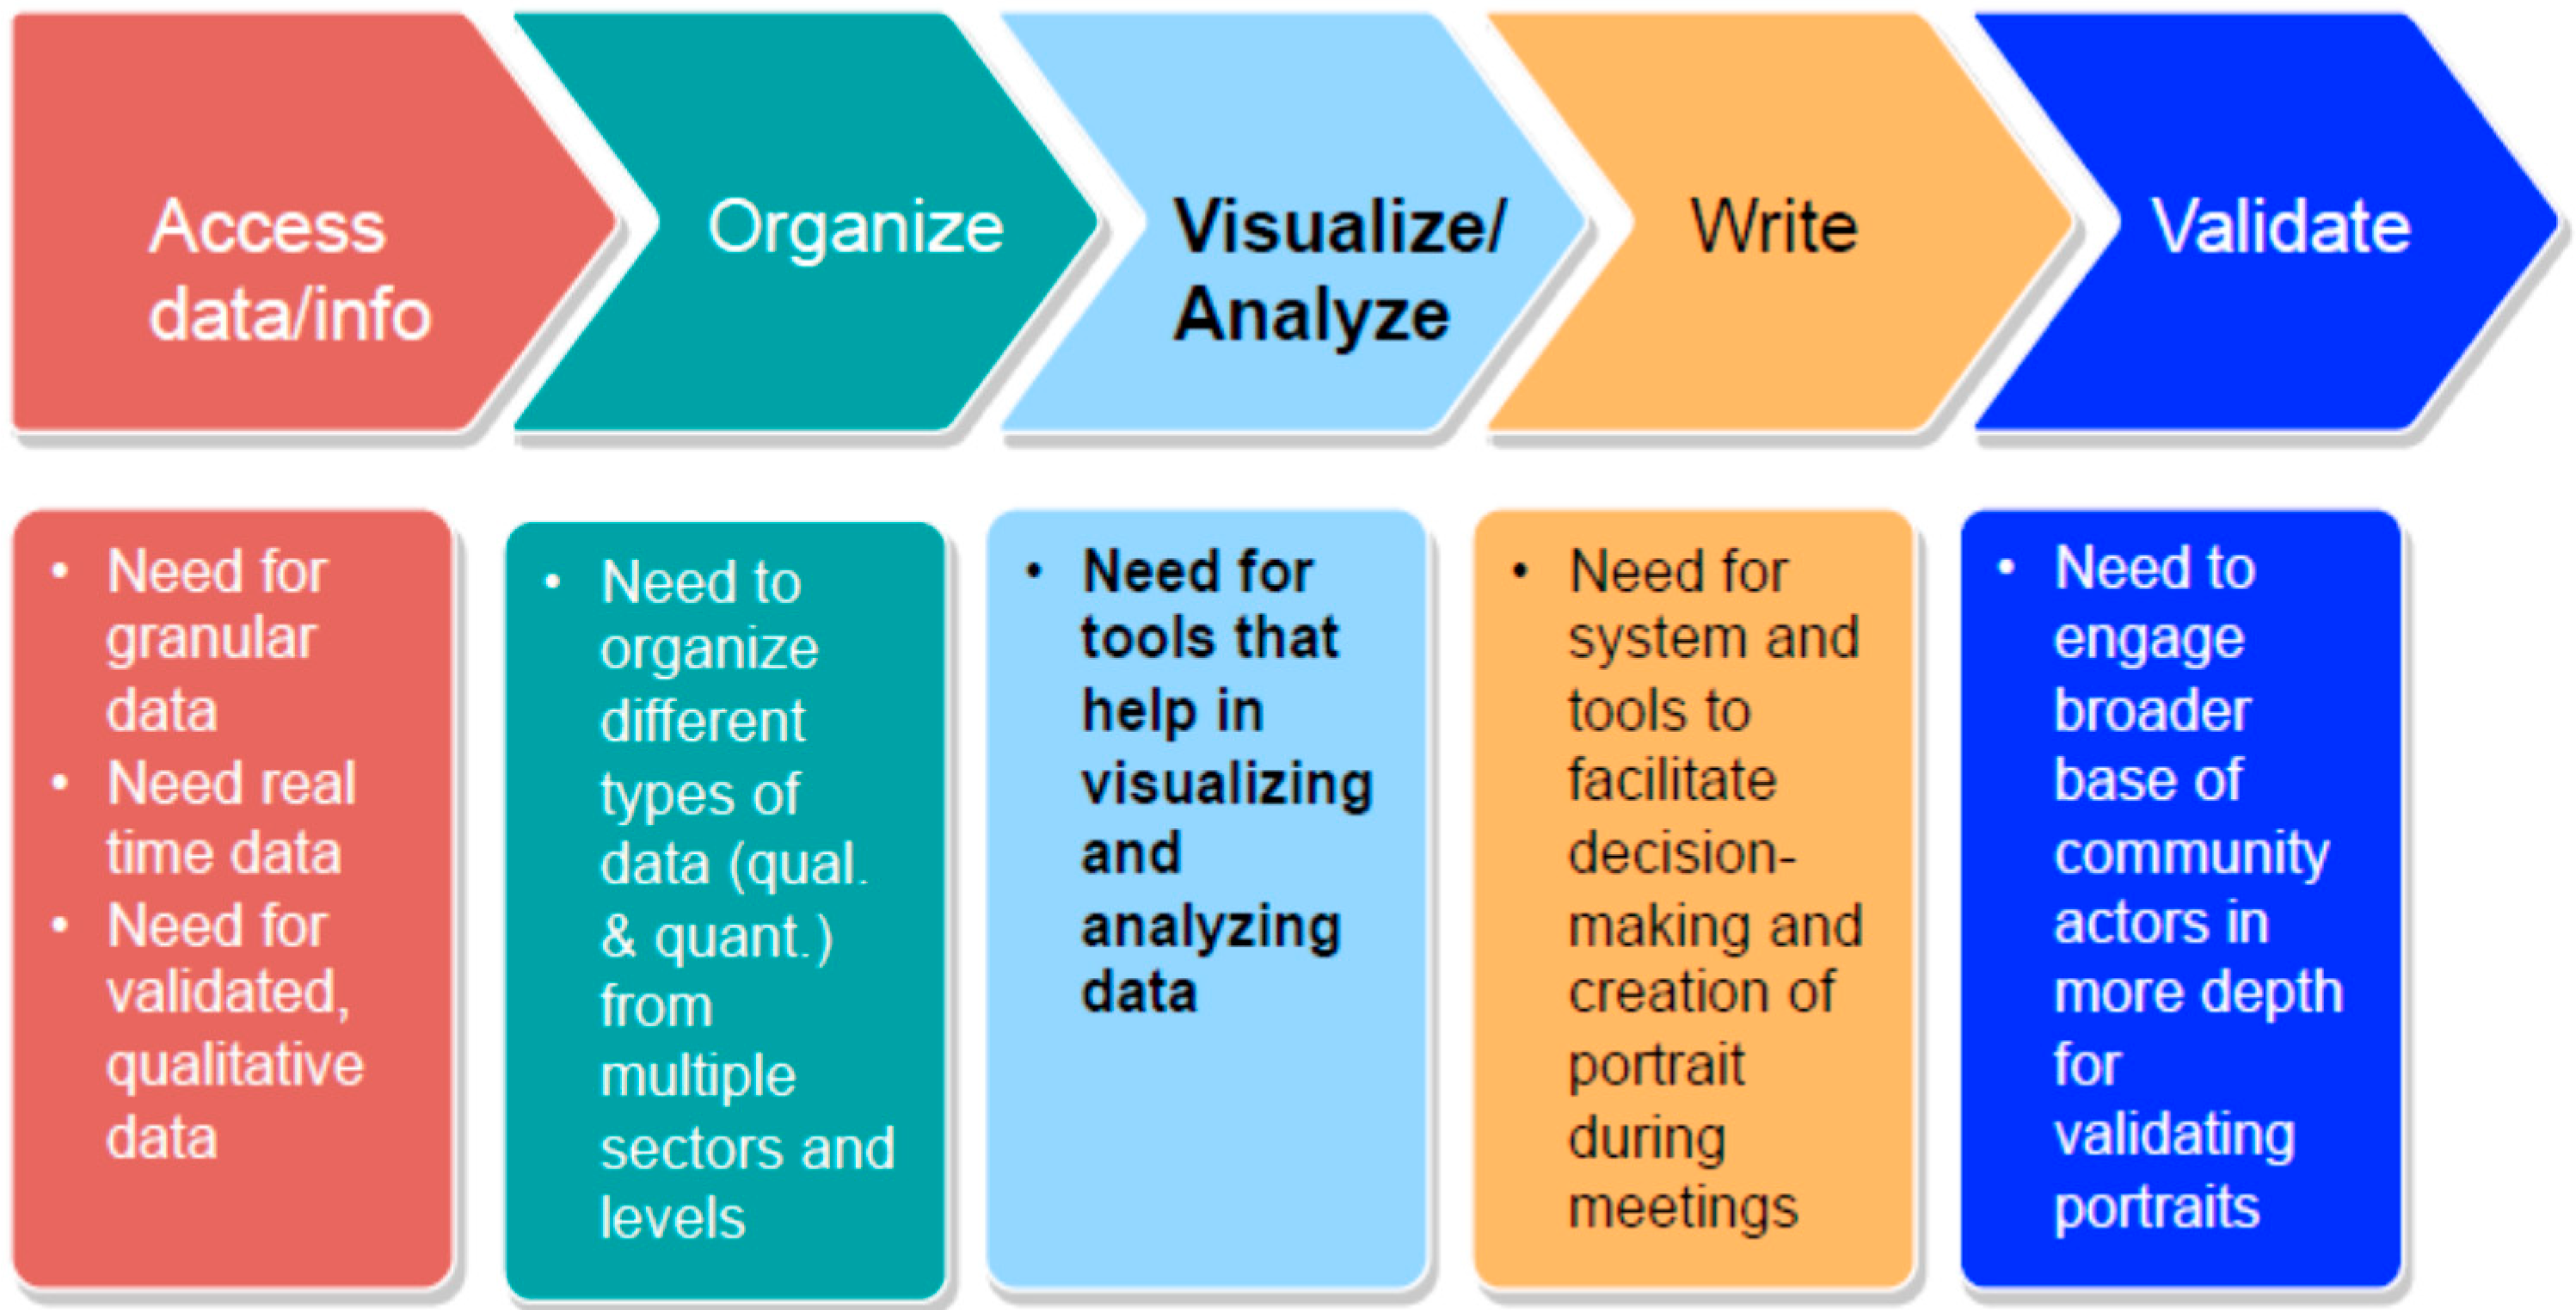
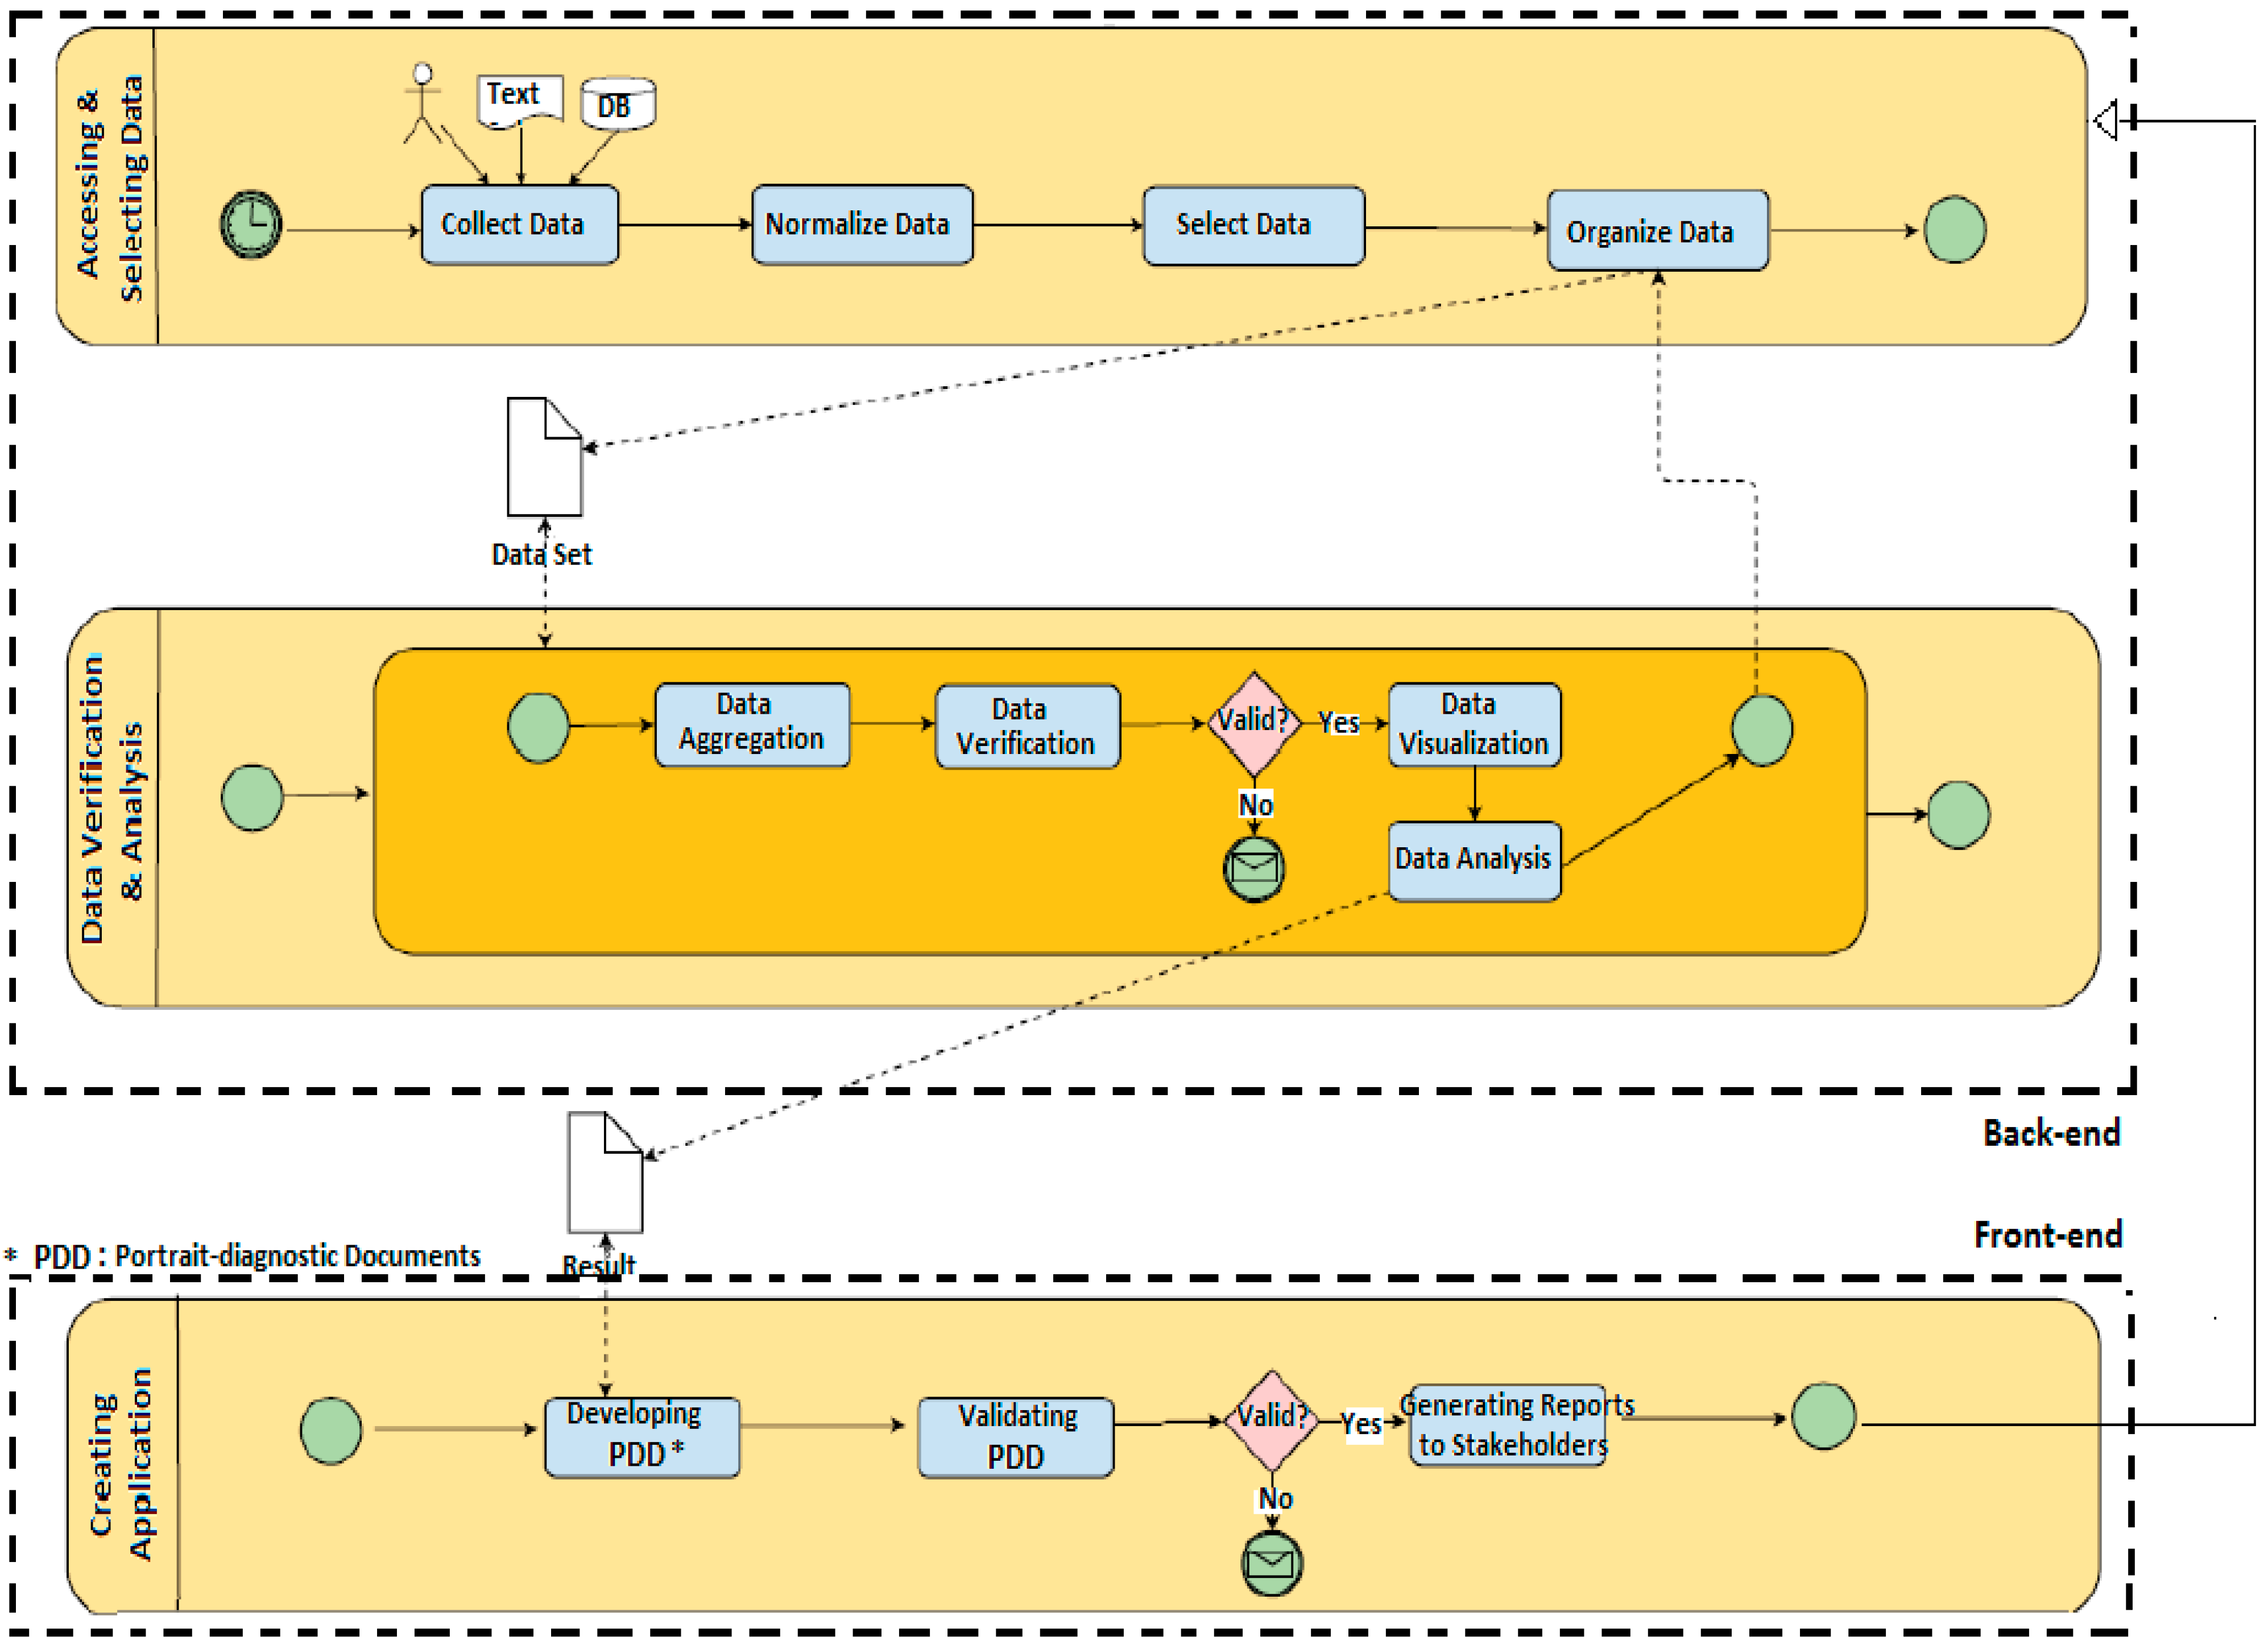
6.1. Process Mapping

6.2. Mapping of Data

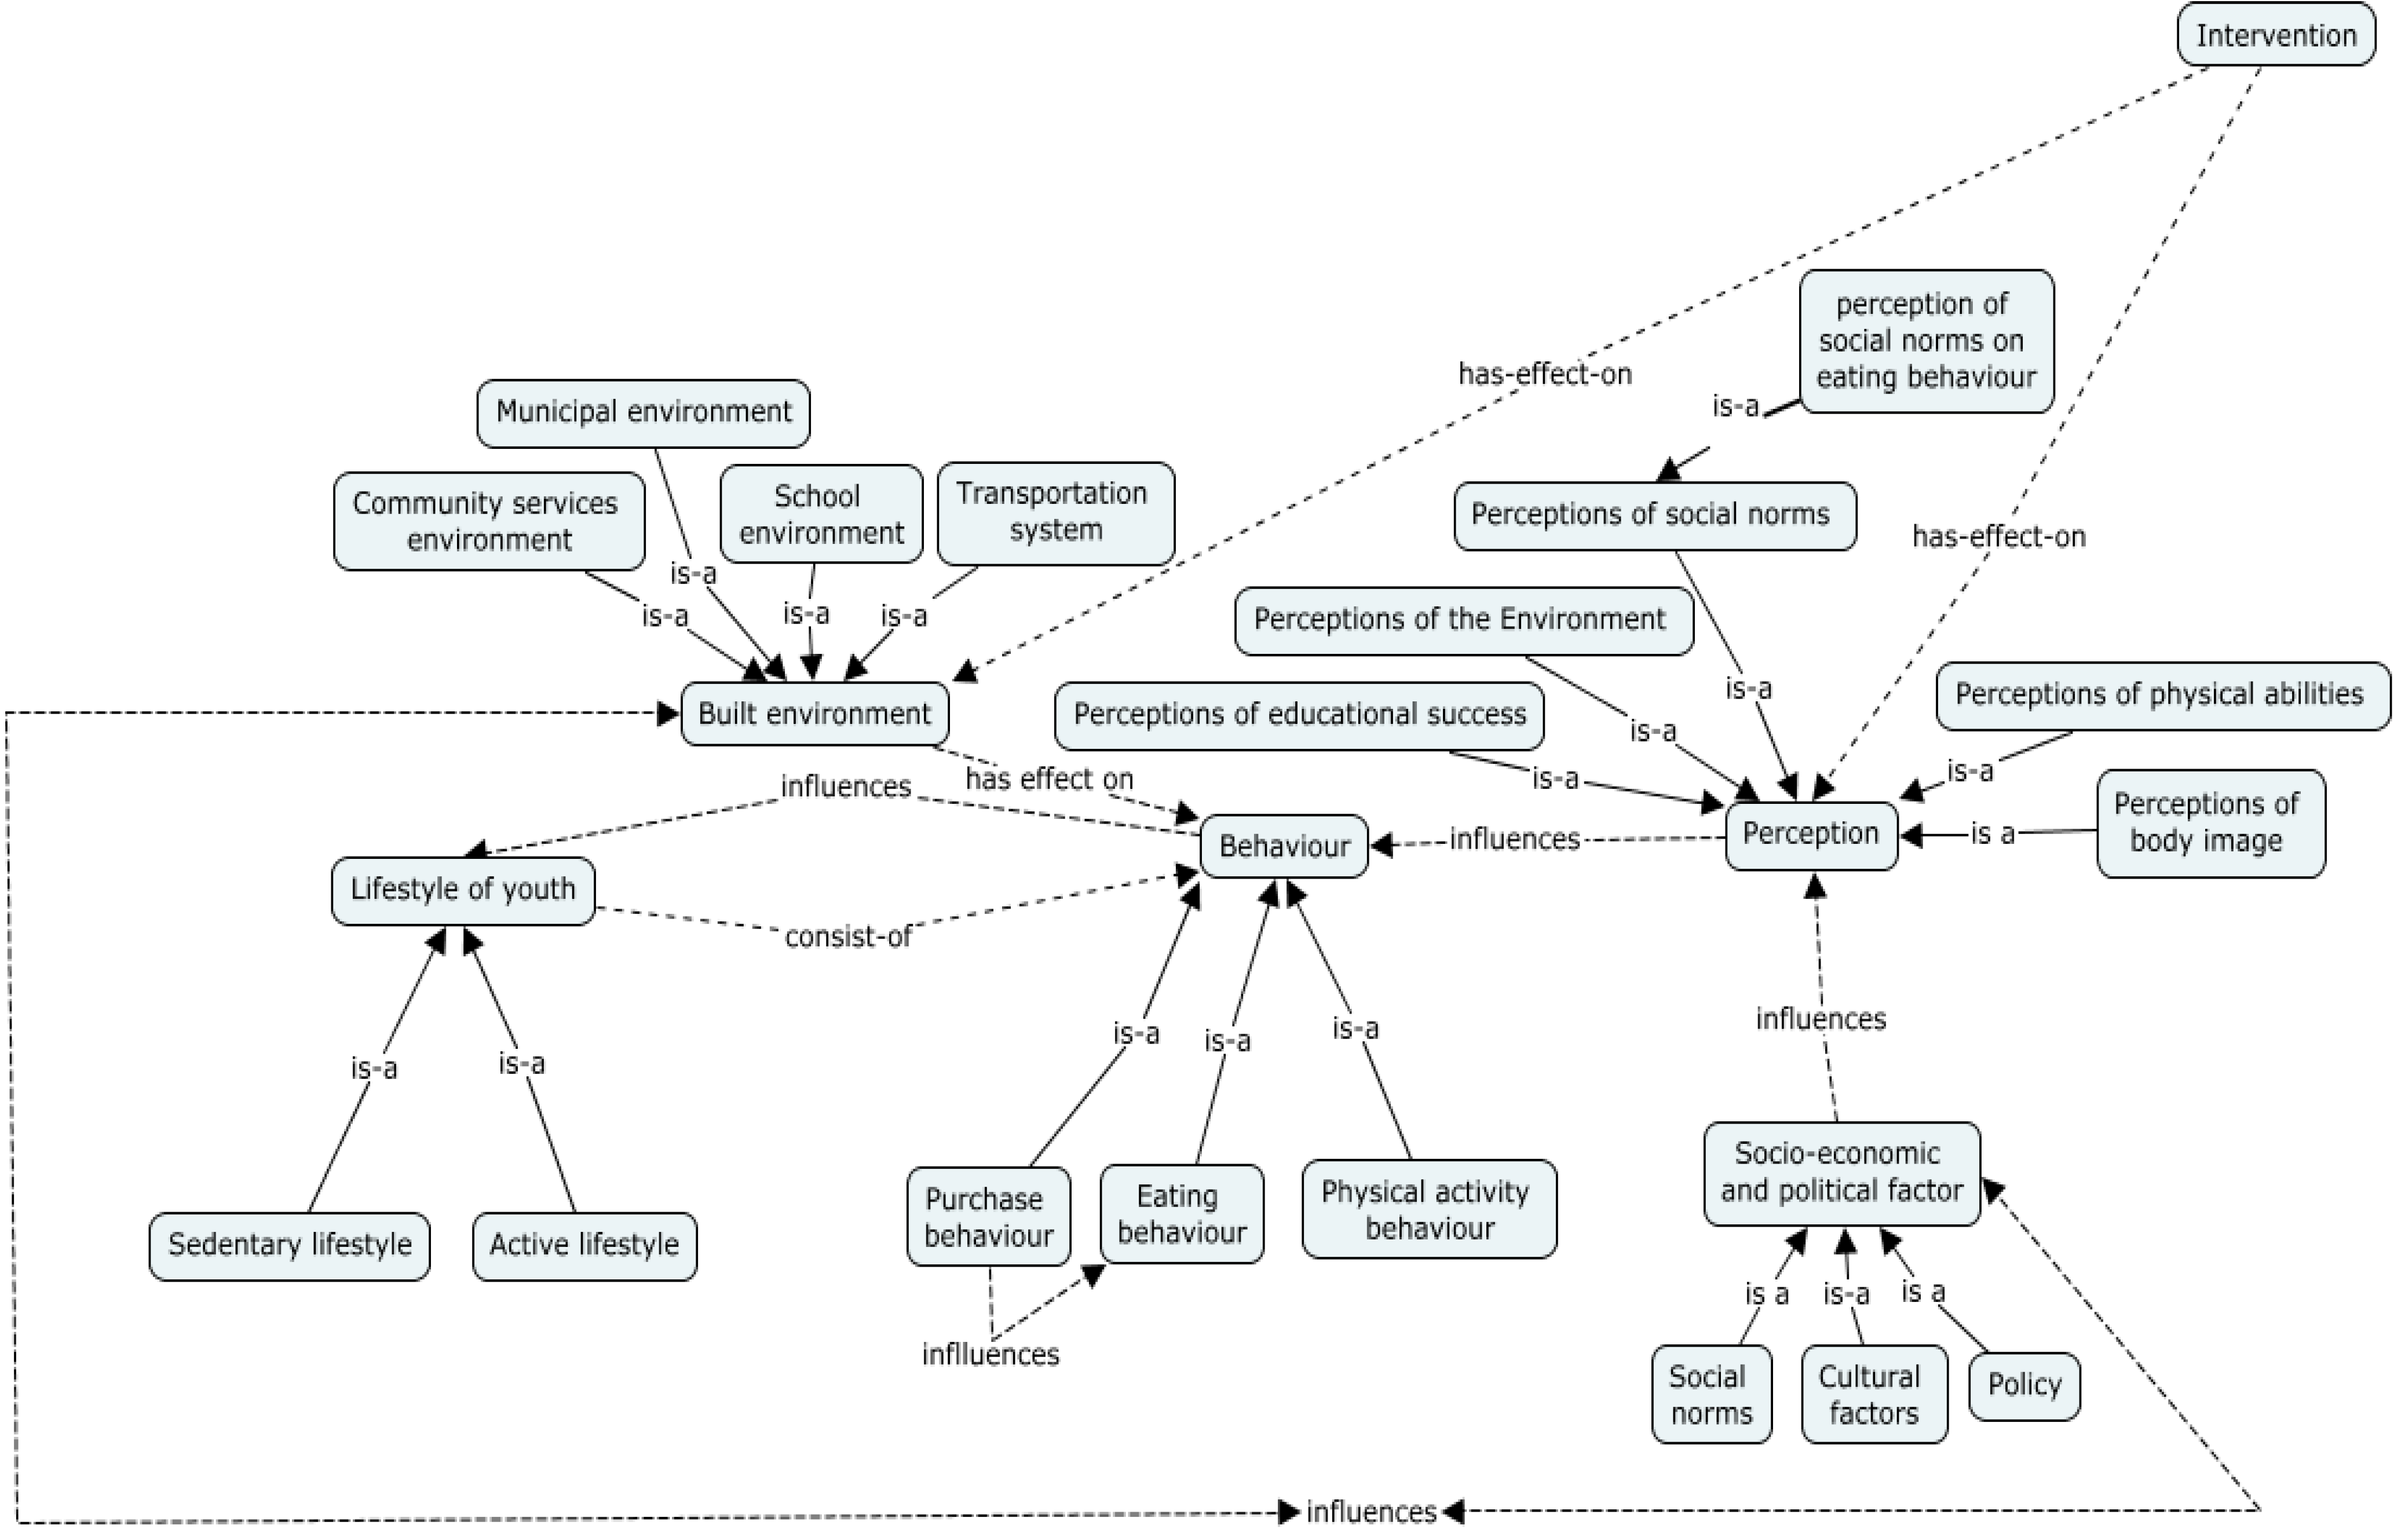
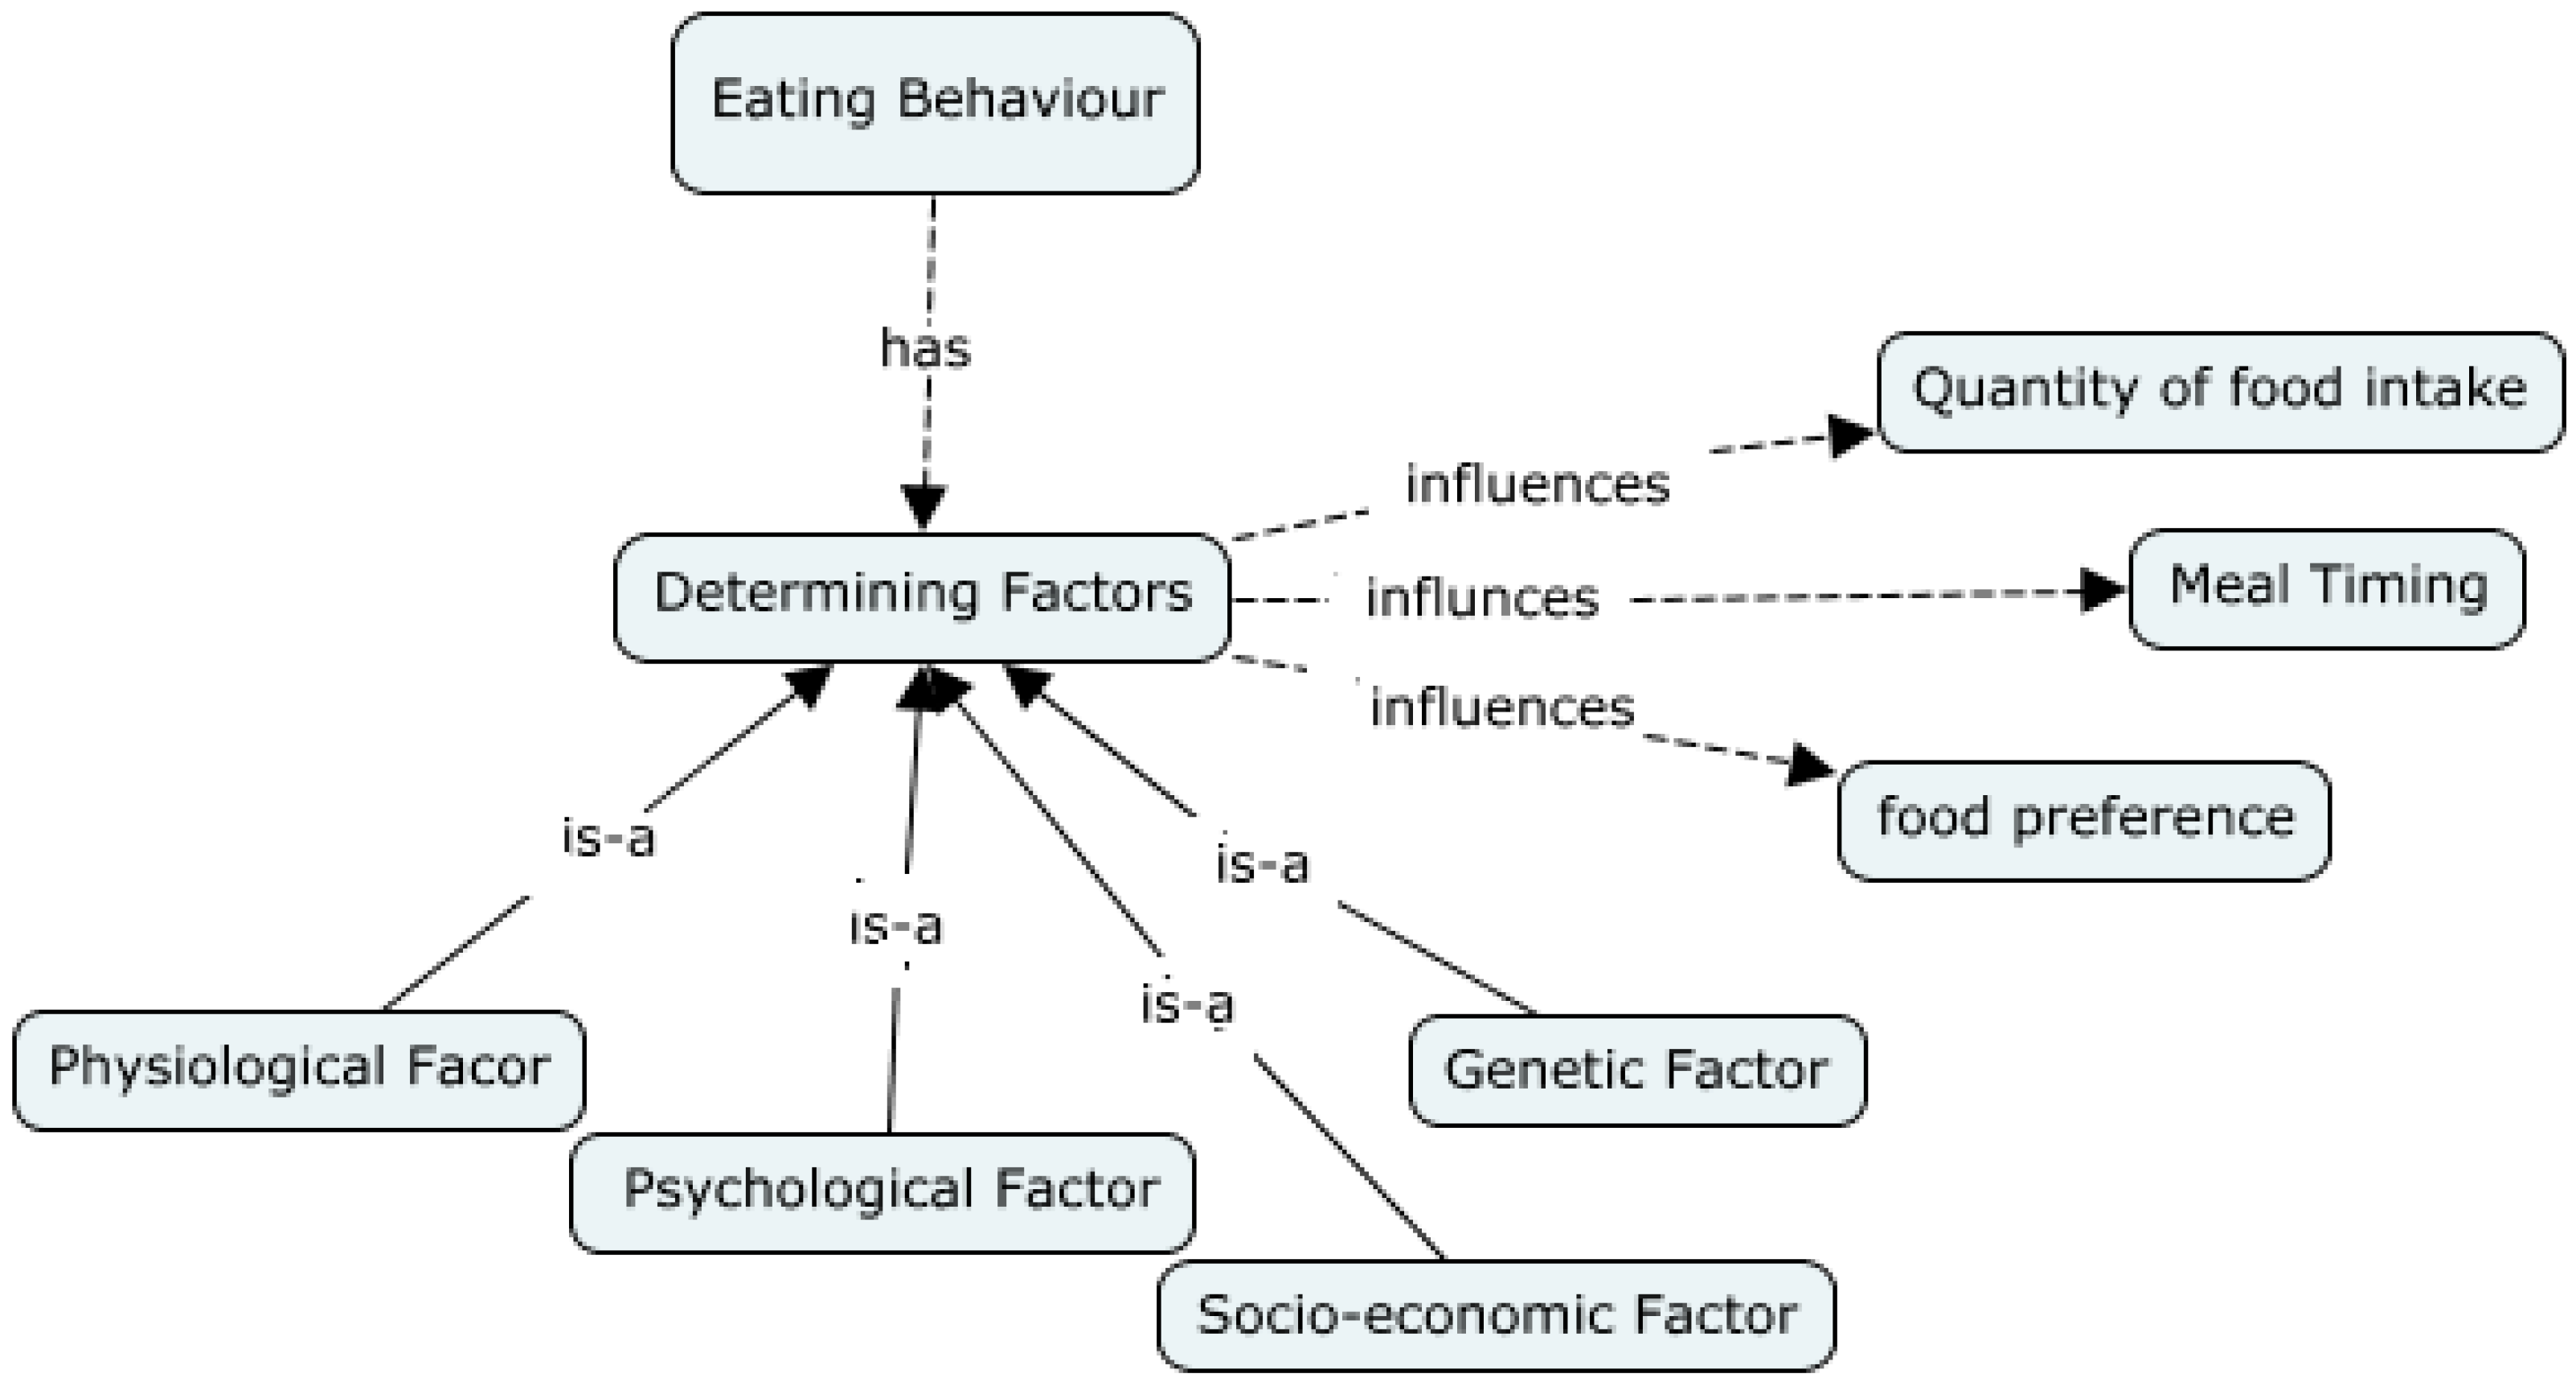
6.3. Conceptual Mapping


7. Conclusions and Future Work
Acknowledgements
Author Contributions
Conflicts of Interest
References
- Dubé, L.; Addy, N.A.; Blouin, C.; Drager, N. From policy coherence to 21st century convergence: A whole-of-society paradigm of human and economic development. Ann. N. Y. Acad. Sci. 2014, 1331, 201–215. [Google Scholar] [CrossRef] [PubMed]
- Steets, J. Developing a Framework Concepts and Research Priorities for Partnership Accountability; Global Public Policy Institute (GPPI): Berlin, Germany, 2005. [Google Scholar]
- Steurer, R.; Langer, M.; Konrad, A.; Martinuzzi, R.-A. Corporations, stakeholders and sustainable development I: A theoretical exploration of business-society relations. J. Bus. Ethics 2005, 61, 263–281. [Google Scholar] [CrossRef]
- Steurer, R. Mapping stakeholder theory anew: From the ‘stakeholder theory of the firm’ to three perspectives on business-society-relations. Bus. Strategy Environ. 2006, 15, 55–69. [Google Scholar] [CrossRef]
- Donaldson, T.; Preston, L.E. The stakeholder theory of the corporation: Concepts, evidence, and implications. Acad. Manage. Rev. 1995, 20, 65–91. [Google Scholar]
- Bäckstrand, K. Multi-stakeholder partnerships for sustainable development: Rethinking legitimacy accountability and effectiveness. Eur. Environ. 2006, 16, 290–306. [Google Scholar] [CrossRef]
- Fink, K.; Ploder, C.; Roithmayr, F. Multi-functional stakeholder information system for strategic knowledge management: Theoretical concept and case studies. In Emerging Trends and Challenges in Information Technology Management; Khosrow-Pour, M., Ed.; Idea Group Inc. (IGI): Washington, DC, USA, 2006; Volume 1. [Google Scholar]
- Addy, N.A.; Poirier, A.; Blouin, C.; Drager, N.; Dubé, L. Whole-of-society approach for public health policymaking: A case study of polycentric governance from Quebec, Canada. Ann. N. Y. Acad. Sci. 2014, 1331, 216–229. [Google Scholar] [CrossRef] [PubMed]
- Elmslie, K. Against the Growing Burden of Disease; Centre for Chronic disease Prevention, Public Health Agency of Canada: Ottawa, Canada, 2012. [Google Scholar]
- Lucie and André Chagnon Foundation. Portrait of the Founding Family. Available online: http://fondationchagnon.org/en/who-we-are/portrait-of-the-founding-family.aspx (accessed on 15 January 2015).
- Québec en Forme. History. Available online: http://www.quebecenforme.org/en/about-us/history.aspx (accessed on 15 January 2015).
- Québec en Forme. Québec en Forme 2010–2011 Annual Report; Québec en Forme: Trois-Rivières, Québec, Canada, 2012. [Google Scholar]
- Québec en Forme. Cadre d’évaluation de la Performance de Québec en Forme. Rapport Déposé au Conseil d’administration du 3 Octobre 2013; Québec en Forme: Trois-Rivières, QC, Canada, 2013. [Google Scholar]
- Québec en Forme. Outil d’évaluation des Conditions Gagnantes Chez les rlp Soutenus par Québec en Forme: Assistant d’Analyse à l’intention des Équipes Régionales (Version Finale Pour les Fins de l’Analyse du Printemps 2014); Québec en Forme: Trois-Rivières, QC, Canada, 2014. [Google Scholar]
- Novak, J.D.; Cañas, A.J. The theory underlying concept maps and how to construct them, technical report. In IHMC CmapTools 2006–01 Rev 01–2008; Florida Institute for Human and Machine Cognition: Pensacola, FL, USA, 2008. [Google Scholar]
- Gruber, T.R. A translation approach to portable ontology specifications. Knowl. Acquis. 1993, 5, 199–220. [Google Scholar] [CrossRef]
- W3C OWL Working Group. OWL 2 Web Ontology Language. Available online: www.w3.org/TR/owl2-overview/ (accessed on 15 Janaury 2015).
- Borys, J.M.; Le Bodo, Y.; Jebb, S.A.; Seidell, J.C.; Summerbell, C.; Richard, D.; De Henauw, S.; Moreno, L.A.; Romon, M.; Visscher, T.L.; et al. Epode approach for childhood obesity prevention:methods, progress and international development. Obes. Rev. 2011, 13, 299–315. [Google Scholar] [CrossRef] [PubMed] [Green Version]
- Cefkin, M.; Glissman, S.M.; Haas, P.J.; Jalali, L.; Maglio, P.P.; Selinger, P.; Tan, W. SPLASH: A progress report on building a platform for a 360 degree view of health. In Proceedings of the 5th INFORMS DM-HI Workshop, Austin, TX, USA, 6 November 2010.
- Shaban-Nejad, A.; Buckeridge, D.L.; Dubé, L. COPE: Childhood obesity prevention [knowledge] enterprise. In Proceedings of the 13th Conference on Artificial Intelligence in Medicine (AIME 2011), Bled, Slovenia, 2–6 July 2011.
- El-Hachem, J.; Shaban-Nejad, A.; Haarslev, V.; Dubé, L.; Buckeridge, D.L. An OWL 2-based knowledge platform combining the social and semantic webs for an ambient childhood obesity prevention system. Proced. Comput. Sci. 2012, 10, 110–119. [Google Scholar] [CrossRef] [Green Version]
- Scala, P.L.; Di Pasquale, D.; Tresoldi, D.; Lafortuna, C.L.; Rizzo, G.; Padula, M. Ontology-supported clinical profiling for the evaluation of obesity and related comorbidities. Stud. Health Technol. Inform. 2012, 180, 1025–1029. [Google Scholar] [PubMed]
- Sojic, A.; Terkaj, W.; Contini, G.; Sacco, M. Towards a teenager tailored ontology—Supporting inference about the obesity-related health status. In Ontologies and Data in Life Sciences (ODLS); Jansen, L., Boeker, M., Herre, H., Loebe, F., Eds.; Institut für Medizinische Informatik, Statistik und Epidemiologie (IMISE) Nr. 1/14, Universität Leipzig: Leipzig, Germany, 2014; pp. 42–47. [Google Scholar]
- Calvanese, D.; De Giacomo, G.; Lenzerini, M. A framework for ontology integration. The emerging semantic web. In Proceedings of the First Semantic Web Working Symposium, Frontiers in Artificial Intelligence and Applications, Stanford University, Stanford, CA, USA, 30 July–1 August 2002.
- Gangemi, A.; Pisanelli, D.; Steve, G. Ontology integration: Experiences with medical terminologies. In Formal Ontology in Information Systems; IOS Press: Amsterdam, The Netherlands, 1998; Volume 46, pp. 163–178. [Google Scholar]
- Food and Agriculture Organization (FAO). Agrovoc: A Controlled Vocabulary Covering All Areas of Interest of the Food and Agriculture Organization (FAO). Available online: www4.fao.org/faobib/kwocinana.html (accessed on 15 Janaury 2015).
- Donnelly, K. SNOMED-CT: The advanced terminology and coding system for eHealth. Stud. Health Technol. Inform. 2006, 121, 279–290. [Google Scholar] [PubMed]
- Smith, B.; Ceusters, W.; Klagges, B.; Köhler, J.; Kumar, A.; Lomax, J.; Mungall, C.; Neuhaus, F.; Rector, A.L.; Rosse, C. Relations in biomedical ontologies. Genome Biol. 2005, 6. [Google Scholar] [CrossRef] [Green Version]
- Andriof, J.; Waddock, S. Unfolding Stakeholder Thinking I and II; Greenleaf-Publishing Limited: Sheffield, South Yorkshire, UK, 2002. [Google Scholar]
- Pettigrew, A.M. What is a processual analysis? Scand. J. Manage. 1997, 13, 337–348. [Google Scholar] [CrossRef]
- Shaban-Nejad, A.; Ormandjieva, O.; Kassab, M.; Haarslev, V. Managing requirement volatility in an ontology-driven clinical LIMS using category theory. Int. J. Telemed. Appl. 2009. [Google Scholar] [CrossRef]
- Karnik, S.; Kanekar, A. Childhood obesity: A global public health crisis. Int. J. Prev. Med. 2012, 3, 1–7. [Google Scholar] [PubMed]
- Buckeridge, D.; Izadi, M.; Shaban-Nejad, A.; Mondor, L.; Jauvin, C.; Dubé, L.; Jang, Y.; Tamblyn, R. An infrastructure for real-time population health assessment and monitoring. IBM J. Res. Dev. 2012, 56, 2:1–2:11. [Google Scholar] [CrossRef]
© 2015 by the authors; licensee MDPI, Basel, Switzerland. This article is an open access article distributed under the terms and conditions of the Creative Commons Attribution license (http://creativecommons.org/licenses/by/4.0/).
Share and Cite
Addy, N.A.; Shaban-Nejad, A.; Buckeridge, D.L.; Dubé, L. An Innovative Approach to Addressing Childhood Obesity: A Knowledge-Based Infrastructure for Supporting Multi-Stakeholder Partnership Decision-Making in Quebec, Canada. Int. J. Environ. Res. Public Health 2015, 12, 1314-1333. https://doi.org/10.3390/ijerph120201314
Addy NA, Shaban-Nejad A, Buckeridge DL, Dubé L. An Innovative Approach to Addressing Childhood Obesity: A Knowledge-Based Infrastructure for Supporting Multi-Stakeholder Partnership Decision-Making in Quebec, Canada. International Journal of Environmental Research and Public Health. 2015; 12(2):1314-1333. https://doi.org/10.3390/ijerph120201314
Chicago/Turabian StyleAddy, Nii Antiaye, Arash Shaban-Nejad, David L. Buckeridge, and Laurette Dubé. 2015. "An Innovative Approach to Addressing Childhood Obesity: A Knowledge-Based Infrastructure for Supporting Multi-Stakeholder Partnership Decision-Making in Quebec, Canada" International Journal of Environmental Research and Public Health 12, no. 2: 1314-1333. https://doi.org/10.3390/ijerph120201314