
Behavioral Response in the Immediate Aftermath of Shaking: Earthquakes in Christchurch and Wellington, New Zealand, and Hitachi, Japan

Abstract
:1. Introduction
2. Literature Review
2.1. Previous Research
2.2. Theoretical Framework
2.3. Research Questions and Hypotheses
- RQ1.
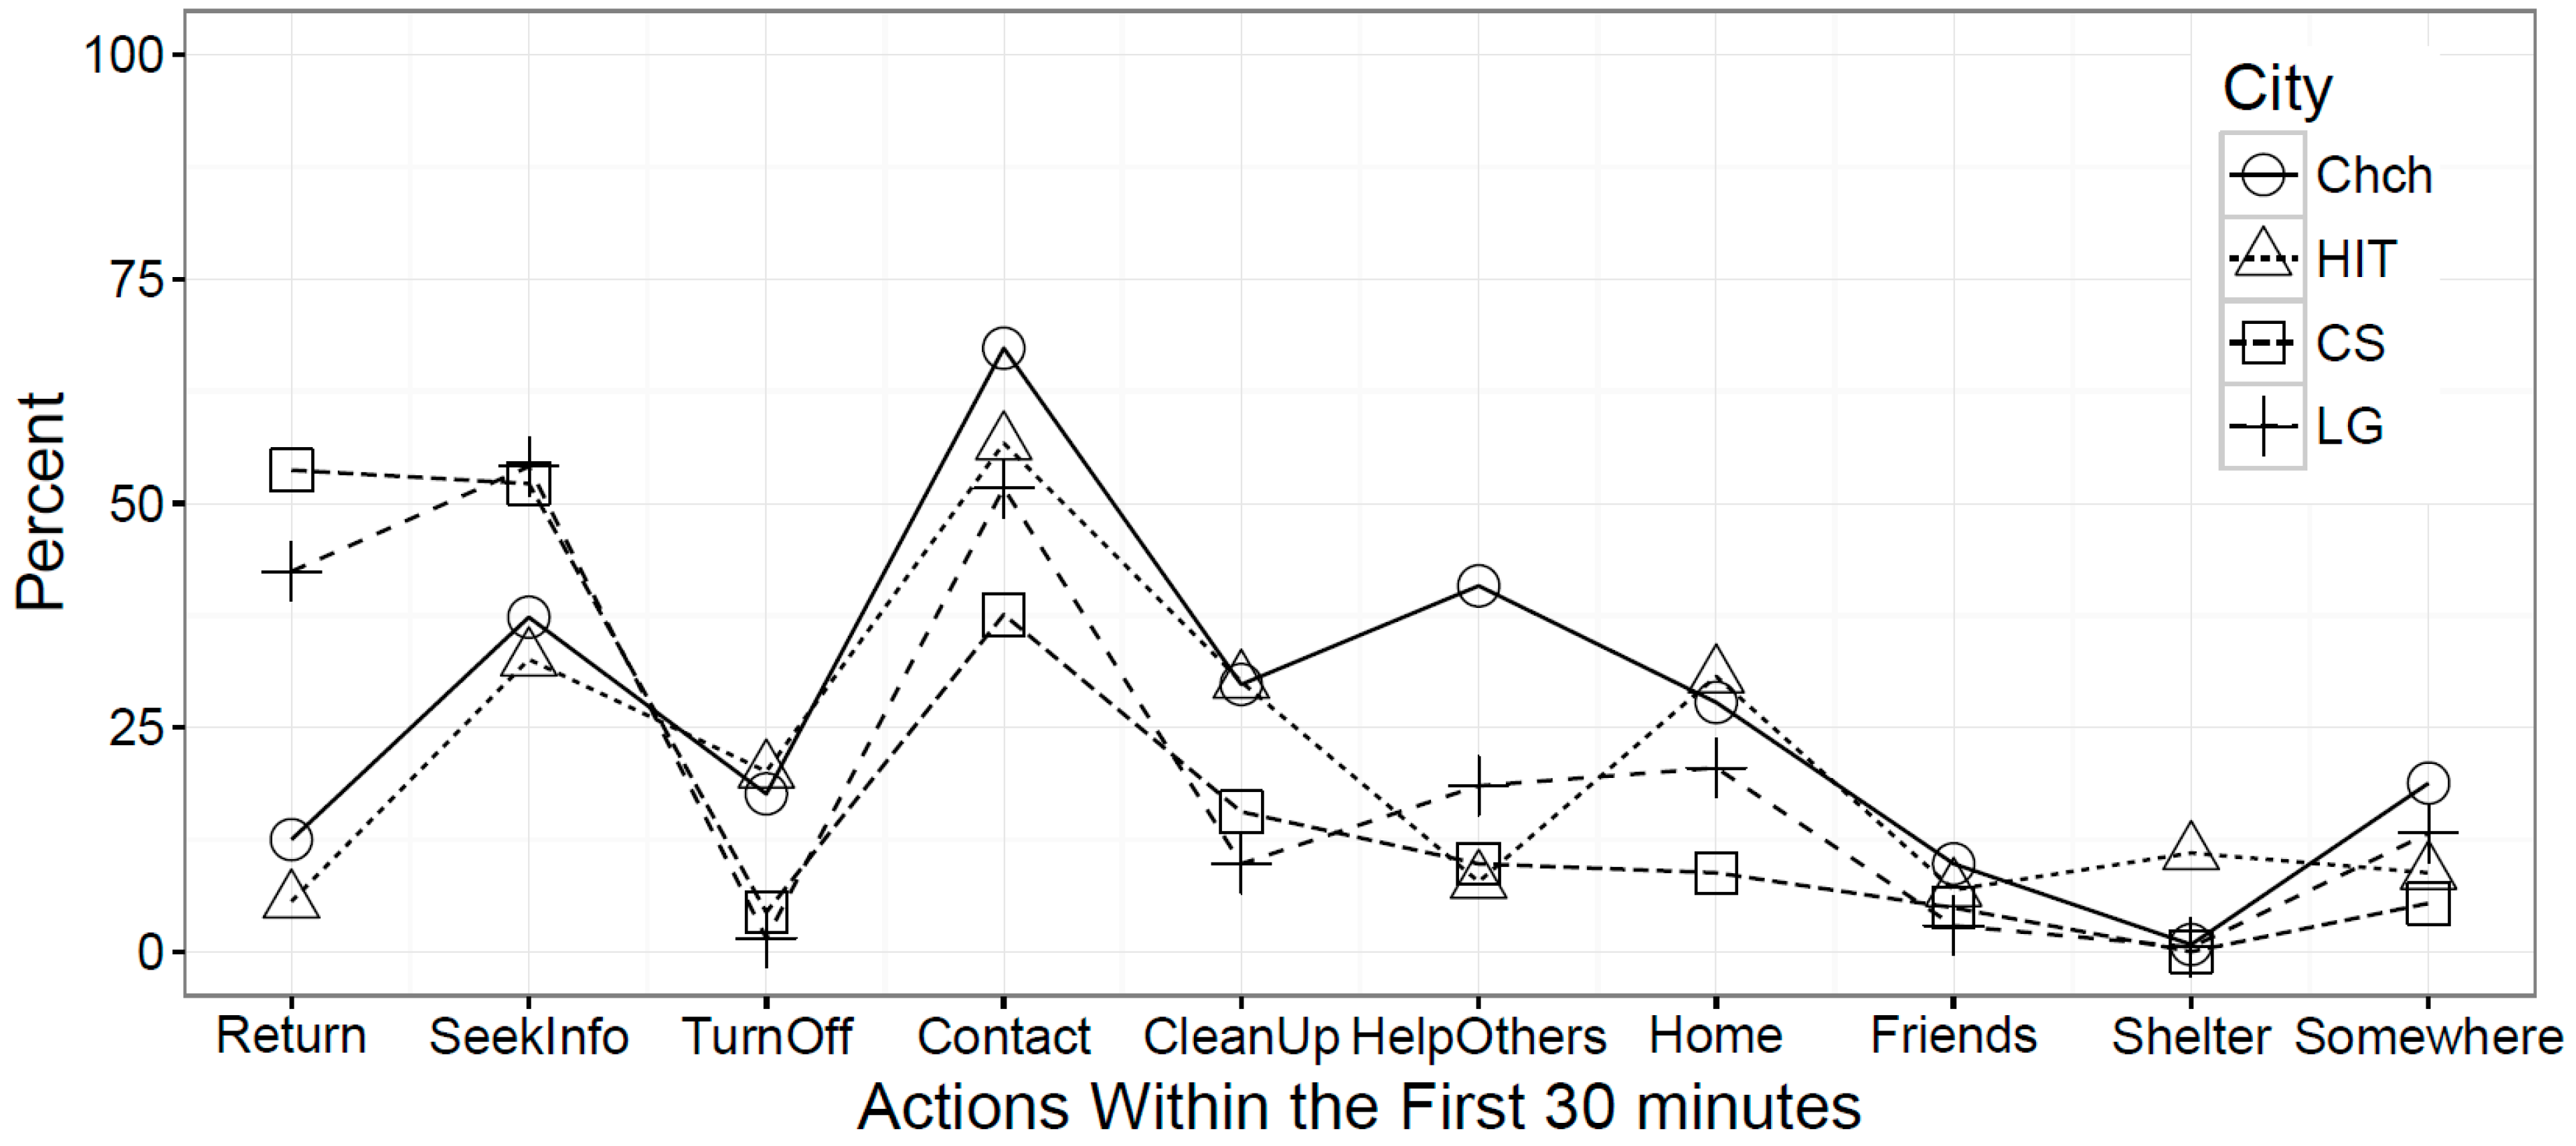
- How did behavior during the immediate aftermath (i.e., the next 30 min after shaking stopped) differ across earthquakes?
- RQ2.
- Do demographic variables, such as age, gender, and marital status, affect peoples’ behavior during the immediate aftermath?
- RQ3.
- Does earthquake experience and emergency preparedness affect behavior during the immediate aftermath?
- RQ4.
- Does physical context, such as being at home, affect behavior during the immediate aftermath?
- RQ5.
- Does household context, such as the location of family members, affect behavior during the immediate aftermath?
- RQ6.
- Does social context, such as whether the individual is with others, affect behavior during the immediate aftermath?
- RQ7.
- Do actions taken during shaking affect behavior during the immediate aftermath?
- RQ8.
- What communication channels were used to seek additional information about the situation and to contact separated household and/or family members?
- RH1.
- Perceived shaking intensity, risk perception and affective response are negatively correlated with returning to previous activities, but positively correlated with behaviors such as turning off utilities, contacting household members, cleaning up, and helping others.
- RH2.
- Home damage and infrastructure interruption are negatively correlated with returning to previous activities, but positively correlated with behaviors such as turning off utilities, contacting household members, cleaning up, and helping others.
- RH3.
- Injuries are positively correlated with helping others but negatively correlated with the other immediate aftermath actions.
3. Method
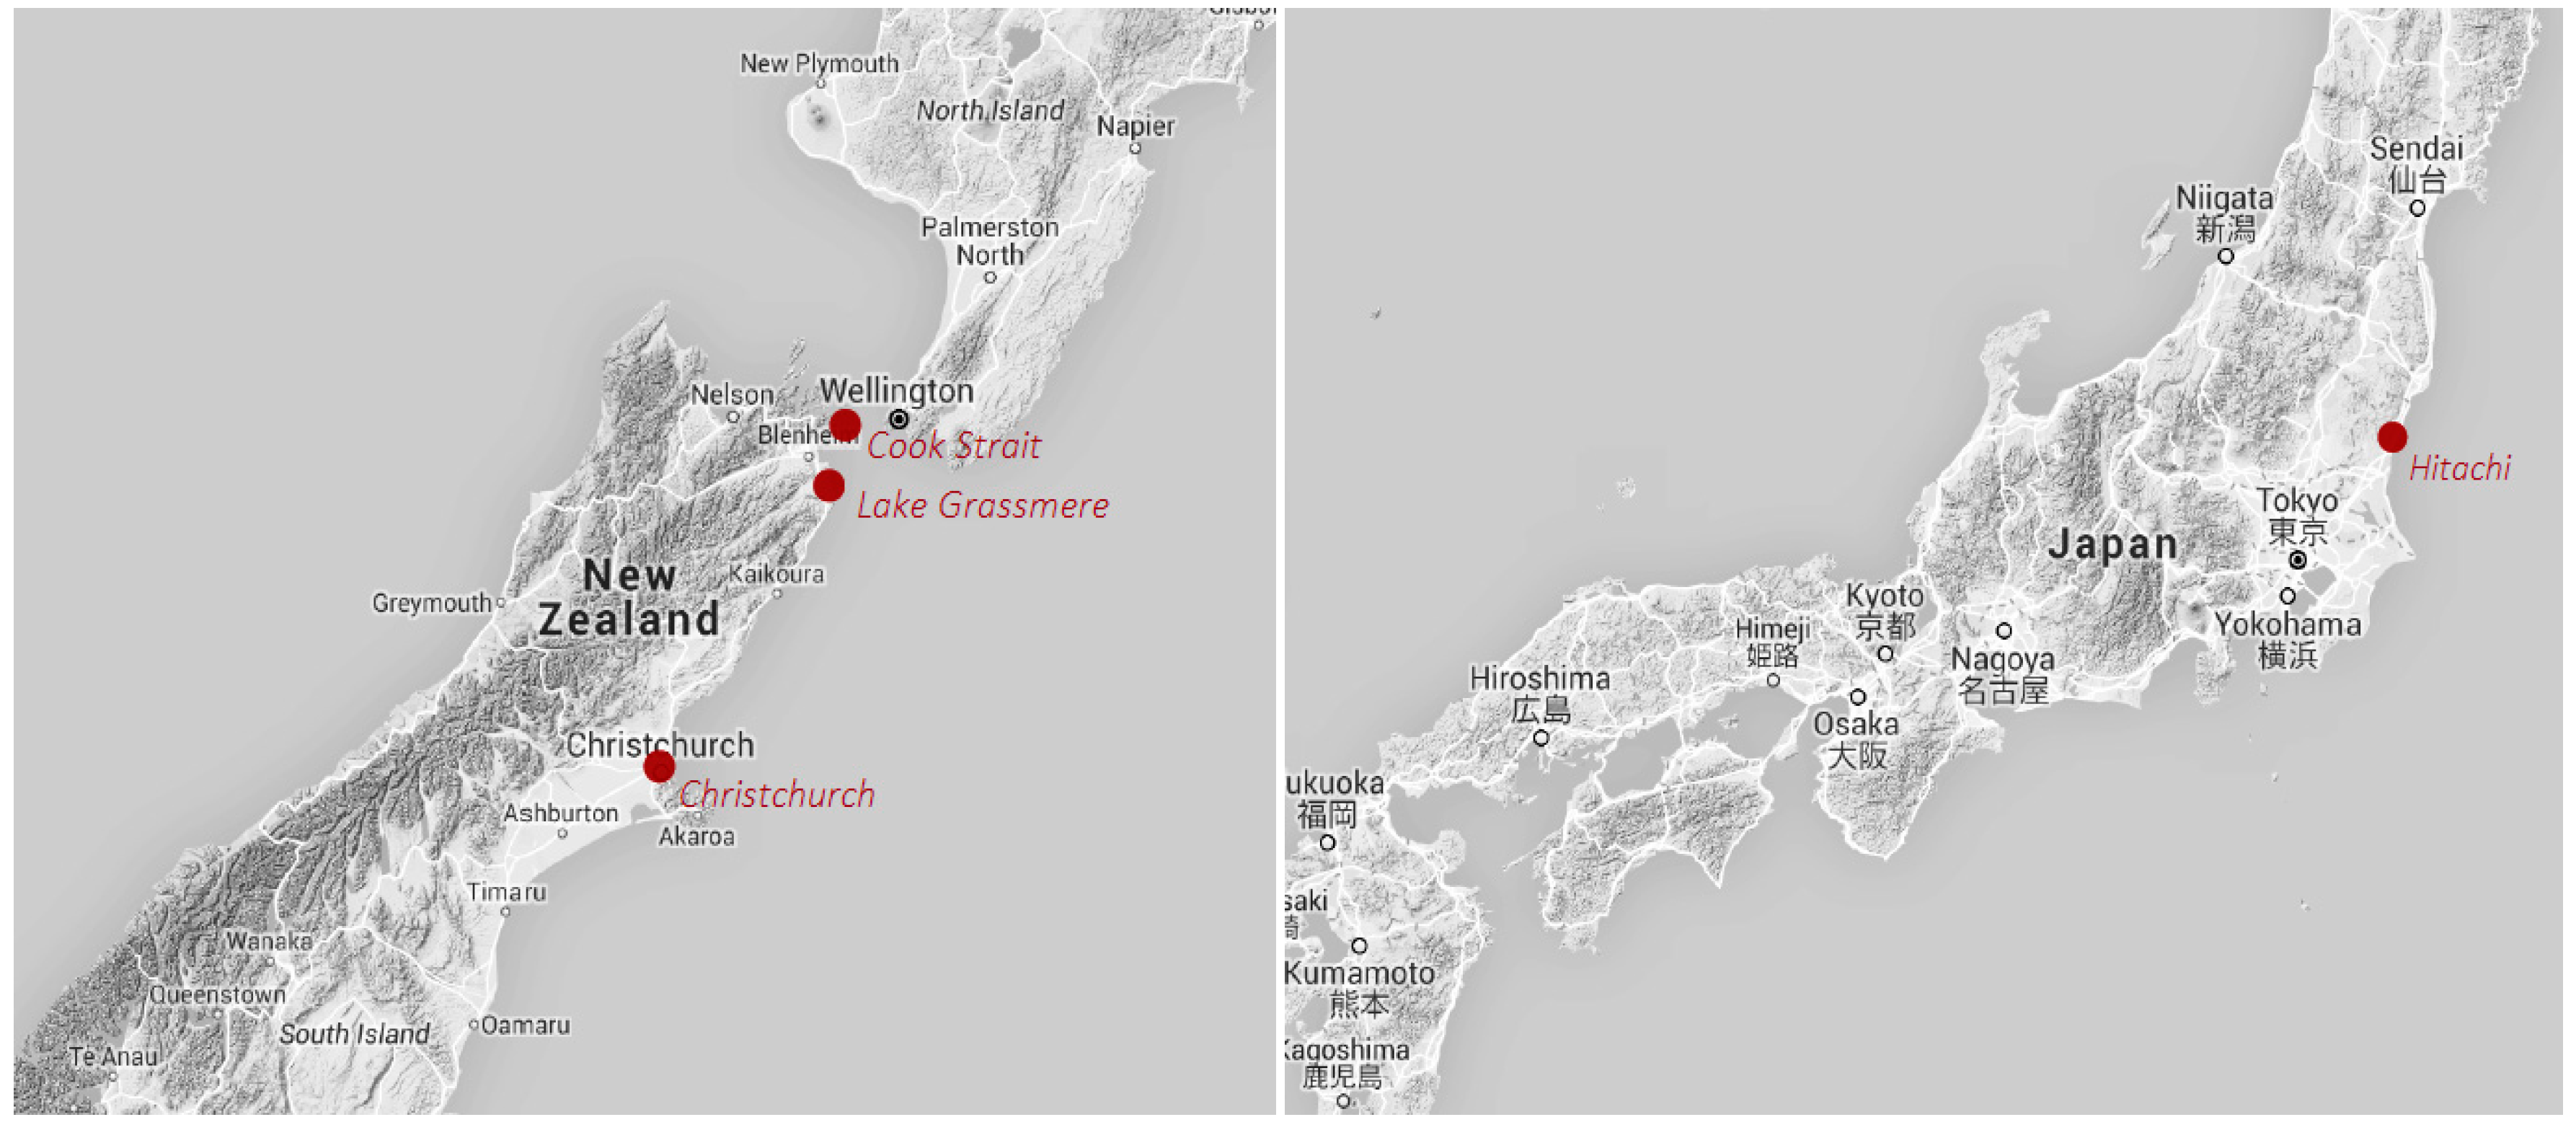
3.1. Settings
3.2. Samples
3.3. Measures
3.4. Analyses
4. Results
5. Discussion
6. Conclusions
Acknowledgments
Author Contributions
Conflicts of Interest
References
- Poteyeva, M.; Denver, M.; Barsky, L.E.; Aguirre, B.E. Search and rescue activities in disasters. In Handbook of Disaster Research, 1st ed.; Rodriguez, H., Quarantelli, E.L., Dynes, R.R., Eds.; Springer: New York, NY, USA, 2007; pp. 200–216. [Google Scholar]
- Becker, J.S.; Paton, D.; Johnston, D.M.; Ronan, K.R. A model of household preparedness for earthquakes: How individuals make meaning of earthquake information and how this influences preparedness. Natural Hazards 2012, 64, 107–137. [Google Scholar] [CrossRef]
- Becker, J.S.; Coomer, M.A.; Potter, S.H.; McBride, S.K.; Lambie, E.S.; Johnston, D.M.; Cheesman, B.; Guard, J.; Walker, A. Evaluating New Zealand’s “ShakeOut” National Earthquake Drills: A Comparative Analysis of the 2012 and 2015 Events. In Proceedings of the 2016 NZSEE Conference, Christchurch, New Zealand, 1–3 April 2016.
- Becker, J.S.; Coomer, M.A.; McBride, S.K.; Lambie, E. New Zealand ShakeOut 2015: An Evaluation Based on Observer Surveys, 1st ed.; GNS Science: Lower Hutt, New Zealand, 2016; p. 67. [Google Scholar]
- Johnston, D.; Becker, J.; McClure, J.; Paton, D.; McBride, S.; Wright, K.; Leonard, G.; Hughes, M. Community understanding of, and preparedness for, earthquake and tsunami risk in Wellington, New Zealand. In Cities at Risk: Living with Perils in the 21st Century, 1st ed.; Rossetto, T., Adams, J., Joffe, H., Eds.; Springer: Dordrecht, The Netherland, 2013; pp. 131–148. [Google Scholar]
- Lindell, M.K.; Prater, C.S.; Wu, H.C.; Huang, S.K.; Johnston, D.M.; Becker, J.S.; Shiroshita, H. Immediate behavioural responses to earthquakes in Christchurch, New Zealand, and Hitachi, Japan. Disasters 2016, 40, 85–111. [Google Scholar] [CrossRef] [PubMed]
- Lindell, M.K.; Perry, R.W. Household adjustment to earthquake hazard: A review of research. Environ. Behav. 2000, 32, 461–501. [Google Scholar] [CrossRef]
- McClure, J.; Sibley, C.G. Framing effects on disaster preparation: Is negative framing more effective? Aust. J. Disaster Trauma Stud. 2011, 1, 1–10. [Google Scholar]
- McClure, J.; Spittal, M.; Fischer, R.; Charleson, A. Why do people take fewer damage mitigation actions than survival actions? Other factors outweigh cost. Natural Hazards Rev. 2014, 16, 04014018. [Google Scholar] [CrossRef]
- Solberg, C.; Rossetto, T.; Joffe, H. The social psychology of seismic hazard adjustment: Re-evaluating the international literature. Natural Hazards Earth Syst. Sci. 2010, 10, 1663–1677. [Google Scholar] [CrossRef] [Green Version]
- Spittal, M.J.; McClure, J.; Siegert, R.J.; Walkey, F.H. Optimistic bias in relation to preparedness for earthquakes. Aust. J. Disaster Trauma Stud. 2005, 1, 1–10. [Google Scholar]
- Prati, G.; Saccinto, E.; Pietrantoni, L.; Pérez-Testor, C. The 2012 Northern Italy earthquakes: Modeling human behavior. Natural Hazards 2013, 69, 99–113. [Google Scholar] [CrossRef]
- Lindell, M.K.; Prater, C.S.; Wu, H.C.; Huang, S.K.; Johnston, D.M.; Becker, J.S.; Shiroshita, H. Immediate behavioral responses to earthquakes in Christchurch New Zealand and Hitachi Japan. Disasters 2016, 40, 85–111. [Google Scholar] [CrossRef] [PubMed]
- Alexander, D. Behavior during earthquakes: A Southern Italian example. Int. J. Mass Emerg. Disasters 1990, 8, 5–29. [Google Scholar]
- Arnold, C.; Durkin, M.; Eisner, R.; Whitaker, D. Occupant behavior in a six story office building following severe earthquake damage. Disasters 1982, 6, 207–214. [Google Scholar] [CrossRef]
- Bourque, L.B.; Russell, L.A.; Goltz, J.D. Human behavior during and immediately after the earthquake. In The Loma Prieta, California, Earthquake of October 17, 1989: Public Response, 1st ed.; Bolton, P.A., Ed.; Geological Survey: Washington, DC, USA, 1993; pp. B3–B22. [Google Scholar]
- Goltz, J.D.; Russell, L.A.; Bourque, L.B. Initial behavioral response to a rapid onset disaster: A case study of the October 1, 1987 Whittier Narrows Earthquake. Int. J. Mass Emerg. Disasters 1992, 10, 43–69. [Google Scholar]
- Ohta, Y.; Ohashi, H. Field survey on occupant behavior in an earthquake. Int. J. Mass Emerg. Disasters 1985, 3, 147–160. [Google Scholar]
- Prati, G.; Catufi, V.; Pietrantoni, L. Emotional and behavioural reactions to tremors of the Umbria-Marche Earthquake. Disasters 2012, 36, 439–451. [Google Scholar] [CrossRef] [PubMed]
- Takuma, T. Human behavior in the event of earthquakes. In Disasters: Theory and Research, 1st ed.; Quarantelli, E., Ed.; Sage: Beverly Hills, CA, USA, 1978; pp. 159–172. [Google Scholar]
- Noji, E. Public Health Consequences of Earthquakes, 2004. Available online: www.pitt.edu/~super1/lecture/lec13021/index.htm (accessed on 18 July 2016).
- Wenger, D.E. Community response to disasters: Functional and structural alterations. In Disasters: Theory and Research, 1st ed.; Quarantelli, E., Ed.; Sage: Beverly Hills, CA, USA, 1978; pp. 17–47. [Google Scholar]
- Friedsam, H.J. Older persons in disaster. In Man and Society in Disaster, 1st ed.; Baker, G.W., Chapman, D.W., Eds.; Basic Books: New York, NY, USA, 1962; pp. 151–182. [Google Scholar]
- Form, W.H.; Nosow, S. Community in Disaster, 1st ed.; Harper: New York, NY, USA, 1958. [Google Scholar]
- Lindell, M.K.; Perry, R.W. Communicating Environmental Risk in Multiethnic Communities, 1st ed.; Sage: Thousand Oaks, CA, USA, 2004. [Google Scholar]
- Lindell, M.K.; Perry, R.W. The protective action decision model: Theoretical modifications and additional evidence. Risk Anal. 2012, 32, 616–632. [Google Scholar] [CrossRef] [PubMed]
- Lindell, M.K. Communicating imminent risk. In Handbook of Disaster Research, 2th ed.; Rodríguez, H., Trainor, J., Donner, W., Eds.; Springer: New York, NY, USA, in press.
- Dynes, R. Organized Behavior in Disaster; Lexington Books: Lanham, MD, USA, 1970. [Google Scholar]
- Drabek, T.E. Human System Responses to Disaster: An Inventory of Sociological Findings, 1st ed.; Springer: New York, NY, USA, 1986. [Google Scholar]
- Auf de Heide, E. Disaster Response: Principles and Preparation and Coordination, 1st ed.; CV Mosby: St. Louis, MO, USA, 1989. [Google Scholar]
- Lindell, M.K.; Perry, R.W. Behavioral Foundations of Community Emergency Planning; Hemisphere Press: Washington, DC, USA, 1992. [Google Scholar]
- Committee on Disaster Research in the Social Sciences. Facing Hazards and Disasters: Understanding Human Dimensions, 1st ed.; National Academy of Sciences/National Research Council: Washington, DC, USA, 2006. [Google Scholar]
- Bannister, S.; Gledhill, K. Evolution of the 2010—2012 Canterbury earthquake sequence. New Zealand J. Geol. Geophys. 2012, 55, 295–304. [Google Scholar] [CrossRef]
- Fraser, S.A.; Doyle, E.E.H.; Wright, K.C.; Potter, S.H.; McClure, J.; Johnston, D.M.; Leonard, G.S.; Coomer, M.A.; Becker, J.S.; Johal, S. Tsunami response behaviour during and following two local-source earthquakes in Wellington, New Zealand. Int. J. Disaster Risk Reduct. 2016, 16, 123–133. [Google Scholar] [CrossRef]
- Huang, S.K.; Lindell, M.K.; Prater, C.S.; Wu, H.C.; Siebeneck, L.K. Household evacuation decision making in response to Hurricane Ike. Natural Hazards Rev. 2012, 13, 283–296. [Google Scholar] [CrossRef]
- Lindell, M.K.; Prater, C.S.; Gregg, C.E.; Apatu, E.; Huang, S.K.; Wu, H.C. Households’ immediate responses to the 2009 Samoa earthquake and tsunami. Int. J. Disaster Risk Reduct. 2015, 12, 328–340. [Google Scholar] [CrossRef]
- Gutteling, J.M.; Vries, P.W. Determinants of seeking and avoiding risk-related information in times of crisis. Risk Anal. 2016. [Google Scholar] [CrossRef] [PubMed]
- Sutton, J.; League, C.; Sellnow, T.L.; Sellnow, D.D. Terse messaging and public health in the midst of natural disasters: The case of the Boulder floods. Health Commun. 2015, 30, 135–143. [Google Scholar] [CrossRef] [PubMed]
- Lindell, M.K.; Huang, S.K.; Prater, C.S. Predicting residents’ responses to the May 1–4, 2010, Boston water contamination incident. Int. J. Mass Emerg. Disasters 2016, in press. [Google Scholar]
- Ford, J.K.; Schmidt, A.M. Emergency response training: Strategies for enhancing real-world performance. J. Hazardous Mater. 2000, 75, 195–215. [Google Scholar] [CrossRef]
- Blume, B.D.; Ford, J.K.; Baldwin, T.T.; Huang, J.L. Transfer of training: A meta-analytic review. J. Manag. 2000, 36, 1065–1105. [Google Scholar] [CrossRef]
- Fothergill, A. Gender, risk, and disaster. Int. J. Mass Emerg. Disasters 1996, 14, 33–56. [Google Scholar]
- Olofsson, A.; Rashid, S. The white (male) effect and risk perception: Can equality make a difference? Risk Anal. 2011, 31, 1016–1032. [Google Scholar] [CrossRef] [PubMed]
- Lambie, E.; Wilson, T.M.; Johnston, D.M.; Jensen, S.; Brogt, E.; Doyle, E.E.H.; Lindell, M.K.; Helton, W.S. Human behaviour during and immediately following earthquake shaking: Developing a methodological approach for analysing video footage. Natural Hazards 2016, 80, 249–283. [Google Scholar] [CrossRef]
- Stallings, R.A. Methodological issues. In Handbook of Disaster Research, 1st ed.; Rodriguez, H., Quarantelli, E.L., Dynes, R.R., Eds.; Springer: New York, NY, USA; pp. 55–82.
- Lindell, M.K. North American cities at risk: Household responses to environmental hazards. In Cities at Risk: Living with Perils in the 21st Century, 1st ed.; Rossetto, T., Joffe, H., Adams, J., Eds.; Springer: Dordrecht, The Netherland, 2013; pp. 109–130. [Google Scholar]
- Curtin, R.; Presser, S.; Singer, E. The effects of response rate changes on the Index of Consumer Sentiment. Public Opinion Quarterly 2000, 64, 413–428. [Google Scholar] [CrossRef] [PubMed]
- Keeter, S.; Miller, C.; Kohut, A.; Groves, R.M.; Presser, S. Consequences of reducing nonresponse in a national telephone survey. Public Opin. Q. 2000, 64, 125–148. [Google Scholar] [CrossRef] [PubMed]

| Demographic | Sample | Census | ||||
|---|---|---|---|---|---|---|
| Variables | Christchurch | Hitachi | Wellington | Christchurch | Hitachi | Wellington |
| Female Gender % | 65% | 42% | 48% | 51% | 50% | 52% |
| Mean Education Level | 3.1 | 3.6 | 3.6 | n/a | n/a | n/a |
| Mean Income Level | $48,000 | $29,000 | $42,000 | $20,630 | $29,688* | $27,434 |
| Married % | 57% | 85% | 50% | 45% | 46% | 46% |
| Mean Age | 52.8 | 62.0 | 49.6 | 39.0 | 51.6 | 35.3 |
| Home Ownership % | 79% | 90% | 80% | 52% | 62% | 55% |
| Variable | M | SD | 1 | 2 | 3 | 4 | 5 | 6 | 7 | 8 | 9 | 10 | 11 | 12 | 13 | 14 | 15 | 16 | 17 | 18 | ||
| 1. Female | 0.51 | 0.50 | ||||||||||||||||||||
| 2. Age | 54.49 | 15.72 | −0.09 | |||||||||||||||||||
| 3. Education | 3.48 | 1.32 | 0.00 | −0.28 | ||||||||||||||||||
| 4. Income | 3.38 | 1.71 | −0.08 | −0.41 | 0.40 | |||||||||||||||||
| 5. Married | 0.63 | 0.48 | −0.13 | −0.03 | 0.07 | 0.25 | ||||||||||||||||
| 6. EQ_Exp | 0.13 | 0.21 | −0.04 | 0.05 | 0.04 | 0.04 | −0.03 | |||||||||||||||
| 7. EQ_Info | 0.27 | 0.32 | 0.05 | 0.12 | 0.02 | 0.05 | 0.03 | 0.20 | ||||||||||||||
| 8. EmergPrep | 0.26 | 0.30 | 0.05 | 0.05 | −0.09 | −0.05 | 0.01 | 0.07 | 0.17 | |||||||||||||
| 9. PC_Home | 0.33 | 0.47 | −0.06 | 0.27 | −0.15 | −0.25 | −0.05 | 0.00 | −0.03 | 0.09 | ||||||||||||
| 10. HC_Together | 0.28 | 0.45 | −0.10 | 0.28 | −0.14 | −0.25 | −0.08 | 0.02 | 0.00 | 0.08 | 0.75 | |||||||||||
| 11. HC_AbSafe | 0.21 | 0.41 | −0.01 | −0.10 | −0.03 | 0.04 | 0.06 | −0.02 | 0.03 | 0.08 | −0.17 | −0.32 | ||||||||||
| 12. HC_AbUnk | 0.41 | 0.49 | 0.06 | −0.25 | 0.18 | 0.26 | 0.07 | 0.02 | −0.01 | −0.12 | −0.39 | −0.49 | −0.45 | |||||||||
| 13. SC_Alone | 0.29 | 0.46 | 0.00 | 0.21 | −0.12 | −0.19 | −0.15 | 0.00 | −0.07 | −0.03 | 0.10 | −0.07 | 0.06 | 0.01 | ||||||||
| 14. SC_Child | 0.14 | 0.35 | 0.13 | −0.16 | 0.03 | 0.07 | 0.11 | 0.03 | 0.02 | 0.04 | 0.02 | 0.02 | 0.03 | 0.00 | −0.26 | |||||||
| 15. SC_Adult | 0.61 | 0.49 | −0.04 | −0.13 | 0.07 | 0.13 | 0.09 | −0.02 | 0.09 | 0.03 | −0.03 | 0.12 | −0.01 | 0.01 | −0.77 | −0.09 | ||||||
| 16. EQFelt | 4.74 | 1.53 | 0.04 | −0.09 | 0.04 | 0.03 | −0.02 | 0.01 | −0.02 | 0.06 | 0.10 | 0.01 | 0.04 | 0.09 | 0.02 | 0.05 | 0.14 | |||||
| 17. Aff_Vigil | 1.53 | 1.03 | −0.13 | −0.07 | 0.00 | 0.04 | 0.07 | 0.01 | −0.01 | 0.01 | 0.09 | 0.05 | 0.10 | −0.03 | 0.01 | 0.03 | 0.04 | 0.00 | ||||
| 18. Aff_Shock | 1.53 | 1.30 | −0.01 | 0.00 | −0.05 | −0.01 | 0.00 | 0.04 | 0.08 | 0.02 | 0.07 | 0.02 | 0.12 | −0.03 | 0.06 | −0.02 | −0.04 | 0.12 | 0.20 | |||
| 19. Aff_Fear | 3.39 | 1.43 | 0.15 | −0.23 | 0.06 | 0.05 | 0.02 | 0.01 | 0.01 | −0.01 | 0.03 | −0.04 | 0.06 | 0.09 | 0.02 | 0.09 | 0.03 | 0.42 | 0.02 | 0.36 | ||
| 20. RiskPer | 2.47 | 1.39 | 0.06 | −0.18 | 0.06 | 0.10 | 0.01 | 0.06 | 0.05 | 0.08 | −0.04 | −0.09 | 0.04 | 0.12 | −0.01 | 0.02 | 0.08 | 0.36 | 0.03 | 0.29 | ||
| 21. Im_Freeze | 0.32 | 0.47 | −0.06 | 0.10 | −0.08 | −0.06 | −0.02 | −0.03 | −0.03 | −0.01 | 0.11 | 0.07 | 0.07 | −0.06 | 0.10 | −0.11 | 0.00 | −0.02 | 0.03 | 0.06 | ||
| 22. Im_DropCov | 0.16 | 0.36 | 0.01 | −0.07 | 0.04 | 0.10 | 0.05 | 0.08 | 0.06 | 0.06 | −0.05 | −0.01 | −0.02 | 0.07 | −0.10 | −0.04 | 0.15 | 0.13 | −0.05 | 0.01 | ||
| 23. Im_ProtPers | 0.07 | 0.26 | 0.06 | −0.13 | 0.00 | 0.04 | 0.04 | 0.00 | 0.01 | 0.01 | 0.03 | 0.01 | 0.00 | −0.01 | −0.17 | 0.42 | 0.02 | 0.05 | 0.09 | 0.00 | ||
| 24. Im_ProtProp | 0.05 | 0.22 | 0.00 | 0.06 | −0.02 | −0.03 | −0.01 | 0.00 | 0.01 | −0.03 | 0.07 | 0.03 | 0.00 | −0.05 | 0.08 | −0.07 | −0.05 | 0.01 | 0.00 | 0.02 | ||
| 25. Im_Evacuate | 0.22 | 0.42 | 0.05 | −0.03 | 0.03 | −0.01 | −0.03 | −0.01 | −0.01 | 0.01 | 0.05 | −0.02 | 0.00 | 0.05 | 0.01 | −0.02 | 0.02 | 0.16 | 0.02 | 0.03 | ||
| 26. HH_MemInj | 0.16 | 0.37 | 0.04 | −0.14 | 0.00 | 0.00 | −0.01 | −0.01 | 0.02 | 0.08 | 0.02 | −0.01 | −0.02 | 0.09 | 0.00 | 0.03 | 0.04 | 0.13 | 0.02 | 0.02 | ||
| 27. HomeDmg | 1.93 | 0.91 | 0.14 | 0.00 | 0.04 | 0.02 | 0.00 | 0.16 | 0.02 | 0.01 | −0.03 | −0.05 | −0.01 | 0.03 | 0.00 | 0.10 | −0.03 | 0.10 | 0.01 | 0.04 | ||
| 28. InfraInter | 2.59 | 2.51 | 0.09 | −0.09 | 0.08 | 0.04 | 0.02 | 0.08 | 0.05 | 0.12 | −0.07 | −0.05 | −0.07 | 0.09 | 0.04 | 0.03 | −0.02 | 0.09 | −0.07 | 0.00 | ||
| 29. 30m_Return | 0.25 | 0.43 | −0.06 | 0.02 | −0.01 | −0.05 | −0.04 | −0.04 | −0.03 | −0.05 | 0.07 | 0.06 | 0.01 | 0.02 | 0.03 | −0.04 | 0.06 | 0.05 | 0.09 | 0.01 | ||
| 30. 30m_SeekInf | 0.42 | 0.49 | 0.07 | −0.11 | 0.11 | 0.05 | 0.06 | 0.01 | 0.05 | 0.06 | 0.10 | 0.04 | 0.07 | −0.03 | 0.04 | 0.07 | 0.02 | 0.10 | 0.06 | 0.08 | ||
| 31. 30m_TurnOff | 0.12 | 0.33 | 0.03 | 0.11 | −0.08 | −0.12 | −0.05 | 0.10 | 0.12 | 0.07 | 0.09 | 0.11 | −0.02 | −0.07 | 0.07 | −0.02 | −0.04 | −0.01 | 0.01 | 0.04 | ||
| 32. 30m_Contact | 0.54 | 0.50 | 0.09 | −0.25 | 0.01 | 0.14 | 0.11 | 0.04 | −0.03 | 0.03 | −0.19 | −0.30 | 0.17 | 0.23 | 0.03 | 0.02 | 0.02 | 0.18 | 0.03 | 0.11 | ||
| 33. 30m_Cleanup | 0.23 | 0.42 | 0.01 | 0.04 | −0.09 | −0.07 | −0.07 | 0.03 | 0.07 | 0.07 | 0.10 | 0.07 | 0.03 | −0.06 | 0.10 | −0.01 | −0.05 | 0.08 | 0.04 | 0.13 | ||
| 34. 30m_HlpOth | 0.19 | 0.39 | 0.07 | −0.07 | 0.05 | 0.08 | −0.01 | 0.04 | 0.11 | 0.07 | −0.02 | −0.06 | 0.00 | 0.07 | −0.13 | 0.12 | 0.10 | 0.13 | 0.09 | 0.09 | ||
| 35. 30m_Count | 2.29 | 1.31 | 0.08 | −0.18 | 0.05 | 0.09 | 0.02 | 0.08 | 0.08 | 0.10 | −0.05 | −0.11 | 0.14 | 0.09 | 0.04 | 0.04 | 0.07 | 0.22 | 0.13 | 0.15 | ||
| 36. Chan_Face | 0.54 | 0.50 | 0.10 | −0.17 | 0.16 | 0.13 | 0.06 | −0.01 | 0.05 | 0.02 | −0.05 | 0.00 | 0.01 | 0.06 | −0.15 | 0.05 | 0.21 | 0.17 | 0.11 | 0.05 | ||
| 37. Chan_TV | 0.14 | 0.35 | −0.04 | 0.05 | −0.04 | −0.01 | 0.07 | −0.02 | 0.05 | 0.04 | 0.18 | 0.08 | 0.10 | −0.13 | 0.05 | 0.09 | −0.01 | 0.03 | 0.03 | 0.12 | ||
| 38. Chan_Radio | 0.35 | 0.48 | −0.04 | 0.08 | −0.08 | −0.10 | 0.01 | 0.01 | 0.02 | 0.10 | 0.11 | 0.11 | 0.07 | −0.12 | 0.08 | 0.00 | 0.00 | 0.08 | 0.06 | 0.10 | ||
| 39. Chan_Phone | 0.61 | 0.49 | 0.00 | −0.23 | 0.08 | 0.21 | 0.12 | 0.02 | −0.05 | 0.00 | −0.07 | −0.15 | 0.10 | 0.19 | −0.04 | −0.02 | 0.12 | 0.18 | 0.07 | 0.09 | ||
| 40. Chan_Intrnet | 0.47 | 0.50 | 0.09 | −0.35 | 0.23 | 0.25 | 0.07 | 0.02 | 0.08 | 0.05 | 0.14 | 0.05 | 0.04 | 0.12 | −0.05 | 0.12 | 0.16 | 0.22 | 0.23 | 0.17 | ||
| 41. Christchurch | 0.26 | 0.44 | 0.16 | −0.07 | −0.19 | 0.1 | −0.07 | 0.67 | 0.10 | 0.51 | −0.09 | −0.03 | −0.04 | 0.08 | 0.01 | 0.01 | 0.02 | 0.33 | 0.18 | 0.09 | ||
| 42. Hitachi | 0.33 | 0.47 | −0.40 | 0.33 | 0.08 | −0.57 | 0.32 | −0.20 | −0.32 | 0.02 | −0.21 | −0.14 | 0.03 | 0.19 | 0.03 | −0.13 | 0.07 | 0.48 | 0.06 | 0.62 | ||
| 43. Cook Strait | 0.20 | 0.40 | 0.15 | −0.16 | 0.05 | 0.25 | −0.14 | −0.25 | 0.13 | −0.29 | 0.37 | 0.29 | −0.03 | −0.28 | 0.03 | 0.14 | −0.11 | −0.48 | −0.16 | −0.41 | ||
| 44. L. Grassmere | 0.20 | 0.40 | 0.15 | −0.16 | 0.05 | 0.25 | −0.14 | −0.25 | 0.13 | −0.29 | −0.02 | −0.09 | 0.04 | −0.03 | −0.09 | 0.00 | 0.00 | −0.43 | −01 | −0.36 | ||
| Variable | 19 | 20 | 21 | 22 | 23 | 24 | 25 | 26 | 27 | 28 | 29 | 30 | 31 | 32 | 33 | 34 | 35 | 36 | 37 | 38 | 39 | 40 |
| 20. RiskPer | 0.51 | |||||||||||||||||||||
| 21. Im_Freeze | −0.10 | −0.12 | ||||||||||||||||||||
| 22. Im_DropCov | 0.14 | 0.10 | −0.28 | |||||||||||||||||||
| 23. Im_ProtPers | 0.09 | 0.03 | −0.19 | −0.11 | ||||||||||||||||||
| 24. Im_ProtProp | 0.01 | −0.02 | −0.15 | −0.07 | −0.06 | |||||||||||||||||
| 25. Im_Evacuate | 0.15 | 0.18 | −0.36 | −0.21 | −0.14 | −0.11 | ||||||||||||||||
| 26. HH_MemInj | 0.14 | 0.18 | −0.04 | 0.07 | −0.02 | 0.02 | 0.04 | |||||||||||||||
| 27. HomeDmg | 0.10 | 0.18 | −0.07 | 0.02 | 0.01 | 0.02 | 0.05 | 0.03 | ||||||||||||||
| 28. InfraInter | 0.06 | 0.12 | 0.02 | 0.03 | −0.03 | 0.01 | 0.05 | 0.09 | 0.17 | |||||||||||||
| 29. 30m_Return | −0.02 | −0.05 | 0.17 | −0.08 | −0.03 | −0.02 | −0.03 | −0.01 | −0.07 | −0.04 | ||||||||||||
| 30. 30m_SeekInf | 0.18 | 0.13 | 0.01 | 0.06 | 0.04 | 0.01 | 0.01 | 0.07 | 0.01 | 0.06 | 0.01 | |||||||||||
| 31. 30m_TurnOff | 0.02 | 0.14 | −0.04 | 0.01 | 0.02 | −0.02 | 0.08 | 0.05 | 0.03 | 0.05 | −0.10 | 0.08 | ||||||||||
| 32. 30m_Contact | 0.27 | 0.22 | 0.02 | 0.04 | 0.01 | −0.02 | 0.06 | 0.08 | 0.02 | 0.10 | 0.00 | 0.19 | 0.04 | |||||||||
| 33. 30m_Cleanup | 0.12 | 0.13 | −0.04 | 0.03 | 0.02 | 0.07 | 0.04 | −0.03 | 0.11 | 0.05 | −0.01 | 0.07 | 0.23 | 0.08 | ||||||||
| 34. 30m_HlpOth | 0.15 | 0.19 | −0.06 | 0.04 | 0.18 | −0.03 | −0.01 | 0.06 | 0.04 | 0.02 | −0.07 | 0.09 | 0.04 | 0.14 | 0.11 | |||||||
| 35. 30m_Count | 0.29 | 0.28 | −0.01 | 0.05 | 0.05 | −0.06 | 0.09 | 0.09 | 0.08 | 0.13 | 0.19 | 0.49 | 0.35 | 0.58 | 0.41 | 0.38 | ||||||
| 36. Chan_Face | 0.09 | 0.09 | −0.07 | 0.09 | 0.02 | −0.05 | 0.06 | 0.04 | 0.05 | 0.07 | −0.01 | 0.13 | 0.05 | 0.11 | 0.06 | 0.17 | 0.22 | |||||
| 37. Chan_TV | 0.08 | 0.04 | 0.02 | −0.02 | 0.05 | −0.02 | 0.07 | 0.03 | −0.06 | −0.05 | 0.04 | 0.15 | 0.08 | 0.00 | 0.12 | 0.00 | 0.09 | −0.01 | ||||
| 38. Chan_Radio | 0.07 | 0.05 | 0.02 | −0.04 | 0.05 | 0.02 | −0.01 | 0.04 | −0.01 | −0.01 | −0.05 | 0.19 | 0.11 | 0.08 | 0.12 | 0.05 | 0.18 | 0.03 | 0.07 | |||
| 39. Chan_Phone | 0.19 | 0.15 | 0.07 | 0.11 | −0.02 | −0.06 | 0.02 | 0.07 | 0.03 | 0.00 | 0.07 | 0.12 | −0.04 | 0.40 | 0.05 | 0.06 | 0.26 | 0.15 | 0.04 | 0.06 | ||
| 40. Chan_Intrnet | 0.40 | 0.41 | −0.04 | 0.08 | 0.07 | −0.01 | 0.17 | 0.13 | 0.07 | 0.04 | 0.09 | 0.49 | −0.09 | 0.22 | 0.16 | 0.15 | 0.39 | 0.20 | 0.19 | 0.08 | 0.26 | |
| 41. Christchurch | 0.04 | 0.15 | 0.07 | 0.03 | 0.07 | 0.00 | −0.17 | −0.18 | 0.45 | 0.27 | −0.17 | −0.06 | 0.10 | 0.15 | 0.10 | 0.33 | 0.26 | 0.10 | −0.12 | 0.15 | 0.16 | −− |
| 42. Hitachi | 0.46 | 0.53 | −0.01 | −0.16 | −0.02 | 0.16 | 0.09 | −0.28 | 0.22 | 0.62 | −0.31 | −0.14 | 0.16 | 0.03 | 0.12 | −0.20 | −0.07 | −0.06 | 0.00 | 0.03 | −0.22 | −− |
| 43. Cook Strait | −0.30 | −0.44 | −0.02 | −0.09 | 0.01 | −0.10 | 0.14 | 0.28 | −0.38 | −0.50 | 0.34 | 0.10 | −0.12 | −0.17 | −0.09 | −0.12 | −0.14 | −0.07 | 0.15 | −0.07 | −0.01 | −0.06 |
| 44. L. Grassmere | −0.25 | −0.34 | −0.05 | 0.25 | −0.06 | −0.09 | −0.07 | 0.23 | −0.40 | −0.51 | 0.21 | 0.12 | −0.17 | −0.03 | −0.16 | −0.01 | −0.05 | 0.03 | −0.03 | −0.13* | 0.09 | 0.06 |
| Predictor | Dependent Variable | |||||
|---|---|---|---|---|---|---|
| Variables | Return | Seek Info | Turn off | Contact | Clean up | Help Others |
| Exp Prep Idx | −0.17 * | 0.06 | 0.20 * | 0.10 | 0.04 | 0.15 * |
| (0.08) | (0.06) | (0.09) | (0.07) | (0.07) | (0.07) | |
| Own Home | 0.37 * | 0.25 | 0.45 | −0.97 * | 0.62 * | −0.39 |
| (0.20) | (0.17) | (0.30) | (0.18) | (0.22) | (0.24) | |
| HC AbUnk | −0.16 | −0.18 | −0.13 | 0.57 * | −0.29 | 0.38 * |
| (0.21) | (0.16) | (0.26) | (0.17) | (0.20) | (0.21) | |
| Psy Idx | −0.08 * | 0.15 * | 0.09 | 0.25 * | 0.24 * | 0.32 * |
| (0.04) | (0.03) | (0.06) | (0.04) | (0.05) | (0.05) | |
| Dmg Idx | −0.31 * | −0.00 | 0.10 | −0.09 | 0.02 | 0.00 |
| (0.11) | (0.07) | (0.10) | (0.08) | (0.08) | (0.09) | |
| Christchurch | −0.29 | −1.38 * | 0.81 | −0.25 | 0.28 | −0.22 |
| (0.43) | (0.35) | (0.54) | (0.37) | (0.40) | (0.41) | |
| Hitachi | −1.26 * | −1.65 * | 1.12 * | −1.31 * | −0.06 | −2.67 * |
| (0.47) | (0.33) | (0.53) | (0.36) | (0.38) | (0.44) | |
| Constant | −0.96 * | 0.63 * | −3.04 * | 0.86 * | −1.55 * | −0.91 * |
| (0.29) | (0.23) | (0.42) | (0.24) | (0.28) | (0.286) | |
| Observations | 846 | 846 | 846 | 845 | 846 | 846 |
| Log Likelihood | −378.95 | −552.20 | −274.30 | −506.35 | −417.80 | −351.39 |
| Nagelkerke R2 | 0.46 | 0.31 | 0.42 | 0.34 | 0.32 | 0.38 |
© 2016 by the authors; licensee MDPI, Basel, Switzerland. This article is an open access article distributed under the terms and conditions of the Creative Commons Attribution (CC-BY) license (http://creativecommons.org/licenses/by/4.0/).
Share and Cite
Jon, I.; Lindell, M.K.; Prater, C.S.; Huang, S.-K.; Wu, H.-C.; Johnston, D.M.; Becker, J.S.; Shiroshita, H.; Doyle, E.E.H.; Potter, S.H.; et al. Behavioral Response in the Immediate Aftermath of Shaking: Earthquakes in Christchurch and Wellington, New Zealand, and Hitachi, Japan. Int. J. Environ. Res. Public Health 2016, 13, 1137. https://doi.org/10.3390/ijerph13111137
Jon I, Lindell MK, Prater CS, Huang S-K, Wu H-C, Johnston DM, Becker JS, Shiroshita H, Doyle EEH, Potter SH, et al. Behavioral Response in the Immediate Aftermath of Shaking: Earthquakes in Christchurch and Wellington, New Zealand, and Hitachi, Japan. International Journal of Environmental Research and Public Health. 2016; 13(11):1137. https://doi.org/10.3390/ijerph13111137
Chicago/Turabian StyleJon, Ihnji, Michael K. Lindell, Carla S. Prater, Shih-Kai Huang, Hao-Che Wu, David M. Johnston, Julia S. Becker, Hideyuki Shiroshita, Emma E.H. Doyle, Sally H. Potter, and et al. 2016. "Behavioral Response in the Immediate Aftermath of Shaking: Earthquakes in Christchurch and Wellington, New Zealand, and Hitachi, Japan" International Journal of Environmental Research and Public Health 13, no. 11: 1137. https://doi.org/10.3390/ijerph13111137