
Drivers’ Visual Search Patterns during Overtaking Maneuvers on Freeway

Abstract
:1. Introduction
2. Literature Review
2.1. Overtaking and Safety
2.2. Visual Attention and Safety
3. Methods
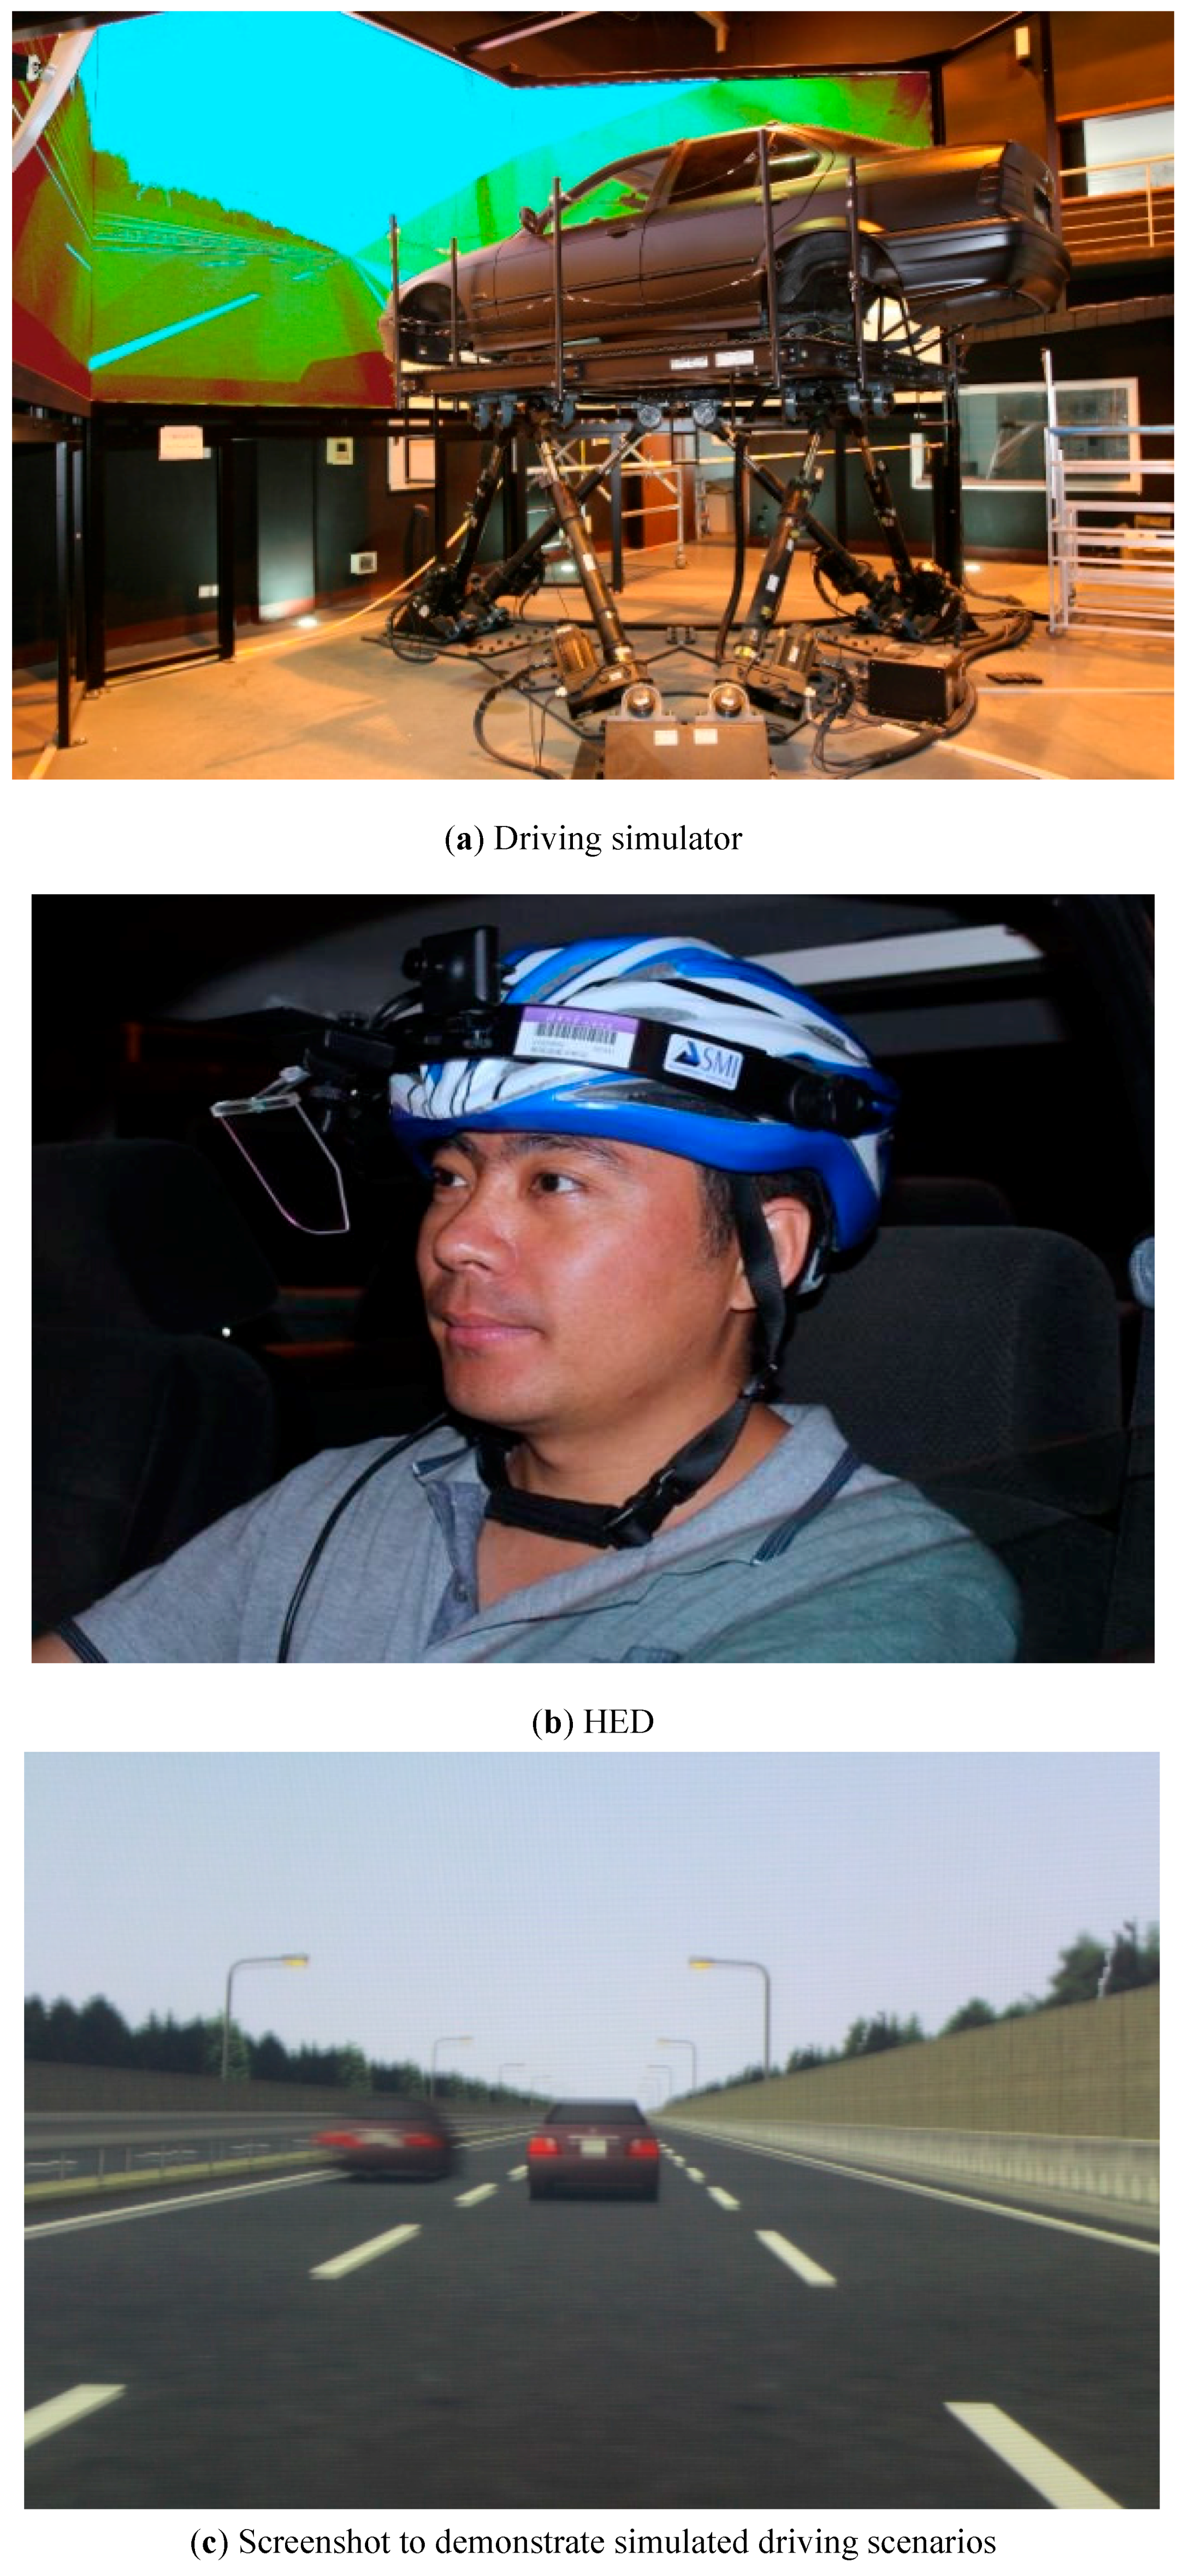
3.1. Apparatus
3.2. Participants
3.3. Scenario
3.4. Experiment Design
3.5. Procedure
3.6. Data Analysis
4. Results
4.1. Gaze Behavior
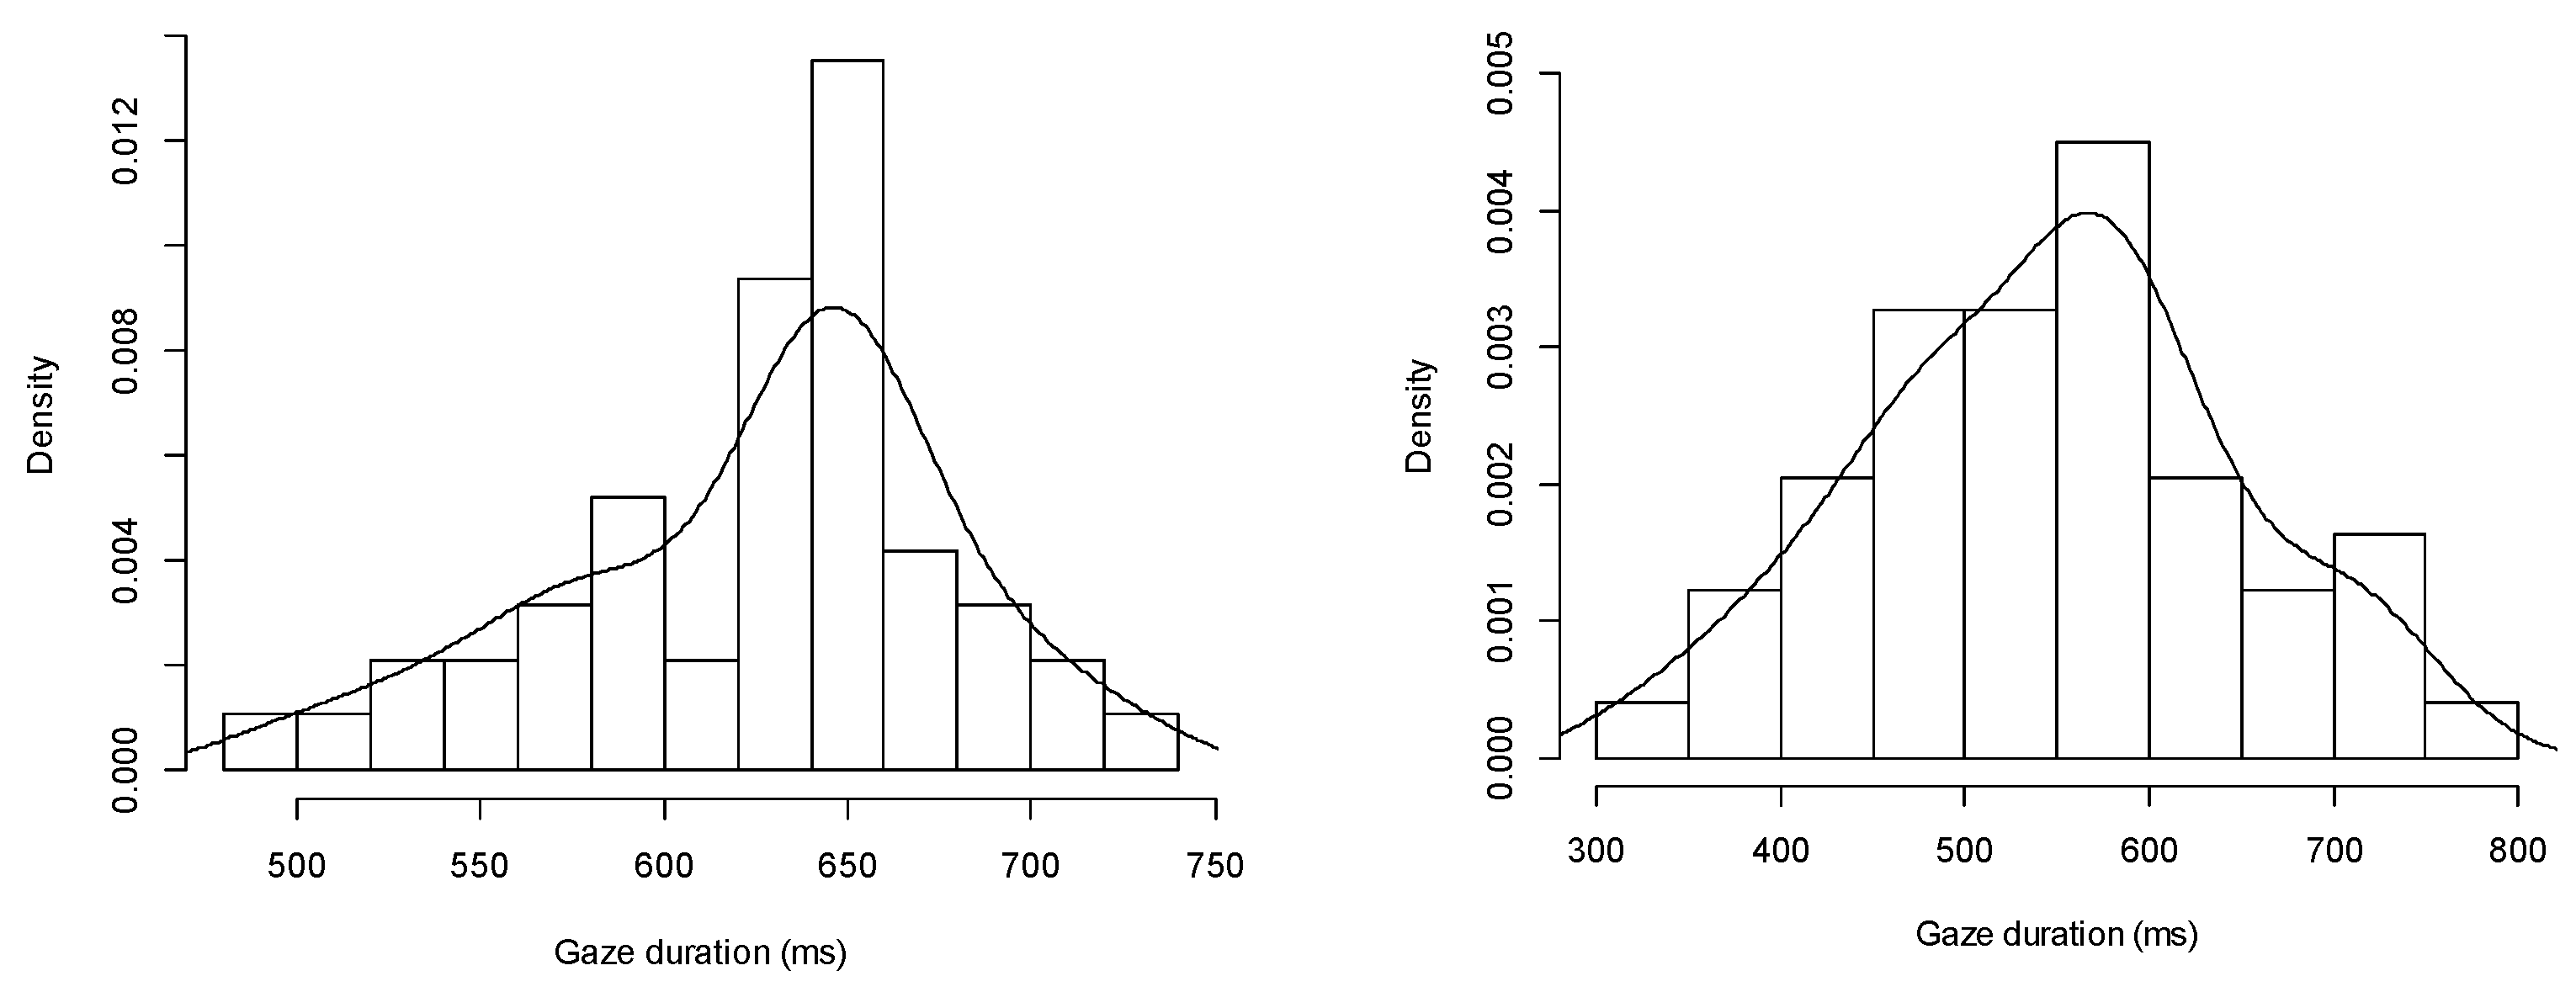
4.1.1. Gaze Duration
4.1.2. Gaze Frequency
4.2. Saccade Behavior
4.2.1. Saccade Duration
4.2.2. Saccade Frequency
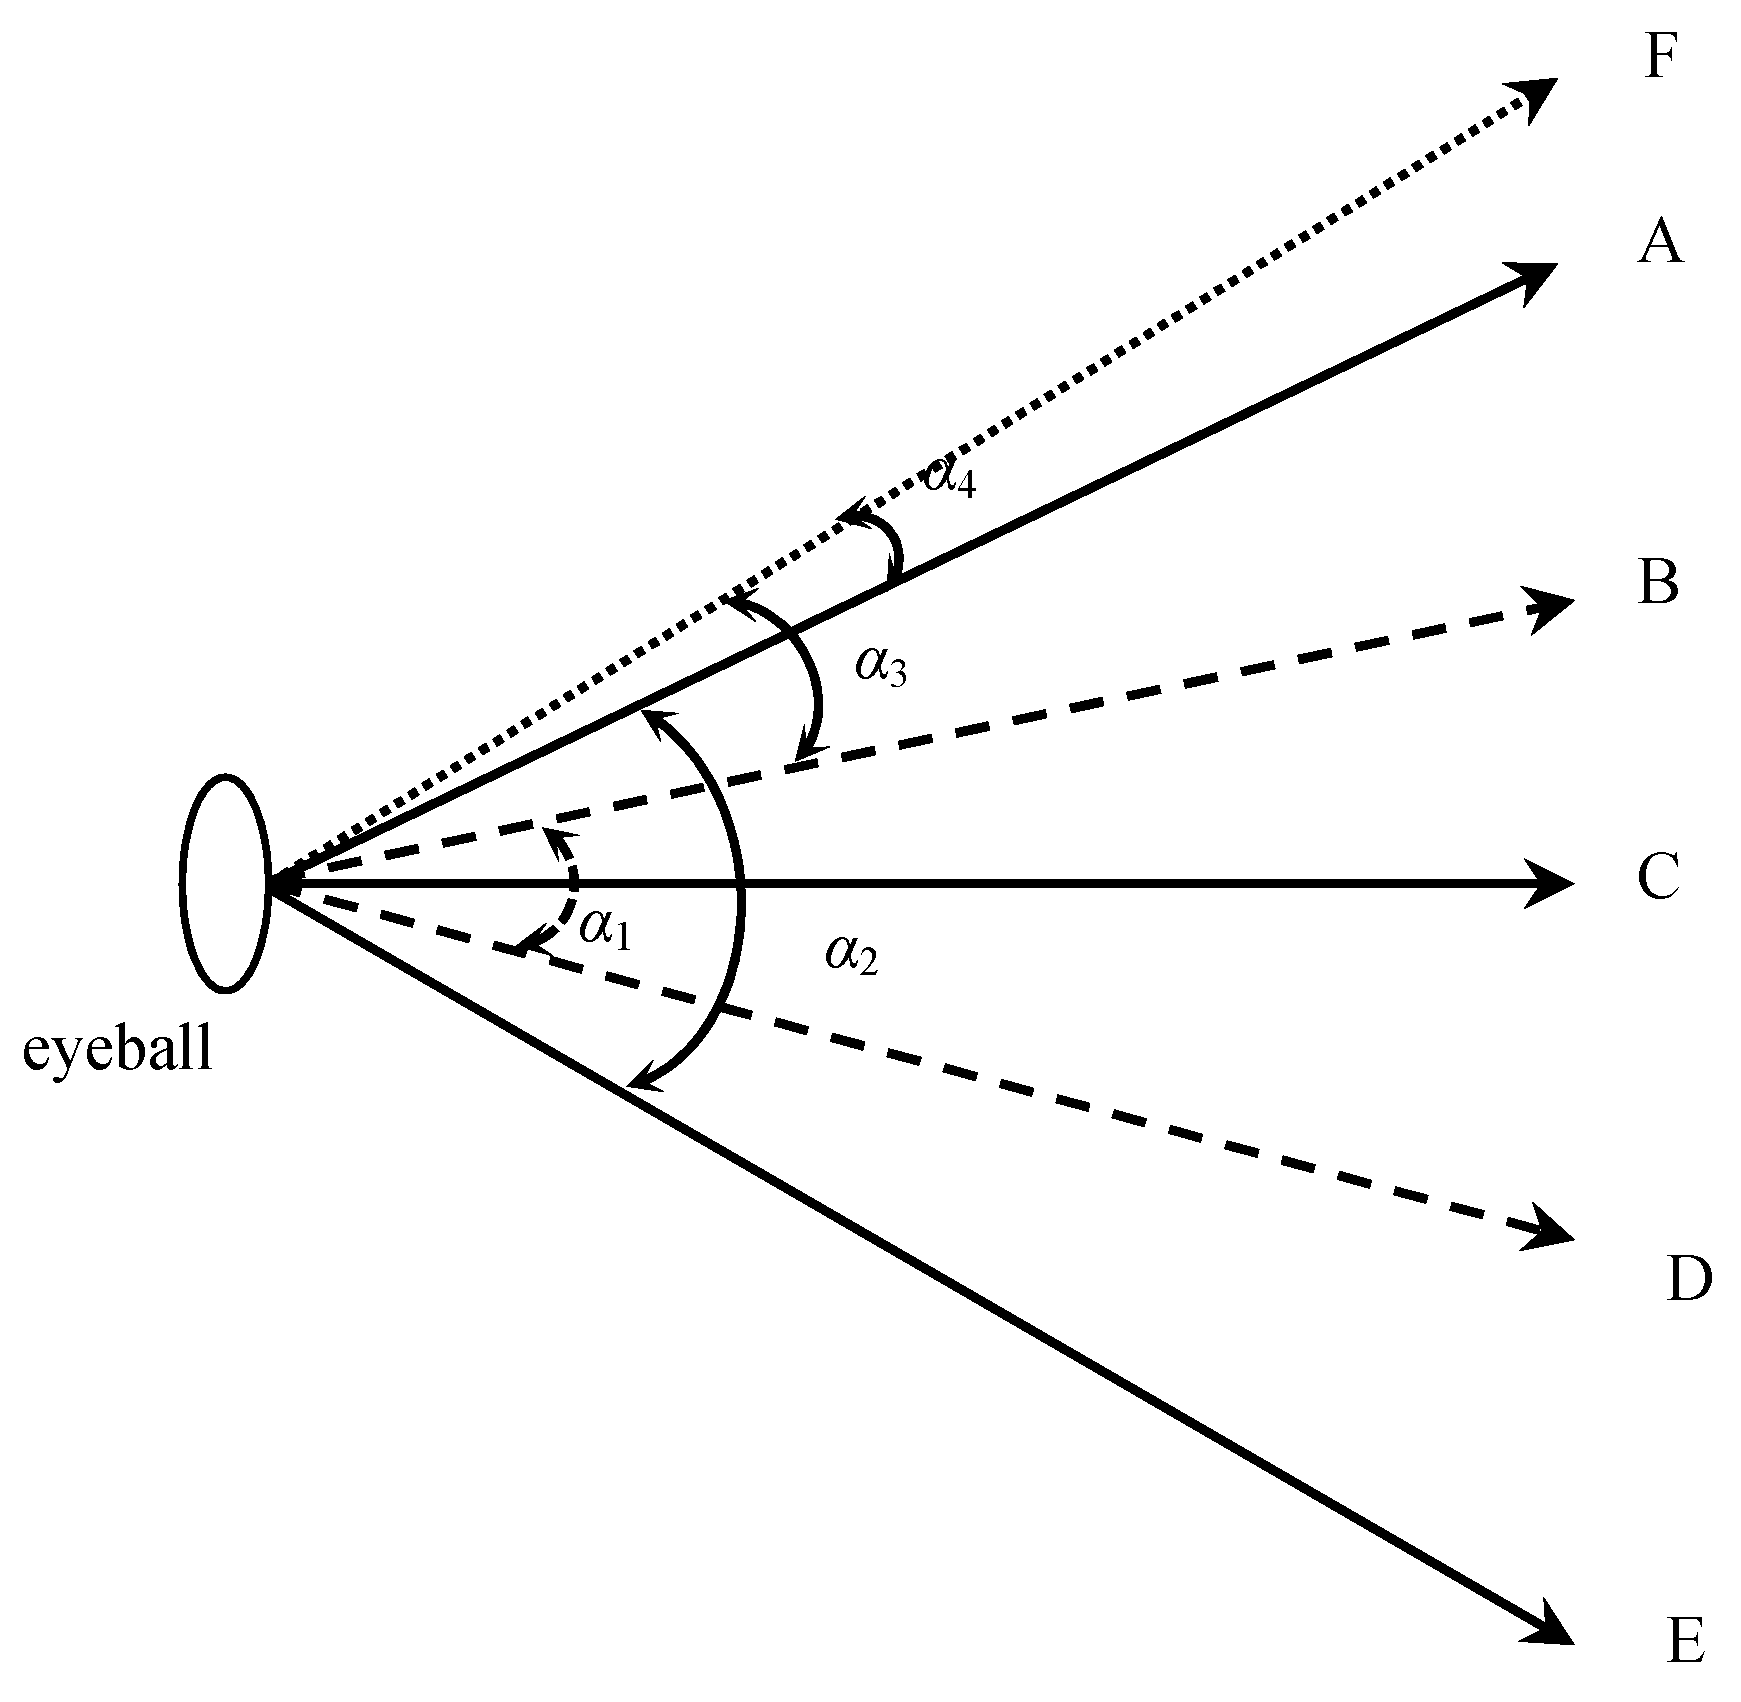
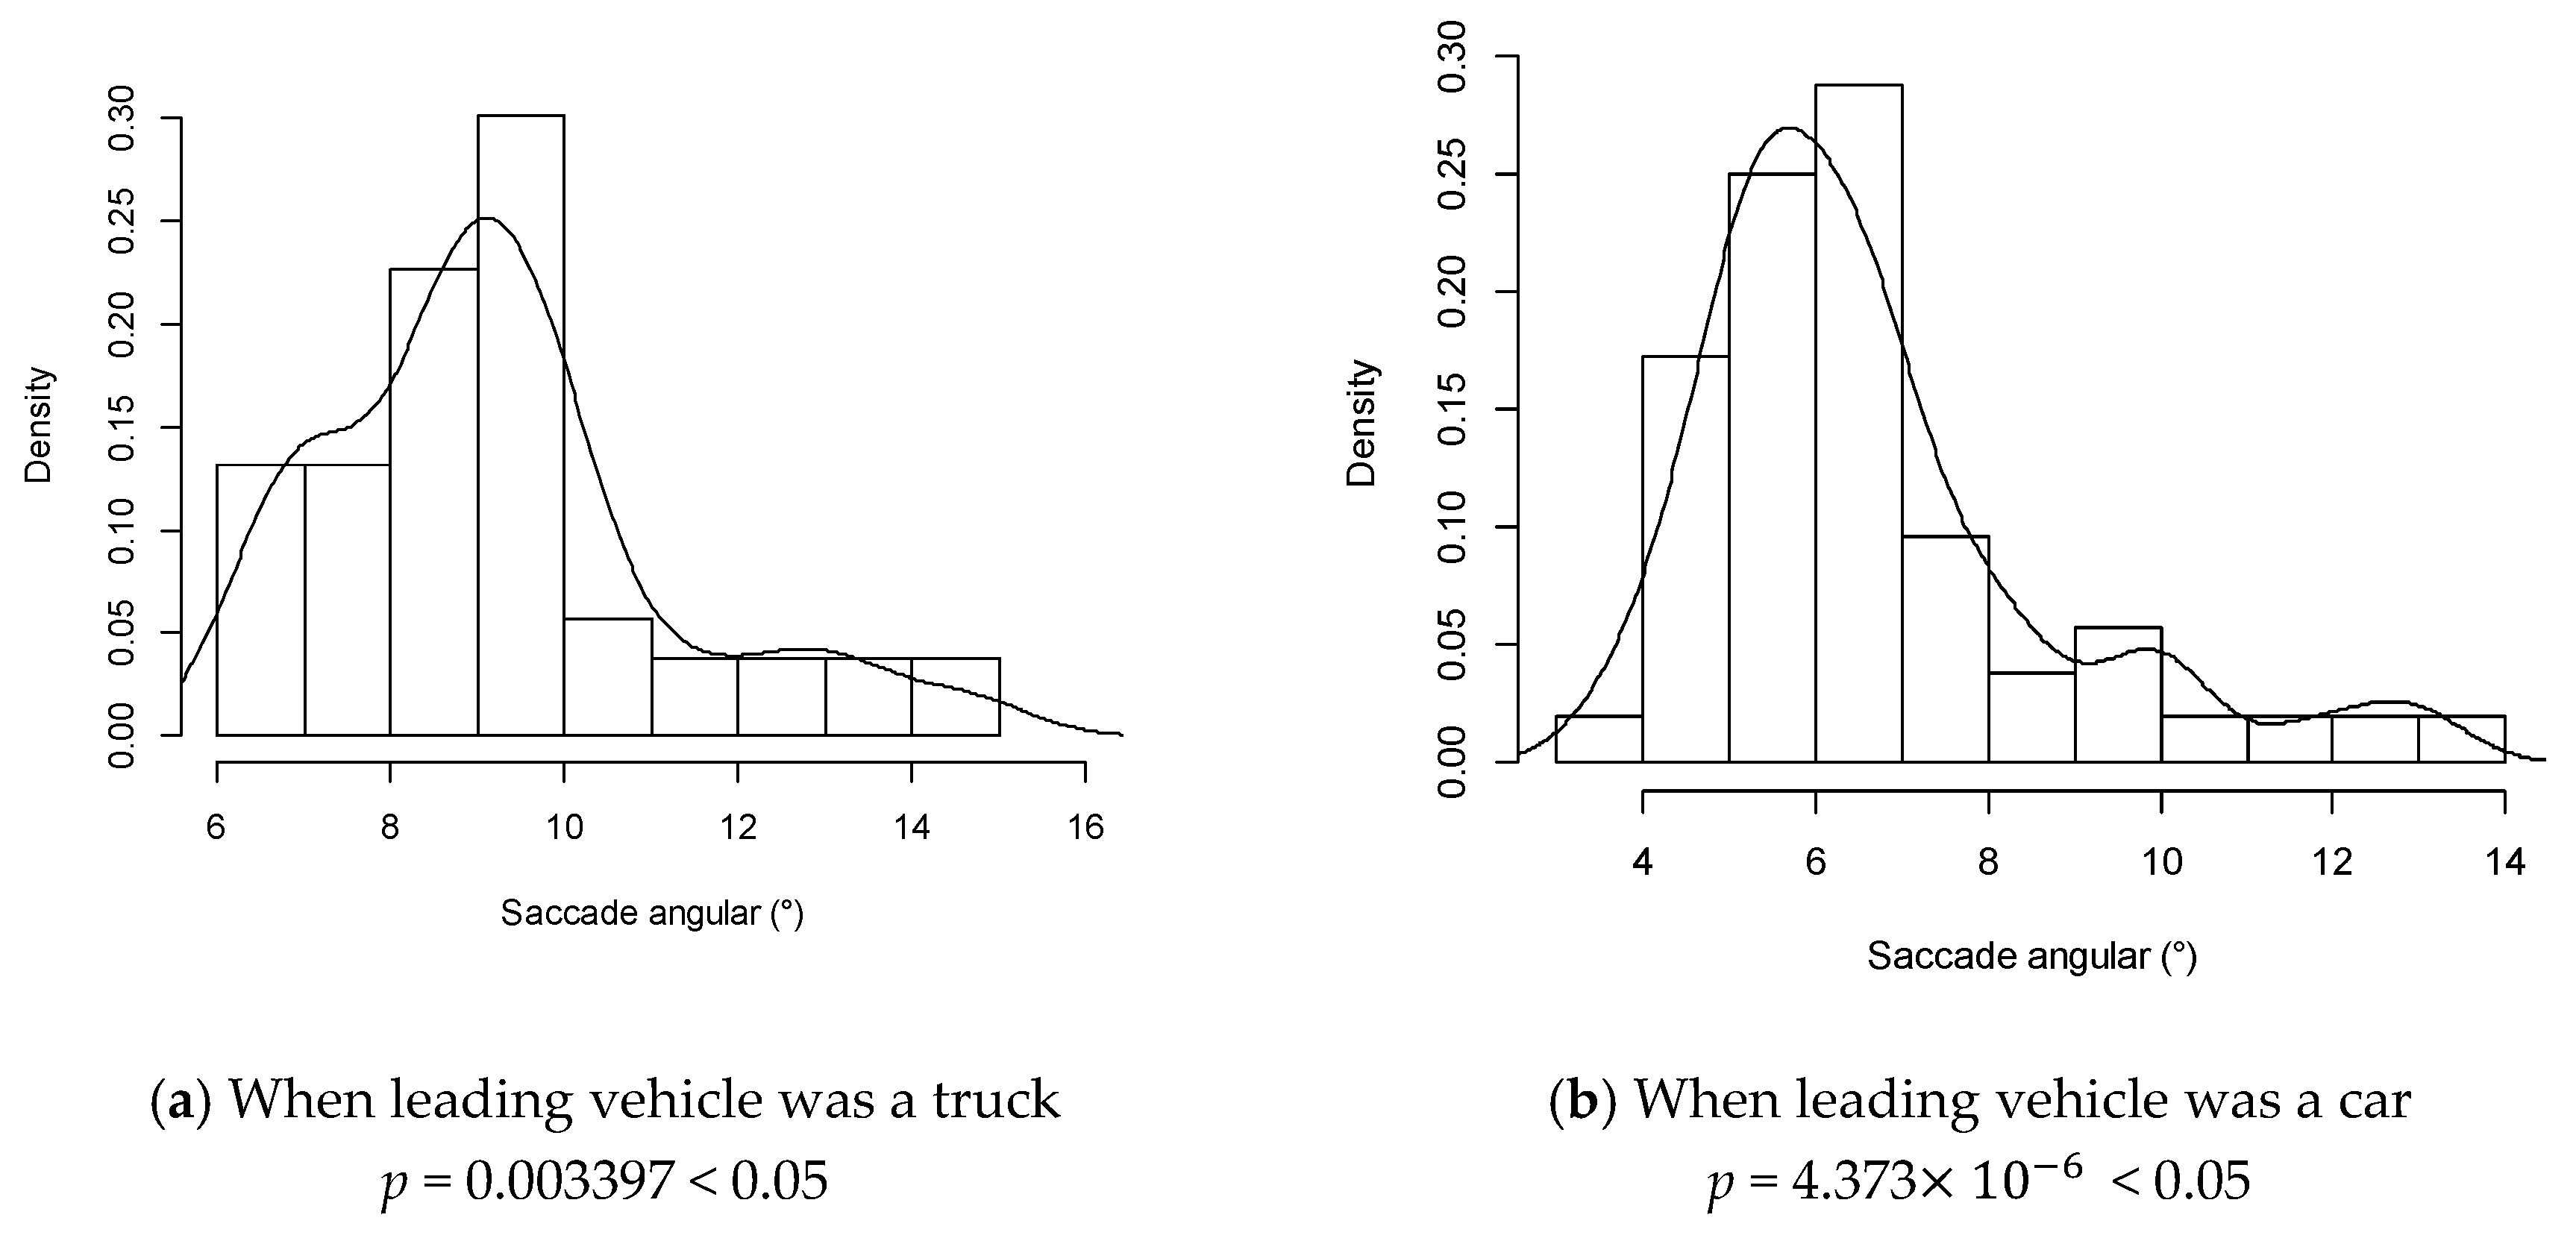
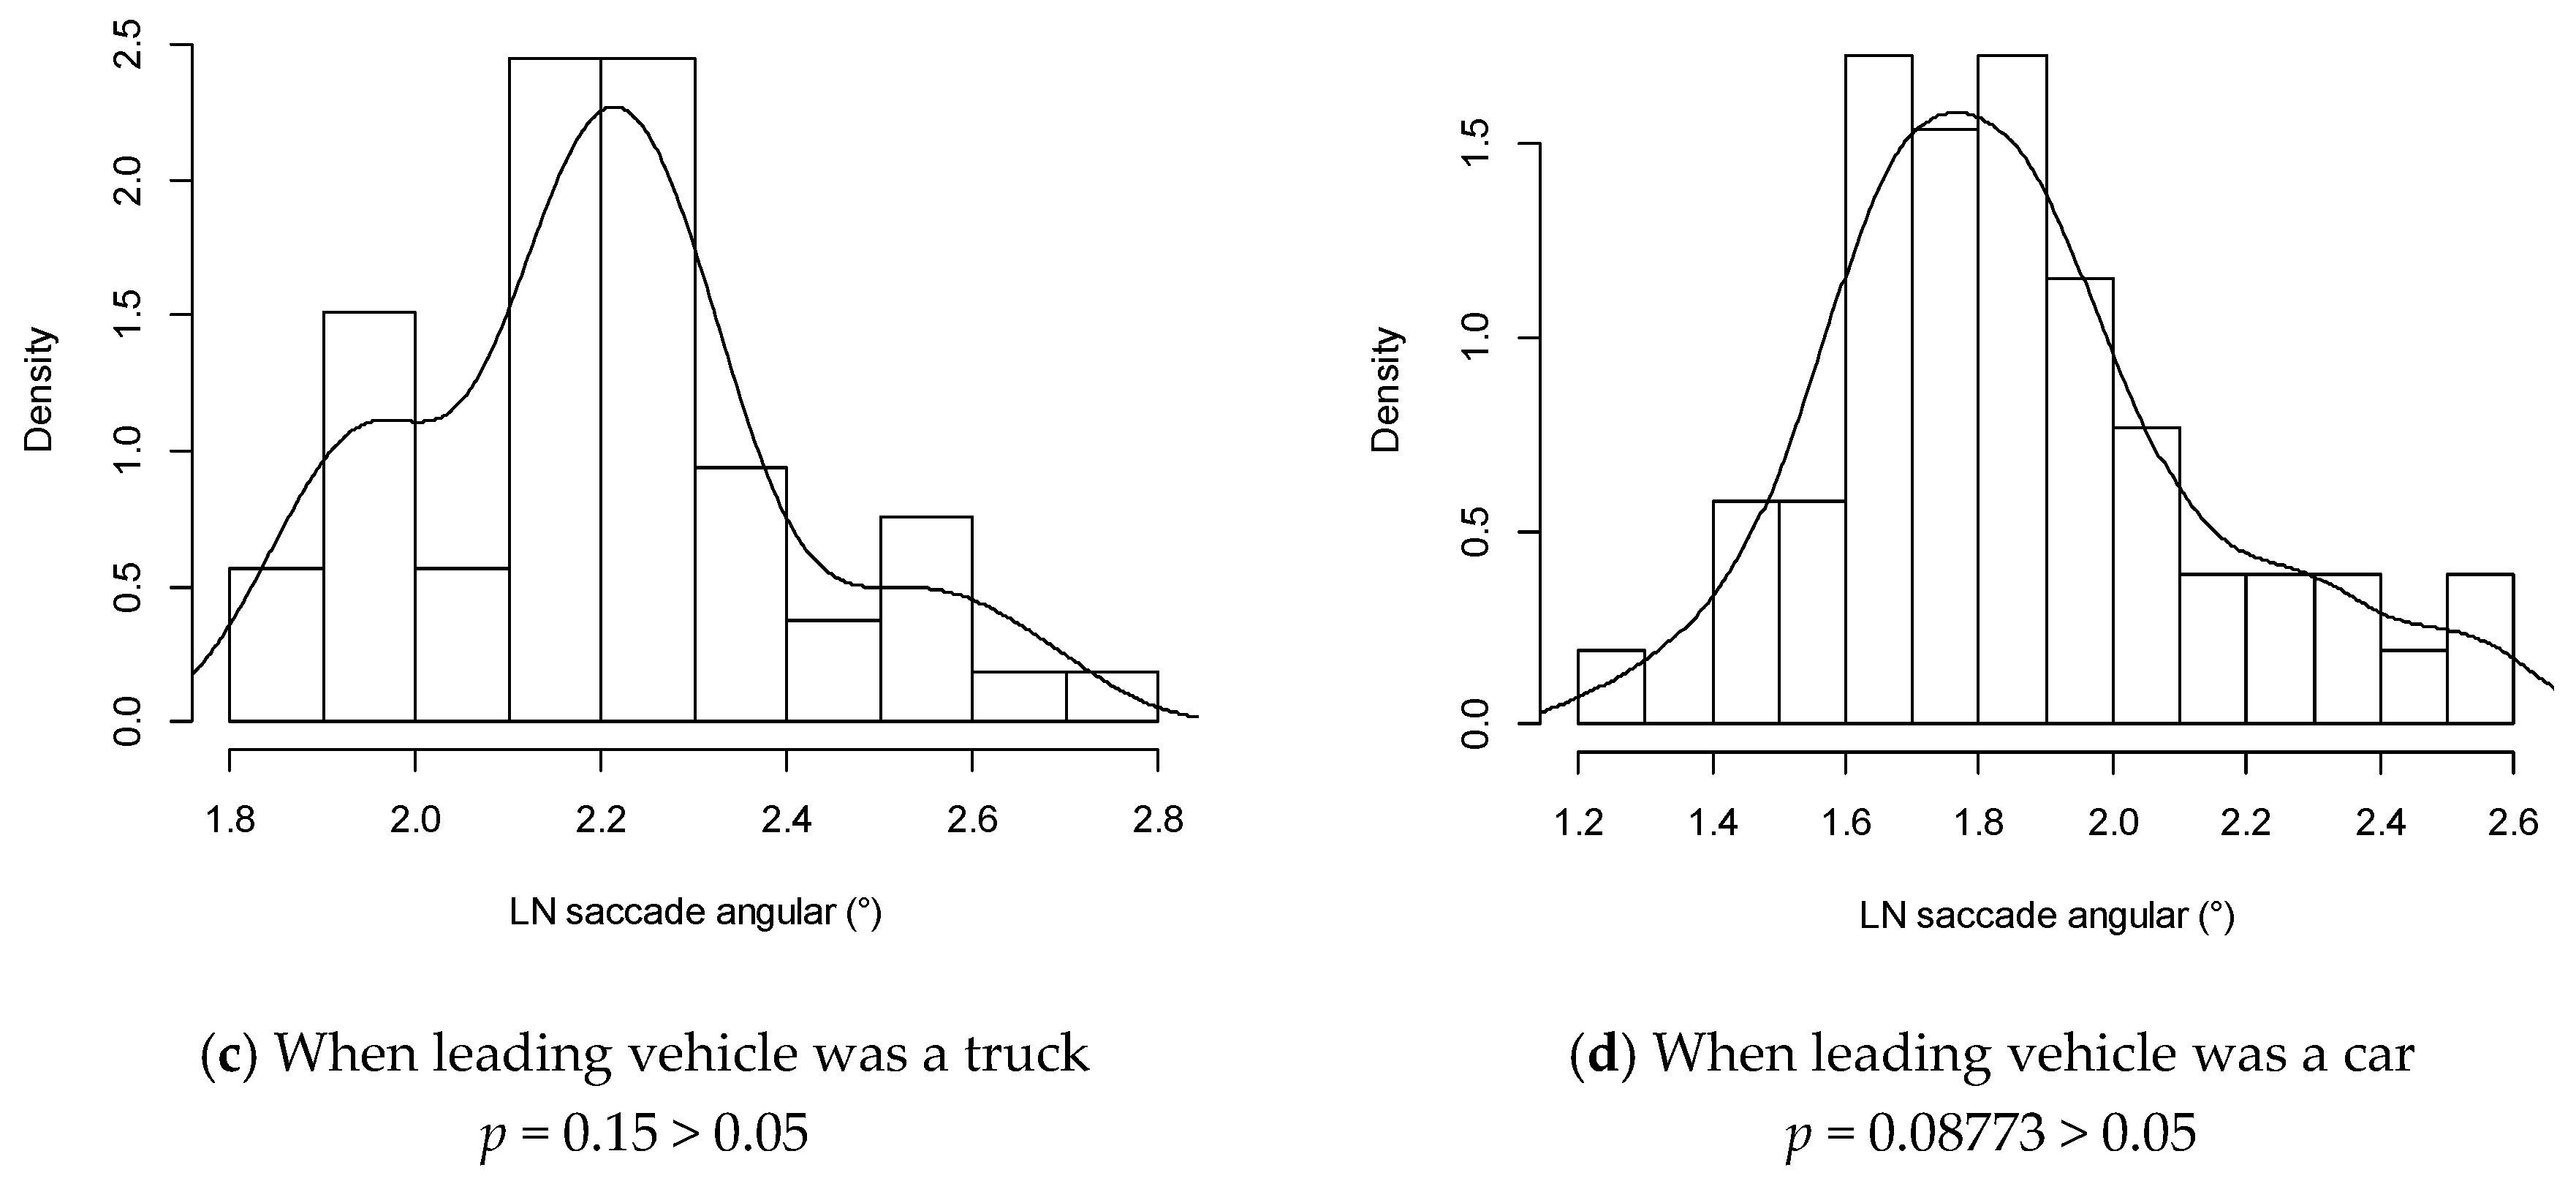
4.2.3. Saccade Angle
4.3. Visual Staying and Shifting Probability
5. Discussion
5.1. Gaze Behavior
5.2. Saccade Behavior
5.3. Visual Staying and Shifting
6. Conclusions
Acknowledgments
Author Contributions
Conflicts of Interest
Abbreviations
| HED | SMI iView X HED 4 system |
| BeGaze | Behavioral and Gaze Analysis 2.5 system |
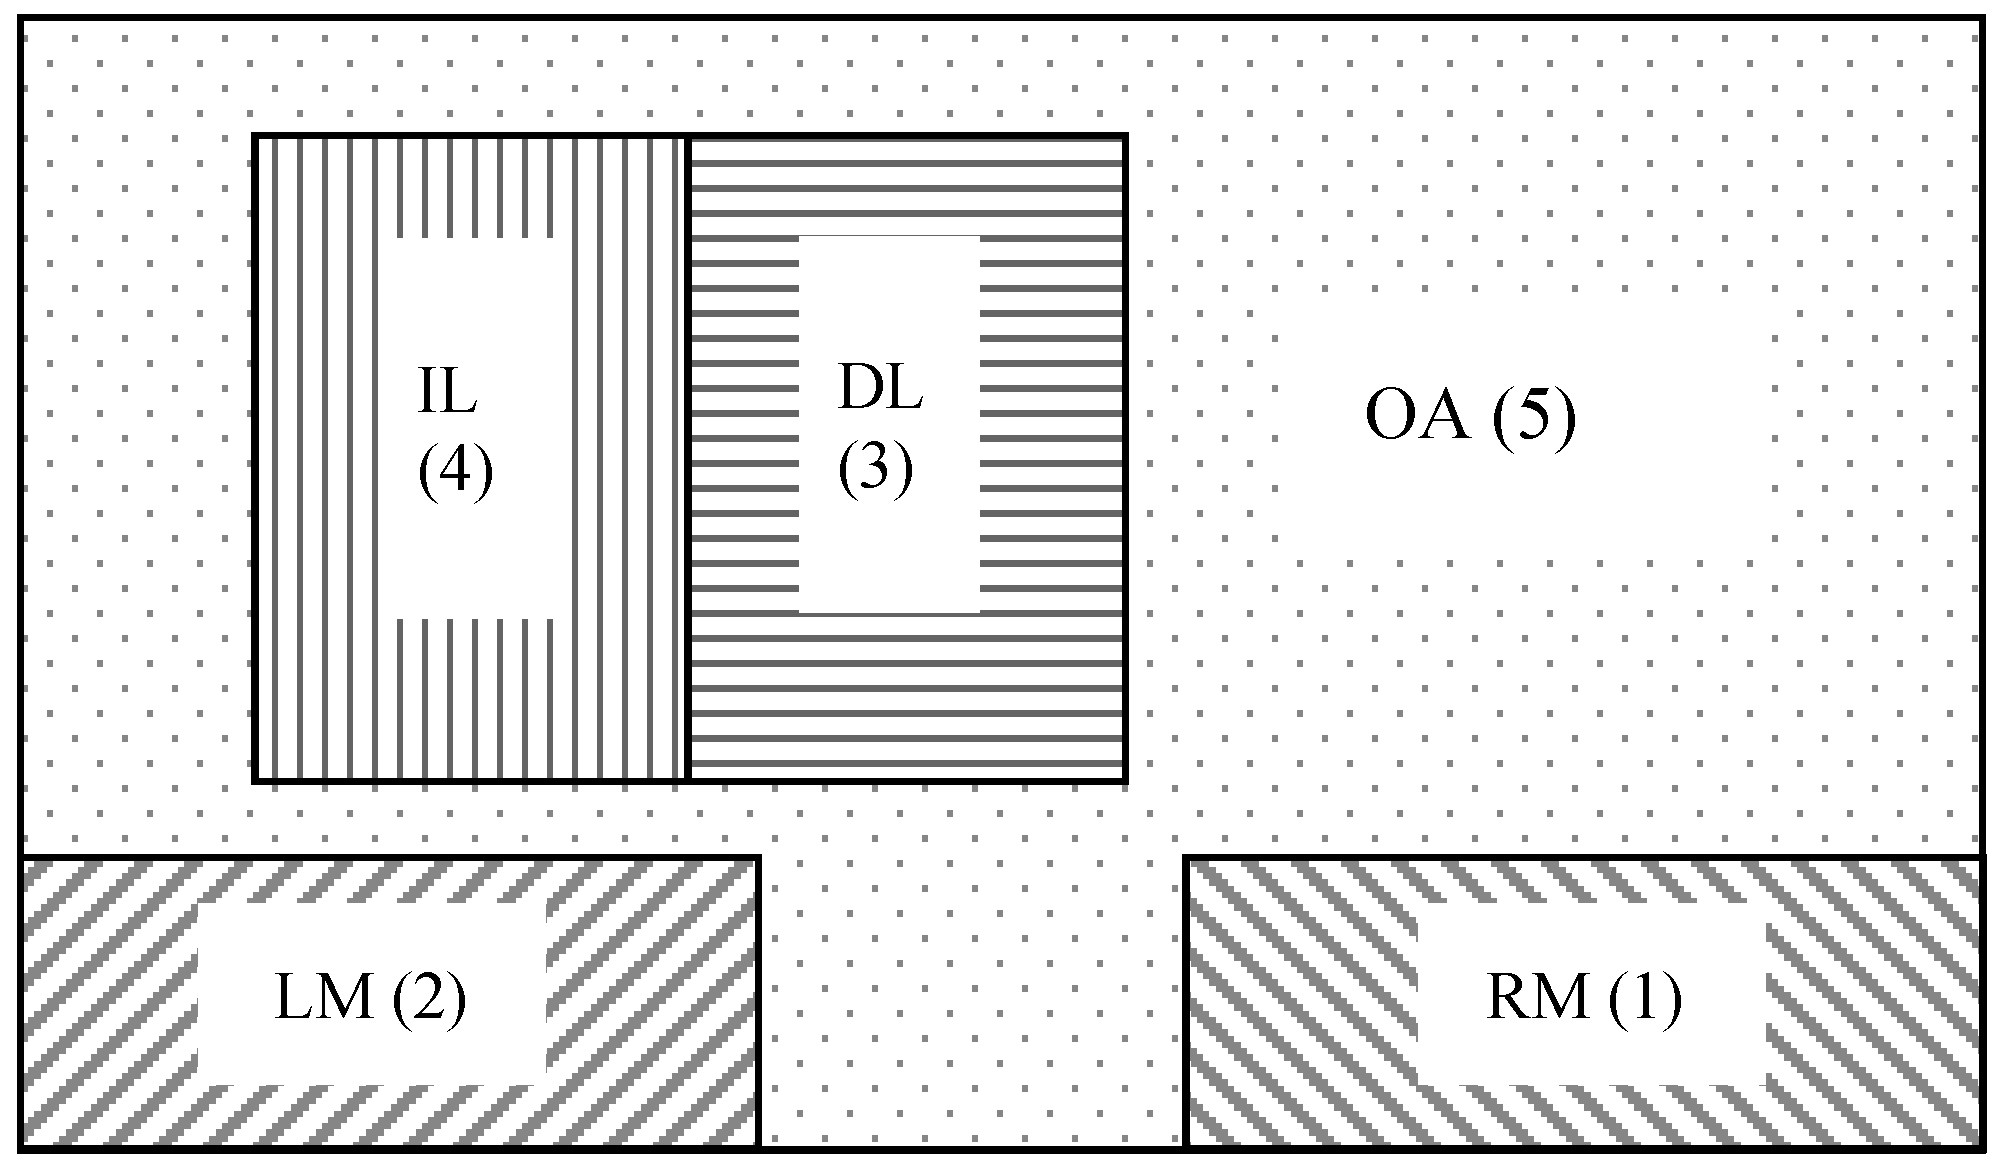
| AOI | area of interests |
| RM | right mirror |
| LM | left mirror |
| DL | destination lane |
| IL | initial lane |
| OA | other area |
References
- Bar-Gera, H.; Shinar, D. The tendency of drivers to pass other vehicles. Transp. Res. Part F Traffic Psychol. Behav. 2005, 8, 429–439. [Google Scholar] [CrossRef]
- Vlahogianni, E.I. Modeling duration of overtaking in two lane highways. Transp. Res. Part F Traffic Psychol. Behav. 2013, 20, 135–146. [Google Scholar] [CrossRef]
- Jamson, S.; Chorlton, K.; Carsten, O. Could Intelligent Speed Adaptation make overtaking unsafe? Accid. Anal. Prev. 2012, 48, 29–36. [Google Scholar] [CrossRef] [PubMed]
- Clarke, D.D.; Ward, P.J.; Jones, J. Overtaking road-accidents: differences in manoeuvre as a function of driver age. Accid. Anal. Prev. 1998, 30, 455–467. [Google Scholar] [CrossRef]
- Farah, H.; Yechiam, E.; Bekhor, S.; Toledo, T.; Polus, A. Association of risk proneness in overtaking maneuvers with impaired decision making. Transp. Res. Part F Traffic Psychol. Behav. 2008, 11, 313–323. [Google Scholar] [CrossRef]
- Kinnear, N.; Helman, S.; Wallbank, C.; Grayson, G. An experimental study of factors associated with driver frustration and overtaking intentions. Accid. Anal. Prev. 2015, 79, 221–230. [Google Scholar] [CrossRef] [PubMed]
- Benedetto, S.; Pedrotti, M.; Minin, L.; Baccino, T.; Re, A.; Montanari, R. Driver workload and eye blink duration. Transp. Res. Part F Traffic Psychol. Behav. 2011, 14, 199–208. [Google Scholar] [CrossRef]
- Balkin, T.J.; Horrey, W.J.; Graeber, R.C.; Czeislerd, R.A.; Dinges, D.F. The challenges and opportunities of technological approaches to fatigue management. Accid. Anal. Prev. 2011, 43, 565–572. [Google Scholar] [CrossRef] [PubMed]
- Merat, N.; Jamson, A.H. The effect of three low-cost engineering treatments on driver fatigue: A driving simulator study. Accid. Anal. Prev. 2013, 50, 8–15. [Google Scholar] [CrossRef] [PubMed]
- Watling, C.N.; Armstrong, K.A.; Radun, I. Examining signs of driver sleepiness, usage of sleepiness countermeasures and the associations with sleepy driving behaviours and individual factors. Accid. Anal. Prev. 2015, 85, 22–29. [Google Scholar] [CrossRef] [PubMed]
- Klauer, K.C.; Zhao, Z. Double dissociation in visual and spatial short-term memory. J. Exp. Psychol.-Gen. 2004, 133, 355–381. [Google Scholar] [CrossRef] [PubMed]
- Konstantopoulos, P.; Chapman, P.; Crundall, D. Exploring the ability to identify visual search differences when observing drivers’ eye movements. Transp. Res. Part F Traffic Psychol. Behav. 2012, 15, 378–386. [Google Scholar] [CrossRef]
- Scott, H.; Hall, L.; Litchfield, D.; Westwood, D. Visual information search in simulated junction negotiation: Gaze transitions of young novice, young experienced and older experienced drivers. J. Saf. Res. 2013, 45, 111–116. [Google Scholar] [CrossRef] [PubMed]
- Borowsky, A.; Horrey, W.J.; Liang, Y.; Garabet, A.; Simmons, L.; Fisher, D.L. The effects of momentary visual disruption on hazard anticipation and awareness in driving. Traffic Inj. Prev. 2014, 6, 133–139. [Google Scholar] [CrossRef] [PubMed]
- Gherri, E.; Forster, B. Independent effects of eye gaze and spatial attention on the processing of tactile events: Evidence from event-related potentials. Biol. Psychol. 2015, 109, 239–247. [Google Scholar] [CrossRef] [PubMed]
- Borowsky, A.; Horrey, W.J.; Liang, Y.; Garabet, A.; Simmons, L.; Fisher, D.L. The effects of brief visual interruption tasks on drivers’ ability to resume their visual search for a pre-cued hazard. Accid. Anal. Prev. 2016, 93, 207–216. [Google Scholar] [CrossRef] [PubMed]
- Braunagel, C.; Kasneci, E.; Stolzmann, W.; Rosenstiel, W. Driver-Activity Recognition in the Context of Conditionally Autonomous Driving. In Proceedings of the 18th International Conference on Intelligent Transportation Systems, Gran Canaria, Spain, 15–18 September 2015; pp. 1652–1657.
- Mohaymany, A.S.; Kashani, A.; Ranjbari, A. Identifying Driver Characteristics Influencing Overtaking Crashes. Traffic Inj. Prev. 2010, 11, 411–416. [Google Scholar] [CrossRef] [PubMed]
- Vlahogianni, E.I.; Golias, J.C. Bayesian modeling of the microscopic traffic characteristics of overtaking in two-lane highways. Transp. Res. Part F Traffic Psychol. Behav. 2012, 15, 348–357. [Google Scholar] [CrossRef]
- Harwood, D.W.; Gilmore, D.K.; Richard, K.R. Criteria for passing sight distance for roadway design and marking. Transp. Res. Rec. 2010, 2195, 36–46. [Google Scholar] [CrossRef]
- Yu, Y.; Kamel, A.E.; Gong, G. Modeling and simulation of overtaking behavior involving environment. Adv. Eng. Softw. 2014, 67, 10–21. [Google Scholar] [CrossRef]
- Qian, Y.; Luo, J.; Zeng, J.; Shao, X.; Guo, W. Study on security features of freeway traffic flow with cellular automata model—Taking the number of overtake as an example. Measurement 2013, 46, 2035–2042. [Google Scholar] [CrossRef]
- Llorca, C.; Moreno, A.T.; Lenorzer, A.; Casas, J.; Garcia, A. Development of a new microscopic passing maneuver model for two-lane rural roads. Transp. Res. Part. C Emerg. Technol. 2015, 52, 157–172. [Google Scholar] [CrossRef]
- Hofmann, P.; Rinkenauer, G. Response preparation in a lane change task. Ergonomics 2013, 56, 268–281. [Google Scholar] [CrossRef] [PubMed]
- Shahar, A.; Loon, E.; Clarke, D.; Crundall, D. Attending overtaking cars and motorcycles through the mirrors before changing lanes. Accid. Anal. Prev. 2012, 44, 104–110. [Google Scholar] [CrossRef] [PubMed]
- Tang, T.Q.; Huang, H.J.; Wong, S.C.; Xu, X.Y. A new overtaking model and numerical test. Phys. A 2007, 376, 649–657. [Google Scholar] [CrossRef]
- Crundall, D. Hazard prediction discriminates between novice and experienced drivers. Accid. Anal. Prev. 2016, 86, 47–58. [Google Scholar] [CrossRef] [PubMed]
- Craen, S.D.; Twisk, D.A.M.; Hagenzieker, M.P.; Elffers, H.; Brookhuis, K.A. Do young novice drivers overestimate their driving skills more than experienced drivers? Different methods lead to different conclusions. Accid. Anal. Prev. 2011, 43, 1660–1665. [Google Scholar] [CrossRef] [PubMed]
- Chapman, E.A.; Masten, S.V.; Browning, K.K. Crash and traffic violation rates before and after licensure for novice California drivers subject to different driver licensing requirements. J. Saf. Res. 2014, 50, 125–138. [Google Scholar] [CrossRef] [PubMed]
- Braitman, K.A.; Kirley, B.B.; McCartt, A.T.; Chaudhary, N.K. Crashes of novice teenage drivers: Characteristics and contributing factors. J. Saf. Res. 2008, 39, 47–54. [Google Scholar] [CrossRef] [PubMed]
- Mynttinenj, S.; Koivukoski, M.; Hakuli, K.; Keskinen, E. Finnish novice drivers’ competences—Successful driving test candidates 2000–2009 evaluated by driving examiners. Transp. Res. Part F Traffic Psychol. Behav. 2011, 14, 66–75. [Google Scholar] [CrossRef]
- Kasneci, E.; Sippel, K.; Aehling, K.; Heister, M.; Rosenstiel, W.; Schiefer, U.; Papageorgiou, E. Drving with binocular visual field loss? A study on a supervised on-road parcours with simultaneous eye and head tracking. PLoS ONE 2014, 9, 1–13. [Google Scholar] [CrossRef] [PubMed]
- Crundall, D.; Loon, E.V.; Underwood, G. Attraction and distraction of attention with roadside advertisements. Accid. Anal. Prev. 2006, 38, 671–677. [Google Scholar] [CrossRef] [PubMed]
- Crundall, D.; Chapman, P.; Trawley, S.; Collins, L.; Loon, E.V.; Andrews, B.; Underwood, G. Some hazards are more attractive than others: Drivers of varying experience respond differently to different types of hazard. Accid. Anal. Prev. 2012, 45, 600–609. [Google Scholar] [CrossRef] [PubMed]
- Underwood, G.; Ngai, A.; Underwood, J. Driving experience and situation awareness in hazard detection. Saf. Sci. 2013, 56, 29–35. [Google Scholar] [CrossRef]
- Underwood, G. On-road behaviour of younger and older novices during the first six months of driving. Accid. Anal. Prev. 2013, 58, 235–243. [Google Scholar] [CrossRef] [PubMed]
- Konstantopoulos, P.; Crundall, D. The Driver Prioritisation Questionnaire: Exploring drivers’ self-report visual priorities in a range of driving scenarios. Accid. Anal. Prev. 2008, 40, 1925–1936. [Google Scholar] [CrossRef] [PubMed]
- Konstantopoulos, P.; Chapman, P.; Crundall, D. Driver’s visual attention as a function of driving experience and visibility. Using a driving simulator to explore drivers’ eye movements in day, night and rain driving. Accid. Anal. Prev. 2010, 42, 827–834. [Google Scholar] [CrossRef] [PubMed]
- Simons-Morton, B.G.; Guo, F.; Klauer, S.G.; Ehsani, J.P.; Pradhan, A.K. Keep your eyes on the road: Young driver crash risk increases according to duration of distraction. J. Adolesc. Health 2014, 54, 61–67. [Google Scholar] [CrossRef] [PubMed]
- O’Brien, F.; Klauer, S.G.; Ehsani, J.; Simons-Morton, B.C. Changes over 12 months in eye glances during secondary task engagement among novice drivers. Accid. Anal. Prev. 2016, 93, 48–54. [Google Scholar] [CrossRef] [PubMed]
- Carmi, R.; Itti, L. Visual causes versus correlates of attentional selection in dynamic scenes. Vis. Res. 2006, 46, 4333–4345. [Google Scholar] [CrossRef] [PubMed]
- Romoser, M.R.E.; Pollatsek, A.; Fisher, D.L.; Williams, C.C. Comparing the glance patterns of older versus younger experienced drivers: Scanning for hazards while approaching and entering the intersection. Transp. Res. Part F Traffic Psychol. Behav. 2013, 16, 104–116. [Google Scholar] [CrossRef] [PubMed]
- Divekar, G.; Pradhan, A.K.; Masserang, K.M.; Reagan, I.; Pollatsek, A.; Fisher, D.L. A simulator evaluation of the effects of attention maintenance training on glance distributions of younger novice drivers inside and outside the vehicle. Transp. Res. Part F Traffic Psychol. Behav. 2013, 20, 154–169. [Google Scholar] [CrossRef] [PubMed]
- Kübler, T.C.; Kasneci, E.; Rosenstiel, W.; Schiefer, U. Stress-indicators and exploratory gaze for the analysis of hazard perception in patients with visual field loss. Transp. Res. Part F Traffic Psychol. Behav. 2014, 24, 231–243. [Google Scholar] [CrossRef]
- Kasneci, E.; Kasneci, G.; Kubler, T.C.; Rosenstiel, W. Online recognition of fixations, saccades, and smooth pursuits for automated analysis of traffic hazard perception. Artif. Neural Netw. 2015. [Google Scholar] [CrossRef]
- Pastor, G.; Tejero, P.; Chóliz, M.; Roca, J. Rear-view mirror use, driver alertness and road type: An empirical study using EEG measures. Transp. Res. Part F Traffic Psychol. Behav. 2006, 9, 286–297. [Google Scholar] [CrossRef]
- Böffel, C.; Müsseler, J. Adjust your view! Wing-mirror settings influence distance estimations and lane-change decisions. Transp. Res. Part F Traffic Psychol. Behav. 2015, 32, 112–118. [Google Scholar] [CrossRef]
- Pollatsek, A.; Narayanaan, V.; Pradhan, A.; Fisher, D.L. Using eye movements to evaluate a PC-based risk awareness and perception training program on a driving simulator. Hum. Factors 2006, 48, 447–464. [Google Scholar] [CrossRef] [PubMed]
- McDonald, C.C.; Goodwin, A.H.; Pradhan, A.K.; Romoser, M.R.E.; Williams, A.F. A review of hazard anticipation training programs for young drivers. J. Adolesc. Health. 2015, 57, 15–23. [Google Scholar] [CrossRef] [PubMed]
- Large, D.R.; Crundall, E.; Burnett, G.; Harvey, C.; Konstantopoulos, P. Driving without wings: The effect of different digital mirror locations on the visual behaviour, performance and opinions of drivers. Appl. Ergon. 2016, 55, 138–148. [Google Scholar] [CrossRef] [PubMed]
- Abdel-Aty, M.; Abdelwahab, H. Analysis and prediction of traffic fatalities resulting from angle collisions including the effect of vehicle configuration and compatibility. Accid. Anal. Prev. 2004, 36, 457–469. [Google Scholar] [CrossRef]
- Reingold, E.M.; Reichle, E.D.; Glaholt, M.G.; Sheridan, H. Direct lexical control of eye movements in reading: Evidence from a survival analysis of fixation durations. Cogn. Psychol. 2012, 65, 177–206. [Google Scholar] [CrossRef] [PubMed]
- Rogé, J.; Pébayle, T.; Lambilliotte, E.; Spitzenstetter, F.; Giselbrecht, D.; Muzet, A. Influence of age, speed and duration of monotonous driving task in traffic on the driver’s useful visual field. Vis. Res. 2004, 44, 2737–2744. [Google Scholar] [CrossRef] [PubMed]
- Milanés, V.; Llorca, D.F.; Villagrá, J.; Pérez, J.; Fernández, C.; Parra, I.; González, C.; Sotelo, M.A. Intelligent automatic overtaking system using vision for vehicle detection. Expert Syst. Appl. 2002, 39, 3362–3373. [Google Scholar] [CrossRef] [Green Version]
- Hegeman, G.; Tapani, A.; Hoogendoorn, S. Overtaking assistant assessment using traffic simulation. Transp. Res. Part. C Emerg. Technol. 2009, 17, 617–630. [Google Scholar] [CrossRef]


| Statistics | Min | Max | Mean | Standard Deviation |
|---|---|---|---|---|
| Age | 29 | 54 | 37.25 | 14.63 |
| Years of licensed driving experience | 2 | 22 | 10.84 | 22.56 |
| km traveled | 21,000 | 1,200,000 | 110,126.45 | 121,225.57 |
| Gaze Behavior | Leading Vehicle | Speed (km/h) | ||||
|---|---|---|---|---|---|---|
| 60 | 70 | 80 | 90 | 100 | ||
| Mean gaze duration (ms) | Truck | 626.53 | 608.18 | 582.69 | 575.62 | 579.61 |
| Car | 541.54 | 523.21 | 520.54 | 516.97 | 516.25 | |
| Gaze frequency (Hz) | Truck | 1.14 | 1.22 | 1.26 | 1.24 | 1.21 |
| Car | 1.40 | 1.43 | 1.42 | 1.35 | 1.37 | |
| Saccade Behavior | Leading Vehicle | Speed (km/h) | ||||
|---|---|---|---|---|---|---|
| 60 | 70 | 80 | 90 | 100 | ||
| Mean saccade duration (ms) | Truck | 46.21 | 55.92 | 58.55 | 65.89 | 102.51 |
| Car | 45.24 | 45.99 | 51.07 | 59.22 | 97.69 | |
| Saccade frequency (Hz) | Truck | 1.02 | 1.04 | 1.09 | 1.18 | 1.04 |
| Car | 1.15 | 1.27 | 1.22 | 1.17 | 1.24 | |
| Mean saccade angle (°) | Truck | 9.14 | 13.64 | 14.77 | 21.24 | 39.63 |
| Car | 6.36 | 8.69 | 13.61 | 17.28 | 33.61 | |
| Speed (km/h) | Type of a Leading Vehicle | ||||||||||
|---|---|---|---|---|---|---|---|---|---|---|---|
| Truck | Car | ||||||||||
| AOI | RM (1) | LM (2) | DL (3) | IL (4) | OA (5) | RM (1) | LM (2) | DL (3) | IL (4) | OA (5) | |
| 60 | RM (1) | 0.0722 | 0.0000 | 0.0660 | 0.0328 | 0.0035 | 0.0855 | 0.0000 | 0.0555 | 0.0744 | 0.0000 |
| LM (2) | 0.0000 | 0.0612 | 0.0306 | 0.0668 | 0.0010 | 0.0000 | 0.0602 | 0.0343 | 0.0647 | 0.0031 | |
| DL (3) | 0.0663 | 0.0683 | 0.3374 | 0.2084 | 0.0278 | 0.0678 | 0.0608 | 0.3519 | 0.2461 | 0.0060 | |
| IL (4) | 0.0368 | 0.0473 | 0.1747 | 0.4520 | 0.0595 | 0.0591 | 0.0375 | 0.2193 | 0.4256 | 0.0216 | |
| OA (5) | 0.0015 | 0.0057 | 0.0486 | 0.0546 | 0.0722 | 0.0029 | 0.0000 | 0.0191 | 0.0277 | 0.0768 | |
| 70 | RM (1) | 0.0748 | 0.0028 | 0.0566 | 0.0644 | 0.0028 | 0.0769 | 0.0000 | 0.0463 | 0.0612 | 0.0000 |
| LM (2) | 0.0000 | 0.0692 | 0.0371 | 0.0889 | 0.0018 | 0.0000 | 0.0768 | 0.0535 | 0.0615 | 0.0028 | |
| DL (3) | 0.0489 | 0.0602 | 0.3524 | 0.1715 | 0.0183 | 0.0580 | 0.0734 | 0.3457 | 0.2088 | 0.0127 | |
| IL (4) | 0.0749 | 0.0614 | 0.1816 | 0.3973 | 0.0447 | 0.0420 | 0.0355 | 0.2004 | 0.4060 | 0.0567 | |
| OA (5) | 0.0046 | 0.0062 | 0.0328 | 0.0406 | 0.1063 | 0.0024 | 0.0106 | 0.0211 | 0.0531 | 0.0946 | |
| 80 | RM (1) | 0.0730 | 0.0049 | 0.0689 | 0.0542 | 0.0000 | 0.0813 | 0.0000 | 0.0646 | 0.0566 | 0.0000 |
| LM (2) | 0.0111 | 0.0858 | 0.0464 | 0.0690 | 0.0011 | 0.0000 | 0.0674 | 0.0276 | 0.0767 | 0.0000 | |
| DL (3) | 0.0670 | 0.0735 | 0.4088 | 0.1919 | 0.0142 | 0.0757 | 0.0650 | 0.3626 | 0.2066 | 0.0157 | |
| IL (4) | 0.0539 | 0.0412 | 0.1611 | 0.3411 | 0.0575 | 0.0372 | 0.0475 | 0.1925 | 0.3898 | 0.0520 | |
| OA (5) | 0.0000 | 0.0095 | 0.0302 | 0.0443 | 0.0913 | 0.0028 | 0.0046 | 0.0218 | 0.0532 | 0.0989 | |
| 90 | RM (1) | 0.0621 | 0.0072 | 0.0397 | 0.0467 | 0.0076 | 0.0806 | 0.0000 | 0.0295 | 0.0607 | 0.0037 |
| LM (2) | 0.0049 | 0.0790 | 0.0289 | 0.0757 | 0.0075 | 0.0000 | 0.0819 | 0.0435 | 0.0946 | 0.0040 | |
| DL (3) | 0.0531 | 0.0603 | 0.3748 | 0.2200 | 0.0328 | 0.0193 | 0.0902 | 0.3082 | 0.2114 | 0.0275 | |
| IL (4) | 0.0382 | 0.0428 | 0.2065 | 0.3374 | 0.0336 | 0.0740 | 0.0316 | 0.1982 | 0.3499 | 0.0351 | |
| OA (5) | 0.0051 | 0.0067 | 0.0432 | 0.0403 | 0.1467 | 0.0016 | 0.0040 | 0.0317 | 0.0395 | 0.1794 | |
| 100 | RM (1) | 0.0742 | 0.0111 | 0.0524 | 0.0506 | 0.0063 | 0.0724 | 0.0000 | 0.0349 | 0.0584 | 0.0063 |
| LM (2) | 0.0114 | 0.0777 | 0.0472 | 0.0923 | 0.0056 | 0.0063 | 0.0677 | 0.0379 | 0.0559 | 0.0072 | |
| DL (3) | 0.0355 | 0.0810 | 0.4063 | 0.1708 | 0.0319 | 0.0528 | 0.0487 | 0.3285 | 0.1915 | 0.0224 | |
| IL (4) | 0.0600 | 0.0456 | 0.1663 | 0.3274 | 0.0386 | 0.0745 | 0.0439 | 0.2101 | 0.4258 | 0.0536 | |
| OA (5) | 0.0100 | 0.0056 | 0.0299 | 0.0480 | 0.1144 | 0.0054 | 0.0084 | 0.0269 | 0.0547 | 0.1056 | |
© 2016 by the authors; licensee MDPI, Basel, Switzerland. This article is an open access article distributed under the terms and conditions of the Creative Commons Attribution (CC-BY) license (http://creativecommons.org/licenses/by/4.0/).
Share and Cite
Zhang, W.; Dai, J.; Pei, Y.; Li, P.; Yan, Y.; Chen, X. Drivers’ Visual Search Patterns during Overtaking Maneuvers on Freeway. Int. J. Environ. Res. Public Health 2016, 13, 1159. https://doi.org/10.3390/ijerph13111159
Zhang W, Dai J, Pei Y, Li P, Yan Y, Chen X. Drivers’ Visual Search Patterns during Overtaking Maneuvers on Freeway. International Journal of Environmental Research and Public Health. 2016; 13(11):1159. https://doi.org/10.3390/ijerph13111159
Chicago/Turabian StyleZhang, Wenhui, Jing Dai, Yulong Pei, Penghui Li, Ying Yan, and Xinqiang Chen. 2016. "Drivers’ Visual Search Patterns during Overtaking Maneuvers on Freeway" International Journal of Environmental Research and Public Health 13, no. 11: 1159. https://doi.org/10.3390/ijerph13111159