
Association between the Osteoporosis Self-Assessment Tool for Asians Score and Mortality in Patients with Isolated Moderate and Severe Traumatic Brain Injury: A Propensity Score-Matched Analysis


 ,
,
Abstract
:1. Introduction
2. Methods
Study Design
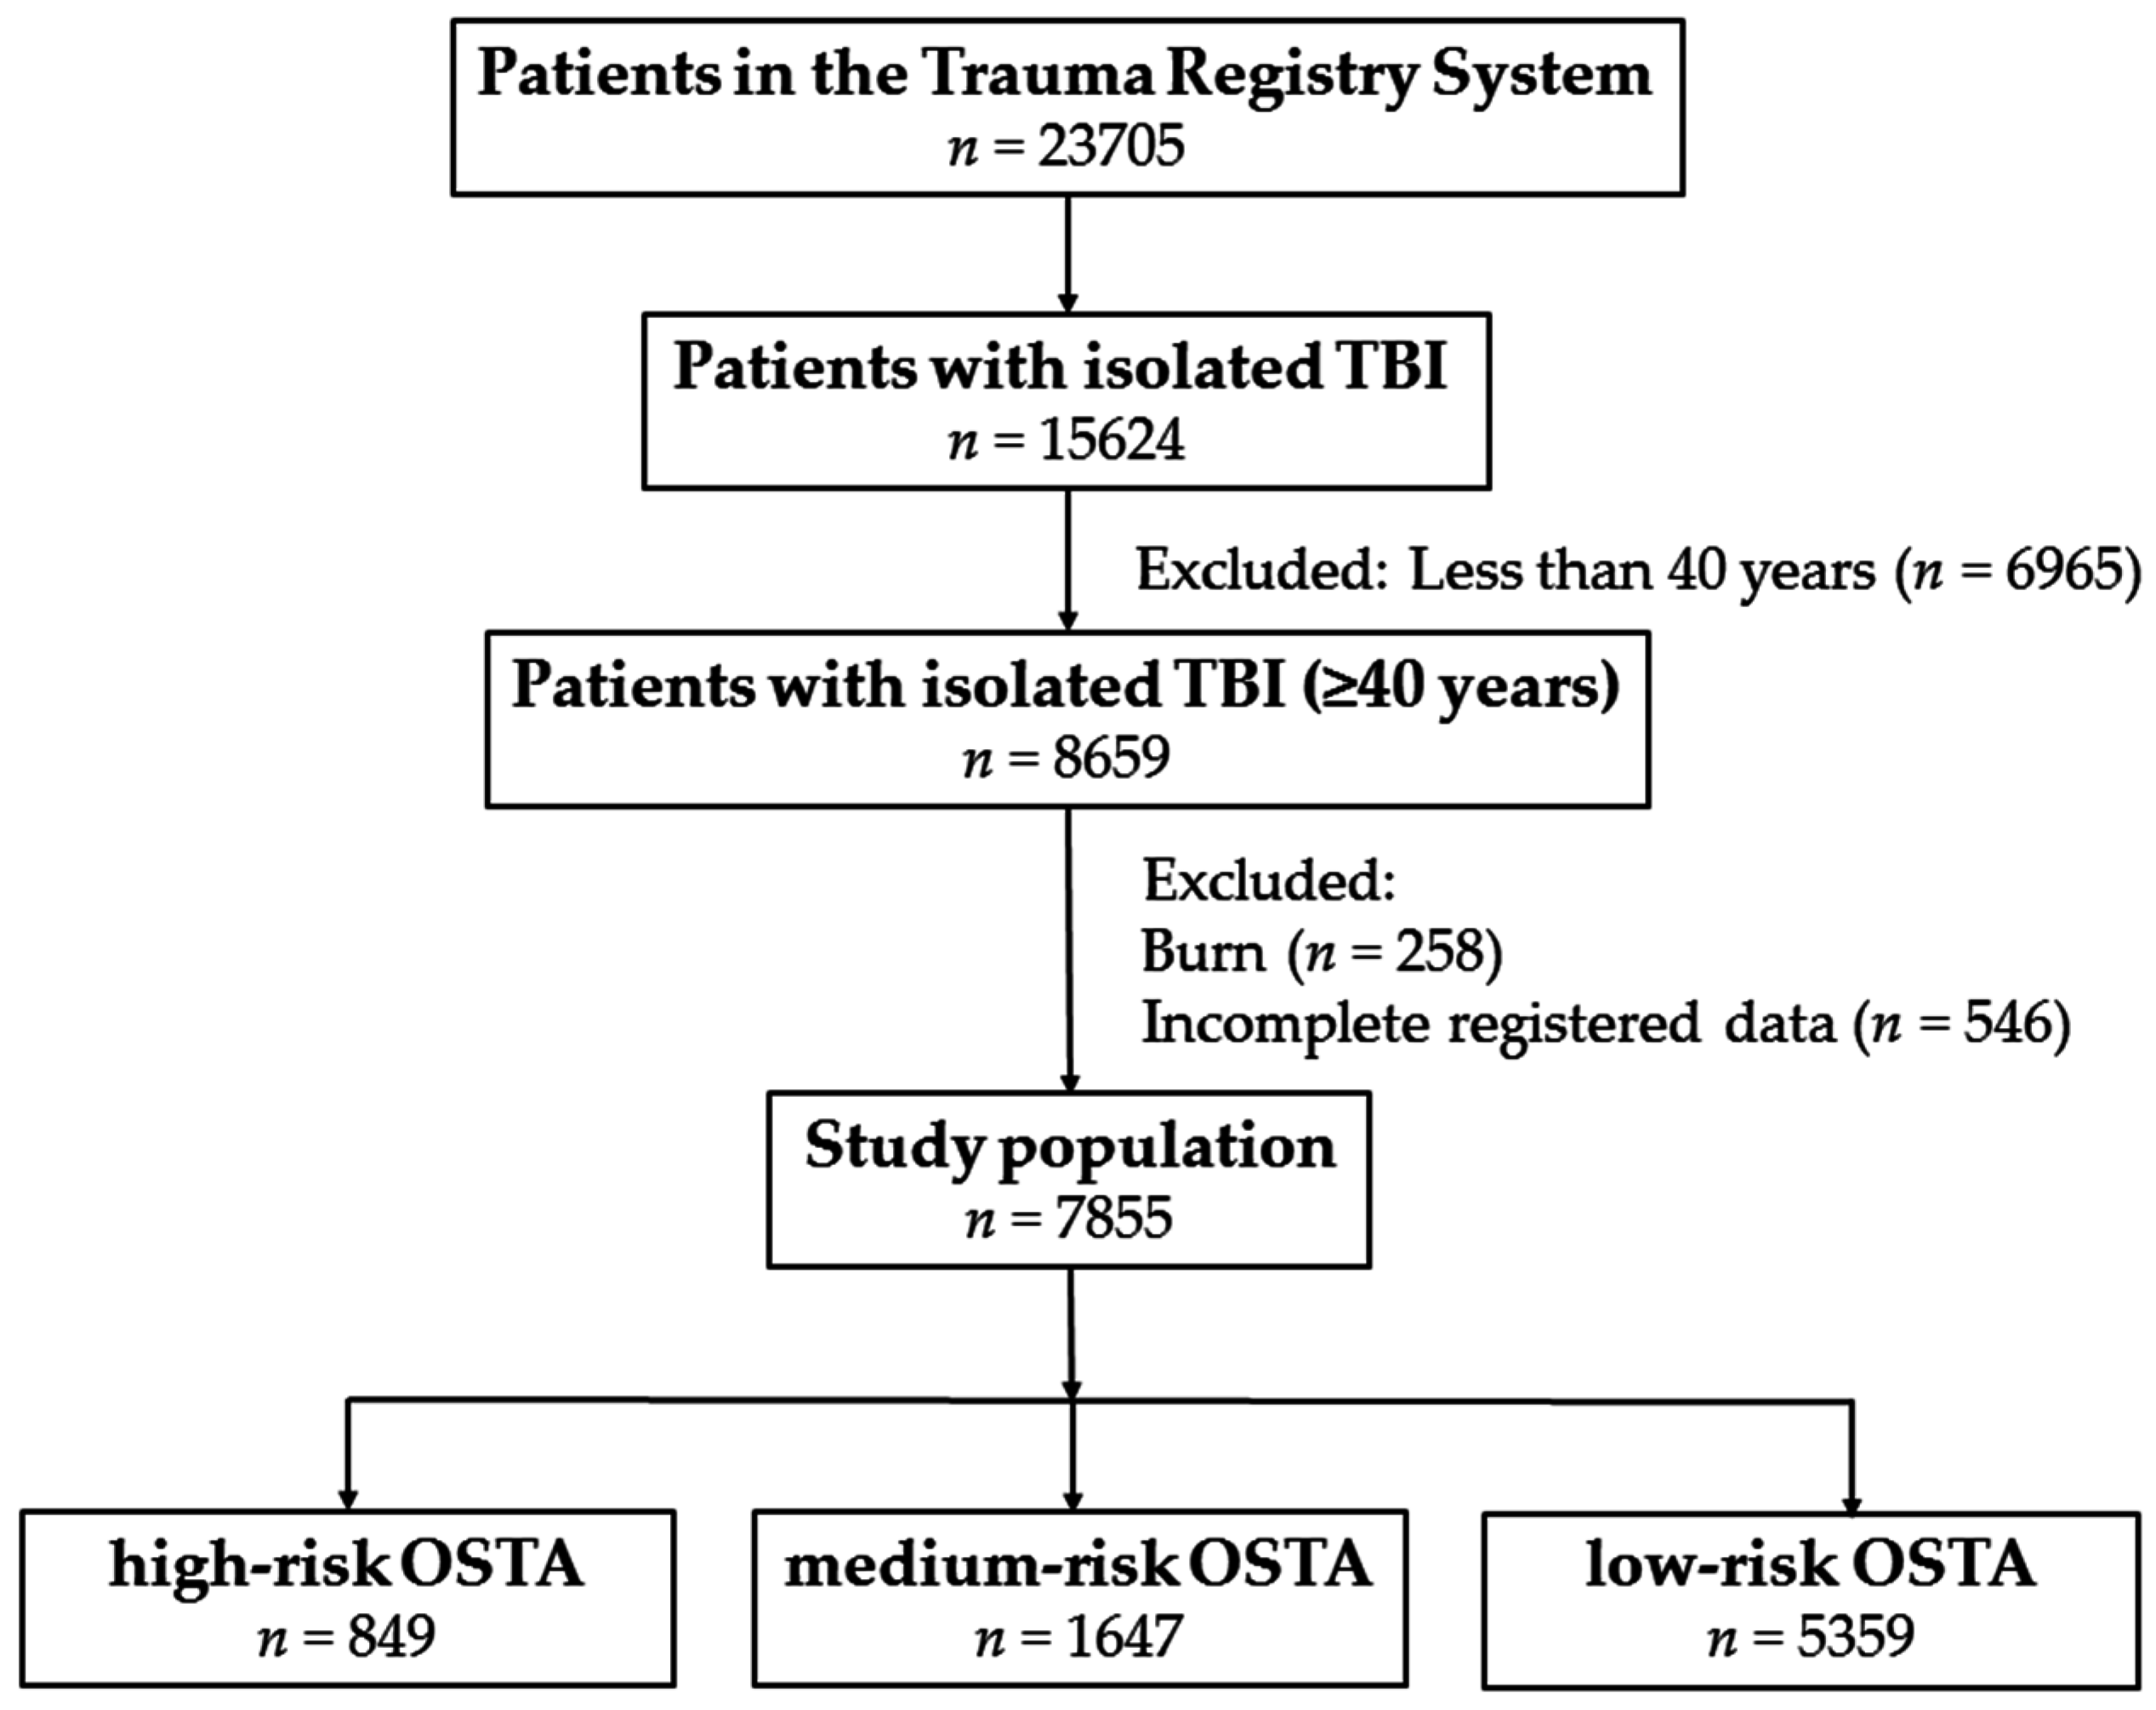
3. Results
3.1. Characteristics and Injury Severity of Patients
3.2. Patient Outcomes
3.3. Outcome of Propensity Score-Matched Analysis
4. Discussion
5. Conclusions
Acknowledgments
Author Contributions
Conflicts of Interest
References
- Cummings, S.R.; Melton, L.J. Epidemiology and outcomes of osteoporotic fractures. Lancet 2002, 359, 1761–1767. [Google Scholar] [CrossRef]
- Burge, R.; Dawson-Hughes, B.; Solomon, D.H.; Wong, J.B.; King, A.; Tosteson, A. Incidence and economic burden of osteoporosis-related fractures in the United States, 2005–2025. J. Bone Miner. Res. 2007, 22, 465–475. [Google Scholar] [CrossRef] [PubMed]
- Koh, L.K.; Sedrine, W.B.; Torralba, T.P.; Kung, A.; Fujiwara, S.; Chan, S.P.; Huang, Q.R.; Rajatanavin, R.; Tsai, K.S.; Park, H.M.; et al. A simple tool to identify Asian women at increased risk of osteoporosis. Osteoporos. Int. 2001, 12, 699–705. [Google Scholar] [CrossRef] [PubMed]
- Lin, J.; Yang, Y.; Fei, Q.; Zhang, X.; Ma, Z.; Wang, Q.; Li, J.; Li, D.; Meng, Q.; Wang, B. Validation of three tools for identifying painful new osteoporotic vertebral fractures in older Chinese men: Bone mineral density, Osteoporosis Self-Assessment Tool for Asians, and fracture risk assessment tool. Clin. Int. Aging 2016, 11, 461–469. [Google Scholar]
- Johnell, O. The socioeconomic burden of fractures: Today and in the 21st century. Am. J. Med. 1997, 103, 20S–25S. [Google Scholar] [CrossRef]
- Muslim, D.; Mohd, E.; Sallehudin, A.; Tengku Muzaffar, T.; Ezane, A. Performance of Osteoporosis Self-Assessment Tool for Asian (OSTA) for primary osteoporosis in post-menopausal Malay women. Malays. Orthop. J. 2012, 6, 35–39. [Google Scholar]
- Yang, Y.; Wang, B.; Fei, Q.; Meng, Q.; Li, D.; Tang, H.; Li, J.; Su, N. Validation of an osteoporosis self-assessment tool to identify primary osteoporosis and new osteoporotic vertebral fractures in postmenopausal Chinese women in Beijing. BMC Musculoskelet. Disord. 2013, 14, 271. [Google Scholar] [CrossRef] [PubMed]
- Machado, P.; Coutinho, M.; da Silva, J.A. Selecting men for bone densitometry: Performance of osteoporosis risk assessment tools in Portuguese men. Osteoporos. Int. 2010, 21, 977–983. [Google Scholar] [CrossRef] [PubMed]
- Chaovisitsaree, S.; Namwongprom, S.N.; Morakote, N.; Suntornlimsiri, N.; Piyamongkol, W. Comparison of Osteoporosis Self Assessment Tool for Asian (OSTA) and standard assessment in menopause clinic, Chiang Mai. J. Med. Assoc. Thail. 2007, 90, 420–425. [Google Scholar] [PubMed]
- Chan, S.P.; Teo, C.C.; Ng, S.A.; Goh, N.; Tan, C.; Deurenberg-Yap, M. Validation of various osteoporosis risk indices in elderly Chinese females in Singapore. Osteoporos. Int. 2006, 17, 1182–1188. [Google Scholar] [CrossRef] [PubMed]
- Lu, C.; Chen, D.; Cai, Y.; Wei, S. Concordane of OSTA and lumbar spine BMD by DXA in identifying risk of osteoporosis. J. Orthop. Surg. Res. 2006, 1, 14. [Google Scholar] [CrossRef] [PubMed]
- Oh, S.M.; Nam, B.H.; Rhee, Y.; Moon, S.H.; Kim, D.Y.; Kang, D.R.; Kim, H.C. Development and validation of osteoporosis risk-assessment model for Korean postmenopausal women. J. Bone Miner. Metab. 2013, 31, 423–432. [Google Scholar] [CrossRef] [PubMed]
- Li-Yu, J.T.; Llamado, L.J.; Torralba, T.P. Validation of OSTA among Filipinos. Osteoporos. Int. 2005, 16, 1789–1793. [Google Scholar] [CrossRef] [PubMed]
- Chang, S.F.; Yang, R.S. Determining the cut-off point of osteoporosis based on the osteoporosis self-assessment tool, body mass index and weight in Taiwanese young adult women. J. Clin. Nurs. 2014, 23, 2628–2635. [Google Scholar] [CrossRef] [PubMed]
- Bhat, K.A.; Kakaji, M.; Awasthi, A.; Kumar, K.; Mishra, K.; Shukla, M.; Gupta, S.K. Utility of osteoporosis self-assessment tool as a screening tool for predicting osteoporosis in Indian men. J. Clin. Densitom. 2016. [Google Scholar] [CrossRef] [PubMed]
- Oh, S.M.; Song, B.M.; Nam, B.H.; Rhee, Y.; Moon, S.H.; Kim, D.Y.; Kang, D.R.; Kim, H.C. Development and validation of osteoporosis risk-assessment model for Korean men. Yonsei Med. J. 2016, 57, 187–196. [Google Scholar] [CrossRef] [PubMed]
- Faul, M.X.L.; Wald, M.M.; Coronado, V.G. Traumatic Brain Injury in the United States: Emergency Department Visits, Hospitalizations, and Deaths; Centers for Disease Control and Prevention, National Center for Injury Prevention and Control: Atlanta, GA, USA, 2010. [Google Scholar]
- Harvey, L.A.; Close, J.C. Traumatic brain injury in older adults: Characteristics, causes and consequences. Injury 2012, 43, 1821–1826. [Google Scholar] [CrossRef] [PubMed]
- Chao, C.H.; Su, Y.F.; Chan, H.M.; Huang, S.L.; Lin, C.L.; Kwan, A.L.; Lou, Y.T.; Chen, C.W. Osteoporosis Self-Assessment Tool for Asians can predict neurologic prognosis in patients with isolated moderate traumatic brain injury. PLoS ONE 2015, 10. [Google Scholar] [CrossRef] [PubMed]
- Savitsky, B.; Givon, A.; Rozenfeld, M.; Radomislensky, I.; Peleg, K. Traumatic brain injury: It is all about definition. Brain Inj. 2016, 30, 1194–1200. [Google Scholar] [CrossRef] [PubMed]
- Butcher, N.; Balogh, Z.J. AIS > 2 in at least two body regions: A potential new anatomical definition of polytrauma. Injury 2012, 43, 196–199. [Google Scholar] [CrossRef] [PubMed]
- Weitzen, S.; Lapane, K.L.; Toledano, A.Y.; Hume, A.L.; Mor, V. Principles for modeling propensity scores in medical research: A systematic literature review. Pharmacoepidemiol. Drug Saf. 2004, 13, 841–853. [Google Scholar] [CrossRef] [PubMed]
- Sjolander, A. Propensity scores and M-structures. Stat. Med. 2009, 28, 1416–1420. [Google Scholar] [CrossRef] [PubMed]
- Singh, B.; Murad, M.H.; Prokop, L.J.; Erwin, P.J.; Wang, Z.; Mommer, S.K.; Mascarenhas, S.S.; Parsaik, A.K. Meta-analysis of Glasgow coma scale and simplified motor score in predicting traumatic brain injury outcomes. Brain Inj. 2013, 27, 293–300. [Google Scholar] [CrossRef] [PubMed]
- Strnad, M.; Borovnik Lesjak, V.; Vujanovic, V.; Krizmaric, M. Predictors of mortality in patients with isolated severe traumatic brain injury. Wien. Klin. Wochenschr. 2016. [Google Scholar] [CrossRef] [PubMed]
- Deng, Q.; Tang, B.; Xue, C.; Liu, Y.; Liu, X.; Lv, Y.; Zhang, L. Comparison of the ability to predict mortality between the injury severity score and the new injury severity score: A meta-analysis. Int. J. Environ. Res. Public Health 2016, 13, 825. [Google Scholar] [CrossRef] [PubMed]
- Tohme, S.; Delhumeau, C.; Zuercher, M.; Haller, G.; Walder, B. Prehospital risk factors of mortality and impaired consciousness after severe traumatic brain injury: An epidemiological study. Scand. J. Trauma Resusc. Emerg. Med. 2014, 22, 1. [Google Scholar] [CrossRef] [PubMed]
- Farace, E.; Alves, W.M. Do women fare worse: A metaanalysis of gender differences in traumatic brain injury outcome. J. Neurosurg. 2000, 93, 539–545. [Google Scholar] [CrossRef] [PubMed]
- Rau, C.S.; Liu, H.T.; Hsu, S.Y.; Cho, T.Y.; Hsieh, C.H. Alcohol-related hospitalisations of trauma patients in southern Taiwan: A cross-sectional study based on a trauma registry system. BMJ Open 2014, 4. [Google Scholar] [CrossRef] [PubMed]
- Munivenkatappa, A.; Agrawal, A.; Shukla, D.P.; Kumaraswamy, D.; Devi, B.I. Traumatic brain injury: Does gender influence outcomes? Int. J. Crit. Illn. Inj. Sci. 2016, 6, 70–73. [Google Scholar] [CrossRef] [PubMed]
- Hadjibashi, A.A.; Berry, C.; Ley, E.J.; Bukur, M.; Mirocha, J.; Stolpner, D.; Salim, A. Alcohol is associated with a lower pneumonia rate after traumatic brain injury. J. Surg. Res. 2012, 173, 212–215. [Google Scholar] [CrossRef] [PubMed]
- Berry, C.; Salim, A.; Alban, R.; Mirocha, J.; Margulies, D.R.; Ley, E.J. Serum ethanol levels in patients with moderate to severe traumatic brain injury influence outcomes: A surprising finding. Am. Surg. 2010, 76, 1067–1070. [Google Scholar] [PubMed]
- Salim, A.; Ley, E.J.; Cryer, H.G.; Margulies, D.R.; Ramicone, E.; Tillou, A. Positive serum ethanol level and mortality in moderate to severe traumatic brain injury. Arch. Surg. 2009, 144, 865–871. [Google Scholar] [CrossRef] [PubMed]
- Mosenthal, A.C.; Lavery, R.F.; Addis, M.; Kaul, S.; Ross, S.; Marburger, R.; Deitch, E.A.; Livingston, D.H. Isolated traumatic brain injury: Age is an independent predictor of mortality and early outcome. J. Trauma 2002, 52, 907–911. [Google Scholar] [CrossRef] [PubMed]
- Gan, B.K.; Lim, J.H.; Ng, I.H. Outcome of moderate and severe traumatic brain injury amongst the elderly in Singapore. Ann. Acad. Med. Singap. 2004, 33, 63–67. [Google Scholar] [PubMed]
- Gomez, P.A.; Lobato, R.D.; Boto, G.R.; De la Lama, A.; Gonzalez, P.J.; de la Cruz, J. Age and outcome after severe head injury. Acta Neurochir. 2000, 142, 371–380. [Google Scholar] [CrossRef]
- Dhandapani, S.; Manju, D.; Sharma, B.; Mahapatra, A. Prognostic significance of age in traumatic brain injury. J. Neurosci. Rural Pract. 2012, 3, 131–135. [Google Scholar] [CrossRef] [PubMed]
- Signorini, D.F.; Andrews, P.J.; Jones, P.A.; Wardlaw, J.M.; Miller, J.D. Predicting survival using simple clinical variables: A case study in traumatic brain injury. J. Neurol. Neurosurg. Psychiatry 1999, 66, 20–25. [Google Scholar] [CrossRef] [PubMed]
- The Brain Trauma Foundation. The American Association of Neurological Surgeons. The Joint Section on Neurotrauma and Critical Care. Indications for intracranial pressure monitoring. J. Neurotrauma 2000, 17, 573–581. [Google Scholar]
- Nott, M.T.; Gates, T.M.; Baguley, I.J. Age-related trends in late mortality following traumatic brain injury: A multicentre inception cohort study. Aust. J. Ageing 2015, 34, E1–E6. [Google Scholar] [CrossRef] [PubMed]


| Variables | High Risk OSTA < −4 n = 849 (I) | Medium Risk −4 ≤ OSTA ≤ −1 n = 1647 (II) | Low Risk OSTA > −1 n = 5359 (III) | Odds Ratio (95% CI) I vs. III | p | Odds Ratio (95% CI) II vs. III | p |
|---|---|---|---|---|---|---|---|
| Age | 79.7 ± 6.9 | 68.1 ± 8.0 | 54.1 ± 8.8 | - | <0.001 | - | <0.001 |
| Gender | <0.001 | <0.001 | |||||
| Female | 550 (64.8) | 1015 (61.6) | 2071 (38.6) | 2.9 (2.51–3.40) | 2.6 (2.28–2.86) | ||
| Male | 299 (35.2) | 632 (38.4) | 3288 (61.4) | 0.3 (0.29–0.40) | 0.4 (0.35–0.44) | ||
| Co-Morbidity | |||||||
| Diabetes mellitus (DM) | 155 (18.3) | 397 (24.1) | 800 (14.9) | 1.3 (1.05–1.54) | 0.013 | 1.8 (1.58–2.07) | <0.001 |
| Hypertension (HTN) | 440 (51.8) | 720 (43.7) | 1490 (27.8) | 2.8 (2.41–3.24) | <0.001 | 2.0 (1.80–2.26) | <0.001 |
| Coronary artery disease (CAD) | 70 (8.2) | 96 (5.8) | 146 (2.7) | 3.2 (2.39–4.31) | <0.001 | 2.2 (1.70–2.88) | <0.001 |
| Congestive heart failure (CHF) | 22 (2.6) | 18 (1.1) | 36 (0.7) | 3.9 (2.30–6.72) | <0.001 | 1.6 (0.93–2.89) | 0.087 |
| Cerebral vascular accident (CVA) | 87 (10.2) | 128 (7.8) | 112 (2.1) | 5.3 (4.00–7.15) | <0.001 | 3.9 (3.04–5.12) | <0.001 |
| End-stage renal disease (ESRD) | 4 (0.5) | 4 (0.2) | 3 (0.1) | 8.5 (1.89–37.83) | 0.009 | 4.3 (0.97–19.44) | 0.058 |
| Blood alcohol concentration (BAC) (mg/dL) | 0.9 ± 13.0 | 2.9 ± 23.5 | 14.5 ± 55.7 | - | <0.001 | - | <0.001 |
| BAC ≥ 50 mg/dL, n (%) | 5 (0.6) | 27 (1.6) | 375 (7.0) | 0.1 (0.03–0.19) | <0.001 | 0.2 (0.15–0.33) | <0.001 |
| Glasgow coma scale (GCS) | 13.7 ± 2.8 | 14.1 ± 2.5 | 14.4 ± 2.1 | - | <0.001 | - | <0.001 |
| ≤8 | 70 (8.2) | 93 (5.6) | 230 (4.3) | 2.0 (1.52–2.65) | <0.001 | 1.3 (1.04–1.71) | 0.022 |
| 9–12 | 63 (7.4) | 85 (5.2) | 156 (2.9) | 2.7 (1.98–3.62) | <0.001 | 1.8 (1.39–2.38) | <0.001 |
| ≥13 | 716 (84.3) | 1469 (89.2) | 4973 (92.8) | 0.4 (0.34–0.52) | <0.001 | 0.6 (0.53–0.77) | <0.001 |
| Injury severity score (ISS), median (interquartile range (IQR)) | 8 (4–16) | 4 (4–12) | 4 (4–8) | - | <0.001 | - | <0.001 |
| <16 | 553 (65.1) | 1287 (78.1) | 4682 (87.4) | 0.3 (0.23–0.32) | <0.001 | 0.5 (0.45–0.60) | <0.001 |
| 16–24 | 238 (28.0) | 288 (17.5) | 555 (10.4) | 3.4 (2.83–4.01) | <0.001 | 1.8 (1.57–2.14) | <0.001 |
| ≥25 | 58 (6.8) | 72 (4.4) | 122 (2.3) | 3.1 (2.28–4.34) | <0.001 | 2.0 (1.46–2.64) | <0.001 |
| Mortality, n (%) | 61 (7.2) | 71 (4.3) | 77 (1.4) | 5.3 (3.76–7.49) | <0.001 | 3.1 (2.23–4.29) | <0.001 |
| Length of stay (LOS) in hospital (days) | 9.8 ± 11.2 | 9.0 ± 10.5 | 8.2 ± 9.0 | - | <0.001 | - | 0.010 |
| Intensive care unit (ICU) admission, n (%) | 325 (38.3) | 393 (23.9) | 796 (14.9) | 3.6 (3.04–4.16) | <0.001 | 1.8 (1.57–2.06) | <0.001 |
| Head trauma, n (%) | |||||||
| Epidural hematoma (EDH) | 45 (5.3) | 53 (3.2) | 219 (4.1) | 1.3 (0.95–1.83) | 0.103 | 0.8 (0.58–1.06) | 0.110 |
| Subdural hematoma (SDH) | 259 (30.5) | 309 (18.8) | 570 (10.6) | 3.7 (3.11–4.37) | <0.001 | 1.9 (1.67–2.26) | <0.001 |
| Subarachnoid hemorrhage (SAH) | 137 (16.1) | 231 (14.0) | 588 (11.0) | 1.6 (1.28–1.91) | <0.001 | 1.3 (1.12–1.56) | 0.001 |
| Intracerebral hematoma (ICH) | 59 (6.9) | 57 (3.5) | 130 (2.4) | 3.0 (2.19–4.12) | <0.001 | 1.4 (1.05–1.98) | 0.023 |
| Cerebral contusion | 116 (13.7) | 144 (8.7) | 296 (5.5) | 2.7 (2.16–3.40) | <0.001 | 1.6 (1.33–2.02) | <0.001 |
| Mortality Rate | High Risk OSTA < −4 n = 849 (I) | Medium Risk −4 ≤ OSTA ≤ −1 n = 1647 (II) | Low Risk OSTA > −1 n = 5359 (III) | Odds Ratio (95% CI) I vs. III | p | Odds Ratio (95% CI) II vs. III | p |
|---|---|---|---|---|---|---|---|
| Head trauma, n (%) | |||||||
| Epidural hematoma (EDH) | 10/45 (22.2) | 12/53 (22.6) | 22/219 (10.0) | 2.6 (1.12–5.86) | 0.023 | 2.6 (1.20–5.72) | 0.013 |
| Subdural hematoma (SDH) | 39/259 (15.1) | 50/309 (16.2) | 52/570 (9.1) | 1.8 (1.13–2.75) | 0.011 | 1.9 (1.27–2.92) | 0.002 |
| Subarachnoid hemorrhage (SAH) | 13/137 (9.5) | 31/231 (13.4) | 31/588 (5.3) | 1.9 (0.96–3.70) | 0.063 | 2.8 (1.65–4.70) | <0.001 |
| Intracerebral hematoma (ICH) | 10/59 (16.9) | 11/57 (19.3) | 11/130 (8.5) | 2.2 (0.88–5.53) | 0.085 | 2.6 (1.05–6.38) | 0.034 |
| Cerebral contusion | 22/116 (19.0) | 12/144 (8.3) | 14/296 (4.7) | 4.7 (2.32–9.59) | <0.001 | 1.8 (0.82–4.07) | 0.133 |
| Variables | Before Matching | After Matching | ||||||
|---|---|---|---|---|---|---|---|---|
| High Risk OSTA < −4 n = 849 | Low Risk OSTA > −1 n = 5359 | Odds Ratio (95% CI) | p | High Risk OSTA < −4 n = 756 | Low Risk OSTA > −1 n = 756 | Odds Ratio (95% CI) | p | |
| Gender | ||||||||
| Female | 550 (64.8) | 2071 (38.6) | 2.9 (2.51–3.40) | <0.001 | 474 (62.7) | 474 (62.7) | 1.0 (0.81–1.23) | 1.000 |
| Male | 299 (35.2) | 3288 (61.4) | 0.3 (0.29–0.40) | 282 (37.3) | 282 (37.3) | 1.0 (0.81–1.23) | ||
| Co-Morbidity | ||||||||
| DM | 155 (18.3) | 800 (14.9) | 1.3 (1.05–1.54) | 0.013 | 131 (17.3) | 131 (17.3) | 1.0 (0.77–1.31) | 1.000 |
| HTN | 440 (51.8) | 1490 (27.8) | 2.8 (2.41–3.24) | <0.001 | 372 (49.2) | 372 (49.2) | 1.0 (0.82–1.22) | 1.000 |
| CAD | 70 (8.2) | 146 (2.7) | 3.2 (2.39–4.31) | <0.001 | 41 (5.4) | 41 (5.4) | 1.0 (0.64–1.56) | 1.000 |
| CHF | 22 (2.6) | 36 (0.7) | 3.9 (2.30–6.72) | <0.001 | 8 (1.1) | 8 (1.1) | 1.0 (0.37–2.68) | 1.000 |
| CVA | 87 (10.2) | 112 (2.1) | 5.3 (4.00–7.15) | <0.001 | 49 (6.5) | 49 (6.5) | 1.0 (0.66–1.51) | 1.000 |
| ESRD | 4 (0.5) | 3 (0.1) | 8.5 (1.89–37.83) | 0.009 | 0 (0.0) | 0 (0.0) | - | - |
| BAC (mg/dL) | 0.9 ± 13.0 | 14.5 ± 55.7 | - | <0.001 | 0.8 ± 11.9 | 0.7 ± 10.7 | - | 0.881 |
| GCS | 13.7 ± 2.8 | 14.4 ± 2.1 | - | <0.001 | 14.0 ± 2.5 | 14.0 ± 2.5 | - | 0.560 |
| ISS, median (IQR) | 8 (4–16) | 4 (4–8) | - | <0.001 | 6 (4–16) | 6 (4–16) | - | 0.889 |
| Mortality, n (%) | 61 (7.2) | 77 (1.4) | 5.3 (3.76–7.49) | <0.001 | 44 (5.8) | 19 (2.5) | 2.4 (1.39–4.15) | 0.001 |
| LOS in hospital (days) | 9.8 ± 11.2 | 8.2 ± 9.0 | - | <0.001 | 9.4 ± 10.7 | 10.2 ± 10.5 | - | 0.131 |
| ICU admission, n (%) | 325 (38.3) | 796 (14.9) | 3.6 (3.04–4.16) | <0.001 | 264 (34.9) | 256 (33.9) | 1.0 (0.85–1.30) | 0.665 |
| Variables | Before Matching | After Matching | ||||||
|---|---|---|---|---|---|---|---|---|
| Medium Risk −4 ≤ OSTA ≤ −1 n = 1647 | Low Risk OSTA > −1 n = 5359 | Odds Ratio (95% CI) | p | Medium Risk −4 ≤ OSTA ≤ −1 n = 1570 | Low Risk OSTA > −1 n = 1570 | Odds Ratio (95% CI) | p | |
| Gender | ||||||||
| Female | 1015 (61.6) | 2071 (38.6) | 2.6 (2.28–2.86) | <0.001 | 974 (62.0) | 974 (62.0) | 1.0 (0.87–1.16) | 1.000 |
| Male | 632 (38.4) | 3288 (61.4) | 0.4 (0.35–0.44) | 596 (38.0) | 596 (38.0) | 1.0 (0.87–1.16) | ||
| Co-Morbidity | ||||||||
| DM | 397 (24.1) | 800 (14.9) | 1.8 (1.58–2.07) | <0.001 | 364 (23.2) | 364 (23.2) | 1.0 (0.85–1.18) | 1.000 |
| HTN | 720 (43.7) | 1490 (27.8) | 2.0 (1.80–2.26) | <0.001 | 68 (42.5) | 68 (42.5) | 1.0 (0.87–1.15) | 1.000 |
| CAD | 96 (5.8) | 146 (2.7) | 2.2 (1.70–2.88) | <0.001 | 64 (4.1) | 64 (4.1) | 1.0 (0.70–1.42) | 1.000 |
| CHF | 18 (1.1) | 36 (0.7) | 1.6 (0.93–2.89) | 0.087 | 6 (0.4) | 6 (0.4) | 1.0 (0.32–3.11) | 1.000 |
| CVA | 128 (7.8) | 112 (2.1) | 3.9 (3.04–5.12) | <0.001 | 83 (5.3) | 83 (5.3) | 1.0 (0.73–1.37) | 1.000 |
| ESRD | 4 (0.2) | 3 (0.1) | 4.3 (0.97–19.44) | 0.058 | 0 (0.0) | 0 (0.0) | - | - |
| BAC (mg/dL) | 2.9 ± 23.5 | 14.5 ± 55.7 | - | <0.001 | 2.9 ± 23.5 | 2.9 ± 23.8 | - | 0.956 |
| GCS | 14.1 ± 2.5 | 14.4 ± 2.1 | - | <0.001 | 14.2 ± 2.4 | 14.3 ± 2.2 | - | 0.336 |
| ISS, median (IQR) | 4 (4–12) | 4 (4–8) | - | <0.001 | 4 (4–10) | 4 (4–10) | - | 0.754 |
| Mortality, n (%) | 71 (4.3) | 77 (1.4) | 3.1 (2.23–4.29) | <0.001 | 58 (3.7) | 32 (2.0) | 1.8 (1.19–2.86) | 0.005 |
| LOS in hospital (days) | 9.0 ± 10.5 | 8.2 ± 9.0 | - | 0.010 | 8.9 ± 10.1 | 9.2 ± 10.0 | - | 0.429 |
| ICU admission, n (%) | 393 (23.9) | 796 (14.9) | 1.8 (1.57–2.06) | <0.001 | 360 (22.9) | 348 (22.2) | 1.0 (0.88–1.24) | 0.608 |
| LOS in ICU (days) | 8.8 ± 12.5 | 7.2 ± 8.9 | - | 0.027 | 8.5 ± 12.2 | 7.3 ± 8.1 | - | 0.123 |
| Mortality Rate | Before Matching | After Matching | ||||||
|---|---|---|---|---|---|---|---|---|
| High Risk OSTA < −4 n = 849 | Low Risk OSTA > −1 n = 5359 | Odds Ratio (95% CI) | p | High Risk OSTA < −4 n = 756 | Low Risk OSTA > −1 n = 756 | Odds Ratio (95% CI) | p | |
| Head trauma, n (%) | ||||||||
| Epidural hematoma (EDH) | 10/45 (22.2) | 22/219 (10.0) | 2.6 (1.12–5.86) | 0.023 | 4/31 (12.9) | 6/53 (11.3) | 1.2 (0.30–4.48) | 1.000 |
| Subdural hematoma (SDH) | 39/259 (15.1) | 52/570 (9.1) | 1.8 (1.13–2.75) | 0.011 | 4/28 (14.3) | 6/56 (10.7) | 1.4 (0.36–5.39) | 0.725 |
| Subarachnoid hemorrhage (SAH) | 13/137 (9.5) | 31/588 (5.3) | 1.9 (0.96–3.70) | 0.063 | 4/25 (16.0) | 7/59 (11.9) | 1.4 (0.38–5.34) | 0.725 |
| Intracerebral hematoma (ICH) | 10/59 (16.9) | 11/130 (8.5) | 2.2 (0.88–5.53) | 0.085 | 7/49 (14.3) | 4/35 (11.4) | 1.3 (0.35–4.80) | 0.756 |
| Cerebral contusion | 22/116 (19.0) | 14/296 (4.7) | 4.7 (2.32–9.59) | <0.001 | 3/10 (30.0) | 3/15 (20.0) | 1.7 (0.27–11.92) | 0.653 |
| Mortality Rate | Before Matching | After Matching | ||||||
|---|---|---|---|---|---|---|---|---|
| Medium Risk −4 ≤ OSTA ≤ −1 n = 1647 | Low Risk OSTA > −1 n = 5359 | Odds Ratio (95% CI) | p | Medium Risk −4 ≤ OSTA ≤ −1 n = 1570 | Low Risk OSTA > −1 n = 1570 | Odds Ratio (95% CI) | p | |
| Head trauma, n (%) | ||||||||
| Epidural hematoma (EDH) | 12/53 (22.6) | 22/219 (10.0) | 2.6 (1.20–5.72) | 0.013 | 12/50 (24.0) | 10/79 (12.7) | 2.2 (0.86–5.51) | 0.095 |
| Subdural hematoma (SDH) | 50/309 (16.2) | 52/570 (9.1) | 1.9 (1.27–2.92) | 0.002 | 41/280 (14.6) | 24/249 (9.6) | 1.6 (0.94–2.75) | 0.080 |
| Subarachnoid hemorrhage (SAH) | 31/231 (13.4) | 31/588 (5.3) | 2.8 (1.65–4.70) | <0.001 | 27/216 (12.5) | 14/223 (6.3) | 2.1 (1.00–4.19) | 0.052 |
| Intracerebral hematoma (ICH) | 11/57 (19.3) | 11/130 (8.5) | 2.6 (1.05–6.38) | 0.034 | 10/53 (18.9) | 6/60 (10.0) | 2.1 (0.71–6.22) | 0.177 |
| Cerebral contusion | 12/144 (8.3) | 14/296 (4.7) | 1.8 (0.82–4.07) | 0.133 | 10/138 (7.2) | 9/143 (6.3) | 1.2 (0.46–2.96) | 0.751 |
| Variables | Before Matching | After Matching | ||||||
|---|---|---|---|---|---|---|---|---|
| High Risk OSTA < −4 n = 849 | Low Risk OSTA > −1 n = 5359 | Odds Ratio (95% CI) | p | High Risk OSTA < −4 n = 203 | Low Risk OSTA > −1 n = 203 | Odds Ratio (95% CI) | p | |
| Age | 79.7 ± 6.9 | 54.1 ± 8.8 | - | <0.001 | 72.5 ± 5.6 | 72.2 ± 5.5 | - | 0.663 |
| Gender | <0.001 | 1.000 | ||||||
| Female | 550 (64.8) | 2071 (38.6) | 2.9 (2.51–3.40) | 120 (59.1) | 120 (59.1) | 1.0 (0.67–1.49) | ||
| Male | 299 (35.2) | 3288 (61.4) | 0.3 (0.29–0.40) | 83 (40.9) | 83 (40.9) | 1.0 (0.67–1.49) | ||
| Co-Morbidity | ||||||||
| DM | 155 (18.3) | 800 (14.9) | 1.3 (1.05–1.54) | 0.013 | 46 (22.7) | 46 (22.7) | 1.0 (0.63–1.59) | 1.000 |
| HTN | 440 (51.8) | 1490 (27.8) | 2.8 (2.41–3.24) | <0.001 | 93 (45.8) | 93 (45.8) | 1.0 (0.68–1.48) | 1.000 |
| CAD | 70 (8.2) | 146 (2.7) | 3.2 (2.39–4.31) | <0.001 | 14 (6.9) | 14 (6.9) | 1.0 (0.46–2.16) | 1.000 |
| CHF | 22 (2.6) | 36 (0.7) | 3.9 (2.30–6.72) | <0.001 | 1 (0.5) | 1 (0.5) | 1.0 (0.06–16.10) | 1.000 |
| CVA | 87 (10.2) | 112 (2.1) | 5.3 (4.00–7.15) | <0.001 | 6 (3.0) | 6 (3.0) | 1.0 (0.32–3.15) | 1.000 |
| ESRD | 4 (0.5) | 3 (0.1) | 8.5 (1.89–37.83) | 0.009 | 0 (0.0) | 0 (0.0) | - | - |
| BAC (mg/dL) | 0.9 ± 13.0 | 14.5 ± 55.7 | - | <0.001 | 1.5 ± 15.0 | 0.0 ± 0.0 | - | 0.147 |
| GCS | 13.7 ± 2.8 | 14.4 ± 2.1 | - | <0.001 | 14.2 ± 2.1 | 14.1 ± 2.7 | - | 0.625 |
| ISS, median (IQR) | 8 (4–16) | 4 (4–8) | - | <0.001 | 5 (4–16) | 5 (4–16) | - | 0.660 |
| Mortality, n (%) | 61 (7.2) | 77 (1.4) | 5.3 (3.76–7.49) | <0.001 | 6 (3.0) | 9 (4.4) | 0.7 (0.23–1.88) | 0.430 |
| LOS in hospital (days) | 9.8 ± 11.2 | 8.2 ± 9.0 | - | <0.001 | 9.7 ± 9.8 | 10.3 ± 12.5 | - | 0.631 |
| ICU admission, n (%) | 325 (38.3) | 796 (14.9) | 3.6 (3.04–4.16) | <0.001 | 68 (33.5) | 55 (27.1) | 1.4 (0.89–2.07) | 0.160 |
| Variables | Before Matching | After Matching | ||||||
|---|---|---|---|---|---|---|---|---|
| Medium Risk −4 ≤ OSTA ≤ −1 n = 1647 | Low Risk OSTA > −1 n = 5359 | Odds Ratio (95% CI) | p | Medium Risk −4 ≤ OSTA ≤ −1 n = 1055 | Low Risk OSTA > −1 n = 1055 | Odds Ratio (95% CI) | p | |
| Age | 68.1 ± 8.0 | 54.1 ± 8.8 | - | <0.001 | 64.5 ± 6.8 | 64.4 ± 6.7 | - | 0.747 |
| Gender | <0.001 | 1.000 | ||||||
| Female | 1015 (61.6) | 2071 (38.6) | 2.6 (2.28–2.86) | 665 (63.0) | 665 (63.0) | 1.0 (0.84–1.19) | ||
| Male | 632 (38.4) | 3288 (61.4) | 0.4 (0.35–0.44) | 390 (37.0) | 390 (37.0) | 1.0 (0.84–1.19) | ||
| Co-Morbidity | ||||||||
| DM | 397 (24.1) | 800 (14.9) | 1.8 (1.58–2.07) | <0.001 | 216 (20.5) | 216 (20.5) | 1.0 (0.81–1.24) | 1.000 |
| HTN | 720 (43.7) | 1490 (27.8) | 2.0 (1.80–2.26) | <0.001 | 398 (37.7) | 398 (37.7) | 1.0 (0.84–1.19) | 1.000 |
| CAD | 96 (5.8) | 146 (2.7) | 2.2 (1.70–2.88) | <0.001 | 37 (3.5) | 37 (3.5) | 1.0 (0.63–1.59) | 1.000 |
| CHF | 18 (1.1) | 36 (0.7) | 1.6 (0.93–2.89) | 0.087 | 1 (0.1) | 1 (0.1) | 1.0 (0.06–16.01) | 1.000 |
| CVA | 128 (7.8) | 112 (2.1) | 3.9 (3.04–5.12) | <0.001 | 31 (2.9) | 31 (2.9) | 1.0 (0.60–1.66) | 1.000 |
| ESRD | 4 (0.2) | 3 (0.1) | 4.3 (0.97–19.44) | 0.058 | 0 (0.0) | 0 (0.0) | - | - |
| BAC (mg/dL) | 2.9 ± 23.5 | 14.5 ± 55.7 | - | <0.001 | 3.7 ± 27.0 | 3.0 ± 25.0 | - | 0.506 |
| GCS | 14.1 ± 2.5 | 14.4 ± 2.1 | - | <0.001 | 14.4 ± 2.1 | 14.4 ± 2.1 | - | 0.581 |
| ISS, median (IQR) | 4 (4–12) | 4 (4–8) | - | <0.001 | 4 (4–9) | 4 (4–9) | - | 0.431 |
| Mortality, n (%) | 71 (4.3) | 77 (1.4) | 3.1 (2.23–4.29) | <0.001 | 29 (2.7) | 20 (1.9) | 1.5 (0.82–2.60) | 0.193 |
| LOS in hospital (days) | 9.0 ± 10.5 | 8.2 ± 9.0 | - | 0.010 | 8.3 ± 8.9 | 8.5 ± 9.0 | - | 0.583 |
| ICU admission, n (%) | 393 (23.9) | 796 (14.9) | 1.8 (1.57–2.06) | <0.001 | 208 (19.7) | 182 (17.3) | 1.2 (0.95–1.47) | 0.145 |
© 2016 by the authors; licensee MDPI, Basel, Switzerland. This article is an open access article distributed under the terms and conditions of the Creative Commons Attribution (CC-BY) license (http://creativecommons.org/licenses/by/4.0/).
Share and Cite
Rau, C.-S.; Kuo, P.-J.; Wu, S.-C.; Chen, Y.-C.; Hsieh, H.-Y.; Hsieh, C.-H. Association between the Osteoporosis Self-Assessment Tool for Asians Score and Mortality in Patients with Isolated Moderate and Severe Traumatic Brain Injury: A Propensity Score-Matched Analysis. Int. J. Environ. Res. Public Health 2016, 13, 1203. https://doi.org/10.3390/ijerph13121203
Rau C-S, Kuo P-J, Wu S-C, Chen Y-C, Hsieh H-Y, Hsieh C-H. Association between the Osteoporosis Self-Assessment Tool for Asians Score and Mortality in Patients with Isolated Moderate and Severe Traumatic Brain Injury: A Propensity Score-Matched Analysis. International Journal of Environmental Research and Public Health. 2016; 13(12):1203. https://doi.org/10.3390/ijerph13121203
Chicago/Turabian StyleRau, Cheng-Shyuan, Pao-Jen Kuo, Shao-Chun Wu, Yi-Chun Chen, Hsiao-Yun Hsieh, and Ching-Hua Hsieh. 2016. "Association between the Osteoporosis Self-Assessment Tool for Asians Score and Mortality in Patients with Isolated Moderate and Severe Traumatic Brain Injury: A Propensity Score-Matched Analysis" International Journal of Environmental Research and Public Health 13, no. 12: 1203. https://doi.org/10.3390/ijerph13121203