
Spatial Patterns of Heat-Related Cardiovascular Mortality in the Czech Republic

Abstract
:1. Introduction
2. Data and Methods
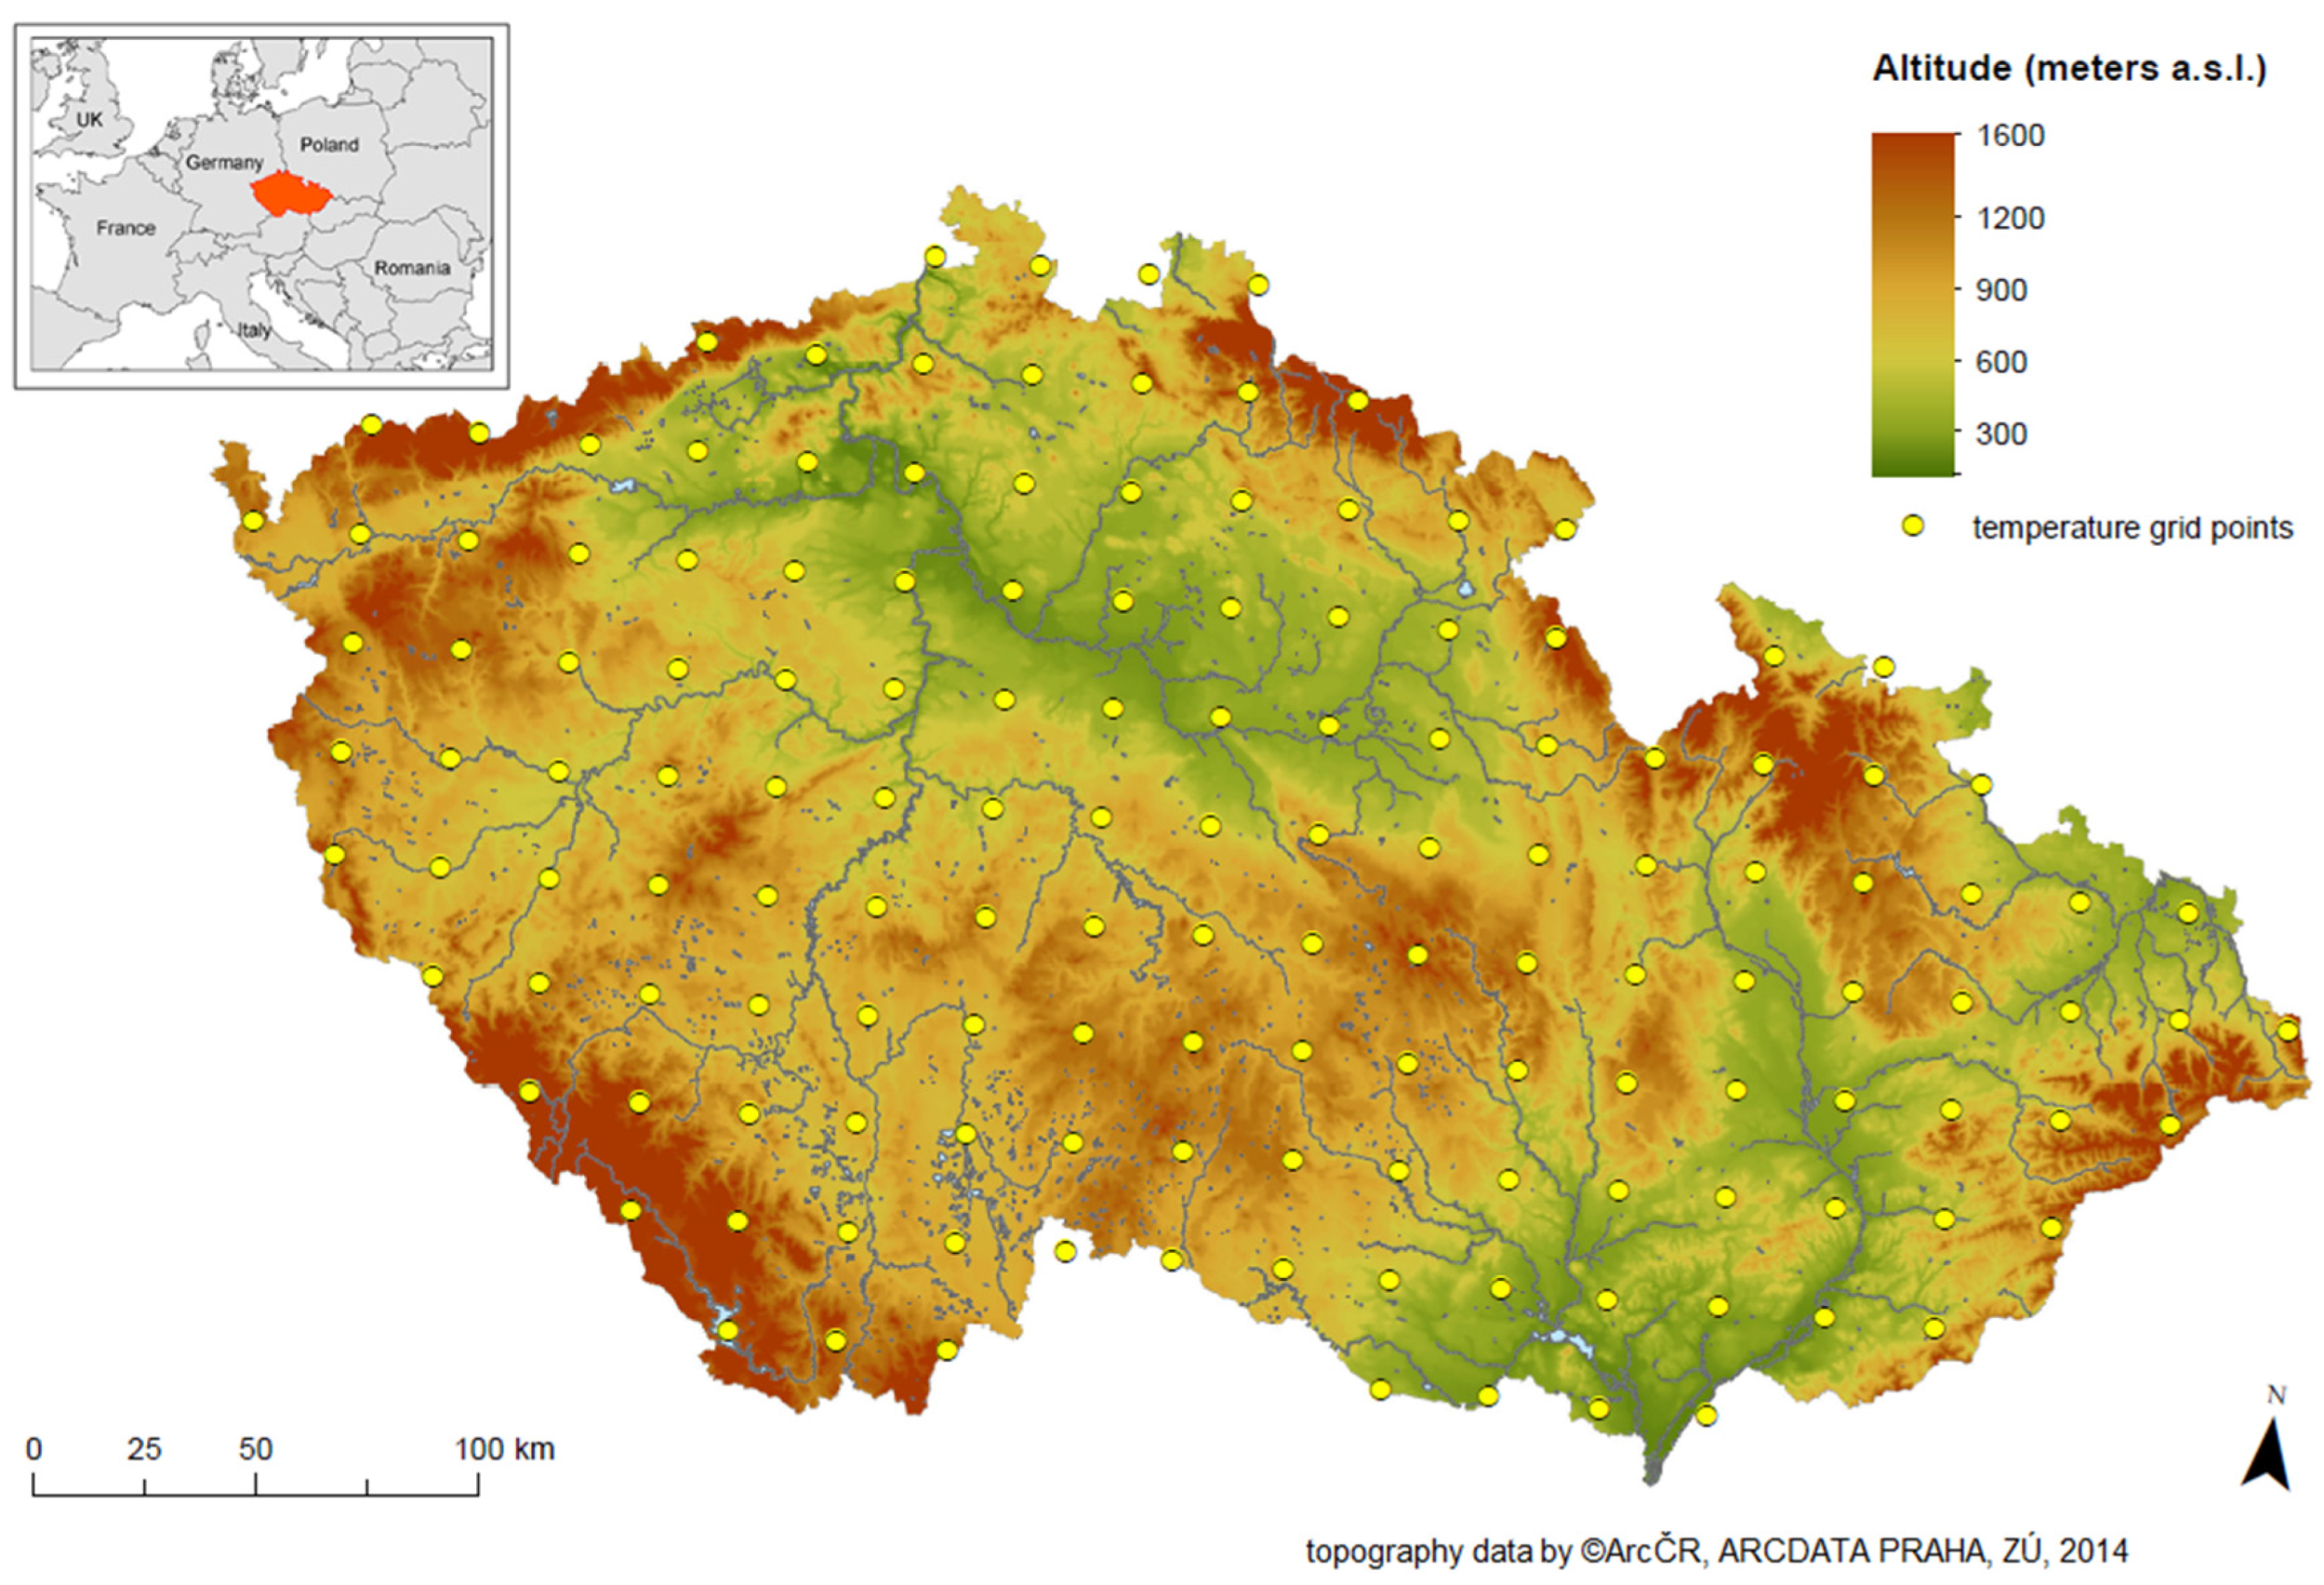
2.1. Study Area
2.2. Meteorological Data
2.3. Mortality Data
2.4. Analysis of Spatial Patterns of Heat-Related Mortality
2.5. Analysis of Temporal Patterns of Heat-Related Mortality in Groups of Districts
3. Results
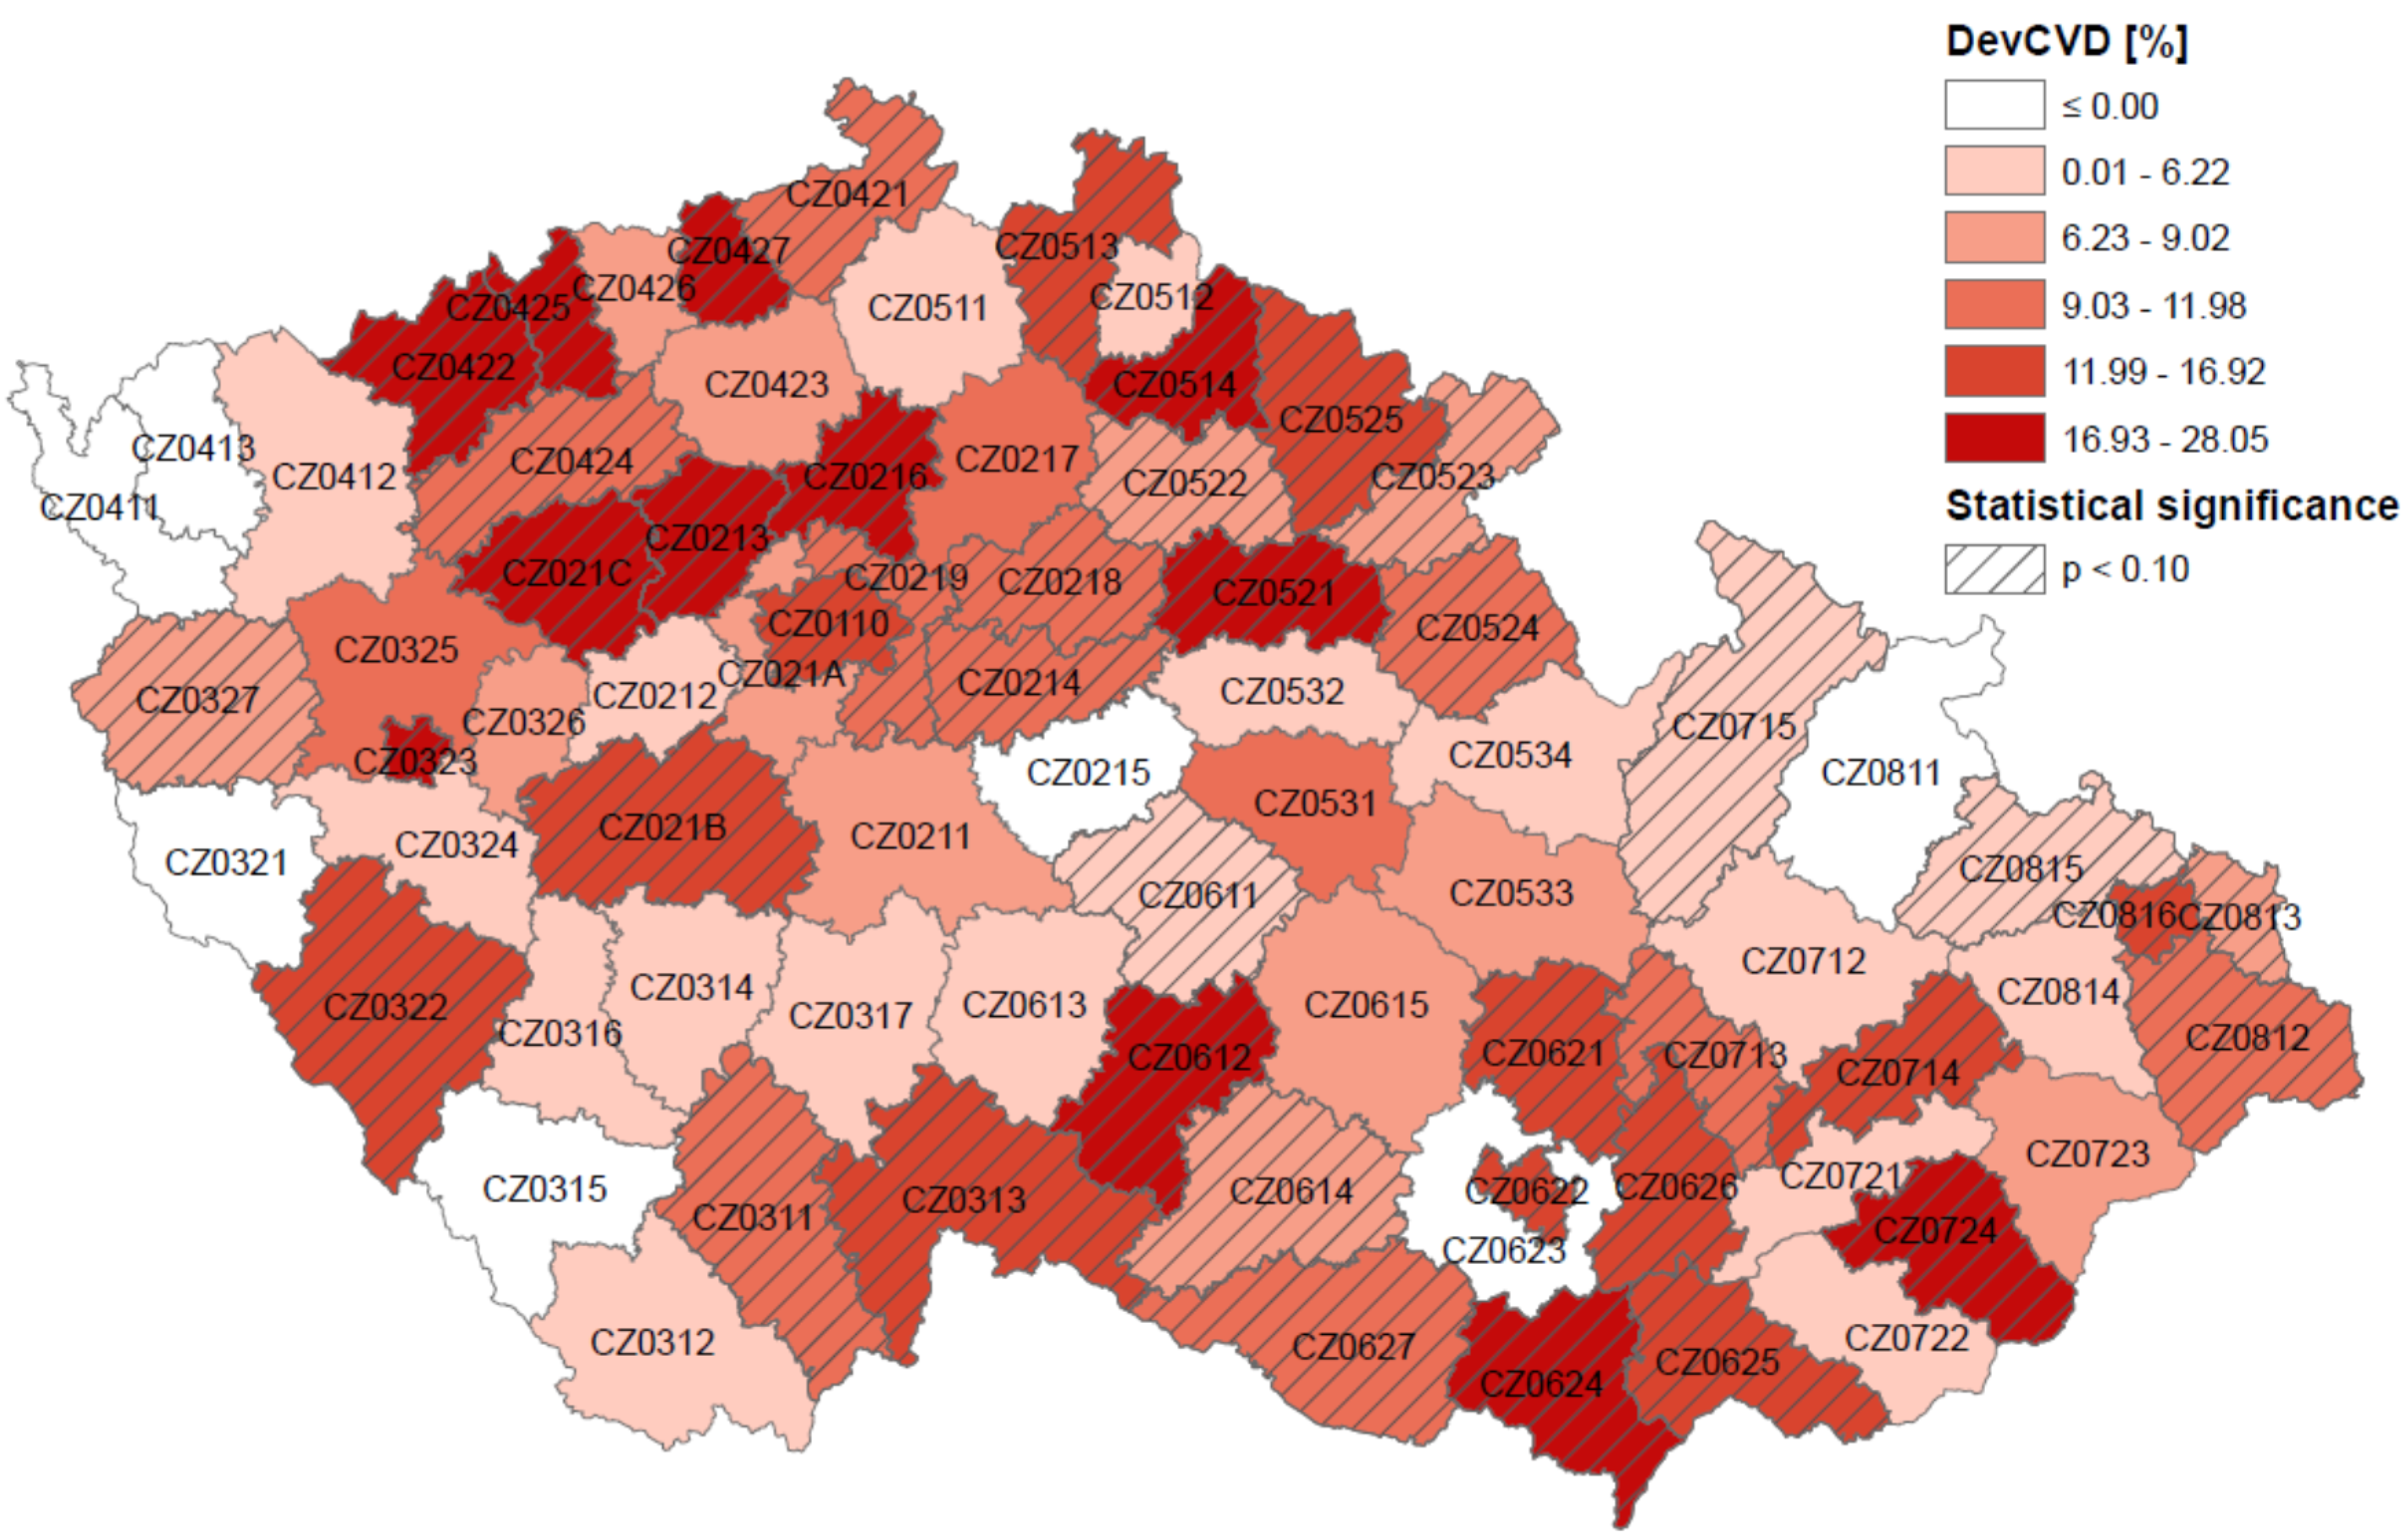
3.1. Heat-Related Mortality in the Czech Republic at District Level
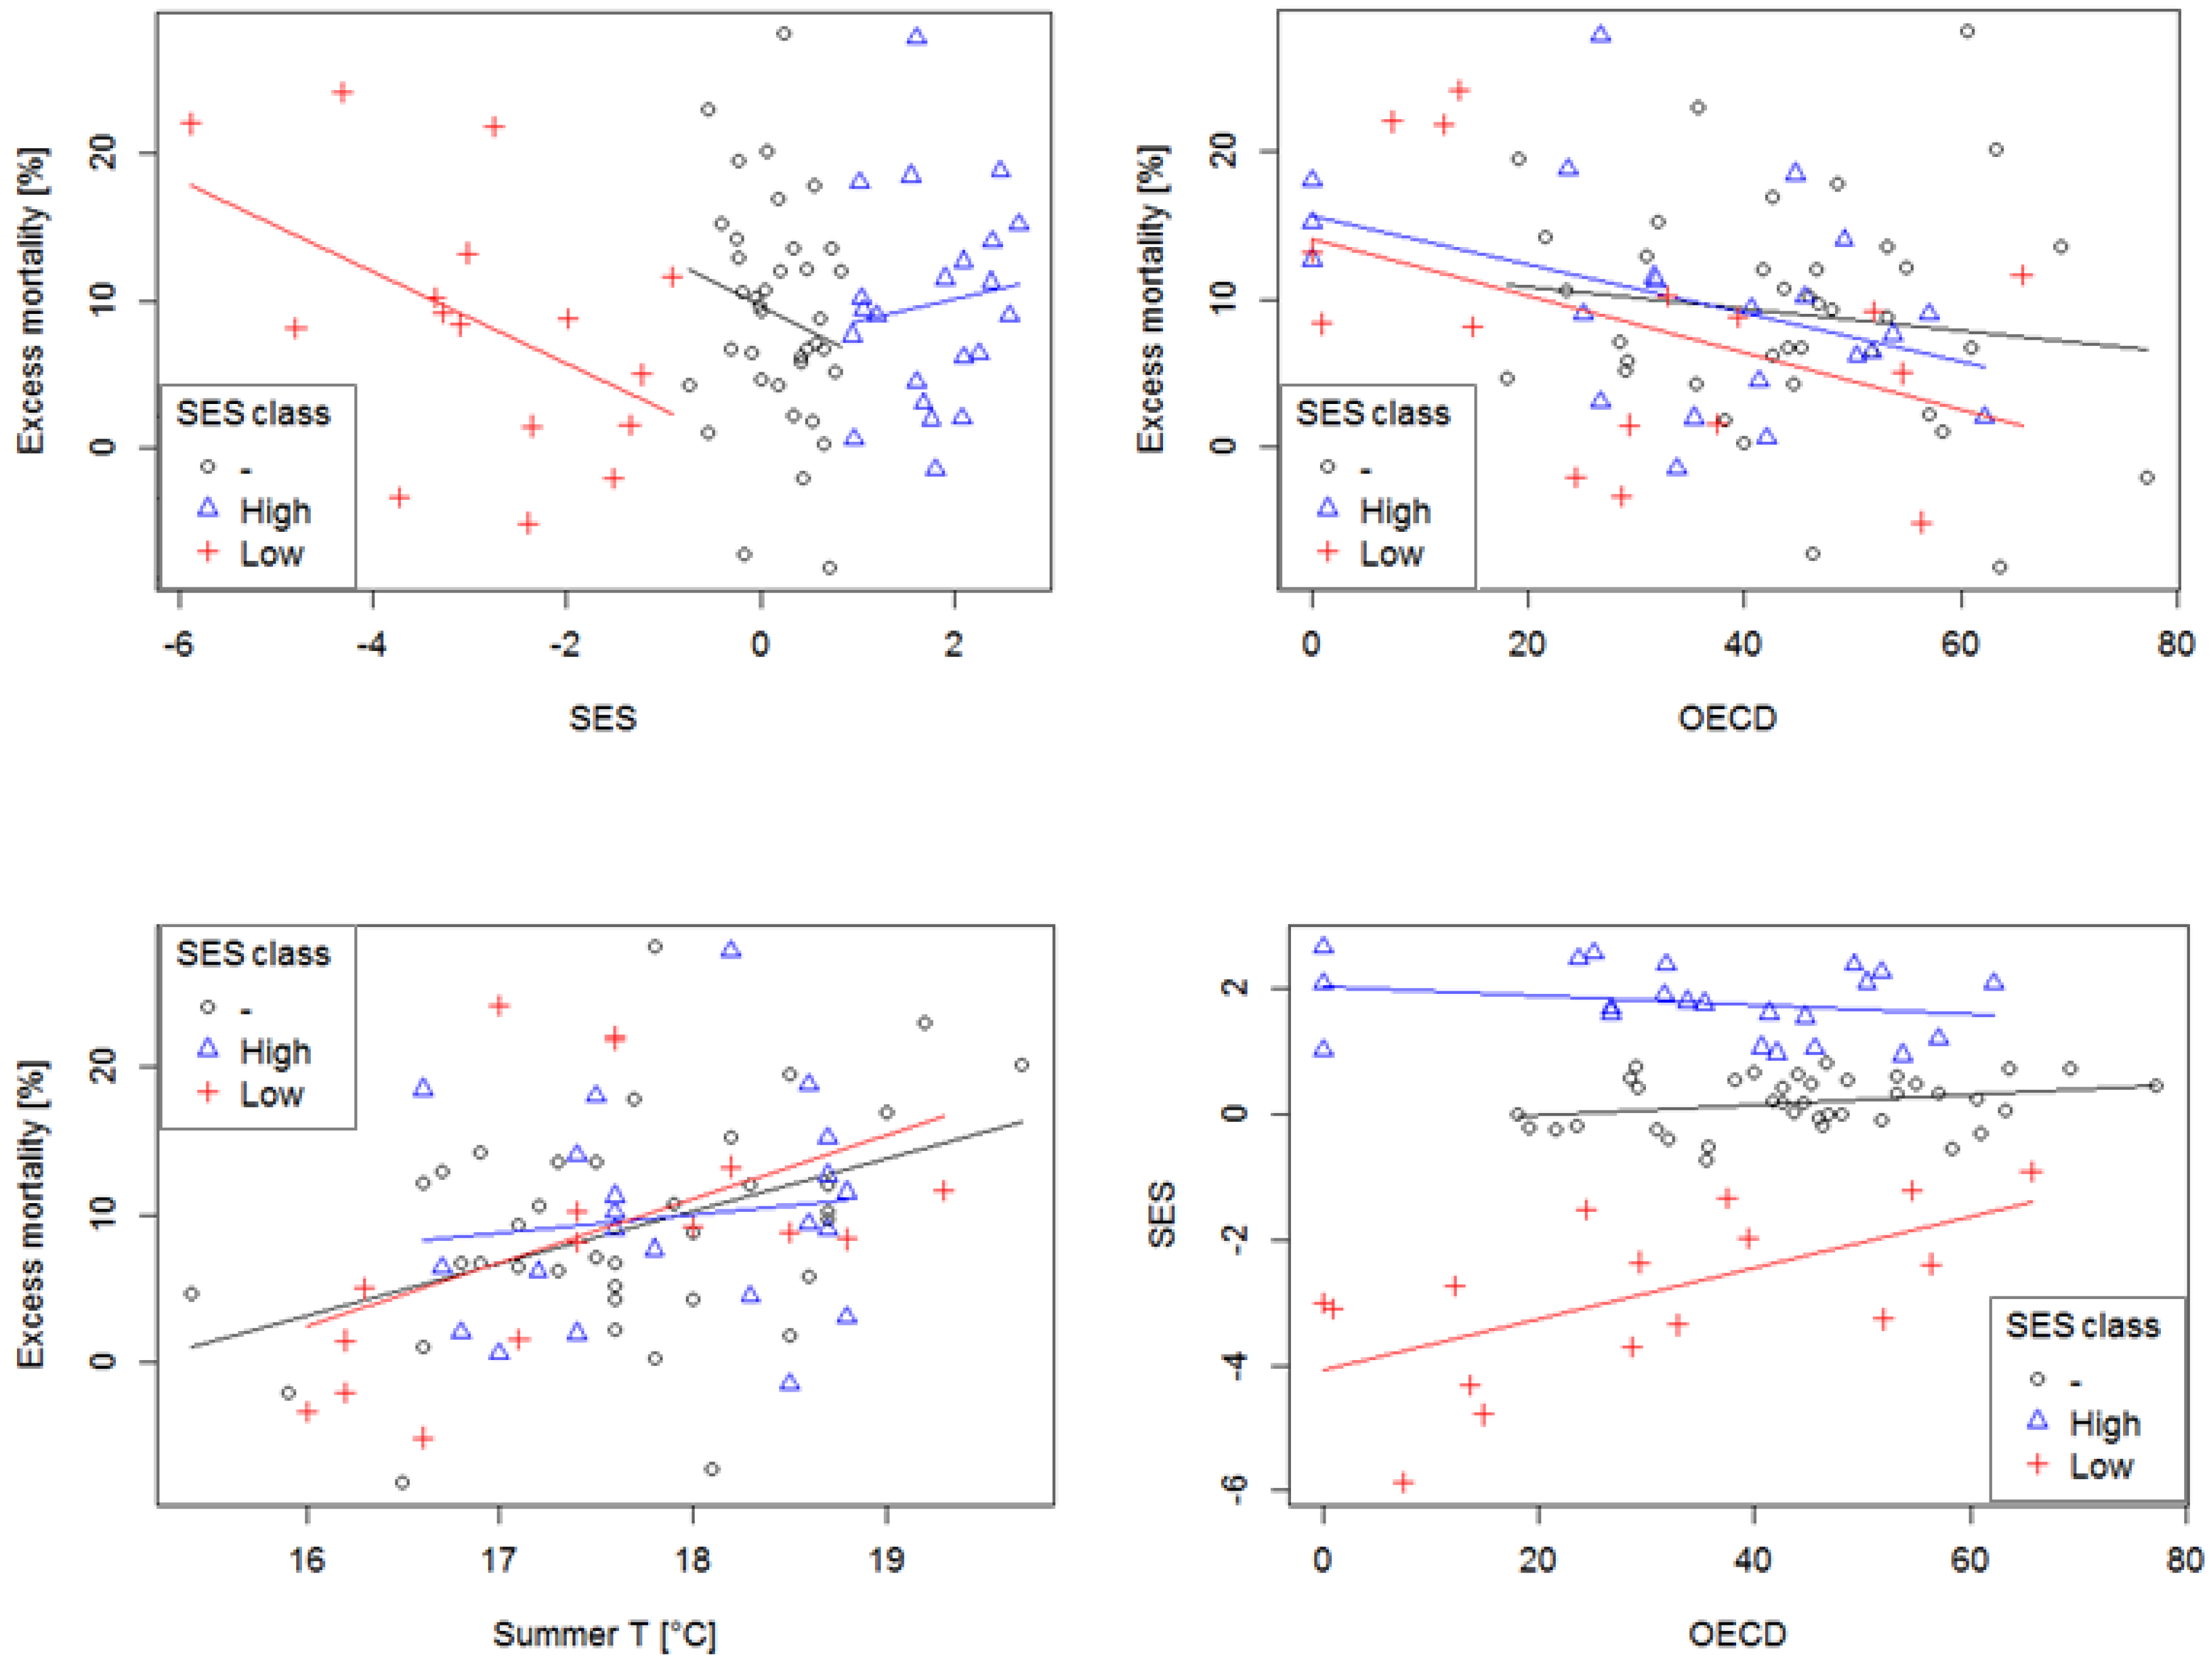
3.2. Explaining Spatial Patterns of Heat-Related Mortality
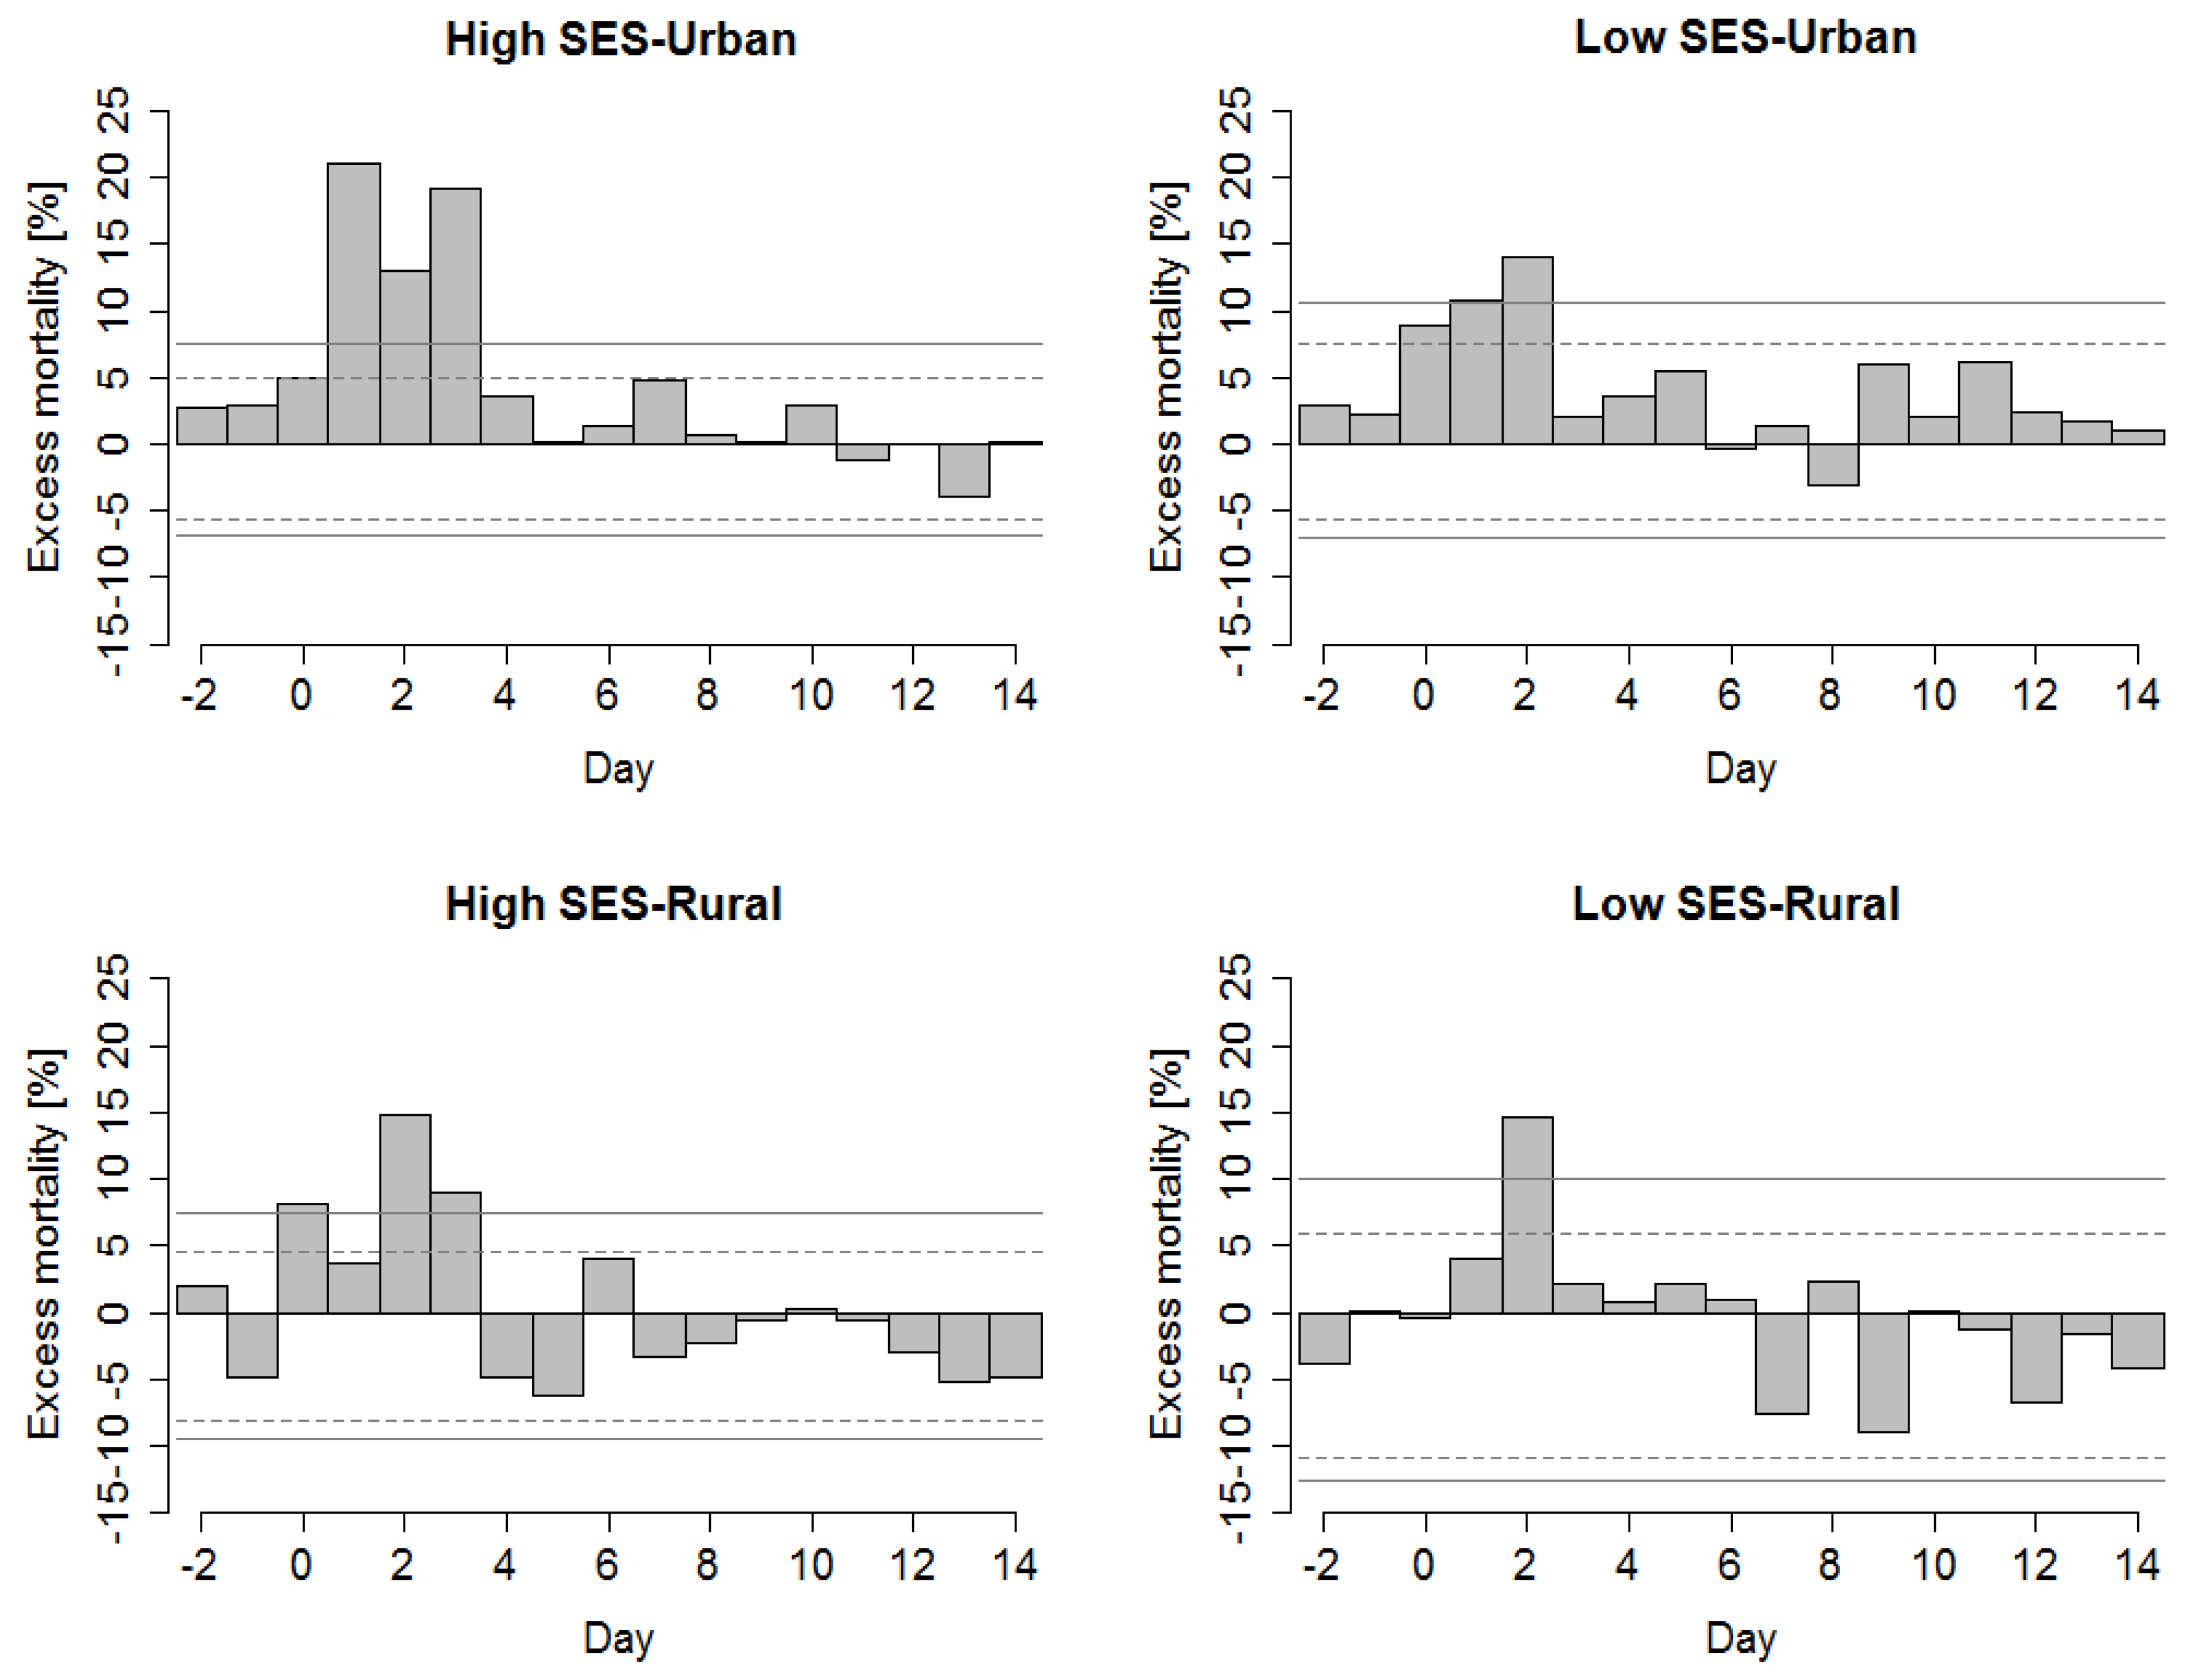
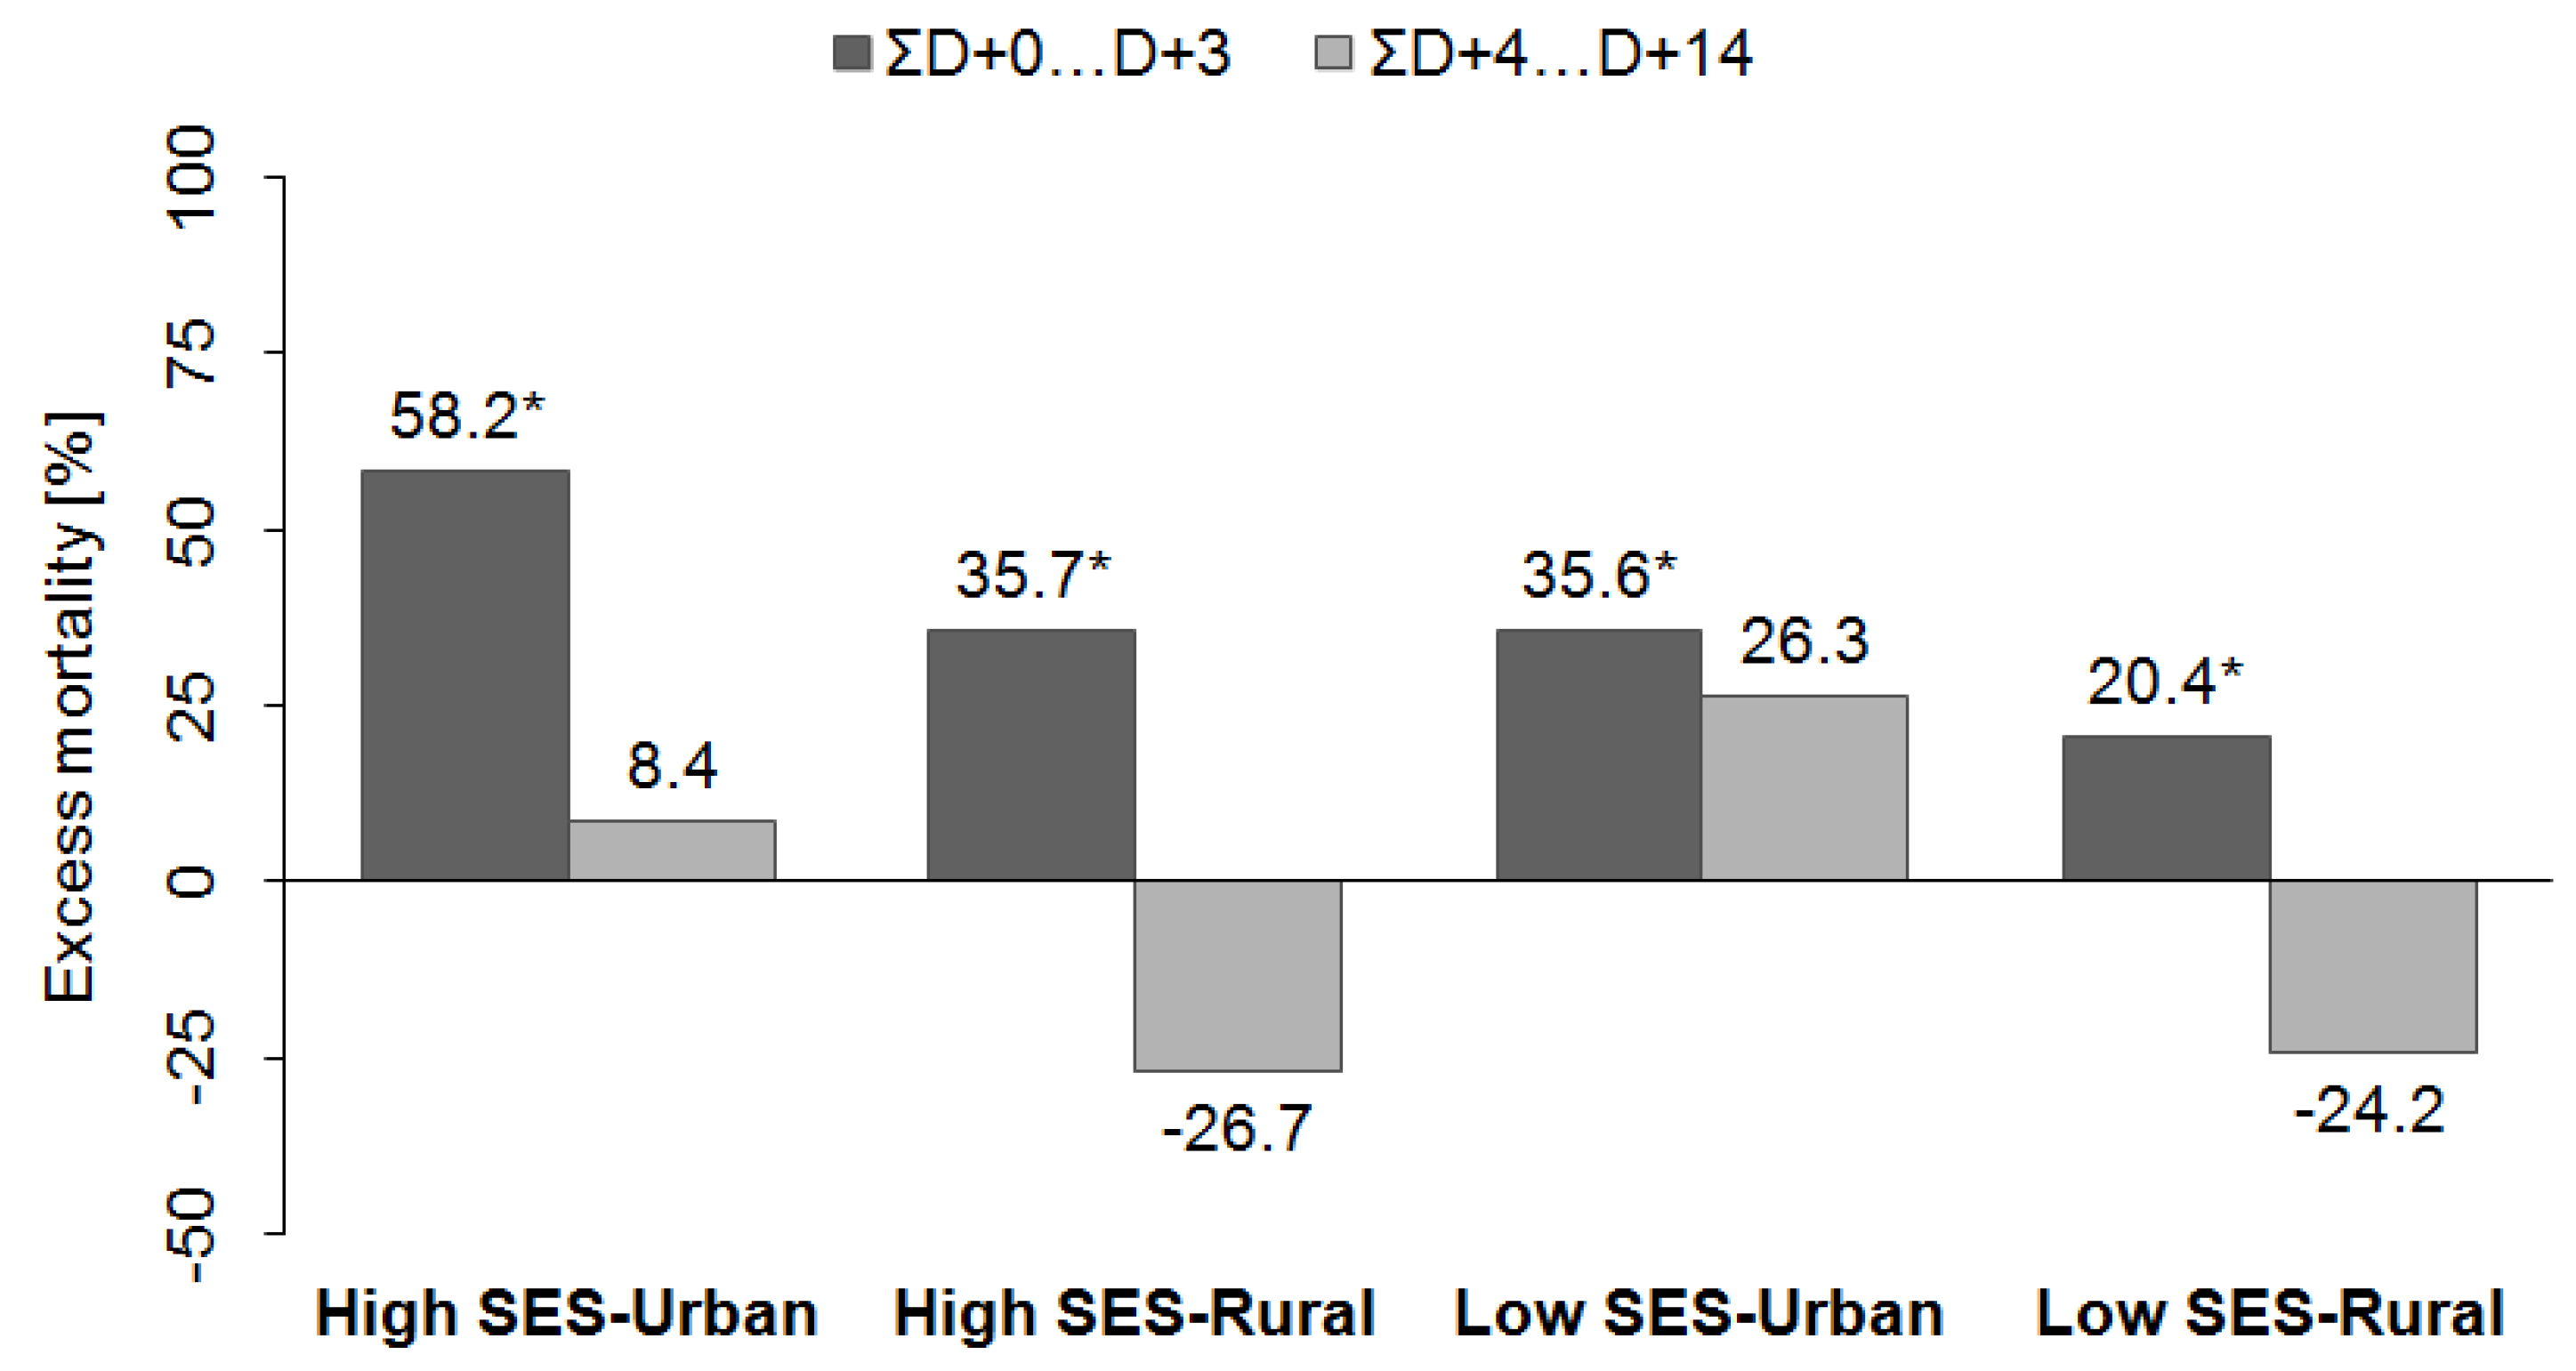
3.3. Explaining Lagged Patterns of Heat-Related Mortality in Groups of Districts
4. Discussion
4.1. Spatial Patterns of Heat-Related Mortality
4.2. Lagged Patterns of Heat-Related Mortality
4.3. Limitations of the Study
5. Conclusions
Acknowledgments
Author Contributions
Conflicts of Interest
References
- Basu, R. High ambient temperature and mortality: A review of epidemiologic studies from 2001 to 2008. Environ. Health 2009. [Google Scholar] [CrossRef] [PubMed]
- Gosling, S.N.; Lowe, J.A.; McGregor, G.R.; Pelling, M.; Malamud, B.D. Associations between elevated atmospheric temperature and human mortality: A critical review of the literature. Clim. Chang. 2009, 92, 299–341. [Google Scholar] [CrossRef]
- Hajat, S.; Kosatky, T. Heat-related mortality: A review and exploration of heterogeneity. J. Epidemiol. Community Health 2010, 64, 753–760. [Google Scholar] [CrossRef] [PubMed]
- Burkart, K.; Khan, M.M.H.; Schneider, A.; Breitner, S.; Langner, M.; Krämer, A.; Endlicher, W. The effects of season and meteorology on human mortality in tropical climates: A systematic review. Trans. R. Soc. Trop. Med. Hyg. 2014, 108, 393–401. [Google Scholar] [CrossRef] [PubMed]
- Gosling, S.N.; McGregor, G.R.; Lowe, J.A. Climate change and heat-related mortality in six cities Part 2: Climate model evaluation and projected impacts from changes in the mean and variability of temperature with climate change. Int. J. Biometeorol. 2009, 53, 31–51. [Google Scholar] [CrossRef] [PubMed]
- Ballester, J.; Rodó, X.; Giorgi, F. Future changes in Central Europe heat waves expected to mostly follow summer mean warming. Clim. Dyn. 2009, 35, 1191–1205. [Google Scholar] [CrossRef]
- IPCC. Summary for Policymakers. In Climate Change 2014: Impacts, Adaptation, and Vulnerability. Part A: Global and Sectoral Aspects. Contribution of Working Group II to the Fifth Assessment Report of the Intergovernmental Panel on Climate Change; Field, C.B., Barros, V.R., Dokken, D.J., Mach, K.J., Mastrandrea, M.D., Bilir, T.E., Chatterjee, M., Ebi, K.L., Estrada, Y.O., Genova, R.C., et al., Eds.; Cambridge University Press: Cambridge, UK; New York, NY, USA, 2014; pp. 1–32. [Google Scholar]
- Huang, C.; Barnett, A.G.; Wang, X.; Vaneckova, P.; Fitzgerald, G.; Tong, S. Projecting future heat-related mortality under climate change scenarios: A systematic review. Environ. Health Perspect. 2011, 119, 1681–1690. [Google Scholar] [CrossRef] [PubMed] [Green Version]
- Matzarakis, A.; Muthers, S.; Koch, E. Human biometeorological evaluation of heat-related mortality in Vienna. Theor. Appl. Climatol. 2010, 105, 1–10. [Google Scholar] [CrossRef]
- Kyselý, J.; Plavcová, E. Declining impacts of hot spells on mortality in the Czech Republic, 1986–2009: Adaptation to climate change? Clim. Chang. 2011, 113, 437–453. [Google Scholar] [CrossRef]
- Bobb, J.F.; Peng, R.D.; Bell, M.L.; Dominici, F. Heat-related mortality and adaptation to heat in the United States. Environ. Health Perspect. 2014, 122, 811–816. [Google Scholar] [CrossRef] [PubMed]
- Toloo, G.S.; Fitzgerald, G.; Aitken, P.; Verrall, K.; Tong, S. Are heat warning systems effective? Environ. Health 2013. [Google Scholar] [CrossRef] [PubMed] [Green Version]
- Boeckmann, M.; Rohn, I. Is planned adaptation to heat reducing heat-related mortality and illness? A systematic review. BMC Public Health 2014. [Google Scholar] [CrossRef] [PubMed]
- Gosling, S.N.; McGregor, G.R.; Lowe, J.A. The benefits of quantifying climate model uncertainty in climate change impacts assessment: An example with heat-related mortality change estimates. Clim. Chang. 2012, 112, 217–231. [Google Scholar] [CrossRef]
- Mercer, J.B. Cold—An underrated risk factor for health. Environ. Res. 2002, 12, 8–13. [Google Scholar] [CrossRef]
- Kenney, W.L.; Munce, T.A. Invited review: Aging and human temperature regulation. J. Appl. Physiol. 2003, 95, 2598–2603. [Google Scholar] [CrossRef] [PubMed]
- McMichael, A.J.; Woodruff, R.E.; Hales, S. Climate change and human health: Present and future risks. Lancet 2006, 367, 859–869. [Google Scholar] [CrossRef]
- Cheng, X.; Su, H. Effects of climatic temperature stress on cardiovascular diseases. Eur. J. Intern. Med. 2010, 21, 164–167. [Google Scholar] [CrossRef] [PubMed]
- Kyselý, J.; Huth, R. Heat-related mortality in the Czech Republic examined through synoptic and “traditional” approaches. Clim. Res. 2004, 25, 265–274. [Google Scholar] [CrossRef]
- Kyselý, J.; Kříž, B. Decreased impacts of the 2003 heat waves on mortality in the Czech Republic: An improved response? Int. J. Biometeorol. 2008, 52, 733–745. [Google Scholar] [CrossRef] [PubMed]
- Kyselý, J.; Plavcová, E.; Davídkovová, H.; Kynčl, J. Comparison of hot and cold spell effects on cardiovascular mortality in individual population groups in the Czech Republic. Clim. Res. 2011, 49, 113–129. [Google Scholar] [CrossRef]
- Davídkovová, H.; Plavcová, E.; Kynčl, J.; Kyselý, J. Impacts of hot and cold spells differ for acute and chronic ischaemic heart diseases. BMC Public Health 2014. [Google Scholar] [CrossRef] [PubMed]
- Hanzlíková, H.; Plavcová, E.; Kynčl, J.; Kříž, B.; Kyselý, J. Contrasting patterns of hot spell effects on morbidity and mortality for cardiovascular diseases in the Czech Republic, 1994–2009. Int. J. Biometeorol. 2015. [Google Scholar] [CrossRef] [PubMed]
- Hajat, S.; Kovats, R.S.; Lachowycz, K. Heat-related and cold-related deaths in England and Wales: Who is at risk? Occup. Environ. Med. 2007, 64, 93–100. [Google Scholar] [CrossRef] [PubMed]
- Tan, J.; Zheng, Y.; Tang, X.; Guo, C.; Li, L.; Song, G.; Zhen, X.; Yuan, D.; Kalkstein, A.J.; Li, F. The urban heat island and its impact on heat waves and human health in Shanghai. Int. J. Biometeorol. 2010, 54, 75–84. [Google Scholar] [CrossRef] [PubMed]
- Gabriel, K.M.A.; Endlicher, W.R. Urban and rural mortality rates during heat waves in Berlin and Brandenburg, Germany. Environ. Pollut. 2011, 159, 2044–2050. [Google Scholar] [CrossRef] [PubMed]
- Uejio, C.K.; Wilhelmi, O.V.; Golden, J.S.; Mills, D.M.; Gulino, S.P.; Samenow, J.P. Intra-urban societal vulnerability to extreme heat: The role of heat exposure and the built environment, socioeconomics, and neighborhood stability. Health Place 2011, 17, 498–507. [Google Scholar] [CrossRef] [PubMed]
- Hondula, D.M.; Davis, R.E.; Leisten, M.J.; Saha, M.V.; Veazey, L.M.; Wegner, C.R. Fine-scale spatial variability of heat-related mortality in Philadelphia County, USA, from 1983 to 2008: A case-series analysis. Environ. Health 2012. [Google Scholar] [CrossRef] [PubMed]
- Klein Rosenthal, J.; Kinney, P.L.; Metzger, K.B. Intra-urban vulnerability to heat-related mortality in New York City, 1997–2006. Health Place 2014, 30, 45–60. [Google Scholar] [CrossRef] [PubMed]
- Reid, C.E.; O’Neill, M.S.; Gronlund, C.J.; Brines, S.J.; Brown, D.G.; Diez-Roux, A.V.; Schwartz, J. Mapping community determinants of heat vulnerability. Environ. Health Perspect. 2009, 117, 1730–1736. [Google Scholar] [PubMed]
- Reid, C.E.; Mann, J.K.; Alfasso, R.; English, P.B.; King, G.C.; Lincoln, R.A.; Margolis, H.G.; Rubado, D.J.; Sabato, J.E.; West, N.L.; et al. Evaluation of a heat vulnerability index on abnormally hot days: An environmental public health tracking study. Environ. Health Perspect. 2012, 120, 715–720. [Google Scholar] [CrossRef] [PubMed]
- Bao, J.; Li, X.; Yu, C. The construction and validation of the heat vulnerability index, a review. Int. J. Environ. Res. Public Health 2015, 12, 7220–7234. [Google Scholar] [CrossRef] [PubMed]
- Xu, Y.; Dadvand, P.; Barrera-Gomez, J.; Sartini, C.; Mari-Dell’Olmo, M.; Borrell, C.; Medina-Ramon, M.; Sunyer, J.; Basagana, X. Differences on the effect of heat waves on mortality by sociodemographic and urban landscape characteristics. J. Epidemiol. Community Health 2013, 67, 519–525. [Google Scholar] [CrossRef] [PubMed]
- Burkart, K.; Meier, F.; Schneider, A.; Breitner, S.; Canário, P.; Joao Alcoforado, M.; Scherer, D.; Endlicher, W. Modification of heat-related mortality in an elderly urban population by vegetation (Urban Green) and proximity to water (Urban Blue): Evidence from Lisbon, Portugal. Environ. Health Perspect. 2015. [Google Scholar] [CrossRef]
- Sheridan, S.C.; Dolney, T.J. Heat, mortality, and level of urbanization: Measuring vulnerability across Ohio, USA. Clim. Res. 2003, 24, 255–265. [Google Scholar] [CrossRef]
- Maier, G.; Grundstein, A.; Jang, W.; Li, C.; Naeher, L.P.; Shepherd, M. Assessing the performance of a vulnerability index during oppressive heat across Georgia, United States. Weather Clim. Soc. 2014, 6, 253–263. [Google Scholar] [CrossRef]
- Kovach, M.M.; Konrad, C.E., II; Fuhrmann, C.M. Area-level risk factors for heat-related illness in rural and urban locations across North Carolina, USA. Appl. Geogr. 2015, 60, 175–183. [Google Scholar] [CrossRef]
- Urban, A.; Davídkovová, H.; Kyselý, J. Heat- and cold-stress effects on cardiovascular mortality and morbidity among urban and rural populations in the Czech Republic. Int. J. Biometeorol. 2014, 56, 1057–1068. [Google Scholar] [CrossRef] [PubMed]
- Urban, A.; Kyselý, J. Comparison of UTCI with other thermal indices in the assessment of heat and cold effects on cardiovascular mortality in the Czech Republic. Int. J. Environ. Res. Public Health 2014, 11, 952–967. [Google Scholar] [CrossRef] [PubMed]
- Huynen, M.M.; Martens, P.; Schram, D.; Weijenberg, M.P.; Kunst, A.E. The impact of heat waves and cold spells on mortality rates in the Dutch population. Environ. Health Perspect. 2001, 109, 463–470. [Google Scholar] [CrossRef] [PubMed]
- Laschewski, G.; Jendritzky, G. Effects of the thermal environment on human health: An investigation of 30 years of daily mortality data from SW Germany. Clim. Res. 2002, 21, 91–103. [Google Scholar] [CrossRef]
- Kyselý, J. Mortality and displaced mortality during heat waves in the Czech Republic. Int. J. Biometeorol. 2004, 49, 91–97. [Google Scholar] [CrossRef] [PubMed]
- Gosling, S.N.; McGregor, G.R.; Páldy, A. Climate change and heat-related mortality in six cities part 1: Model construction and validation. Int. J. Biometeorol. 2007, 51, 525–540. [Google Scholar] [CrossRef] [PubMed]
- Baccini, M.; Kosatsky, T.; Biggeri, A. Impact of summer heat on urban population mortality in Europe during the 1990s: An evaluation of years of life lost adjusted for harvesting. PLoS ONE 2013. [Google Scholar] [CrossRef] [PubMed]
- Saha, M.V.; Davis, R.E.; Hondula, D.M. Mortality displacement as a function of heat event strength in 7 US cities. Am. J. Epidemiol. 2014, 179, 467–474. [Google Scholar] [CrossRef] [PubMed]
- Zaninović, K.; Matzarakis, A. Impact of heat waves on mortality in Croatia. Int. J. Biometeorol. 2014, 58, 1135–1145. [Google Scholar] [CrossRef] [PubMed]
- EUROSTAT. Local Administrative Units. Available online: http://ec.europa.eu/eurostat/web/nuts/local-administrative-units (accessed on 20 October 2015).
- Czech Statistical Office—Nomenclature of Territorial Units for Statistics (CZ-NUTS)—2004. (in Czech Language). Available online: https://www.czso.cz/csu/czso/klasifikace_uzemnich_statistickych_jednotek_-cz_nuts- (accessed on 20 October 2015).
- Kyselý, J.; Plavcová, E. A critical remark on the applicability of E-OBS European gridded temperature data set for validating control climate simulations. J. Geophys. Res. 2010, 115, 1–14. [Google Scholar] [CrossRef]
- Błażejczyk, K.; Epstein, Y.; Jendritzky, G.; Staiger, H.; Tinz, B. Comparison of UTCI to selected thermal indices. Int. J. Biometeorol. 2012, 56, 515–535. [Google Scholar] [CrossRef] [PubMed]
- Gridded Population of the World, Version 3 (GPWv3) Data Collection. Center for International Earth Science Information Network (CIESIN), Colombia Univesity. 2005. Available online: http://sedac.ciesin.columbia.edu/data/collection/gpw-v3 (accessed on 20 September 2015).
- Davídkovová, H.; Kyselý, J.; Kříž, B.; Vojtíšek, P.; Bobák, M. Trends in cardiovascular mortality and hospitalisations, and potential contribution of in hospital case-fatality rates to changes in national mortality in the Czech Republic 1994–2009. Heart 2013, 99, 409–416. [Google Scholar] [CrossRef] [PubMed]
- Ahmad, O.; Boschi-Pinto, C.; Lopez, A.D.; Murray, C.J.L.; Lozano, R.; Inoue, M. Age Standardization of Rates: A New WHO Standard; World Health Organization: Geneva, Switzerland, 2001. [Google Scholar]
- Wood, S. Generalized Additive Models: An Introduction with R; Chapman & Hall/CRC: London, UK, 2006. [Google Scholar]
- Bhaskaran, K.; Gasparrini, A.; Hajat, S.; Smeeth, L.; Armstrong, B. Time series regression studies in environmental epidemiology. Int. J. Epidemiol. 2013, 42, 1187–1195. [Google Scholar] [CrossRef] [PubMed]
- Plavcová, E.; Kyselý, J. Relationships between sudden weather changes in summer and mortality in the Czech Republic, 1986–2005. Int. J. Biometeorol. 2010, 54, 539–551. [Google Scholar] [CrossRef] [PubMed]
- Getis, A.; Ord, J.K. The analysis of spatial association by use of distance statistics. Geogr. Anal. 1992, 24, 189–206. [Google Scholar] [CrossRef]
- Vescovi, L.; Rebetez, M.; Rong, F. Assessing public health risk due to extremely high temperature events: Climate and social parameters. Clim. Res. 2005, 30, 71–78. [Google Scholar] [CrossRef]
- Wichmann, J.; Andersen, Z.J.; Ketzel, M.; Ellermann, T.; Loft, S. Apparent temperature and cause-specific mortality in Copenhagen, Denmark: A case-crossover analysis. Int. J. Environ. Res. Public Health 2011, 8, 3712–3727. [Google Scholar] [CrossRef] [PubMed]
- Hattis, D.; Ogneva-Himmelberger, Y.; Ratick, S. The spatial variability of heat-related mortality in Massachusetts. Appl. Geogr. 2012, 33, 45–52. [Google Scholar] [CrossRef]
- Harlan, S.L.; Declet-barreto, J.H.; Stefanov, W.L.; Petitti, D.B. Neighborhood effects on heat deaths: Social and environmental predictors of vulnerability in Maricopa County, Arizona. Environ. Health Perspect. 2013, 121, 197–204. [Google Scholar] [PubMed]
- Spiezia, V. Measuring Regional Economies. Statistics Brief OECD, No. 6. 2003. Available online: http://www.oecd.org/dataoecd/2/15/15918996.pdf (accessed on 14 August 2013).
- Šplíchalová, A.; Šlachtová, H.; Tomášková, H.; Polaufová, P. Analysis of mortality in the Czech Republic using the newly constructed socio-economic deprivation index. Epidemiology 2007. [Google Scholar] [CrossRef]
- Johnson, D.P.; Stanforth, A.; Lulla, V.; Luber, G. Developing an applied extreme heat vulnerability index utilizing socioeconomic and environmental data. Appl. Geogr. 2012, 35, 23–31. [Google Scholar] [CrossRef]
- Harrell, F.E.; Hmisc, S. Function Library. 2004. Available online: http://biostat.mc.vanderbilt.edu/s/Hmisc (accessed on 8 October 2015).
- Venables, W.N.; Ripley, B.D. Modern Applied Statistics with S, 4th ed.; Springer: New York, NY, USA, 2002. [Google Scholar]
- Blatecká, K. The Basic Characteristics of Czech Rural Areas. Ph.D Thesis, Masaryk University, Brno, Czech Republic, 2006. Available online: http://is.muni.cz/th/137827/esf_m (accessed on 14 August 2013) . [Google Scholar]
- Medina-Ramón, M.; Schwartz, J. Temperature, Temperature Extremes, and Mortality: A study of acclimatization and effect modification in 50 United States cities. Occup. Environ. Med. 2007, 64, 827–834. [Google Scholar] [CrossRef] [PubMed]
- Henderson, G. Home air conditioning in Europe—How much energy would we use if we became more like American households? In Energy Savings: What Works & Who Delivers; Attali, S., Tillerson, K., Eds.; European Council for an Energy Efficient Economy: Stockholm, Sweden, 2005; pp. 541–550. [Google Scholar]
- OECD. Income Distribution Database (IDD): Gini, Poverty, Income, Methods and Concepts. Available online: http://www.oecd.org/social/income-distribution-database.htm (accessed on 20 September 2015).
- Bubbico, R.L.; Dijkstra, L. Regional Focus. Available online: http://ec.europa.eu/regional_policy/sources/docgener/focus/2011_02_hdev_hpov_indices.pdf (accessed on 20 September 2015).
- Arnfield, A.J. Two decades of urban climate research: A review of turbulence, exchanges of energy and water, and the urban heat island. Int. J. Climatol. 2003, 23, 1–26. [Google Scholar] [CrossRef]
- Fischer, E.M.; Oleson, K.W.; Lawrence, D.M. Contrasting urban and rural heat stress responses to climate change. Geophys. Res. Lett. 2012, 39, 1–8. [Google Scholar] [CrossRef]
- Alcoforado, M.-J.; Andrade, H. Nocturnal urban heat island in Lisbon (Portugal): Main features and modelling attempts. Theor. Appl. Climatol. 2006, 84, 151–159. [Google Scholar] [CrossRef]
- Unger, J. Intra-urban relationship between surface geometry and urban heat island: Review and new approach. Clim. Res. 2004, 27, 253–264. [Google Scholar] [CrossRef]
- Dütemeyer, D.; Barlag, A.B.; Kuttler, W.; Axt-Kittner, U. Measures against heat stress in the city of Gelsenkirchen, Germany. DIE ERDE 2013, 144, 181–201. [Google Scholar]
- Dugord, P.-A.; Lauf, S.; Schuster, C.; Kleinschmit, B. Land use patterns, temperature distribution, and potential heat stress risk—The case study Berlin, Germany. Comput. Environ. Urban Syst. 2014, 48, 86–98. [Google Scholar] [CrossRef]
- Dzúrová, D. Zdravotní Stav Obyvatel a Kvalita životního Prostředí: Regionální Souvislosti. Ph.D. Thesis, Faculty of Science, Charles University, Prague, Czech Republic, 1993; p. 136. [Google Scholar]
- Brook, R.D.; Franklin, B.; Cascio, W.; Hong, Y.; Howard, G.; Lipsett, M.; Luepker, R.; Mittleman, M.; Samet, J.; Sidney, C.; et al. Air pollution and cardiovascular disease: A statement for healthcare professionals from the expert panel on population and prevention science of the American Heart Association. Circulation 2004, 109, 2655–2671. [Google Scholar] [CrossRef] [PubMed]
- Chen, H.; Goldberg, M.S. The effects of outdoor air pollution on chronic illnesses. McGill J. Med. 2009, 12, 58–64. [Google Scholar] [PubMed]
- Kaufman, J.D. Does Air pollution accelerate progression of atherosclerosis? JAC 2010, 56, 1809–1811. [Google Scholar] [CrossRef] [PubMed]
- Urban, A.; Kyselý, J. Application of spatial synoptic classification in evaluating links between heat stress and cardiovascular mortality and morbidity in Prague, Czech Republic. Int. J. Biometeorol. 2015. [Google Scholar] [CrossRef] [PubMed]
- Czech Hydrometeorological Institute. Air Pollution in the Czech Republic. Available online: http://portal.chmi.cz/files/portal/docs/uoco/isko/tab_roc/tab_roc_EN.html (accessed on 20 October 2015).
- Buckley, J.P.; Samet, J.M.; Richardson, D.B. Commentary: Does air pollution confound studies of temperature? Epidemiology 2014, 25, 242–245. [Google Scholar] [CrossRef] [PubMed]
- Hondula, D.M.; Barnett, A.G. Heat-related morbidity in Brisbane, Australia: Spatial variation and area-level predictors. Environ. Health Perspect. 2014, 122, 831–836. [Google Scholar] [CrossRef] [PubMed]
- Novák, M. Use of the UTCI in the Czech Republic. Geogr. Pol. 2013, 86, 21–28. [Google Scholar] [CrossRef]
- Zacharias, S.; Koppe, C.; Mücke, H.-G. Influence of heat waves on ischemic heart diseases in Germany. Climate 2014, 2, 133–152. [Google Scholar] [CrossRef]
- Wolf, T.; McGregor, G.; Analitis, A. Performance assessment of a heat wave vulnerability index for greater London, United Kingdom. Weather Clim. Soc. 2014, 6, 32–46. [Google Scholar] [CrossRef]
- Scherber, K.; Langner, M.; Endlicher, W. Spatial analysis of hospital admissions for respiratory diseases during summer months in Berlin taking bioclimatic and socio-economic aspects into account. Geogr. Soc. Berl. 2014, 144, 217–237. [Google Scholar]
- Wakefield, J.; Salway, R. A statistical framework for ecological and statistical studies. J. R. Stat. Soc. 2001, 164, 119–137. [Google Scholar] [CrossRef]
- Openshaw, S.; Taylor, P.J. The modifiable areal unit problem. In Quantitative Geography: A British View; Wrigley, N., Bennett, R.J., Eds.; Routledge: Boston, MA, USA, 1981; pp. 60–69. [Google Scholar]
- Tolasz, R.; Tolasz, R.; Míková, T.; Valeriánová, A.; Voženílek, V. Climate Atlas of Czechia; Czech Hydrometeorological Institute: Prague, Czech Republic, 2007; p. 254. [Google Scholar]


| Variable | Description |
|---|---|
| DevCVD | Mean relative CVD mortality deviations on hot days with average temperature above the 90th percentile in June–August 1994–2009 |
| SES | Index of socioeconomic status; sum of z-scores for % low education, % unemployed and % singles |
| % elderly | % of population older than 65 years |
| % low education | % of population without secondary school diploma |
| % unemployed | % of unemployed population |
| % singles | % of single-person households |
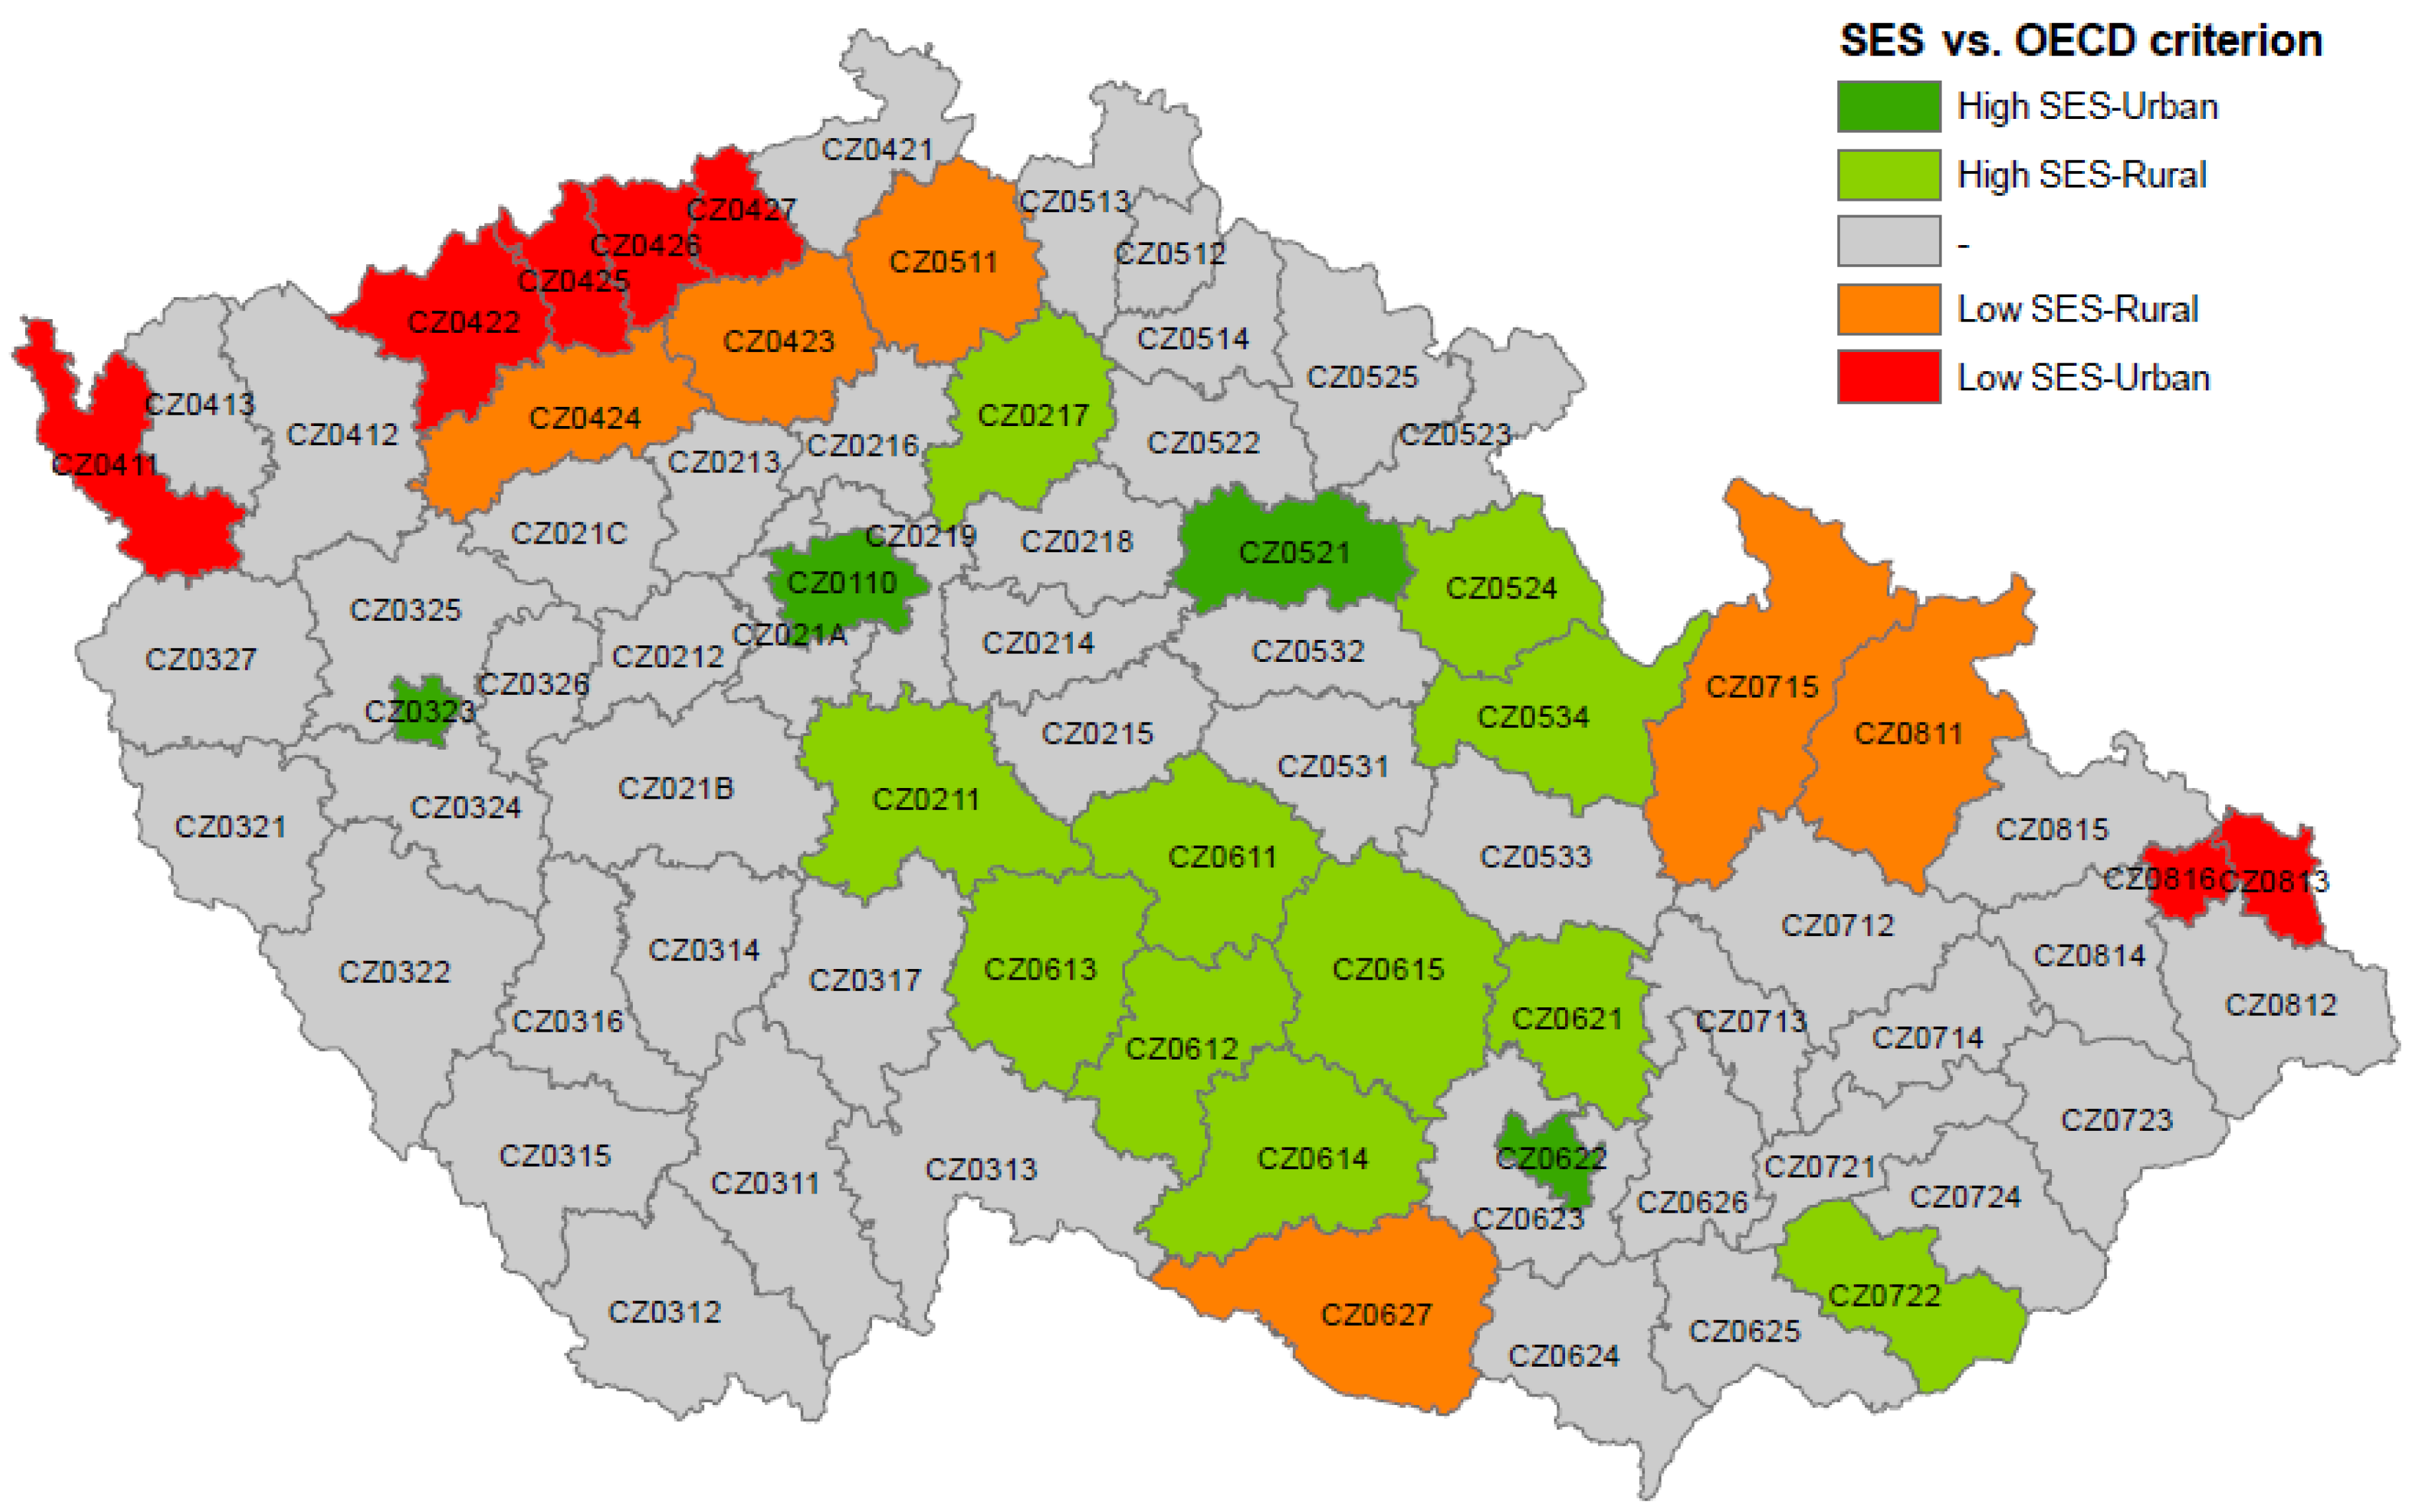
| OECD | % of inhabitants in municipalities with population density less than 150 inhabitants/km2 |
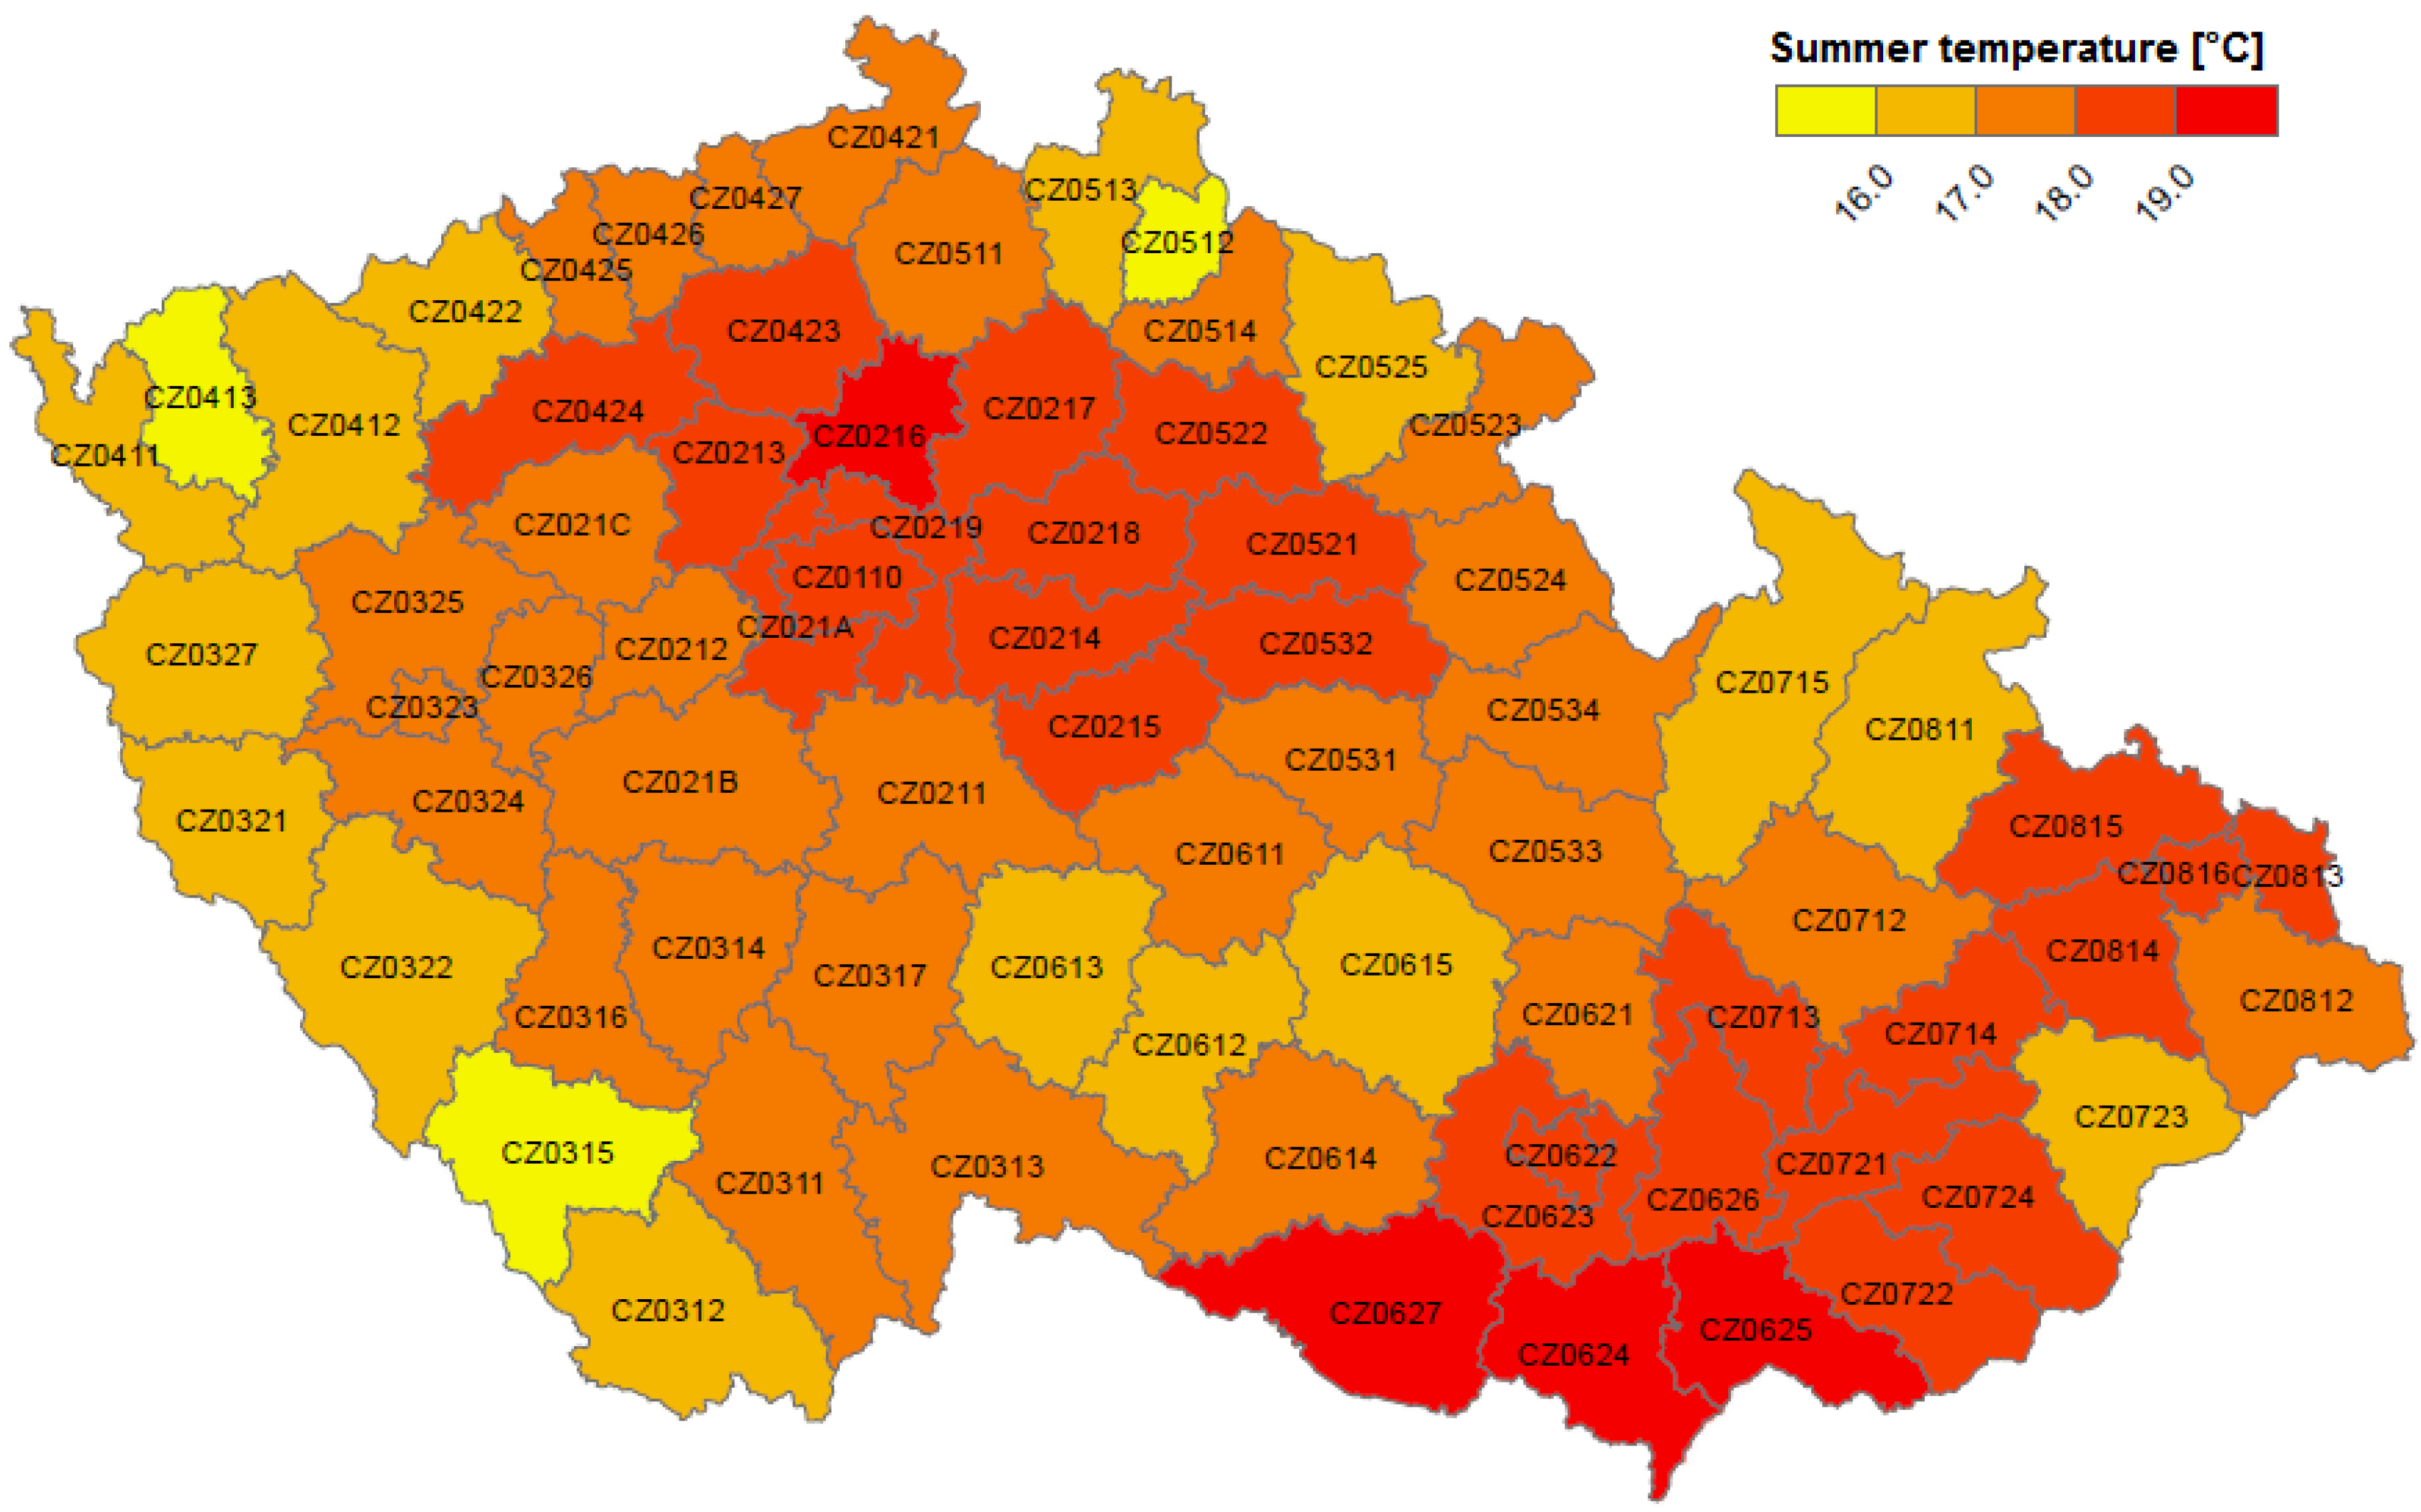
| Summer T (°C) | Mean summer (1 June–31 August 1994–2009) temperature in °C |
| Altitude (m a.s.l.) | Average altitude in metres above sea level |
| % impervious | % of impervious surface area (categories 1.1 and 1.2 in the CORINE land cover classification) |
| Characteristic | High SES-Urban | High SES-Rural | Low SES-Rural | Low SES-Urban |
|---|---|---|---|---|
| Population | 1,871,095 | 1,197,212 | 694,115 | 1,170,971 |
| OECD | 5.93 | 48.95 | 50.88 | 10.51 |
| SES | 2.06 | 1.56 | −1.85 | −3.62 |
| % elderly | 15.56 | 13.91 | 12.20 | 11.94 |
| % low education | 49.67 | 65.08 | 68.59 | 65.73 |
| % unemployed | 3.81 | 3.15 | 6.64 | 8.16 |
| % singles | 33.82 | 27.01 | 29.23 | 33.54 |
| Summer T (°C) | 18.4 | 17.4 | 17.6 | 17.5 |
| Altitude (m a.s.l) | 327 | 459 | 392 | 415 |
| % impervious | 29.82 | 4.45 | 4.40 | 13.42 |
| Independent Variable | DevCVD | SES | % Elderly | % low Education | % Unemployed | % Singles | OECD | Summer T (°C) | Altitude (m a.s.l.) |
|---|---|---|---|---|---|---|---|---|---|
| SES | 0.01 | 1 | |||||||
| % elderly | 0.14 | 0.61 | 1 | ||||||
| % low education | −0.20 | −0.52 | −0.47 | 1 | |||||
| % unemployed | 0.12 | −0.75 | −0.53 | 0.33 | 1 | ||||
| % singles | 0.13 | −0.38 | −0.04 | −0.24 | 0.09 | 1 | |||
| OECD | −0.22 | 0.11 | 0.07 | 0.47 | −0.24 | −0.56 | 1 | ||
| Summer T (°C) | 0.37 | 0.18 | 0.38 | −0.19 | 0.10 | −0.08 | −0.19 | 1 | |
| Altitude (m a.s.l.) | −0.37 | −0.05 | −0.31 | 0.17 | −0.13 | −0.09 | 0.26 | −0.92 | 1 |
| % impervious | 0.34 | 0.05 | 0.12 | −0.41 | 0.24 | 0.23 | −0.74 | 0.64 | −0.66 |
| Independent Variable | DevCVD |
|---|---|
| SES | ---- |
| % elderly | ---- |
| % low education | ---- |
| % unemployed | ---- |
| % singles | ---- |
| OECD | −0.096 (0.043) |
| Summer T (°C) | 2.922 (0.002) |
| % impervious | ---- |
| R2 | 0.191 |
| SES Class | DevCVD vs. SES | DevCVD vs. Summer T (°C) | DevCVD vs. OECD | SES vs. OECD |
|---|---|---|---|---|
| Low | −3.099 (0.034) | 4.307 (0.025) | −0.193 (0.044) | 0.041 (0.000) |
| Intermediate | −3.399 (0.490) | 3.537 (0.008) | −0.073 (0.407) | 0.008 (0.293) |
| High | 1.474 (0.842) | 1.234 (0.181) | −0.164 (0.078) | −0.008 (0.347) |
| R2 | 0.086 | 0.160 | 0.107 | 0.878 |
© 2016 by the authors; licensee MDPI, Basel, Switzerland. This article is an open access article distributed under the terms and conditions of the Creative Commons by Attribution (CC-BY) license (http://creativecommons.org/licenses/by/4.0/).
Share and Cite
Urban, A.; Burkart, K.; Kyselý, J.; Schuster, C.; Plavcová, E.; Hanzlíková, H.; Štěpánek, P.; Lakes, T. Spatial Patterns of Heat-Related Cardiovascular Mortality in the Czech Republic. Int. J. Environ. Res. Public Health 2016, 13, 284. https://doi.org/10.3390/ijerph13030284
Urban A, Burkart K, Kyselý J, Schuster C, Plavcová E, Hanzlíková H, Štěpánek P, Lakes T. Spatial Patterns of Heat-Related Cardiovascular Mortality in the Czech Republic. International Journal of Environmental Research and Public Health. 2016; 13(3):284. https://doi.org/10.3390/ijerph13030284
Chicago/Turabian StyleUrban, Aleš, Katrin Burkart, Jan Kyselý, Christian Schuster, Eva Plavcová, Hana Hanzlíková, Petr Štěpánek, and Tobia Lakes. 2016. "Spatial Patterns of Heat-Related Cardiovascular Mortality in the Czech Republic" International Journal of Environmental Research and Public Health 13, no. 3: 284. https://doi.org/10.3390/ijerph13030284