
Neighborhood Design, Physical Activity, and Wellbeing: Applying the Walkability Model


Abstract
:1. Introduction—Background Information
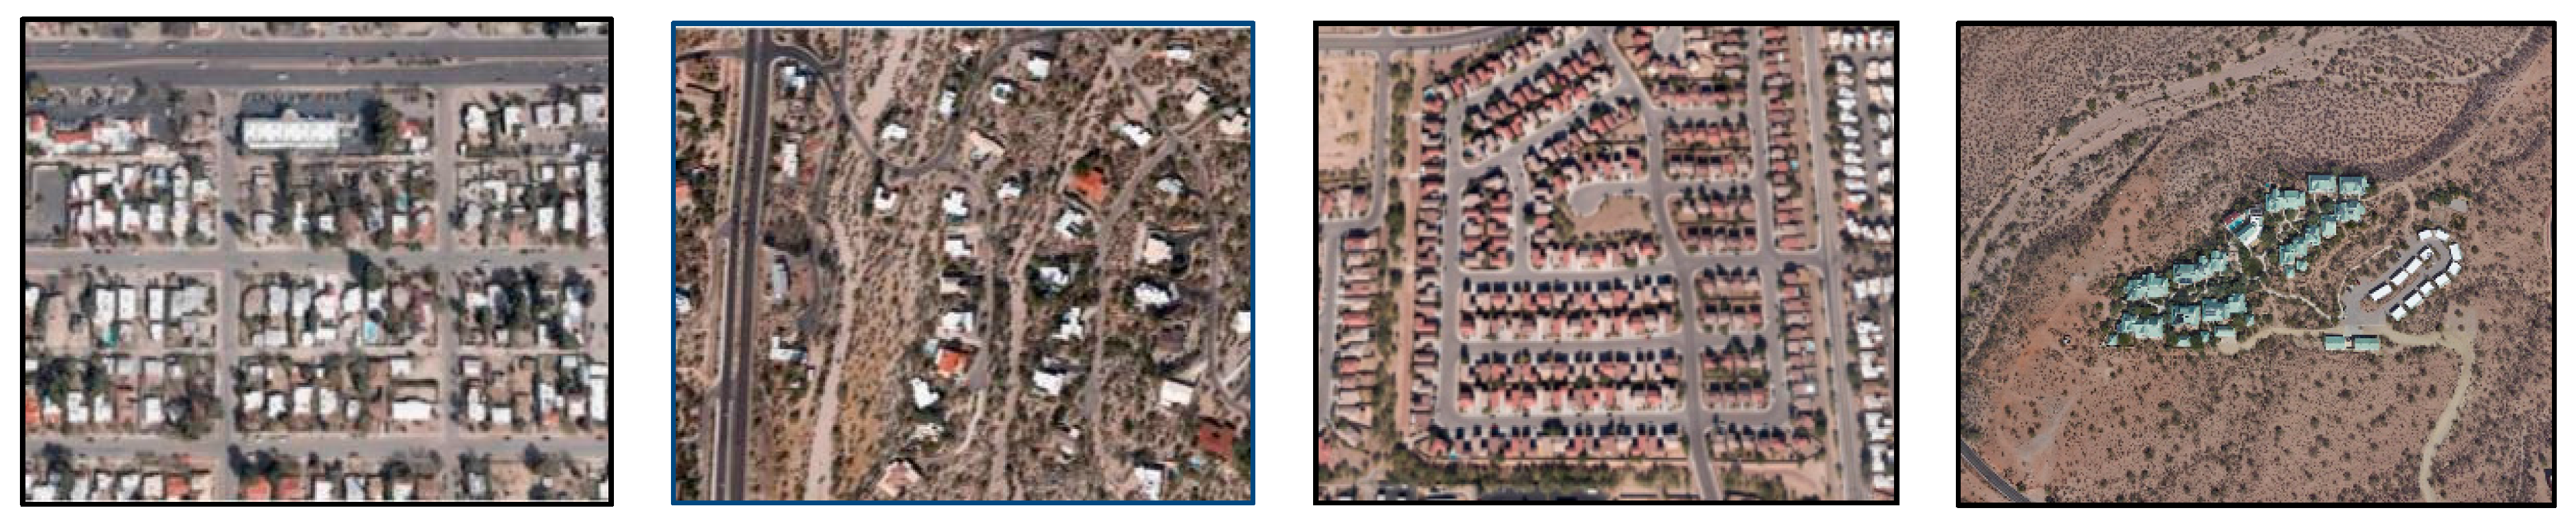
1.1. Traditional Development
1.2. Suburban Development
1.3. Enclosed Community
1.4. Cluster Housing
1.5. Walkable Neighborhoods
1.6. Motivations for Walking
1.7. Wellbeing
2. Materials and Methods
3. Results
4. Discussion
4.1. Demographics
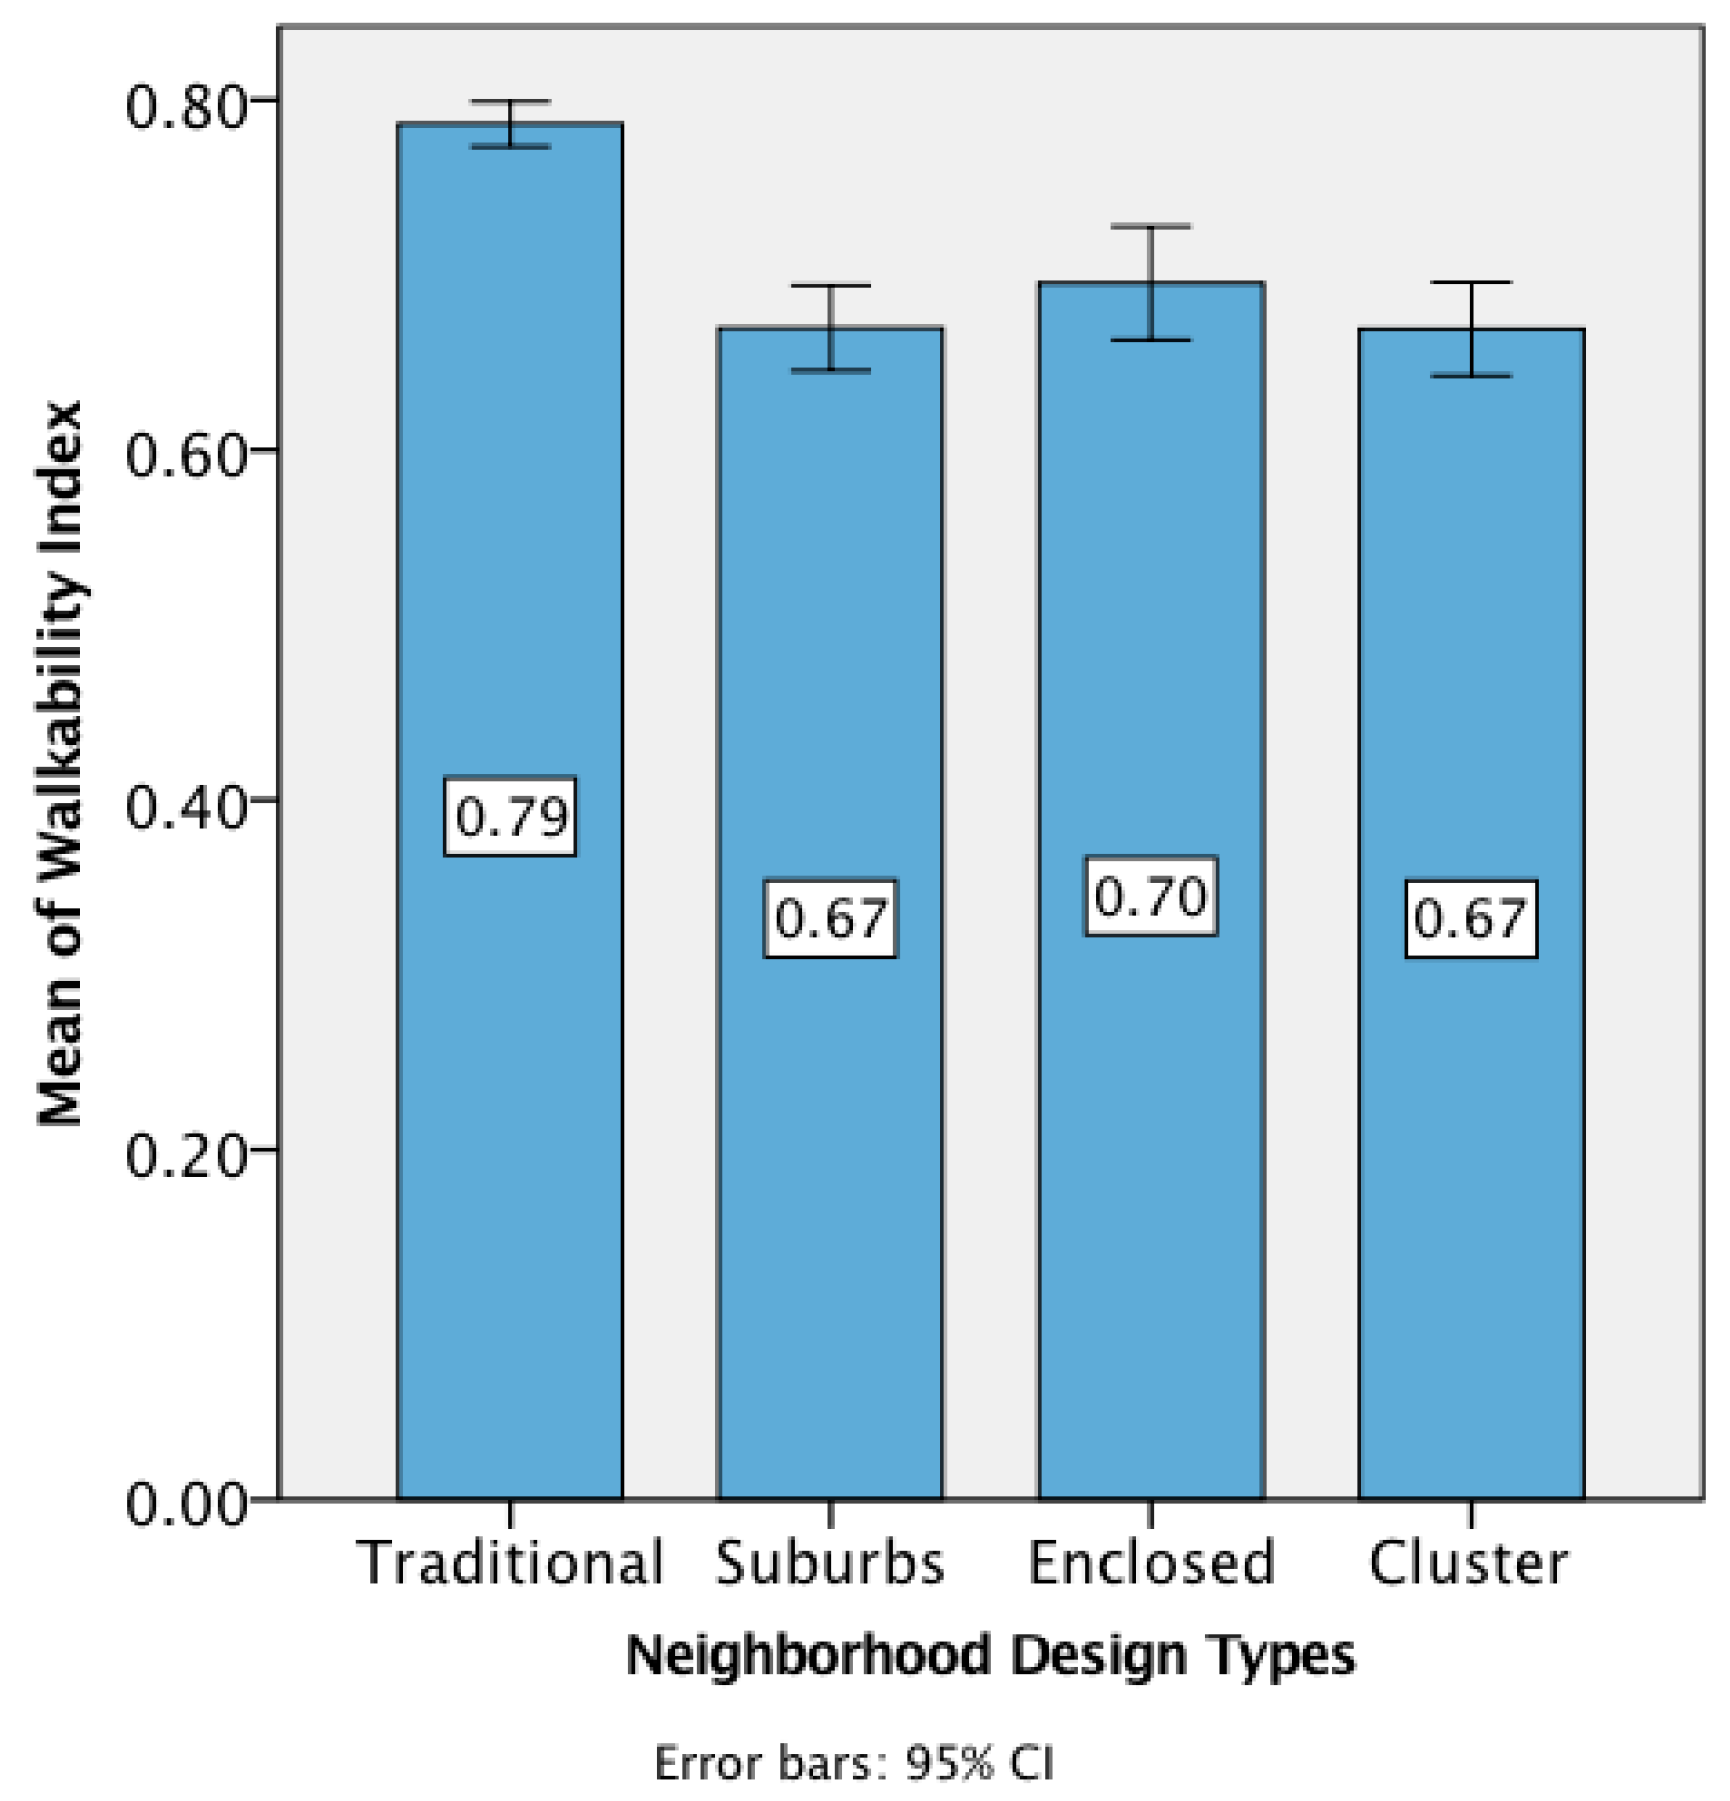
4.2. Walkability
4.3. Motivations for Walking
4.4. Social Interactions with Neighbors
4.5. Wellbeing
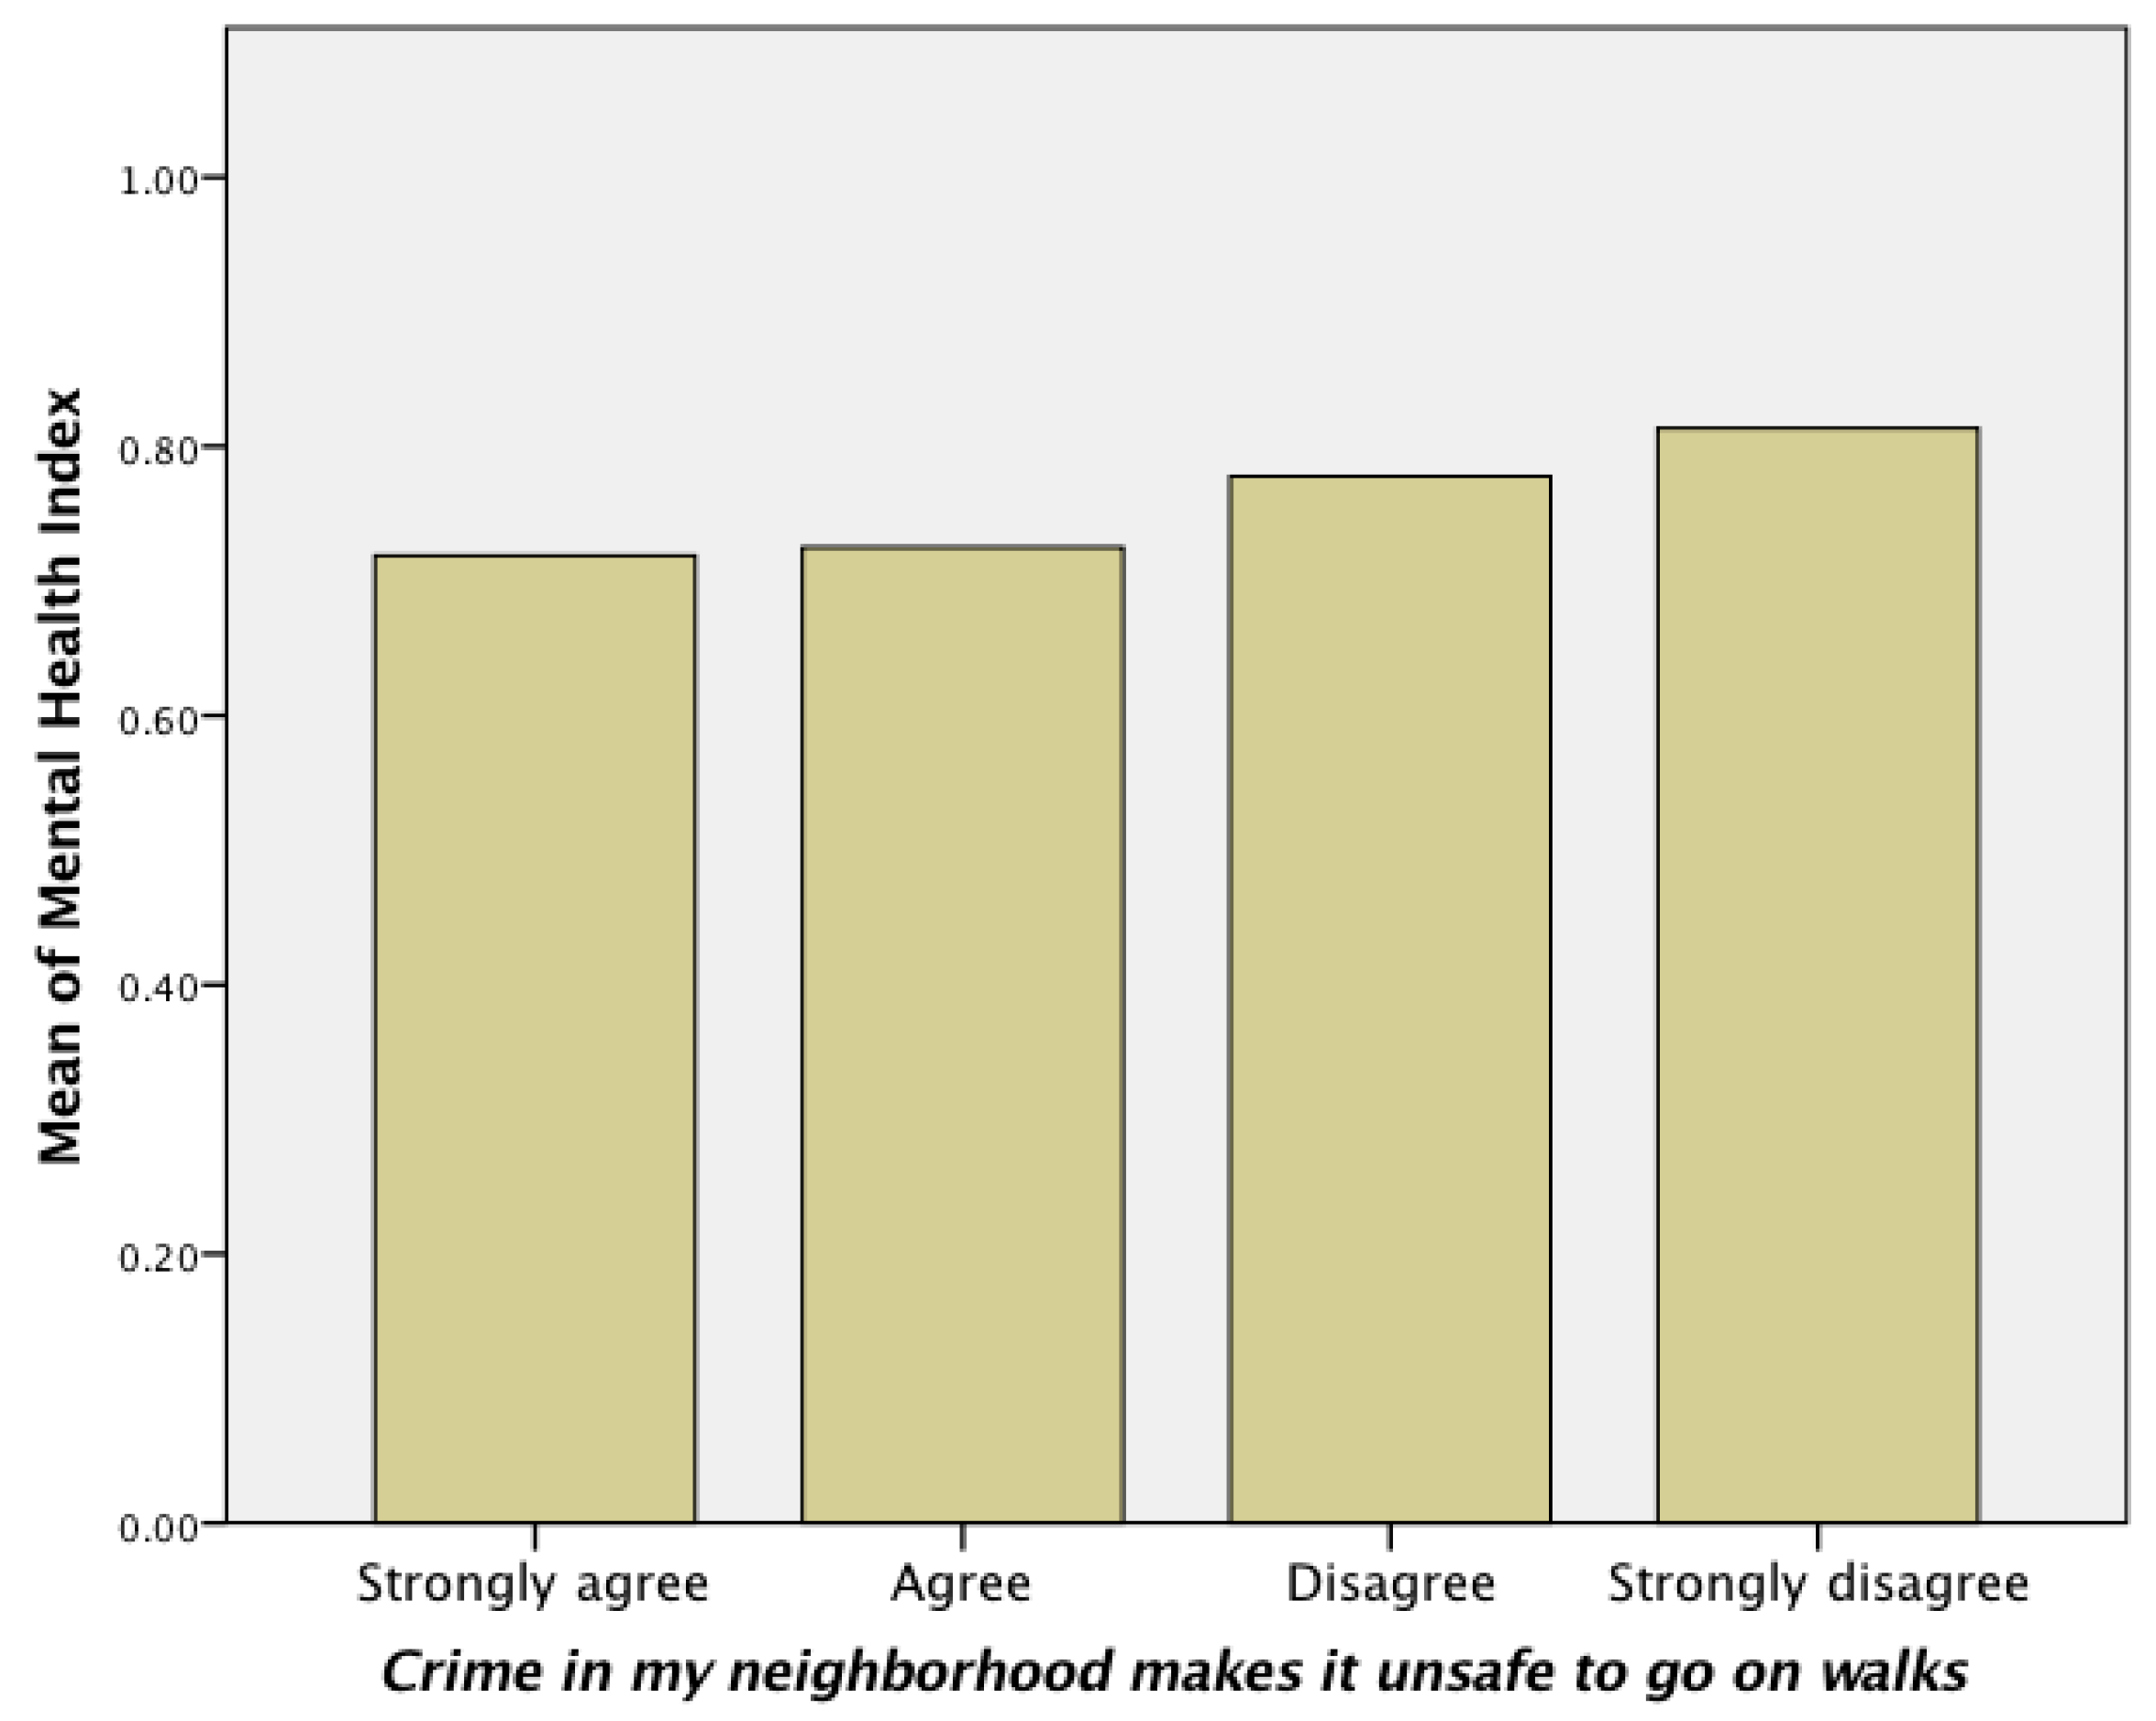
4.6. Perceived Crime
4.7. Trees
4.8. Limitations
5. Conclusions
Acknowledgments
Author Contributions
Conflicts of Interest
Appendix A

| Neighborhood Design | Characteristics | Questions from Questionnaire Used for Validation |
|---|---|---|
| All | Traditional—Mostly 1950s or earlier |
|
| Suburban—Mostly after 1950s | ||
| Enclosed—Mostly 1990s or later | ||
| Cluster—Mostly 1960s and later | ||
| Traditional development | Back alleys |
|
| Garages face back alleys |
| |
| Front porches |
| |
| Suburban development | Mostly single-family housing |
|
| Mostly cul-de-sacs street network |
| |
| Enclosed community | Gated |
|
| Fenced |
| |
| Cluster housing | Mostly townhomes |
|
| Shared facilities |
| |
| Greenspace in close proximity |
|
| Walkability Category | Questions | Answer Options |
|---|---|---|
| Connectivity | There are major barriers for walking | 4 Pt. Likert Scale Strongly agree Agree Disagree Strongly disagree |
| 1. The distance between intersections is usually short (100 yards) * | ||
| 2. There are many alternative routes for getting from place to place * | ||
| 3. My neighborhood is a gated community | ||
| 4. My neighborhood is fenced on the outer boundary | ||
| 5. The streets in my neighborhood have many cul-de-sacs | ||
| 6. Back alleys serve most of the garages in my neighborhood * | ||
| Density | 1. Select the option that best describes your dwelling type unit | Single family Townhome Apartment Multi-family Temporary home |
| 2. How common are single-family housing? * | None A few Some Most All | |
| 3. How common are townhomes? | ||
| 4. How common are apartments/condos? * | ||
| Land-use | Check the services that are located within 10 min walking distance (1/2 mile or less from your home (check all that apply) Bus stop, Gym, Post office, Bank, Supermarket, Hair salon/barber, School, Police station, Food store with produce, Laundry/dry cleaner, Theater, Pharmacy, Clothing store, Restaurant/café/diner, Medical clinic, Convenient store, Government office, Farmers market, Child care facility, Social services center, Hardware, Museum | Checked Unchecked |
| Traffic safety | 1. There are bike lanes on most of the streets * | 4 Pt. Likert Scale |
| 2. There are sidewalks on most of the streets * | ||
| 3. Sidewalks are separated from road/traffic by parked cars * | ||
| 4. There is grass/dirt strip that separates the streets from most of the sidewalk * | ||
| 5. There are dirt trails on most of the streets * | ||
| 6. There are crosswalks and pedestrian signals to help walkers cross busy streets * | ||
| 7. The streets have speed bumps * | ||
| 8. The speed limit is 25 mph or less on most of the streets * | ||
| Surveillance | 1. My neighborhood streets are well lit at night * | 4 Pt. Likert Scale |
| 2. Most units have front porches * | ||
| 3. The buildings are located close to the street * | ||
| 4. Most dwellings have front garage doors | ||
| 5. My neighborhood has back alleys with garages * | ||
| Experience | Aesthetics | 4 Pt. Likert Scale |
| 1. There is graffiti in my neighborhood | ||
| 2. There is trash/litter in my neighborhood | ||
| 3. There are many attractive natural sights to look at while walking * | ||
| 4. There are attractive buildings and homes | ||
| 5. Possible interactions with wildlife makes it attractive to go on walks * | ||
| 6. Possible interactions with wildlife or stray dogs makes it unsafe to go on walks | ||
| Slope | ||
| 7. Most streets are hilly making it difficult to walk or bike | ||
| Way-finding | ||
| 8. It is easy to get lost while walking | ||
| 9. There is clear signage or landmarks that help me find my way* | ||
| Thermal comfort | ||
| 10. There is enough shade to walk comfortably * | ||
| 11. There are trees along the streets * | ||
| Greenspace | Proximity to Greenspace | |
| 1. How far is the nearest greenspace from your home? * | ¼ mile (5 min walk) 1/2 mile (10 min walk) Farther that 1/2 mile | |
| 2. Greenspace is a services close to home | Checked Unchecked | |
| Access to Greenspace | ||
| 3. It is easy to walk to greenspace from my home * | 4 Pt. Likert Scale | |
| Community | 1. Selecting/not-selecting “Community facilities” and “Church” as services close to home | Checked Unchecked |
| 2. My neighborhood shares facilities (e.g., pool, tennis courts, community center) * | 4 Pt. Likert Scale |
| Questions for Social Interactions with Neighbors | Options |
|---|---|
| 1. What activities do you or your family do in the streets of your neighborhood? Option: Talk to neighbors | a. Checked b. Unchecked |
| 2. My neighborhood is friendly * | 4 Pt. Likert Scale |
| 3. I greet some of my neighbors at least once a month * | |
| 4. In case of an emergency, I would ask a neighbor for help * |
References
- Cooper, K.; Barton, G.C. An exploration of physical activity and wellbeing in university employees. Perspect. Public Health 2015. [Google Scholar] [CrossRef] [PubMed] [Green Version]
- Ellis, G.; Hunter, R.; Tully, M.A.; Donnelly, M.; Kelleher, L.; Kee, F. Connectivity and physical activity: Using footpath networks to measure the walkability of built environments. Environ. Plan. B Plan. Des. 2015. [Google Scholar] [CrossRef]
- Pojednic, R.; Peabody, S.; Carson, S.; Kennedy, M.; Bevans, K.; Phillips, E.M. The effect of before school physical activity on child development: A study protocol to evaluate the Build Our Kids Success (BOKS) Program. Contemp. Clin. Trials 2016, 49, 103–108. [Google Scholar] [CrossRef] [PubMed]
- Toit, L.D.; Cerin, E.; Leslie, E.; Owen, N. Does Walking in the Neighbourhood Enhance Local Sociability? Urban Stud. 2007, 44, 1677–1695. [Google Scholar] [CrossRef]
- Gallimore, J.M.; Brown, B.B.; Werner, C.M. Walking routes to school in new urban and suburban neighborhoods: An environmental walkability analysis of blocks and routes. J. Environ. Psychol. 2011, 31, 184–191. [Google Scholar] [CrossRef]
- Rodríguez, D.A.; Khattak, A.J.; Evenson, K.R. Can New Urbanism Encourage Physical Activity? Comparing a New Urbanist Neighborhood with Conventional Suburbs. J. Am. Plan. Assoc. 2006, 72, 43–54. [Google Scholar] [CrossRef]
- Saelens, B.E.; Saliis, J.F.; Frank, L.D. Environmental correaltes of walking and cycling: Findings from the transportation, urban design and planning literatures. Soc. Behav. Med. 2003, 25, 80–91. [Google Scholar] [CrossRef]
- Stevens, R.B.; Brown, B.B. Walkable new urban LEED_Neighborhood-Development (LEED-ND) community design and children’s physical activity: Selection, environmental, or catalyst effects? Int. J. Behav. Nutr. Phys. Act. 2011, 8, 139. [Google Scholar] [CrossRef] [PubMed]
- Wells, N.M.; Yang, Y. Neighborhood Design and Walking. Am. J. Prev. Med. 2008, 34, 313–319. [Google Scholar] [CrossRef] [PubMed]
- Montgomery, C. Happy City. Transforming Our Lives through Urban Design; Farrar, Straus & Giroux: New York, NY, USA, 2013. [Google Scholar]
- Barnett, J. Redesigning Cities; Principles, Practice, Implementation; Planners Press American Planning Association: Chicago, IL, USA, 2003. [Google Scholar]
- Kearney, A.R. Residential Development Patterns and Neighborhood Satisfaction: Impacts of Density and Nearby Nature. Environ. Behav. 2006, 38, 112–139. [Google Scholar] [CrossRef]
- Frank, L.D.; Engelke, P.O.; Schmid, T.L. Health and Community Design: The Impact of the Built Environment on Physical Activity; Island Press: Washington, DC, USA, 2003. [Google Scholar]
- Zacharias, J.; Sun, Z.; Chuang, L.; Lee, F. The hutong urban development model compared with contemporary suburban development in Beijing. Habitat Int. 2015, 49, 260–265. [Google Scholar] [CrossRef]
- Jun, M.-J.; Kim, H.-J. The effects of Seoul’s suburban beltway on accessibility, residential development, and housing rents: A transport-land use simulation approach. Ann. Reg. Sci. 2016, 56, 565–589. [Google Scholar] [CrossRef]
- Brade, I.; Smigiel, C.; Kovacs, Z. Suburban residential development in post-socialist urban regions: The case of Moscow, Sofia, and Budapest. In German Annual of Spatial Research and Policy; Kilper, H., Ed.; Springer: Berlin/Heidelberg, Germany, 2009. [Google Scholar]
- Lazauskaite, D.; Šarkienė, E.; Skripkienė, R. The Assessment of Development Scenarios for Suburban Metropolitan Districts under the Multiple Criteria Methods. Procedia Eng. 2015, 122, 19–28. [Google Scholar] [CrossRef]
- Ourednicek, M. Differential suburban development in the Prague urban region. Geogr. Ann. 2007, 89, 111–126. [Google Scholar] [CrossRef]
- González Gutiérrez, C. Secondary Mosques in Madinat Qurtuba: Islamization and Suburban Development through Minor Religious Spaces. Pap. Inst. Archaeol. 2015, 25. [Google Scholar] [CrossRef]
- Nitoslawski, S.; Duinker, P. Managing Tree Diversity: A Comparison of Suburban Development in Two Canadian Cities. Forests 2016, 7, 119. [Google Scholar] [CrossRef]
- Louw, M.; Rust, F.; Bergh, A.; McKay, A. Development and Implementation of Ultrathin Concrete Road Technology for Suburban Streets in South Africa. Transp. Res. Rec. J. Transp. Res. Board 2011, 2205, 95–102. [Google Scholar] [CrossRef]
- Randolph, J. Environmental Land Use Planning and Management; Island Press: Washington, DC, USA, 2004. [Google Scholar]
- Jacobs, J. The Death and Life of Great American Cities, 50th ed.; Modern Library: New York, NY, USA, 2011. [Google Scholar]
- Kenna, T.; Stevenson, D. Experiences of “Community” in a Gated Residential Estate: “Community” in a Gated Residential Estate. Geogr. Res. 2013, 51, 412–423. [Google Scholar] [CrossRef]
- Le Goix, R.; Vesselinov, E. Gated Communities and House Prices: Suburban Change in Southern California, 1980–2008: Gated communities and house prices in southern California. Int. J. Urban Reg. Res. 2013, 37, 2129–2151. [Google Scholar] [CrossRef] [Green Version]
- Le Goix, R.; Webster, C. Gated Communities. Geogr. Compass 2008. [Google Scholar] [CrossRef] [Green Version]
- Smigiel, C. The production of segregated urban landscapes: A critical analysis of gated communities in Sofia. Cities 2013, 35, 125–135. [Google Scholar] [CrossRef]
- U.S. Green Building Council (USGBC). LEED-ND Version 4; USGBC: Washington, DC, USA, 2014. [Google Scholar]
- Xu, M.; Yang, Z. Theoretical debate on gated communities: Genesis, controversies, and the way forward. Urban Des. Int. 2008, 13, 213–226. [Google Scholar] [CrossRef]
- Whyte, W.H. Cluster Development; American Conservation Association: New York, NY, USA, 1964. [Google Scholar]
- Whyte, W.H. The Last Landscape; Anchor Books Edition; Doubleday & Company, Inc.: Garden City, NY, USA, 1970. [Google Scholar]
- Cervero, R.; Kockelman, K. Travel demand and the 3Ds: Density, diversity, and design. Transp. Res. Part Transp. Environ. 1997, 2, 199–219. [Google Scholar] [CrossRef]
- Ewing, R.; Cervero, R. Travel and the Built Environment: A Meta-Analysis. J. Am. Plan. Assoc. 2010, 76, 265–294. [Google Scholar] [CrossRef]
- Handy, S.L.; Boarnet, M.G.; Ewing, R.; Killingsworth, R.E. How the built environment affects physical activity: Views from urban planning. Am. J. Prev. Med. 2002, 23, 64–73. [Google Scholar] [CrossRef]
- Zuniga-Teran, A.A. From Neighborhoods to Wellbeing and Conservation: Enhancing the Use of Greenspace through Walkability; University of Arizonay: Tucson, AZ, USA, 2015. [Google Scholar]
- Cerin, E.; Conway, T.L.; Cain, K.L.; Kerr, J.; De Bourdeaudhuij, I.; Owen, N.; Reis, R.S.; Sarmiento, O.L.; Hinckson, E.A.; Salvo, D.; et al. Sharing good NEWS across the world: Developing comparable scores across 12 countries for the neighborhood environment walkability scale (NEWS). BMC Public Health 2013, 13, 309. [Google Scholar] [CrossRef] [PubMed] [Green Version]
- Cerin, E.; Saelens, B.E.; Sallis, J.F.; Frank, L.D. Neighborhood Environment Walkability Scale: Validity and Development of a Short Form. Med. Sci. Sports Exerc. 2006, 38, 1682–1691. [Google Scholar] [CrossRef] [PubMed]
- Frank, L.D.; Sallis, J.F.; Saelens, B.E.; Leary, L.; Cain, K.; Conway, T.L.; Hess, P.M. The development of a walkability index: Application to the Neighborhood Quality of Life Study. Br. J. Sports Med. 2009, 44, 924–933. [Google Scholar] [CrossRef] [PubMed]
- Giles-Corti, B.; Timperio, A.; Bull, F.; Pikora, T. Understanding physical activity environmental correlates: Increased specificity for ecological models. Exerc. Sport Sci. Rev. 2005, 33, 175–181. [Google Scholar] [CrossRef] [PubMed]
- Massengale, J.; Dover, V. Street Design: The Secret to Great Cities and Towns; John Wiley & Sons, Inc.: Hoboken, NJ, USA, 2014. [Google Scholar]
- Speck, J. Walkable City: How Downtown Can Save America One Step at a Time; Farrar, Straus & Giroux: New York, NY, USA, 2012. [Google Scholar]
- Zuniga-Teran, A.A.; Orr, B.J.; Gimblett, R.H.; Chalfoun, N.V.; Marsh, S.E.; Guertin, D.P.; Going, S.B. Designing healthy communities: Testing the walkability model. Front. Archit. Res. 2017. [Google Scholar] [CrossRef]
- Saelens, B.E.; Handy, S.L. Built Environment Correlates of Walking. Med. Sci. Sports Exerc. 2008, 40 (Suppl. 7), S550–S566. [Google Scholar] [CrossRef] [PubMed]
- Spinney, J.; Millward, H.; Scott, D. Walking for Transport versus Recreation: A Comparison of Participants, Timing, and Locations. J. Phys. Act. Health 2012, 9, 153–162. [Google Scholar] [CrossRef] [PubMed]
- Hartig, T.; Mitchell, R.; de Vries, S.; Frumkin, H. Nature and Health. Annu. Rev. Public Health 2014, 35, 207–228. [Google Scholar] [CrossRef] [PubMed]
- World Health Organization (WHO). Definition of Health. 1948. Available online: http://www.who.int/about/definition/en/print.html (accessed on 30 January 2015).
- Jackson, R. Preface. In Making Healthy Places Designing and Building for Health, Well-Being, and Sustainability; Dannenberg, A., Frumkin, H., Jackson, R., Eds.; Island Press: Washington, DC, USA, 2011; p. 418. [Google Scholar]
- Sallis, J.F.; Millstein, R.A.; Carlson, J. Community Design for Physical Activity. In Making Healthy Places: Designing and Building for Health, Well-Being, and Sustainability; Dannenberg, A., Frumkin, H., Jackson, R., Eds.; Island Press: Washington, DC, USA, 2011. [Google Scholar]
- Jackson, L.E. The relationship of urban design to human health and condition. Landsc. Urban Plan. 2003, 64, 191–200. [Google Scholar] [CrossRef]
- Taylor, M.S.; Wheeler, B.W.; White, M.P.; Economou, T.; Osborne, N.J. Research note: Urban street tree density and antidepressant prescription rates—A cross-sectional study in London, UK. Landsc. Urban Plan. 2015, 136, 174–179. [Google Scholar] [CrossRef]
- Nowak, D.J.; Hirabayashi, S.; Bodine, A.; Greenfield, E. Tree and forest effects on air quality and human health in the United States. Environ. Pollut. 2014, 193, 119–129. [Google Scholar] [CrossRef] [PubMed]
- Donovan, G.H.; Prestemon, J.P. The Effect of Trees on Crime in Portland, Oregon. Environ. Behav. 2012, 44, 3–30. [Google Scholar] [CrossRef]
- Pretty, J.; Peacock, J.; Sellens, M.; Griffin, M. The mental and physical health outcomes of green exercise. Int. J. Environ. Health Res. 2005, 15, 319–337. [Google Scholar] [CrossRef] [PubMed]
- Sandifer, P.A.; Sutton-Grier, A.E.; Ward, B.P. Exploring connections among nature, biodiversity, ecosystem services, and human health and well-being: Opportunities to enhance health and biodiversity conservation. Ecosyst. Serv. 2015, 12, 1–15. [Google Scholar] [CrossRef]
- Craig, C.L.; Marshall, A.L.; Sjostrom, M.; Bauman, A.E.; Booth, M.L.; Ainsworth, B.E.; Pratt, M.; Ekelund, U.; Yngve, A.; Sallis, J.F.; et al. International Physical Activity Questionnaire: 12-Country Reliability and Validity. Med. Sci. Sports Exerc. 2003, 35, 1381–1395. [Google Scholar] [CrossRef] [PubMed]
- Ware, J.E., Jr.; Kosinski, M.; Keller, S.D. A 12-Item Short-Form Health Survey: Construction of scales and preliminary tests of reliability and validity. Med. Care 1996, 34, 220–233. [Google Scholar] [CrossRef] [PubMed]
- Frank, L.; Ulmer, J.; Lerner, M. Enhancing Walk Score’s Ability to Predict Physical Activity and Active Transportation. In Proceedings of the Active Living Research Annual Conference, San Diego, CA, USA, 26–28 February 2013.
- Kim, Y.; Park, I.; Kang, M. Convergent validity of the International Physical Activity Questionnaire (IPAQ): Meta-analysis. Public Health Nutr. 2013, 16, 440–452. [Google Scholar] [CrossRef] [PubMed]
- Peugh, J.L. A practical guide to multilevel modeling. J. Sch. Psychol. 2010, 48, 85–112. [Google Scholar] [CrossRef] [PubMed]
- IBM SPSS Software. 2013. Available online: http://www-01.ibm.com/software/analytics/spss/ (accessed on 10 March 2015).
- Laguilles, J.S.; Williams, E.A.; Saunders, D.B. Can Lottery Incentives Boost Web Survey Response Rates? Findings from Four Experiments. Res. High. Educ. 2011, 52, 537–553. [Google Scholar] [CrossRef]
- Parsons, N.L.; Manierre, M.J. Investigating the Relationship among Prepaid Token Incentives, Response Rates, and Nonresponse Bias in a Web Survey. Field Methods 2014, 26, 191–204. [Google Scholar] [CrossRef]
- Porter, S.R.; Umbach, P.D. Student Survey Response Rates across Institutions: Why Do they Vary? Res. High. Educ. 2006, 47, 229–247. [Google Scholar] [CrossRef]
- Fleming, C.B.; Marchesini, G.; Elgin, J.; Haggerty, K.P.; Woodward, D.; Abbott, R.D.; Catalano, R.F. Use of Web and Phone Survey Modes to Gather Data from Adults about Their Young Adult Children: An Evaluation Based on a Randomized Design. Field Methods 2013, 25, 388–404. [Google Scholar] [CrossRef] [PubMed]
- Sullivan, D.A.; Stevens, S.A. Snowbirds: Seasonal Migrants to the Sunbelt. Res. Aging 1982, 4, 159–177. [Google Scholar] [CrossRef]
- Ambrey, C.L. Urban greenspace, physical activity and wellbeing: The moderating role of perceptions of neighbourhood affability and incivility. Land Use Policy 2016, 57, 638–644. [Google Scholar] [CrossRef]
- Honold, J.; Lakes, T.; Beyer, R.; van der Meer, E. Restoration in Urban Spaces Nature Views From Home, Greenways, and Public Parks. Environ. Behav. 2016, 48, 796–825. [Google Scholar] [CrossRef]
- Smiley, K.T.; Sharma, T.; Steinberg, A.; Hodges-Copple, S.; Jacobson, E.; Matveeva, L. More Inclusive Parks Planning: Park Quality and Preferences for Park Access and Amenities. Environ. Justice 2016, 9, 1–7. [Google Scholar] [CrossRef]
- Chaput, J.-P.; Dutil, C. Lack of sleep as a contributor to obesity in adolescents: Impacts on eating and activity behaviors. Int. J. Behav. Nutr. Phys. Act. 2016, 13, 103. [Google Scholar] [CrossRef] [PubMed]
- Hoying, J.; Melnyk, B.M. COPE: A Pilot Study with Urban-Dwelling Minority Sixth-Grade Youth to Improve Physical Activity and Mental Health Outcomes. J. Sch. Nurs. 2016, 32, 347–356. [Google Scholar] [CrossRef] [PubMed]
- Ellaway, A.; Morris, G.; Curtice, J.; Robertson, C.; Allardice, G.; Robertson, R. Associations between health and different types of environmental incivility: A Scotland-wide study. Public Health 2009, 123, 708–713. [Google Scholar] [CrossRef] [PubMed] [Green Version]
- Foster, S.; Knuiman, M.; Villanueva, K.; Wood, L.; Christian, H.; Giles-Corti, B. Does walkable neighbourhood design influence the association between objective crime and walking? Int. J. Behav. Nutr. Phys. Act. 2014, 11, 100. [Google Scholar] [CrossRef] [PubMed]
- Wolfe, M.K.; Mennis, J. Does vegetation encourage or suppress urban crime? Evidence from Philadelphia, PA. Landsc. Urban Plan. 2012, 108, 112–122. [Google Scholar] [CrossRef]

| Recruitment Method | Traditional | Suburbs | Enclosed | Cluster | Total |
|---|---|---|---|---|---|
| Online | 189 (87.5%) | 40 (54.8%) | 17 (37.0%) | 3 (6.7%) | 249 (65.5%) |
| Park | 26 (12.0%) | 31 (42.5%) | 24 (52.2%) | 7 (15.6%) | 88 (23.2%) |
| 1 (0.5%) | 2 (2.7%) | 5 (10.9%) | 35 (77.8%) | 43 (11.3%) | |
| Total | 216 (100.0%) | 73 (100.0%) | 46 (100.0%) | 45 (100.0%) | 380 (100.0%) |
| Demographic Variables | Cohorts | Traditional | Suburbs | Enclosed | Cluster | Total |
|---|---|---|---|---|---|---|
| Age | 18–29 | 12 (5.8) | 3 (4.3) | 3 (6.5) | 2 (4.4) | 20 (5.5) |
| 30–39 | 21 (10.2) | 4 (5.8) | 7 (15.2) | 0 (0.0) | 32 (8.7) | |
| 40–49 | 38 (18.4) | 10 (14.5) | 6 (13.0) | 2 (3.6) | 56 (15.3) | |
| 50–59 | 46 (22.3) | 18 (26.1) | 18 (39.1) | 6 (13.3) | 88 (24.0) | |
| 60–69 | 62 (30.1) | 15 (21.7) | 6 (13.0) | 17 (37.8) | 100 (27.3) | |
| 70 or more | 27 (13.1) | 19 (27.5) | 6 (13.0) | 18 (40.0) | 70 (19.1) | |
| Total | 206 (100.0) | 69 (100.0) | 46 (100.0) | 45 (100.0) | 366 (100.0) | |
| Gender | Male | 76 (37.6) | 22 (33.3) | 15 (32.6) | 19 (43.2) | 132 (36.9) |
| Female | 126 (62.4) | 44 (66.7) | 31 (67.4) | 25 (56.8) | 226 (63.1) | |
| Total | 202 (100.0) | 66 (100.0) | 46 (100.0) | 44 (100.0) | 358 (100.0) | |
| Race/ethnicity | Native American | 3 (1.5) | 0 (0.0) | 1 (2.2) | 0 (0.0) | 4 (1.1) |
| Asian | 1 (0.5) | 1 (1.5) | 1 (2.2) | 2 (4.8) | 5 (1.4) | |
| Hispanic | 14 (7.1) | 9 (13.4) | 6 (13.3) | 1 (2.4) | 30 (8.6) | |
| White | 176 (89.8) | 57 (85.1) | 35 (77.8) | 39 (92.9) | 307 (87.7) | |
| 2 or more | 2 (1.0) | 0 (0.0) | 2 (4.4) | 0 (0.0) | 4 (1.1) | |
| Total | 196 (100.0) | 67 (100.0) | 45 (100.0) | 42 (100.0) | 350 (100.0) | |
| Income (in U.S. dollars) | $30,000 or less | 56 (28.4) | 10 (16.1) | 2 (4.4) | 1 (2.4) | 69 (20.0) |
| $30,001 to $59,000 | 65 (33.0) | 18 (29.0) | 16 (35.6) | 10 (24.4) | 109 (31.6) | |
| $60,000 or more | 76 (38.6) | 34 (54.8) | 27 (60.0) | 30 (73.2) | 167 (48.4) | |
| Total | 197 (100.0) | 62 (100.0) | 45 (100.0) | 41 (100.0) | 345 (100.0) | |
| Education | High School | 14 (6.9) | 5 (7.4) | 1 (2.2) | 0 (0.0) | 20 (5.5) |
| Professional School | 8 (3.9) | 3 (4.4) | 3 (6.5) | 2 (4.4) | 16 (4.4) | |
| University/College | 91 (44.8) | 32 (47.1) | 24 (52.2) | 21 (46.7) | 169 (46.7) | |
| Master’s /PhD | 90 (44.3) | 28 (41.2) | 18 (39.1) | 21 (46.7) | 157 (43.4) |
| Neighborhood Design Types | Questions | p Value | Answer Options | Traditional (%) | Suburbs (%) | Enclosed (%) | Cluster (%) |
|---|---|---|---|---|---|---|---|
| All designs | Age of home | <0.001 | On or before 1950s | 66.8 | 31.4 | 8.7 | 2.2 |
| Between 1960s and 1980s | 19.2 | 45.7 | 37.0 | 80.4 | |||
| On 1990s or later | 13.5 | 21.4 | 52.2 | 9.5 | |||
| Don’t know | 0.5 | 1.4 | 2.2 | 2.2 | |||
| Traditional development | Neighborhood has alleys | <0.001 | Yes | 52.7 | 15.7 | 4.3 | 8.7 |
| No | 40.3 | 84.3 | 95.7 | 91.3 | |||
| Back alleys serve most garages | <0.001 | Yes | 31.7 | 4.3 | 6.5 | 6.5 | |
| No | 168.3 | 95.7 | 14.8 | 93.5 | |||
| Most dwellings have front porches | <0.001 | Yes | 66.2 | 44.3 | 46.7 | 33.3 | |
| No | 33.8 | 55.7 | 53.3 | 66.7 | |||
| Suburban development | How common are detached single-family | <0.001 | None | 0.5 | 2.7 | 10.9 | 13.3 |
| A few | 2.3 | 1.4 | 6.5 | 37.8 | |||
| Some | 11.2 | 9.6 | 15.2 | 24.4 | |||
| Most | 68.4 | 26.0 | 21.7 | 15.6 | |||
| All | 35.5 | 60.3 | 45.7 | 8.9 | |||
| Neighborhood has many cul-de-sacs | <0.001 | Yes | 12.7 | 87.1 | 81.8 | 59.1 | |
| No | 87.3 | 12.9 | 18.2 | 40.9 | |||
| Enclosed community | Gates | <0.001 | Yes | 2.4 | 7.4 | 37.0 | 4.4 |
| No | 97.6 | 92.6 | 63.0 | 95.6 | |||
| Fences | <0.001 | Yes | 4.8 | 16.2 | 55.6 | 9.1 | |
| No | 95.2 | 83.8 | 44.4 | 90.9 | |||
| Cluster housing | How common are townhouses | <0.001 | None | 32.2 | 56.3 | 45.7 | 6.7 |
| A few | 36.6 | 14.1 | 10.9 | 8.9 | |||
| Some | 27.3 | 21.1 | 26.1 | 15.6 | |||
| Most | 3.4 | 8.5 | 13.0 | 46.7 | |||
| All | 0.5 | 0.0 | 4.3 | 22.2 | |||
| Shared facilities | <0.001 | Yes | 19.1 | 35.3 | 44.4 | 77.8 | |
| No | 80.9 | 64.7 | 55.6 | 22.2 | |||
| Greenspace in close proximity | 0.513 | Yes | 70.4 | 67.1 | 65.2 | 78.3 | |
| No | 29.6 | 32.9 | 34.8 | 21.7 |
| Dependent Variables with Potential Bias | Significance | Variance (%) |
|---|---|---|
| Physical activity | 0.456 | 4.92 |
| Walking for recreation | 0.593 | 6.36 |
| Walking for transportation | 0.409 | 6.70 |
| Wellbeing | 0.774 | 0.47 |
| Physical health | 0.523 | 3.22 |
| Mental health | 0.606 | 1.36 |
| Social health a | - | 0.00 |
| Perceived crime | 0.365 | 11.73 |
| Social interaction with neighbors | 0.366 | 12.74 |
| Sociodemographic Variables with Potential Bias | Dependent Variable | Significance | Variance (%) |
|---|---|---|---|
| Age | Physical activity | 0.244 | 4.56 |
| ● Walking for recreation | 0.231 | 4.93 | |
| ● Walking for transportation | 0.662 | 0.69 | |
| Wellbeing | 0.302 | 3.47 | |
| ● Physical health | 0.172 | 10.88 | |
| ● Mental health | 0.445 | 3.08 | |
| ● Social health | 0.503 | 0.15 | |
| Perceived crime | 0.434 | 1.69 | |
| Social interaction with neighbors | 0.201 | 13.25 | |
| Income | Physical activity | 0.644 | 7.6 |
| ● Walking for recreation | 0.534 | 1.36 | |
| ● Walking for transportation | 0.797 | 0.50 | |
| Wellbeing | 0.560 | 1.68 | |
| ● Physical health | 0.609 | 1.02 | |
| ● Mental health | 0.800 | 0.39 | |
| ● Social health | 0.704 | 0.85 | |
| Perceived crime | 0.441 | 3.24 | |
| Social interaction with neighbors | 0.440 | 2.62 |
| Walkability Categories | R | p | Traditional | Suburbs | Enclosed | Cluster |
|---|---|---|---|---|---|---|
| Connectivity | 0.377 | <0.001 | 0.79 | 0.65 | 0.60 | 0.67 |
| Density | 0.130 | <0.001 | 0.50 | 0.42 | 0.51 | 0.67 |
| Land-use | 0.277 | <0.001 | 0.56 | 0.37 | 0.39 | 0.15 |
| Traffic safety | 0.142 | <0.001 | 0.65 | 0.52 | 0.62 | 0.57 |
| Surveillance | 0.283 | <0.001 | 0.69 | 0.52 | 0.55 | 0.53 |
| Experience | 0.113 | <0.001 | 0.68 | 0.74 | 0.74 | 0.78 |
| Greenspace | 0.024 | 0.028 | 0.76 | 0.69 | 0.71 | 0.68 |
| Community | 0.206 | <0.001 | 0.73 | 0.65 | 0.62 | 0.44 |
| Walkability Index * | 0.252 | <0.001 | 0.79 | 0.67 | 0.71 | 0.67 |
| Dependent Variables | R | p | Traditional | Suburbs | Enclosed | Cluster |
|---|---|---|---|---|---|---|
| Physical activity | 0.052 | 0.019 | 0.521 | 0.416 | 0.456 | 0.434 |
| Walking for recreation | 0.023 | 0.049 | 0.508 | 0.400 | 0.479 | 0.466 |
| Walking for transportation | 0.088 | <0.001 | 0.464 | 0.390 | 0.348 | 0.362 |
| Dependent Variables | R | p | Traditional | Suburbs | Enclosed | Cluster |
|---|---|---|---|---|---|---|
| Wellbeing | 0.023 | 0.045 | 0.822 | 0.859 | 0.839 | 0.832 |
| Physical Health | 0.009 | 0.677 | 0.898 | 0.919 | 0.916 | 0.894 |
| Mental Health | 0.058 | <0.001 | 0.764 | 0.830 | 0.779 | 0.822 |
| Social Health | 0.005 | 0.601 | 0.800 | 0.808 | 0.812 | 0.775 |
| Perceived safety from crime | 0.125 | <0.001 | 3.085 | 3.431 | 3.333 | 3.733 |
| Walkability Category Tested with Perceived Crime | R | p |
|---|---|---|
| Connectivity | 0.069 | 0.264 |
| Density | 0.049 | 0.025 |
| Land-use | 0.146 | 0.209 |
| Traffic safety | 0.087 | 0.041 |
| Surveillance | 0.087 | 0.060 |
| Experience | 0.255 | <0.001 |
| Greenspace | 0.012 | 0.183 |
| Community | 0.057 | 0.541 |
| Walkability Index * | 0.210 | 0.369 |
| Variables Tested with Perceived Presence of Trees | R | p |
|---|---|---|
| Physical activity | 0.056 | 0.001 |
| Walking for transportation | 0.006 | 0.743 |
| Walking for recreation | 0.376 | <0.001 |
| Social interactions with neighbors | 0.674 | <0.001 |
| Perceived crime | 0.051 | 0.046 |
| Physical Health Index | 0.009 | 0.448 |
| Mental Health Index | 0.018 | 0.100 |
| Social Health Index | 0.026 | 0.043 |
| Wellbeing Index | 0.020 | 0.093 |
| Variables | r | p |
|---|---|---|
| Wellbeing | 0.205 | <0.001 |
| Physical Health | 0.184 | 0.001 |
| Mental Health | 0.022 | 0.552 |
| Social Health | 0.260 | < 0.001 |
© 2017 by the authors; licensee MDPI, Basel, Switzerland. This article is an open access article distributed under the terms and conditions of the Creative Commons Attribution (CC-BY) license (http://creativecommons.org/licenses/by/4.0/).
Share and Cite
Zuniga-Teran, A.A.; Orr, B.J.; Gimblett, R.H.; Chalfoun, N.V.; Guertin, D.P.; Marsh, S.E. Neighborhood Design, Physical Activity, and Wellbeing: Applying the Walkability Model. Int. J. Environ. Res. Public Health 2017, 14, 76. https://doi.org/10.3390/ijerph14010076
Zuniga-Teran AA, Orr BJ, Gimblett RH, Chalfoun NV, Guertin DP, Marsh SE. Neighborhood Design, Physical Activity, and Wellbeing: Applying the Walkability Model. International Journal of Environmental Research and Public Health. 2017; 14(1):76. https://doi.org/10.3390/ijerph14010076
Chicago/Turabian StyleZuniga-Teran, Adriana A., Barron J. Orr, Randy H. Gimblett, Nader V. Chalfoun, David P. Guertin, and Stuart E. Marsh. 2017. "Neighborhood Design, Physical Activity, and Wellbeing: Applying the Walkability Model" International Journal of Environmental Research and Public Health 14, no. 1: 76. https://doi.org/10.3390/ijerph14010076