Article

Distribution Characteristics and Risk Assessment of Polycyclic Aromatic Hydrocarbons in the Momoge Wetland, China

1
State Environmental Protection Key Laboratory of Wetland Ecology and Vegetation Restoration, School of Environment, Northeast Normal University, Changchun 130117, China
2
Educational Development Research Center, Jilin Provincial Institute of Education, Changchun 130022, China
*
Authors to whom correspondence should be addressed.
Int. J. Environ. Res. Public Health 2017, 14(1), 85; https://doi.org/10.3390/ijerph14010085
Submission received: 17 November 2016 / Revised: 10 January 2017 / Accepted: 12 January 2017 / Published: 18 January 2017
(This article belongs to the Special Issue Environmental Pollution and Human Health Risk)

Abstract

:
The Momoge Nature Reserve is the research object of this study. Through field sampling, laboratory experiments and analysis, the contents, distribution characteristics, source identification, pollution levels and risk levels of polycyclic aromatic hydrocarbons (PAHs) in wetland soils were studied. The results show that the sum content of 16 types of PAHs (Σ16 PAH) in the wetland soil was within the range (0.029–0.4152) mg/kg. PAHs in wetland soil are primarily 2–3-rings PAHs. PAHs in the Momoge wetland soil have multiple sources: petroleum, combustion of petroleum and coal, and others, of which petroleum and the sum of combustion of petroleum and coal account for 38.0% and 59.3%, respectively. Research, using the standard index and pollution range methods, shows that the content of the PAH labelled Nap, found in the Momoge wetland soil, is excessive; some sampling sites exhibit a low level of pollution. The result of a biotoxicity assessment shows that there are two sampling sites that occasionally present an ecological toxicity hazard. The result of the organic carbon normalization process shows that an ecological risk exists only at sampling site No. 10.

1. Introduction

Wetlands are one of the most abundant and biodiverse ecological landscapes in the natural world. Wetlands have irreplaceable functions in the conservation of water and soil, water purification, stabilizing the environment, the protection of genetic diversity, and resource utilization among others [1]. The second national wetland resource survey organized by the State Forestry Administration of China showed that 96% of the available fresh water resources in China were stored in wetlands [2]. In recent decades, concomitant with the rapid and intensive development of industrialization in China, urbanization and globalization led to increased human disturbances such as sewage discharge, oil exploitation, agricultural irrigation, and smelting. These resulted in wetland reduction and simultaneous pollution of various types and increasing quantities in the wetland soil, water bodies, and sediments [3,4]. Because wetlands generally occupy low-lying areas, large amounts of pollutants produced by environmental transition and human activities are collected in wetlands, which have become one of the final destinations for heavy metals, organic pollutants, and other refractory pollutants [5].
Polycyclic aromatic hydrocarbons (PAHs) compounds are persistent organic pollutants that exist in the environment [6]. In 1976, the United States Environmental Protection Agency (US EPA) listed 16 PAHs as toxic organic pollutants [7]. PAHs in wetland soil and sediments can be transported into the biosphere through animal and plant respiration, absorption, ingestion and some other approaches. Therefore, they can accumulate in living bodies, causing harm to many organisms and entering human bodies through the food chain, resulting in a threat to human health [8].
Sustainability of environmental systems largely depends on a sound soil ecosystem. Changes will occur in ecosystems if soils are polluted. PAHs can remain in the environment for years. Even if the sources of PAHs are removed, residual PAHs may also pose long-term risks to the environmental system. Thus, PAHs accumulated in soil have attracted more attention because of the potential risk and adverse impact they cause in soil ecosystems.
In wetland environments, PAHs in wetland soil can be transferred to the atmosphere through particulate matter. Hence, PAHs can easily enter living bodies through ingestion, breathing, skin exposure and other approaches. This can result in the damage of living bodies on a cellular level, such as damaging DNA, which will lead to mutation of microorganisms, animals and plants [9]. These effects will influence the health of creatures and much of this influence involves teratogenicity, carcinogenicity and mutagenicity. Ma et al. found that the content of PAHs in the Songhua river bottom sludge was greater than their content in river water. Freshwater mussels showed high PAH levels, and the PAH content in catfishes was higher than in mussels (lower in the food chain) [8]. In addition, materials derived from PAHs can also be harmful pollutants. It is worth mentioning that although some of the PAH derivatives exist only at trace levels in the environment, the toxicity they express is even greater than that of PAHs (already high). Therefore, they become highly toxic organic carcinogens [10]. As for the Momoge Wetland, existing research has mainly focused on the physical and chemical properties of the soil, ecosystem service functions, tourism development and biodiversity in the Momoge Wetland; moreover, these studies did not involve PAH content or ecological risk assessment. Because of the widespread concern about the environmental issues related to PAHs and the lack of information about PAHs, the Momoge Wetland was selected for this study.
In this study, a method combining source identification, pollution and ecological risk was used to carry out significant research on PAH distribution in the wetland soil and to provide risk assessment. This study was intended to lay a theoretical foundation for developing remediation for soil pollution and fully understanding the degree of environmental pollution in the area. The study also analyzed the extent to which the PAHs in the soil might cause risk to the environment, with the goal of warning relevant departments. There are important theoretical and real consequences of protecting wetland’s creatures and environment.

2. Materials and Methods
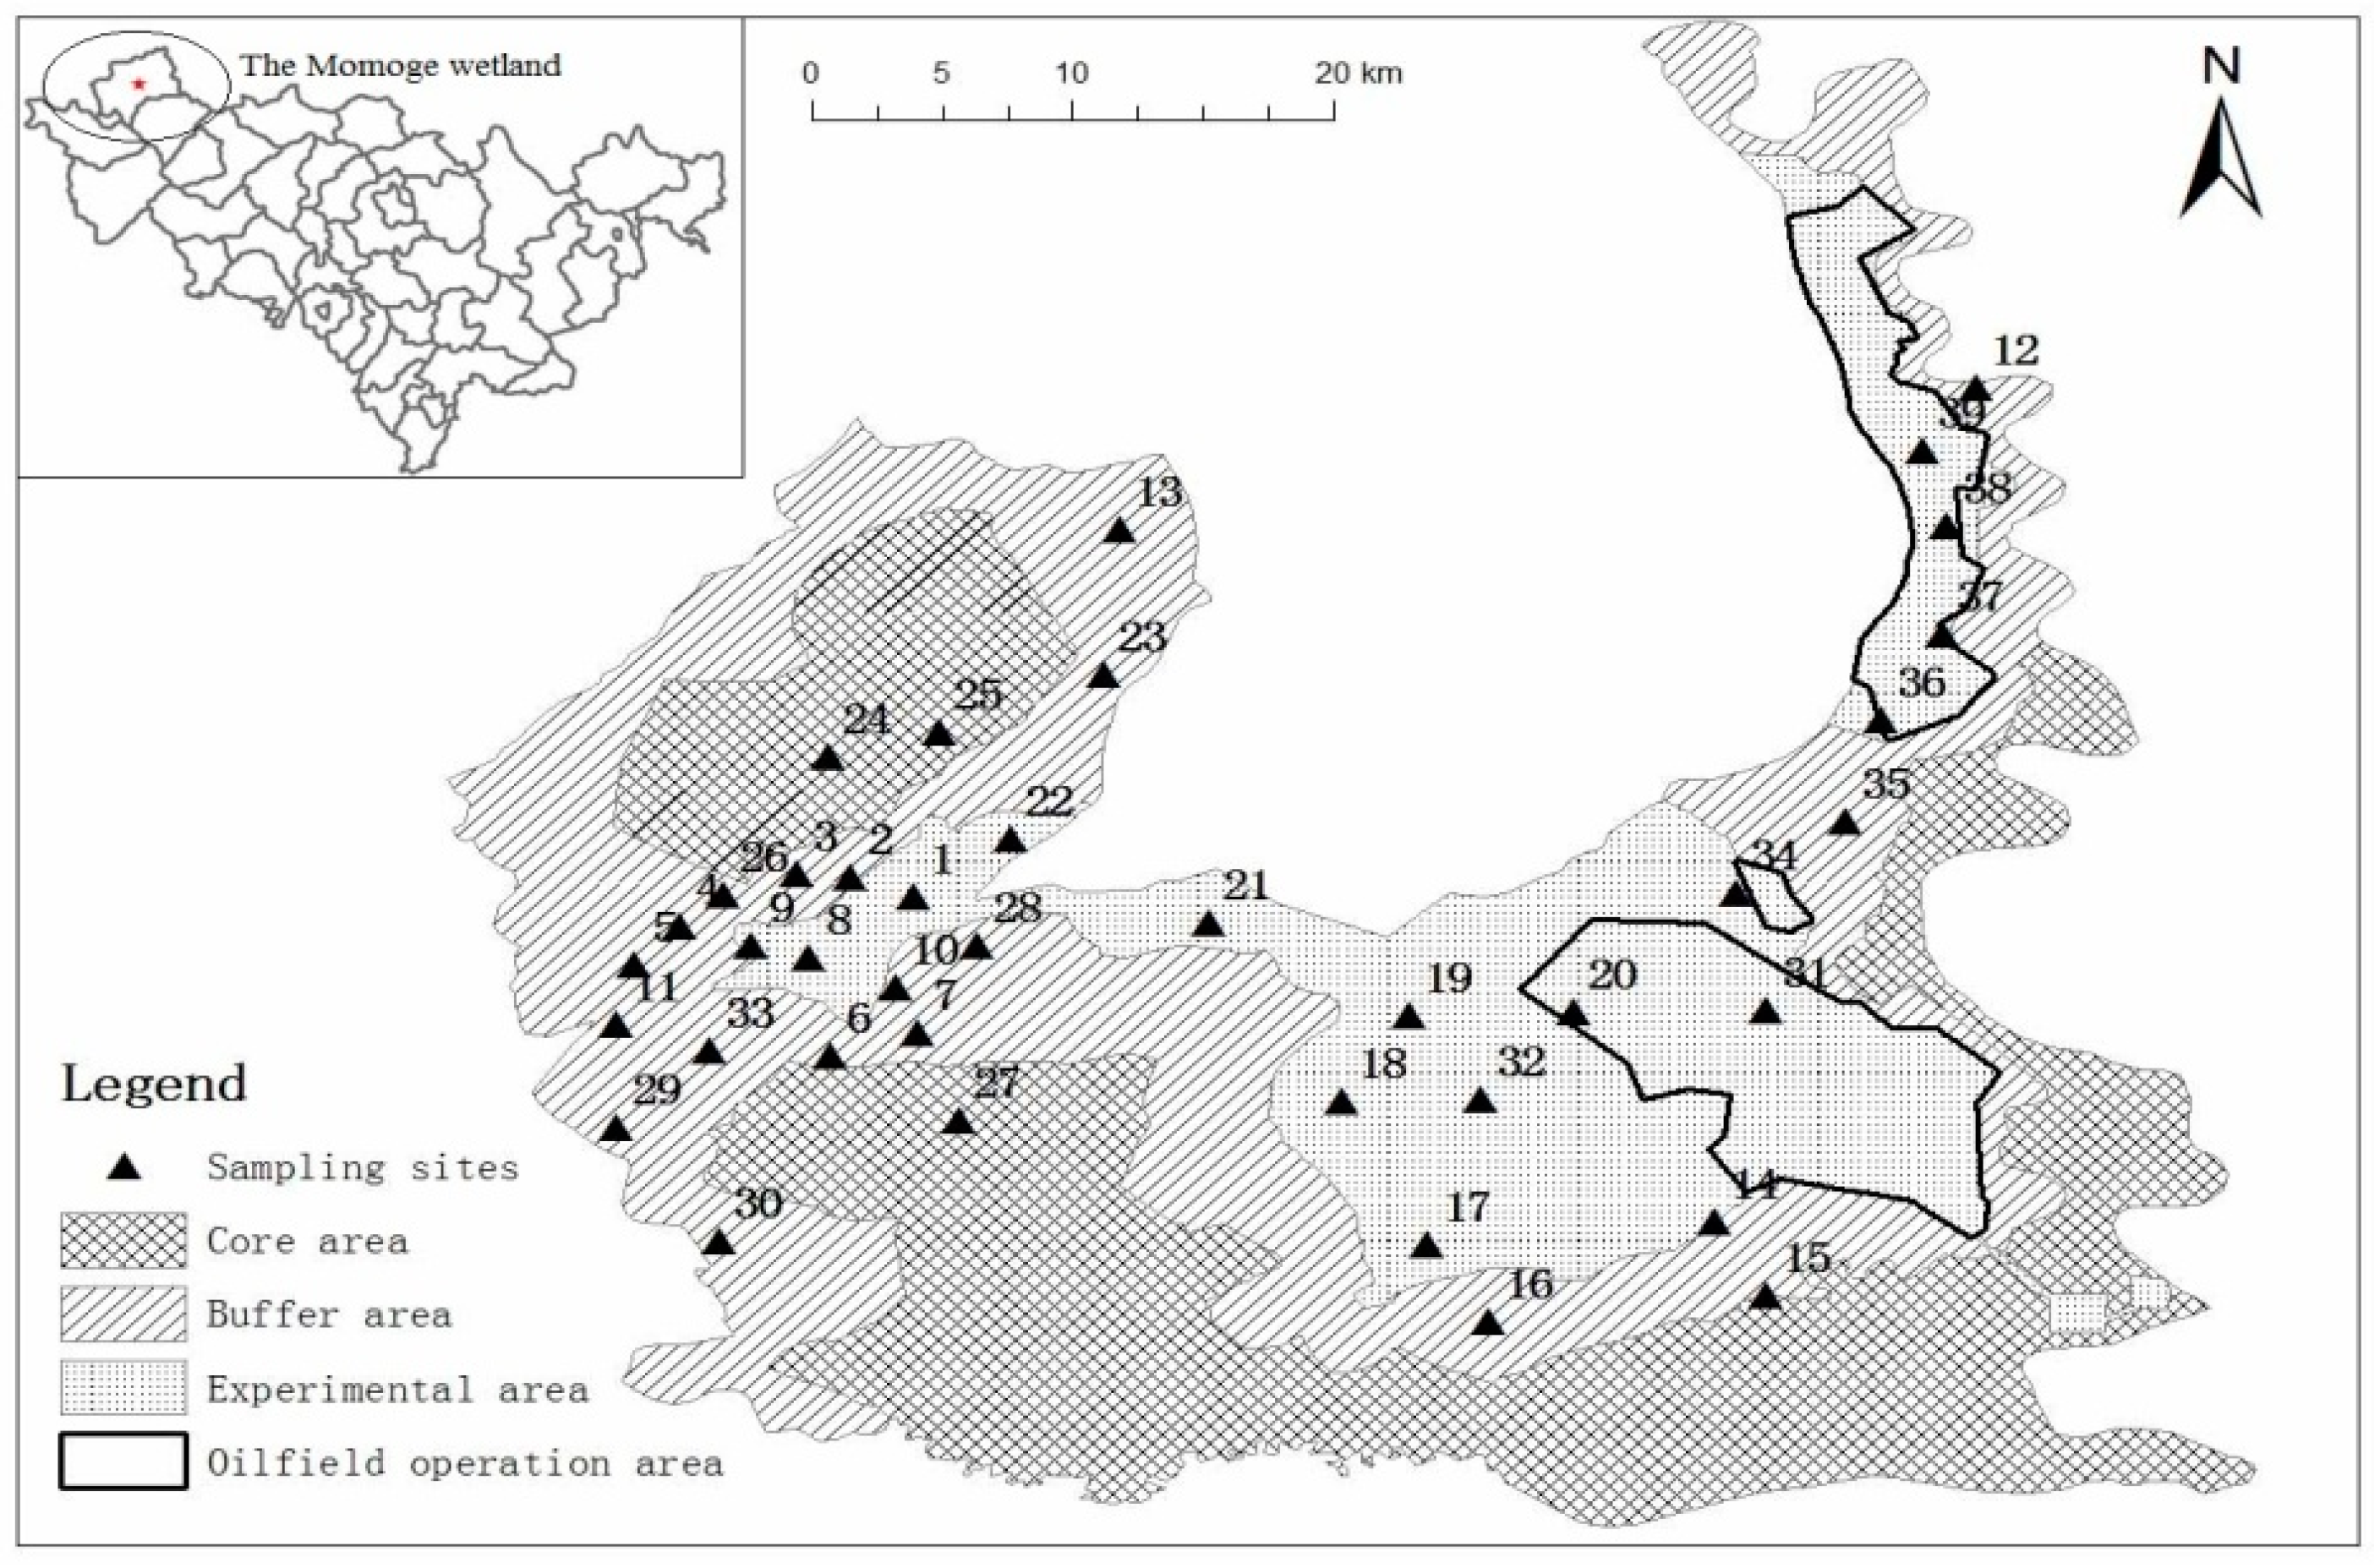
2.1. Study Area

The Momoge Nature Reserve (45°45′–46°10′ N, 122°27′–124°04′ E), located in Zhenlai County (west of Jilin Province, China) is a typical wetland protection area and is also the main migration path in the Chinese eastern region of northern migratory waterfowl birds. The total area of Momoge is 14 million hectares, and its natural wetland, which is an inland wetland, accounts for approximately 80% of the total area. The region is flat, and the relative elevation is only 2–10 m [11]. The dominant types of land-use are cultivated fields, grasslands and other land-use types. The main industry there is petroleum exploitation, which could lead to organic pollution. There are 15 species of cranes in the world, of which 6 are protected in the reserve (Grusleucogeranus, Grusjaponensis, Grusmonacha, Grusvipio, Grusgrus and Anthropoidesvirgo). There are two types of storks in the reserve: Ciconiaboyciana and Ciconianigra. Approximately 500–800 Ciconiaboyciana gather in the Momoge Wetland Reserve every fall, accounting for 1/3 of the world total. It is also a crane stopover. Many international organizations, such as World Wildlife Fund (WWF), Global Environment Facility (GEF) and International Crane Foundation (ICF) are particularly concerned about this area [12]. The Momoge Wetland provides the necessary breeding and stopover environments for rare birds and waterfowl such as Grusleucogeranus and Ciconiaboyciana. The protection zone has remarkable characteristics and a uniquely important value from the perspectives of biodiversity and habitat originality [13].

2.2. Collection and Preservation of Soil Samples

A total of 39 topsoil samples from the wetland were collected in November 2014. The sampling sites were roughly evenly distributed to represent the buffer zone and experimental area of the Momoge Wetland considering transport, environmental and security conditions. At each site, five sub-samples (depth of 0–10 cm, within range of 10 × 10 m; per the quincunx layout method) were collected and bulked together to form one composite sample. In the sampling process, a Global Positioning System (GPS) was used to accurately provide the location of each sampling point and the specific locations of the sample sites as shown in Figure 1.
Under dry, clean, and ventilated laboratory conditions (approximately 25 °C), the soil samples were put on white paper (2–3 cm thick), allowing them to naturally air dry (~1 week). During the air-drying process, small stones, plant root debris and other inclusions in the soil samples were carefully removed. After grinding the dry samples with a mortar, they were sieved to provide 60-mesh size particles, then sealed in lock bags and conserved in a refrigerator at 4 °C until analysis.

2.3. Laboratory Instruments and Reagents

HPLC-grade solvents (dichloromethane, acetone) were used in sample processing. A composite standard solution of 16 PAHs including naphthalene (Nap), acenaphthylene (Acl), acenaphthene (Ace), fluorene (Flu), phenanthrene (Phe), anthracene (Ant), fluoranthene (Fla), pyrene (Pyr), benz(a)]anthracene (BaA), chrysene (Chr), benzo(b)fluoranthene (BbF), benzo(k)fluoranthene (BkF), benzo(a)pyrene (BaP), indeno(1,2,3-cd)pyrene (Ind), dibenz(a,h)anthracene (Dah) and benzo(g,h,i)-perylene (Bghi) each at a concentration of 2000 mg·L−1. Phenol-d6; nitrobenzene-d5; 2-fluorobiphenyl and 2,4,6-tribromophenol were added as surrogates prior to extraction, and 2-fluorophenol, terphenyl-d14 and dibenzo-(a,h)anthracene-d14 were used as internal standards for analysis.
Samples were analyzed using a gas chromatograph (7890B, Agilent, Santa Clara, CA, USA) equipped with a 5977A mass spectrometer (GC-MS, Agilent, Santa Clara, CA, USA) and DB-5MS capillary column (30 m × 0.25 mm (i.d.) with 0.25 μm film thickness, Agilent, Santa Clara, CA, USA). A small sample extract (l µL) was injected in splitless mode with injector temperature was 300 °C. The oven temperature was programmed as follows: 45 °C for 2 min, then increase to 265 °C at a rate of 20 °C/min and ramped at 6 °C/min to 285 °C and increase at a rate of to 320 °C at 10 °C/min. The carrier gas was high-purity helium (99.999%) at a flow of 1 mL·min−1. The MS was operated in electron impact mode at 70 eV with an ion source temperature of 230 °C.

2.4. Chemical Analysis of Soil Samples

Soil sample extraction and analysis were performed according to USEPA Method 3570 [14] and Method 8270D [15], with some modifications. In order to extract PAHs, approximately 20 g of soil sample dried for 3–4 h at (105 ± 5) °C with 10 g anhydrous sodium sulfate and 100 mL dichloromethane/acetone (1/1, v/v) was mixed with 50 µL 100 mg/L surrogates. The mixture was shocked for 2 h at a speed of (30 ± 2) r/min (28 hole reversing machine, Guohuangaoke, Beijing, China). The extracts were condensedusing a K-D concentrator (B type, shanghaihuake, Shanghai, China). The solvent was exchanged with dichloromethane, and further reduced to 1 mL before GC/MS analysis. The internal standards of 5 µL 200 mg/L were added prior to analysis using a GC-MS, for determination of the 16 PAHs.
The blanks, spiked blanks and duplicate samples were processed during the extraction and analysis procedures. The recovery efficiencies (Table 1) were checked by analysing blank samples (PAH concentration < 0.01 mg/kg) with 16 PAH standard samples, the use of which conforms to the EPA methods mentioned above. The coefficient of variation of PAH concentration in duplicates was less than 15%. In this study, the detection limit of PAHs in the soil was 0.01 mg/kg.

2.5. Data Analysis

Data were subjected to correlation analysis, a Kaiser-Meyer-Olkin (KMO)-Bartlett test of Sphericity, principal component analysis (PCA), and multiple linear regression (MLR) analysis using Microsoft Excel 2007 (Microsoft, Redmond, WA, USA) and SPSS 19.0 (SPSS Inc., Chicago, IL, USA). The chart in the paper was produced using SigmaPlot 12.5 (Systat Software Inc., San Jose, CA, USA).

2.6. Analysis and Evaluation Method

2.6.1. Sourceidentifications

The diagnostic ratios and receptor oriented models used to reveal the sources of PAHs in this paper are well known. In this paper, the diagnostic ratio method and PCA-MLR model, one of the receptor models, were used to evaluate the sources of PAHs in the Momoge Wetland soil samples [16].
For the diagnostic ratio method, low molecular weight (2–3 rings, LMW)/High molecular weight (≥4 rings, HMW), Ant/(Ant + Phe) or Ant/Phe, Fla/(Fla + Pyr) or Fla/Pyr, BaA/(BaA + Chr) or BaA/Chr, Ind/(Ind + Bghi) or Ind/Bghi and BaA/Bghiwere used [17,18]. The source is believed to be mainly from the combustion of coal, biomass or petroleum when the LMW/HMW ratio is <1. The source is considered to be mainly petroleum spills when the LMW/HMW ratio is >1. When the ratio of Ant/(Ant + Phe) is <0.1, a petroleum source is indicated. When the ratio is >0.1, a combustion source is considered primary. When the ratio of Fla/(Fla + Pyr) is <0.4, a petroleum source is indicated. When the ratio is >0.4 and <0.5, the source of the PAHs is considered mainly petroleum combustion. When the ratio is >0.5, PAHs mainly from coal and biomass combustion are indicated. When the ratio of BaA/(BaA + Chr) is <0.2, a mainly petroleum source is indicated. If the ratio is between 0.2 and 0.35, the source indicated is petroleum combustion. When the ratio is >0.35, the coal and biomass combustion make a greater contribution to the PAHs in the environment. When the ratio of Ind/(Ind + Bghi) is <0.2, the meaning is the same as that for BaA/(BaA + Chr), mainly petroleum sources are indicated. When the ratio is >0.5, the production of PAHs is caused by the combustion of coal and biomass. When the ratio is between the two, the main source is likely petroleum combustion. Finally, when the BaA/Bghi ratio is >0.9, coal and biomass combustion is an important source. If it is <0.9, the PAHs are mainly from gasoline and diesel combustion (i.e., a traffic emission source).
PCA is a multivariate statistical tool used to transform the original data set into a smaller one [19], and it has been proven that a PCA-MLR model can be a good method for analysing the source of PAHs [20,21]. The main steps in the use of PCA-MLR are as follows. First, the KMO-Bartlett test should be conducted before PCA, and if the p value > 0.6, it is suitable for PCA. The PCA was found appropriate for use with the data in this study. Next, the principal components with eigenvalues >1 were extracted by PCA, and the main factors, the properties of which can be used to identify sources to a certain extent, of each principal component were determined according to different factor loading. Then, the factors extracted by PCA and the content of PAHs were analysed by MLR to determine the contribution of each principal component. Finally, the source, and the contribution of each source, was determined.

2.6.2. Evaluation of Wetland Soil Pollution

Comparative analysis using environmental standards is used to evaluate the PAH pollution level. This was needed because there is no PAH standard value or background value for China. Because the PAH standard in The Netherlands is sound, the national standards of PAHs in soils by the Dutch government was used [22]. Through comparative analysis, the pollution status in this area of China was obtained.
In addition, the PAH pollution in soil was divided into four grades by the contamination interval method (proposed by Maliszewska-Kordybach, 1996) [23]. When the content of Σ16 PAHs is <0.2 mg/kg, no pollution is present. When Σ16 PAHs is >0.2 mg/kg and <0.6 mg/kg, the area is slightly polluted. When the Σ16 PAHs is >0.6 mg/kg and <1.0 mg/kg, the area is polluted; and when the value is >1.0 mg/kg, the area is heavily polluted.

2.6.3. Ecological Risk Assessment

The biological toxicity evaluation shows that the concentration of pollutants present will produce toxic effects on organisms, and in order to measure the magnitude of the toxicity, the effects range-low (ERL) and the effects range-median (ERM) were proposed [24]. When the pollutant concentration is lower than ERL, no toxic effects on biological toxicity are produced and the incidence of toxicity is 10%. When the pollutant concentration is higher than ERL, but lower than that of ERM, it will produce toxic effects on living organisms and the occurrence probability of toxicity is 10%–50%. When the concentration is >ERM, the toxicity (poisoning rate) is >50%, showing a strong toxic effect.
The organic carbon normalization method is a risk assessment criterion for the summing of organic carbon normalized concentration of 13 PAHs (Nap, Acl, Ace, Flu, Phe, Ant, Fla, Pyr, BaA, Chr, BbF, BkF and BaP). It was suggested by Swartz in 1999 [25]. It uses three indicators: the critical effect content (CEC), medium effect content (MEC) and extreme effect content (EEC) to assess the risk level. The concentrations of (0.29, 1.8 and 10) mg/kg were defined as the TEC, MEC and EEC value, respectively. The Σ13 PAH concentration measured at each sampling site was compared with the TEC, MEC and EEC values. If the Σ13 PAHs was <TEC, there was no ecological risk. If the Σ13 PAHs >TEC but <MEC, it is defined as accidental ecological risk. However, when the Σ13 PAHs is between MEC and EEC, there is high ecological risk, and when the Σ13 PAHs >EEC value, there is serious ecological risk.

3. Contents and Characteristics of PAHs in the Momoge Wetland

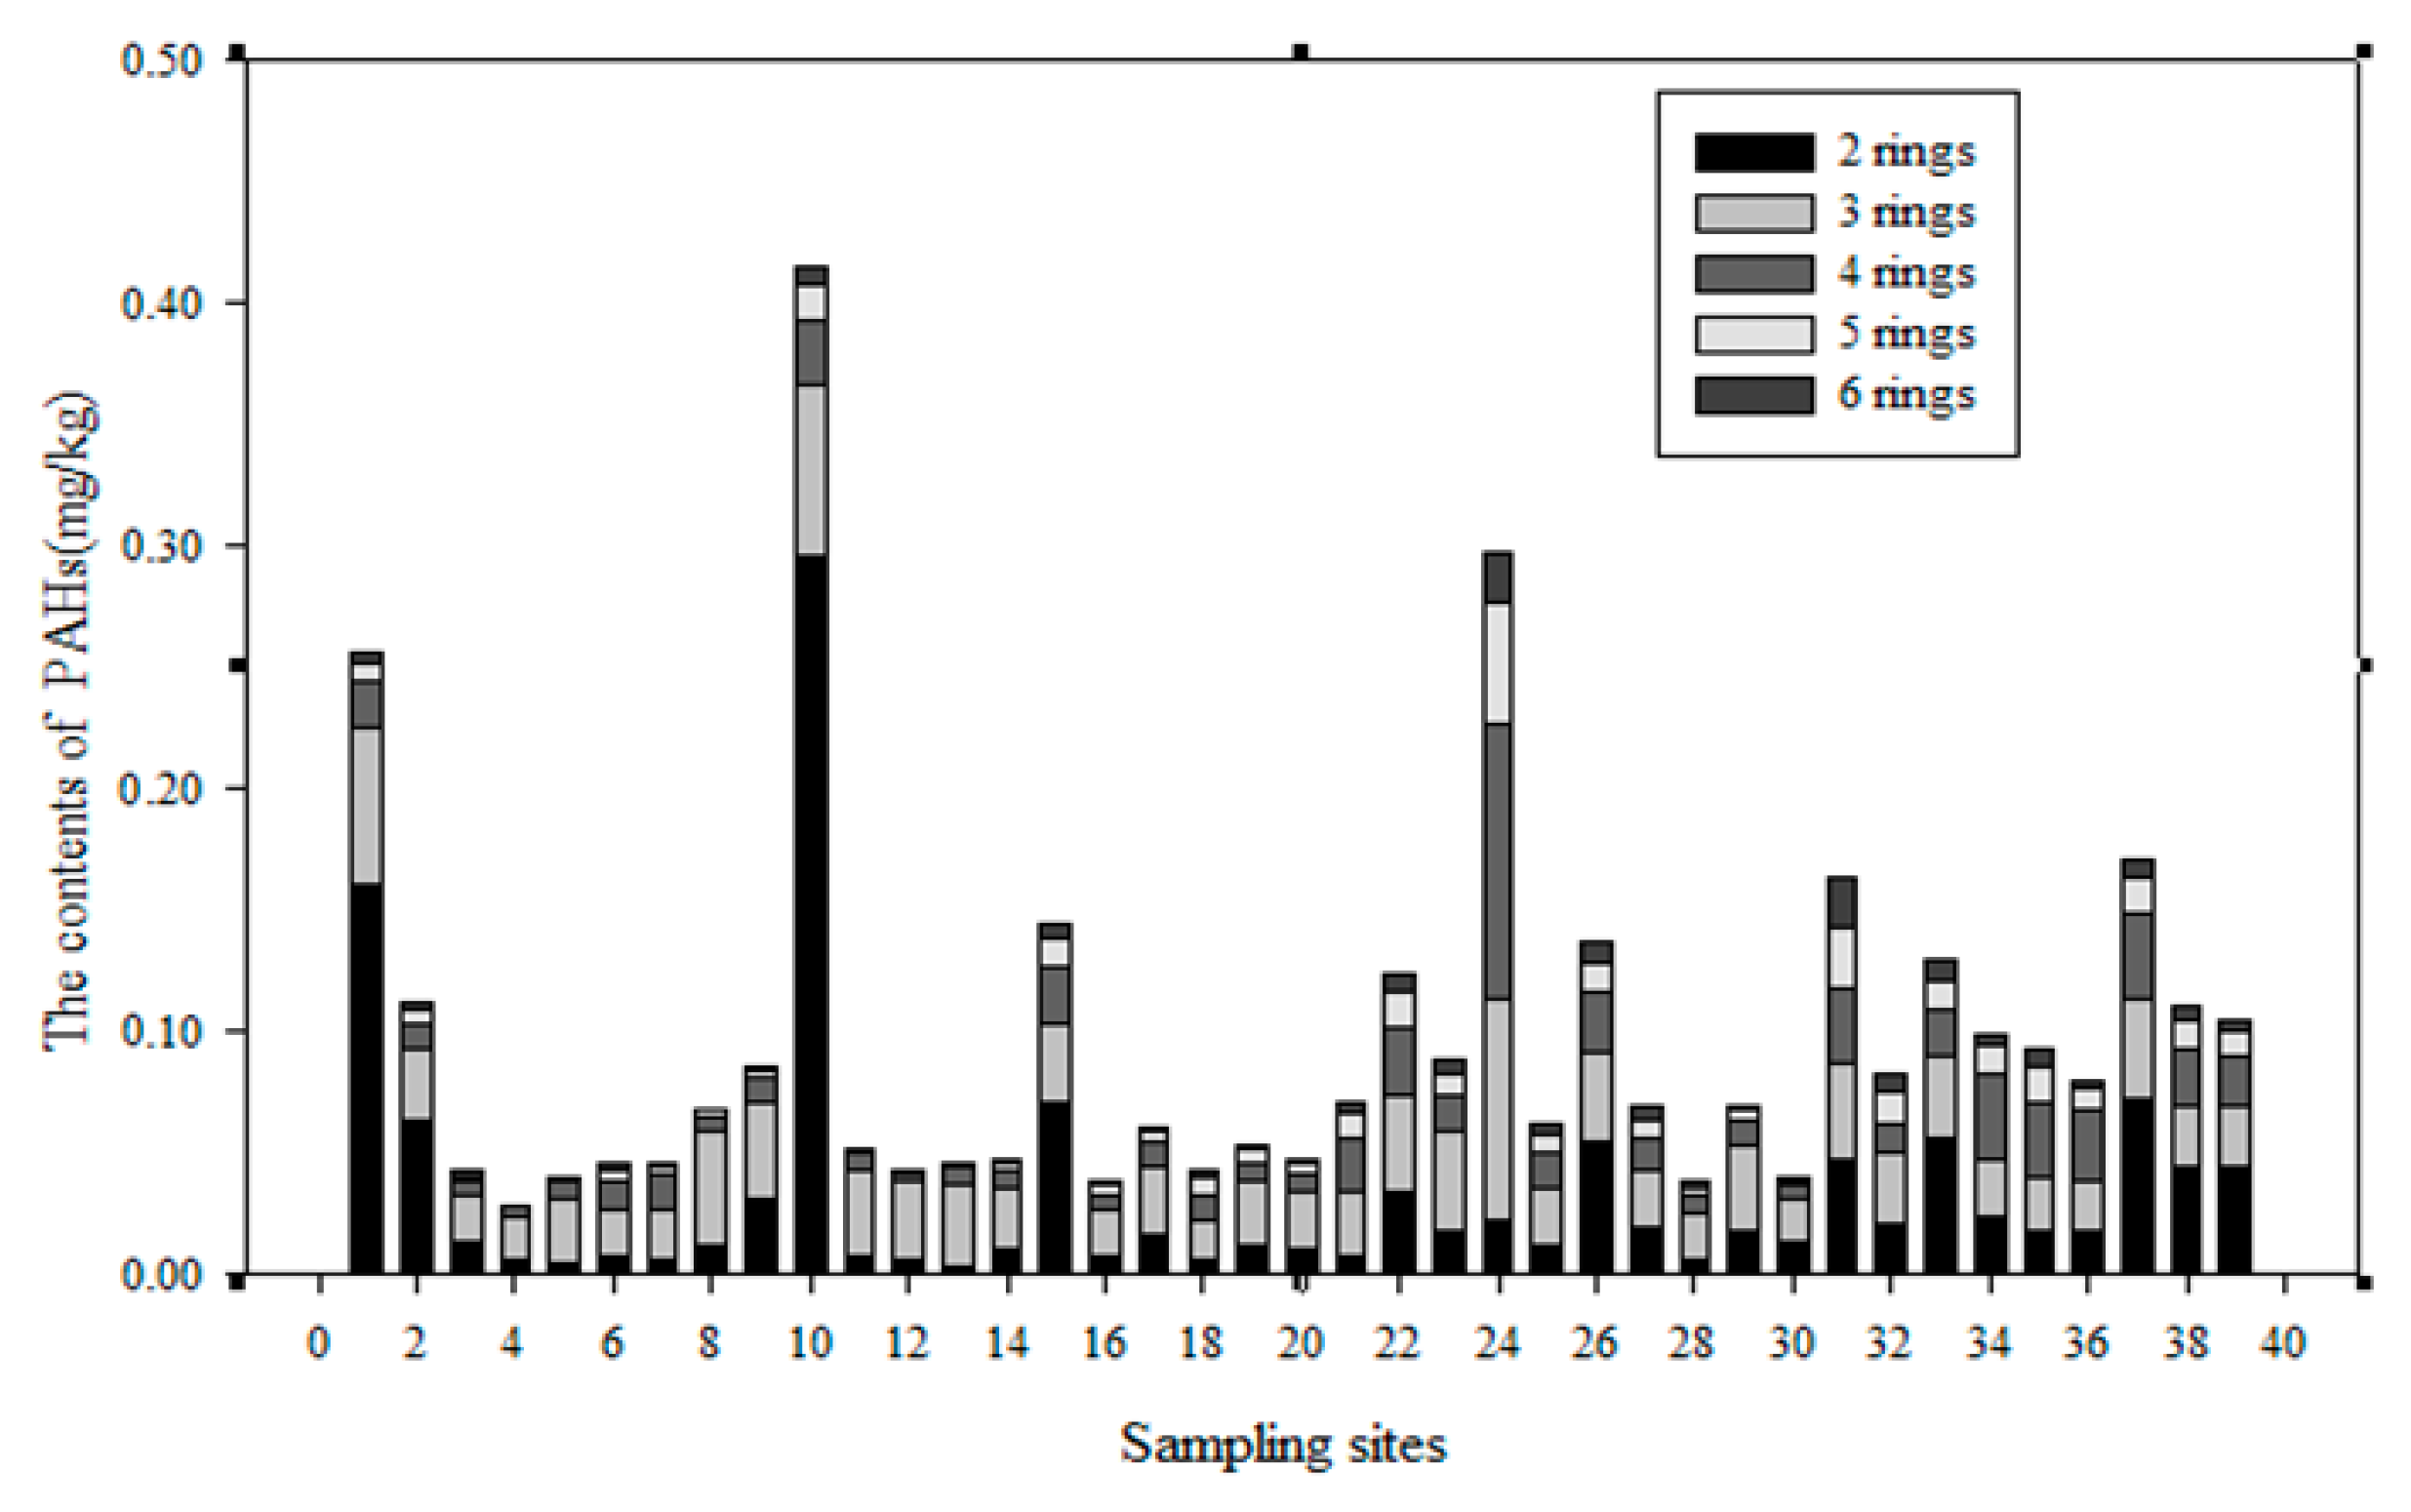
3.1. The PAH Content in the Soils of the Momoge Wetland

The content of the PAHs in the soils of the Momoge Wetland are shown in Figure 2. The total content (Σ16 PAHs) of all the PAHs in the soils of the wetlands ranged from (0.0290 to 0.4152) mg/kg, and the mean value was 0.0960 mg/kg. Among these 16 PAHs, the Nap content was highest, with Phe in second place; the contents of Fla, Pyr, Flu and BbF were roughly equal and low. The content of the remaining PAHs was even lower (close to zero); among these, the content of Acl was the lowest.
In Table 2, we provide a comparison of the PAH content in the soils of the Momoge Wetland with that in the soil of other wetlands at home and abroad. It shows that the PAH content in the Momoge Wetland is lower than that in the Baiyangdian Wetland (has the same soil type). It is equal to the PAH content in the soils of the Chongming Wetland in Shanghai, the north Yellow River Delta Wetland, the Qinkenpa Wetland in Daqing, the Lalu Wetland in Tibet and floodplain wetlands in Canada. Compared with a typical wetland in the three-river-plain and estuary wetland in Elizabeth (Canada), the PAH contents in the Jiaozhou Bay Wetland, the Liaohe Estuary Wetland, the Zhujiang Estuary Wetland and the south end of the Yellow River Delta Wetland are significantly lower.

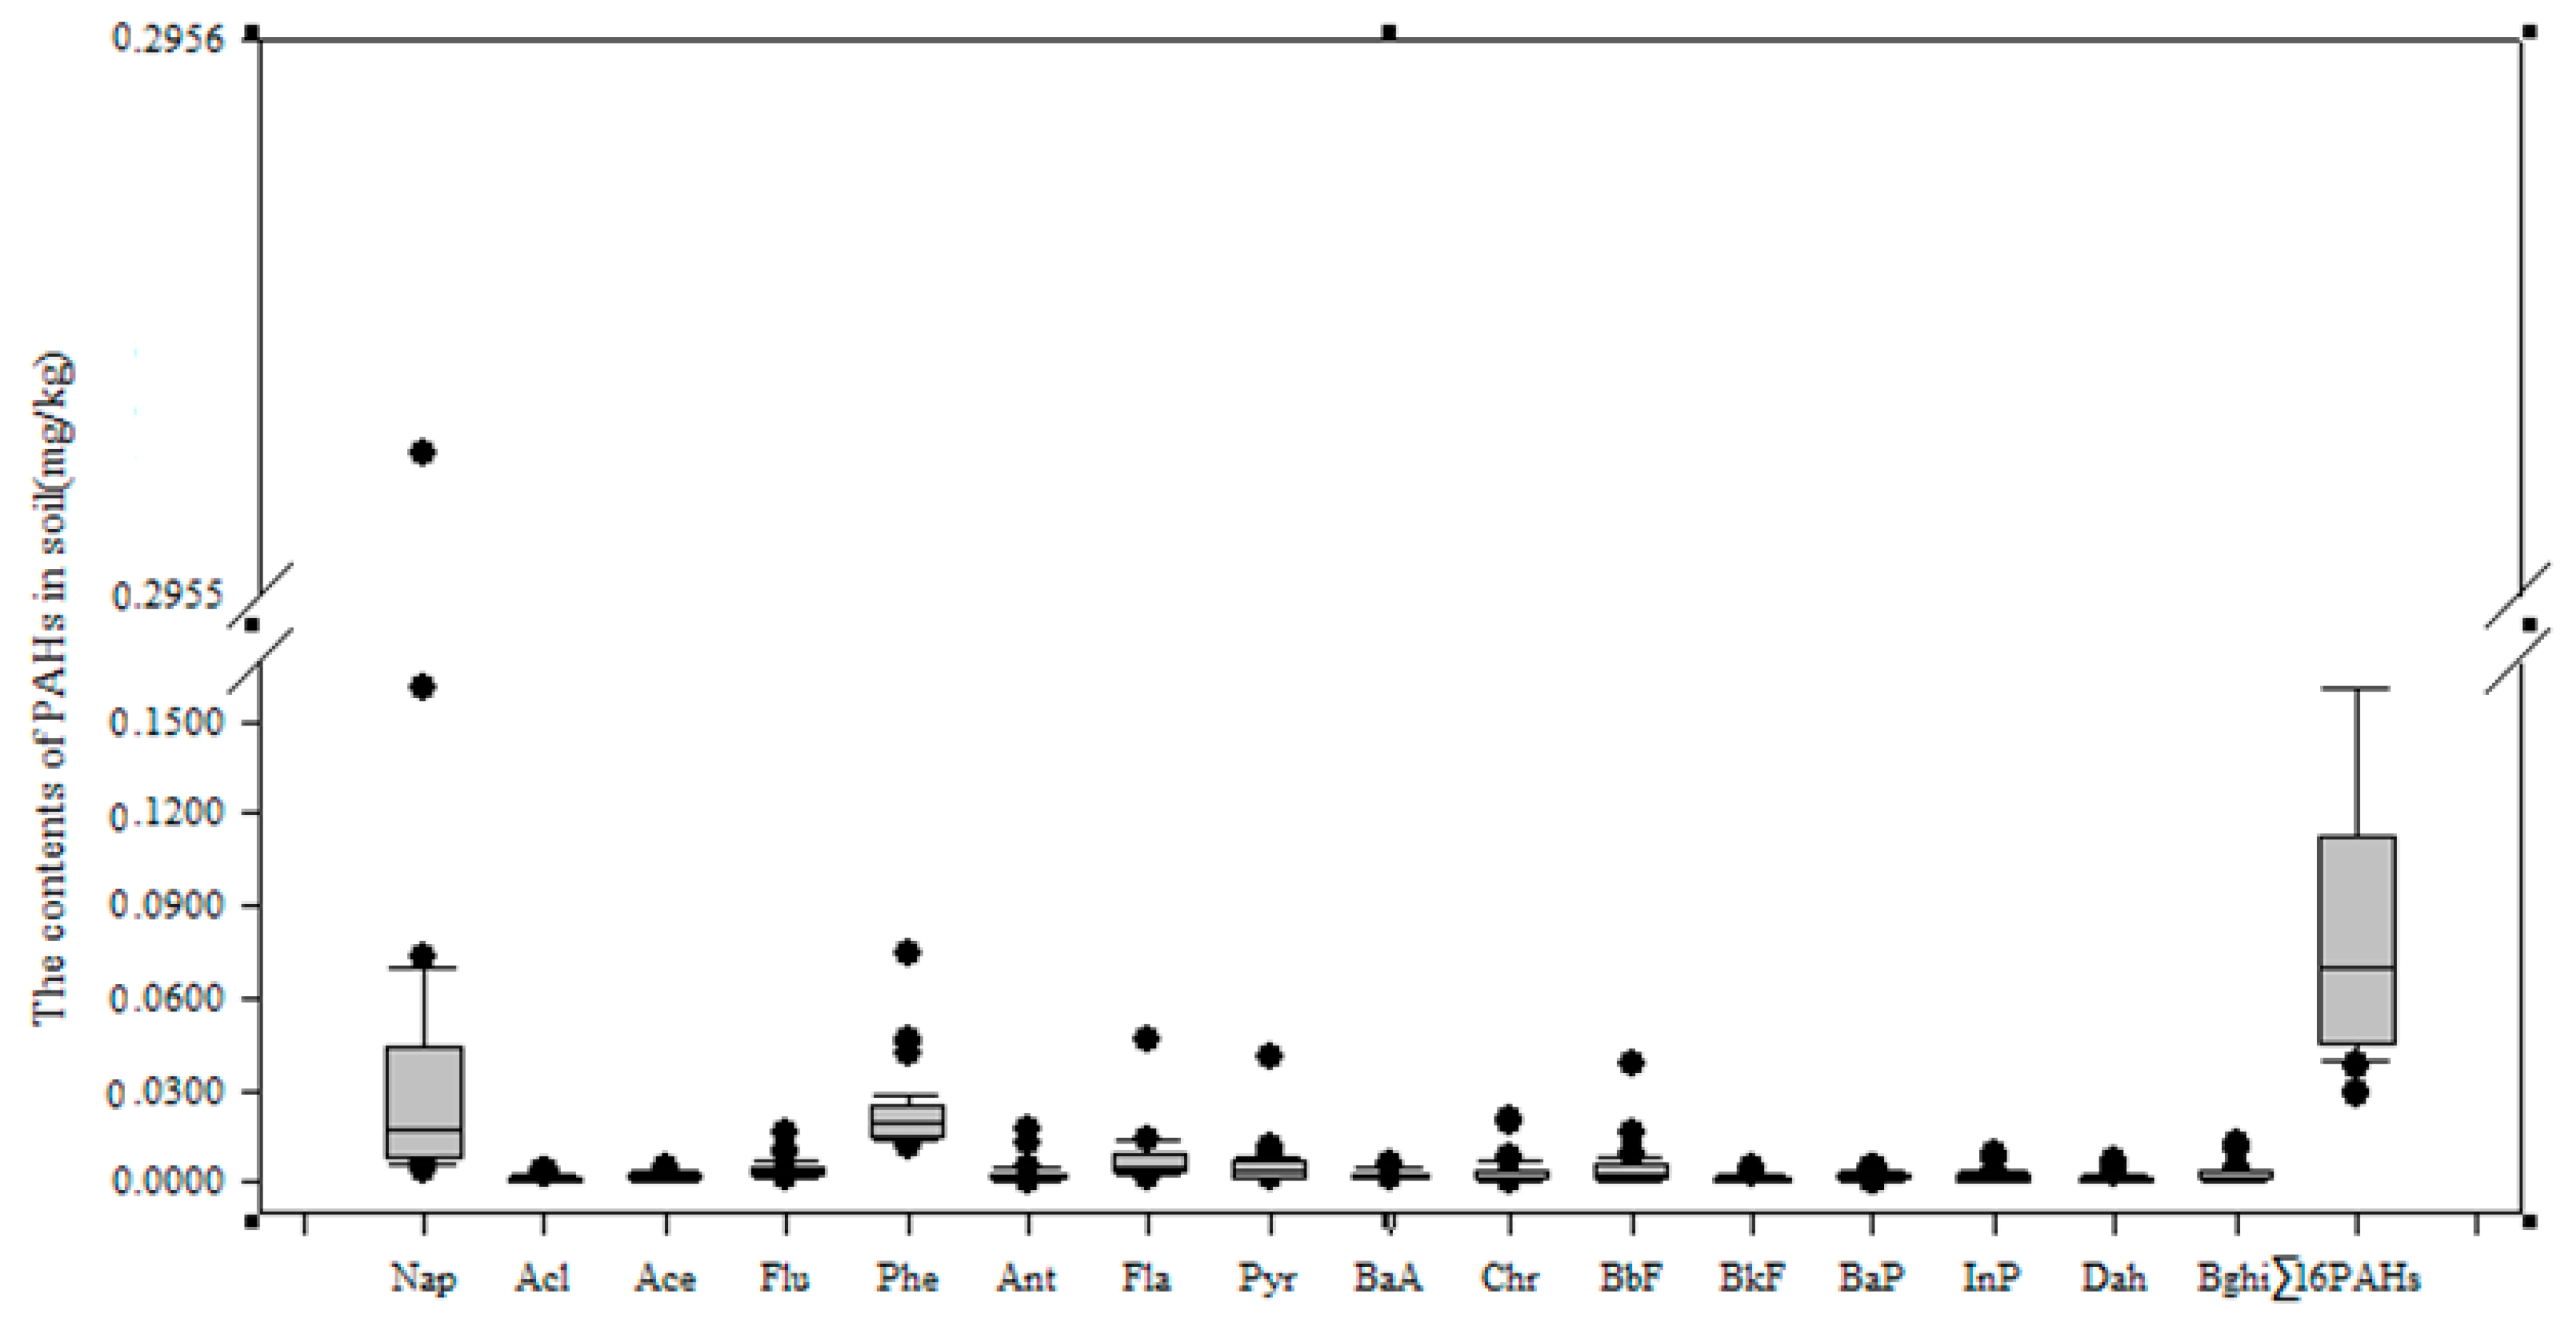
3.2. Compounds Analysed in PAHs in Soils of the Momoge Wetland

The chemical structure of PAHs with 2–3 rings, 4 rings and 5–6 rings determined in 39 soil samples from the Momoge Wetland were analysed, and the results are shown in Figure 3. It can be seen that the soil PAHs with 2–3 rings accounts for 40%–90% of the PAH content, the PAHs with 4 rings account for 10%–40%, and the PAHs with 5–6 rings account for less than 30% of the total PAH content in the soil samples. Furthermore, it can be seen that the PAHs with 2–3 rings reach 80% (proportion) in most of the samples and that the PAHs with 5–6 rings account for less than 15%. It follows that the PAHs in the soils of Momoge Wetland are mostly based on PAHs with fewer (2–3) rings and that only a small proportion of the PAHs there had more (5–6) rings.

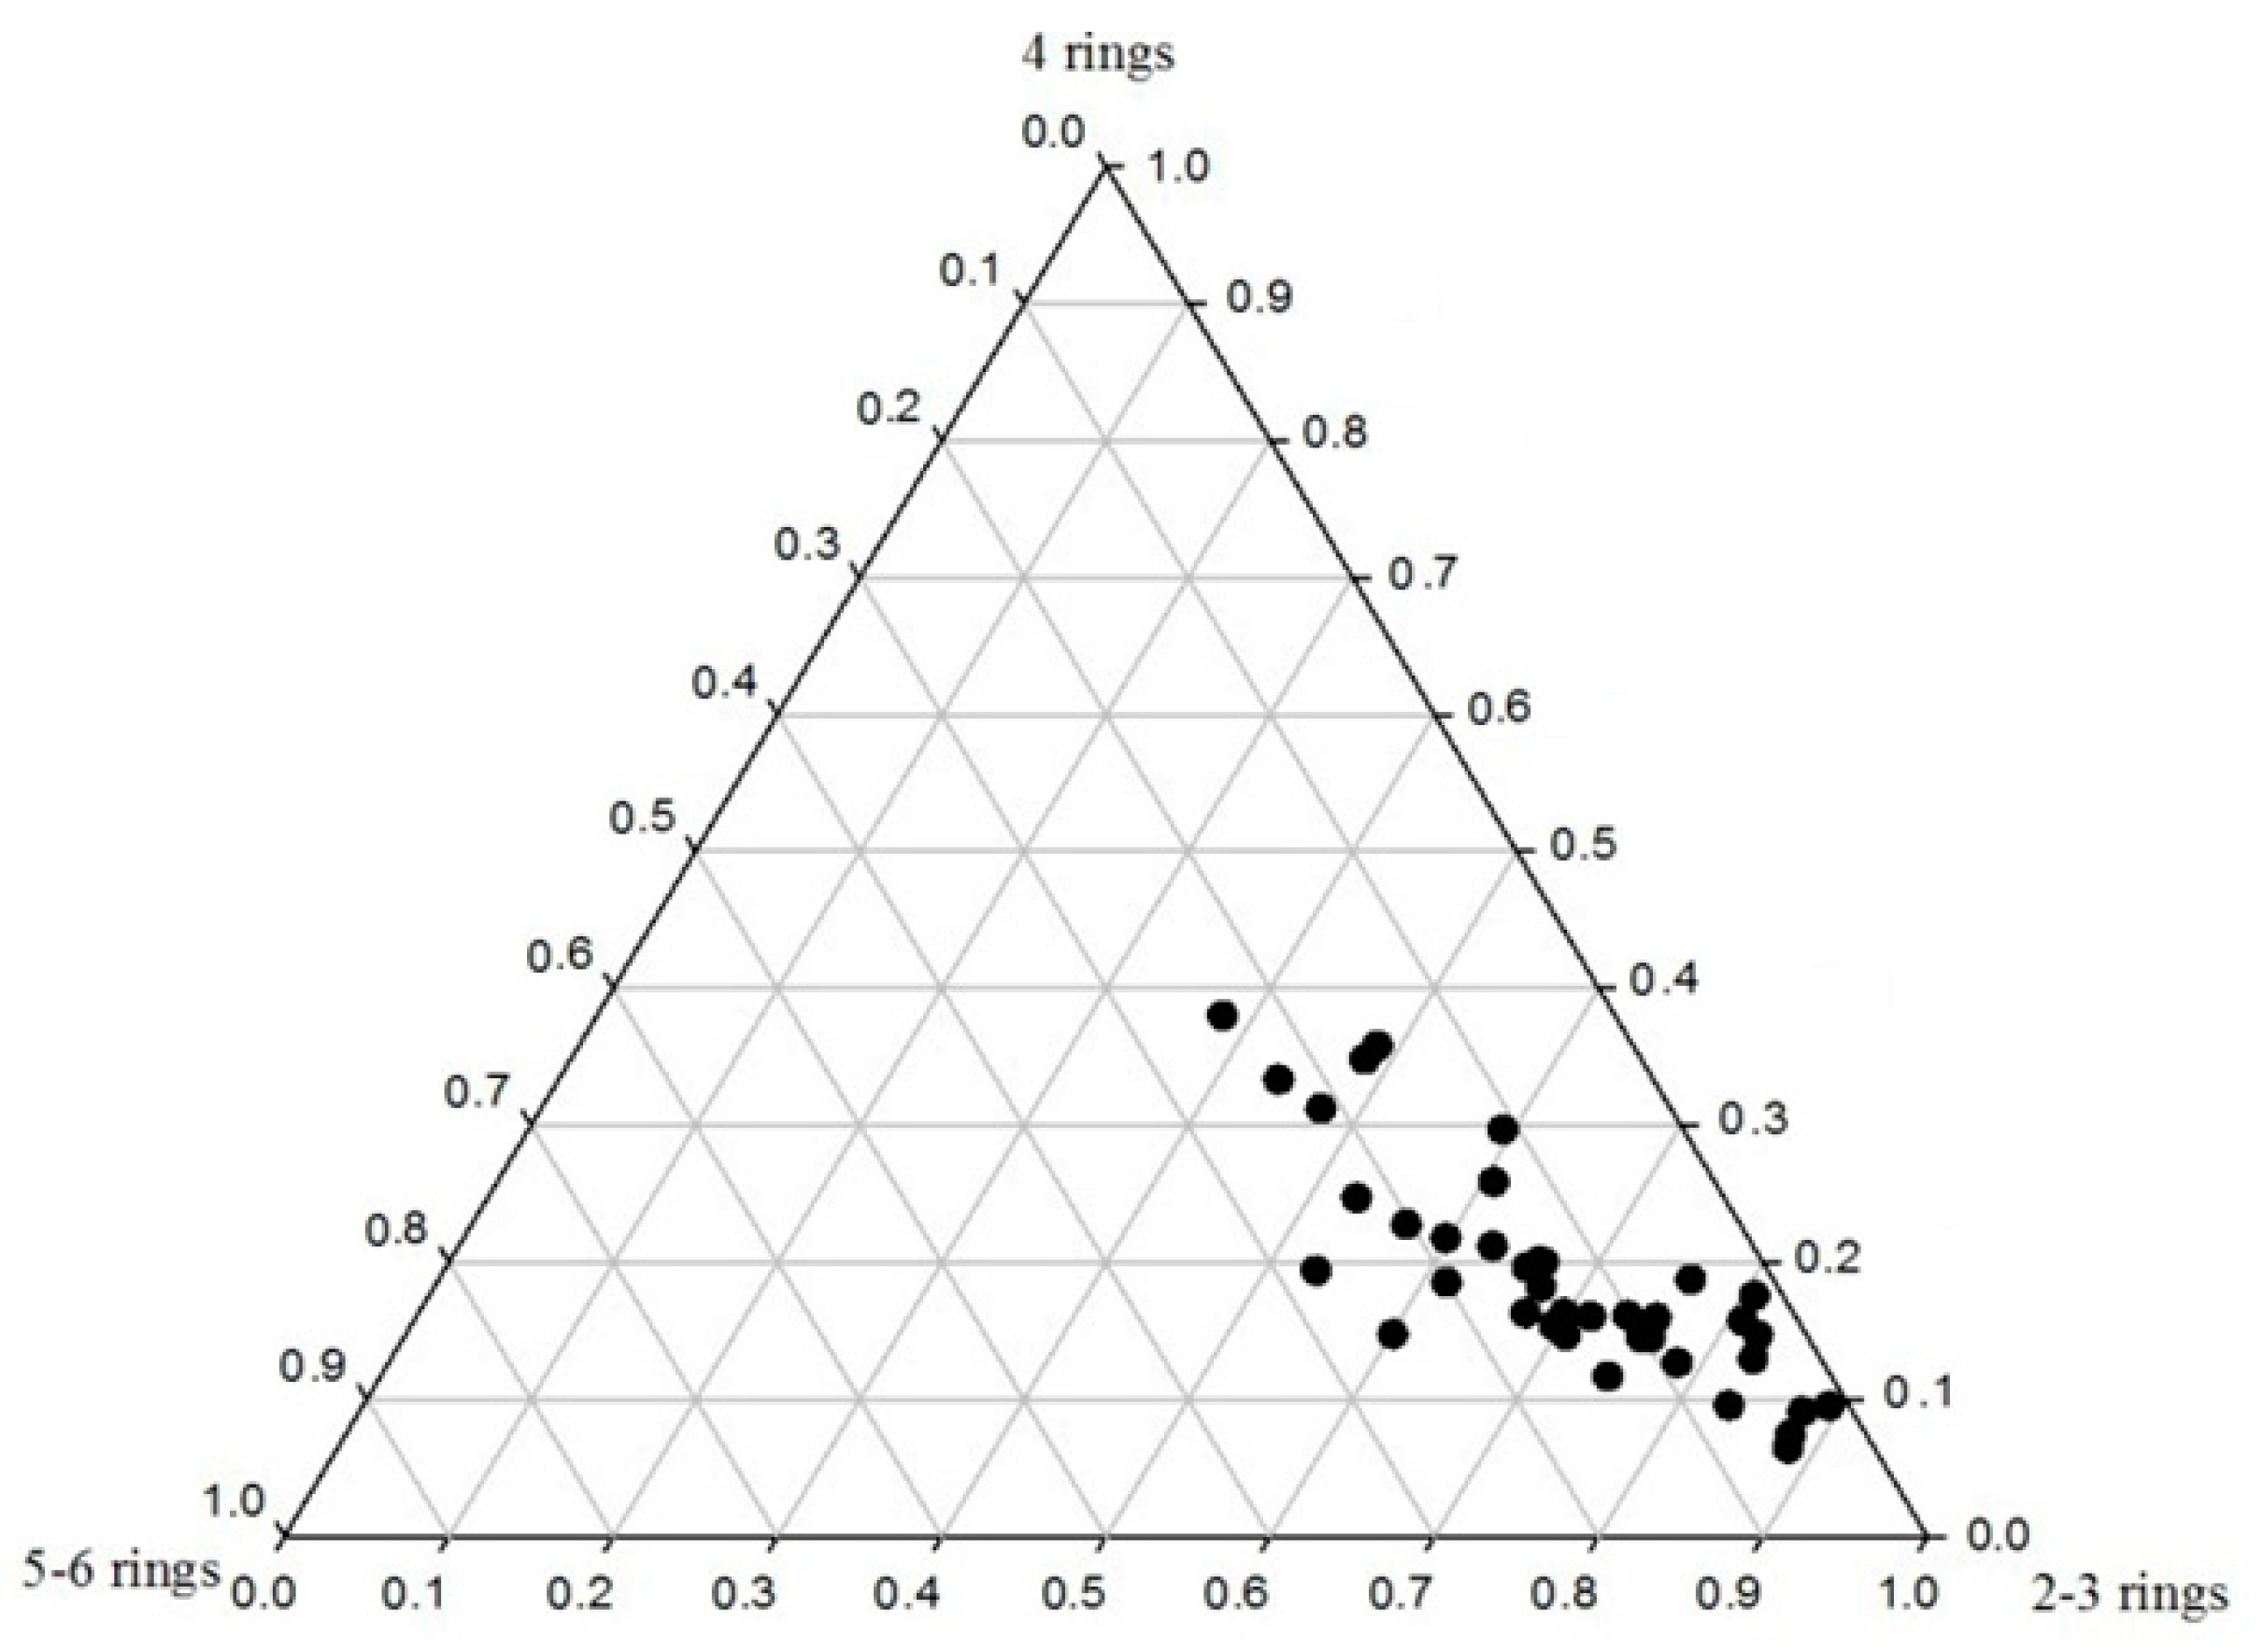
3.3. Distribution of PAHs in the Soils of the Momoge Wetland

To realize the distribution of PAHs in the soil of the Momoge Wetland, PAHs were analysed in 39 samples; the results are shown in Figure 4. It shows that the contents of PAHs in the No. 10 soil sample is the highest, No. 24 and No. 1 soil samples take the second place, the No. 15, No. 26, No. 31 and No. 37 soil samples take the third place, and the content in the No. 4 soil sample is the lowest.

4. Source Identification of PAHs in Soils of the Momoge Wetland

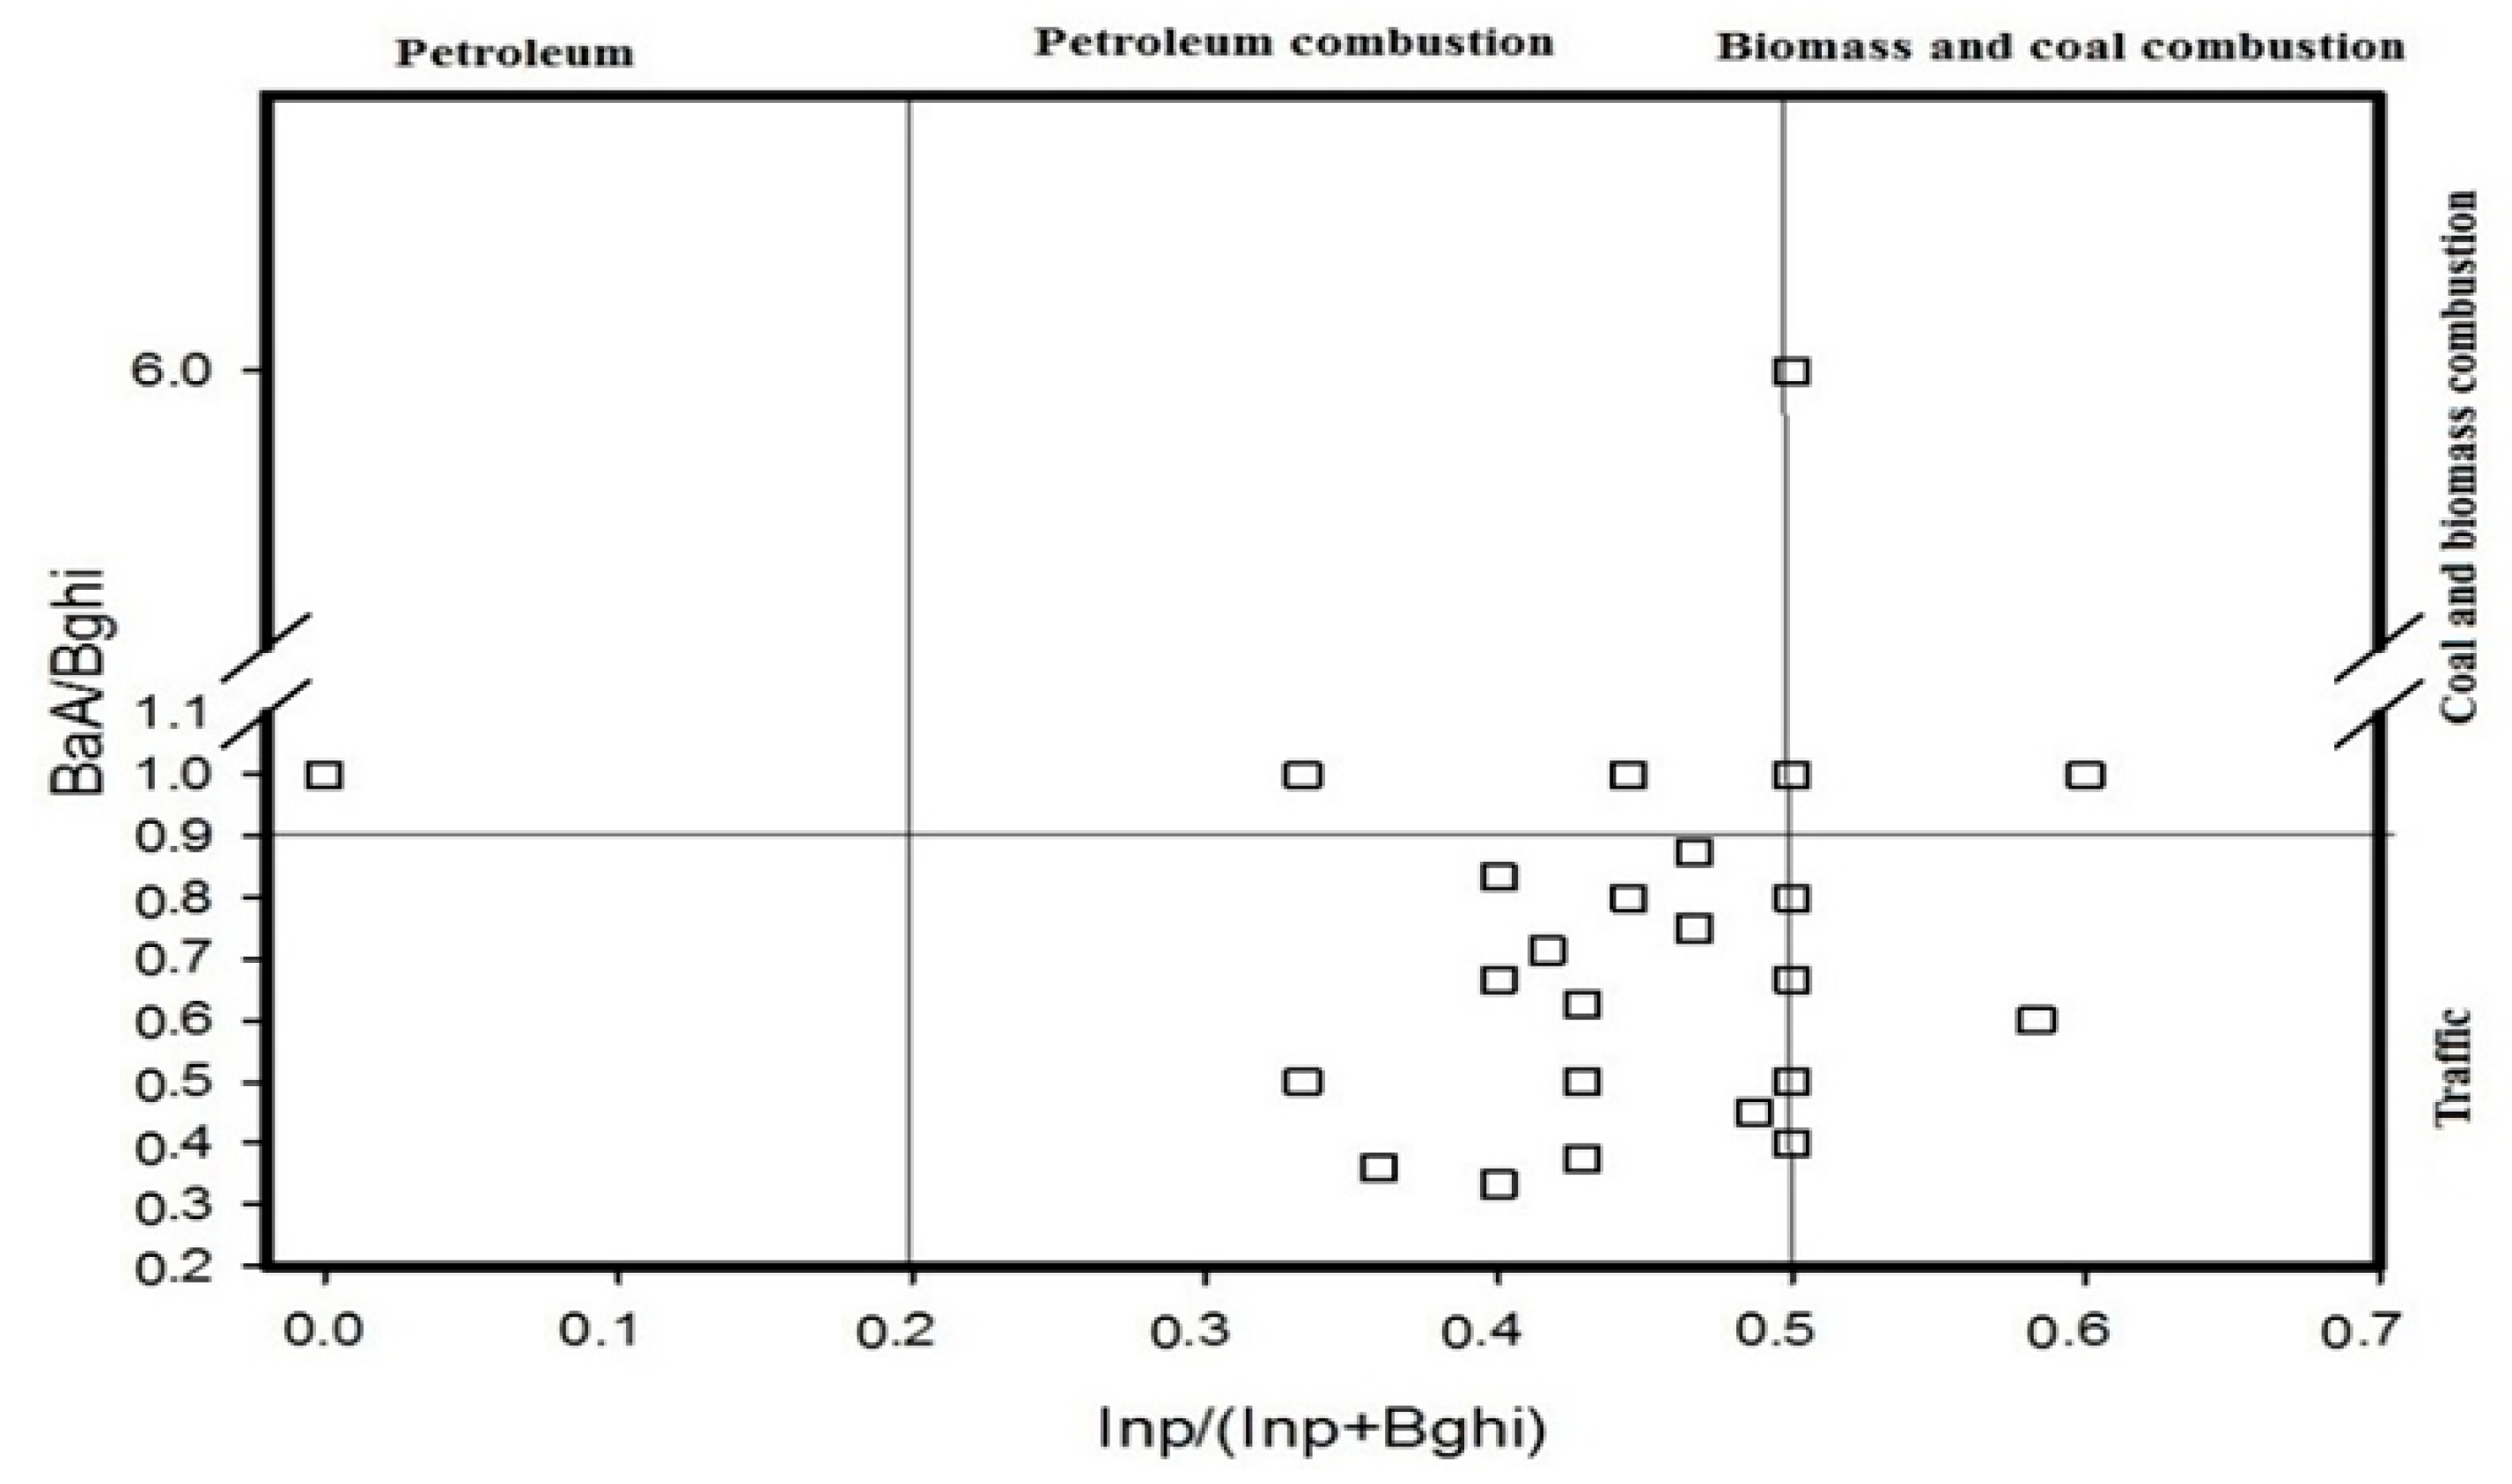
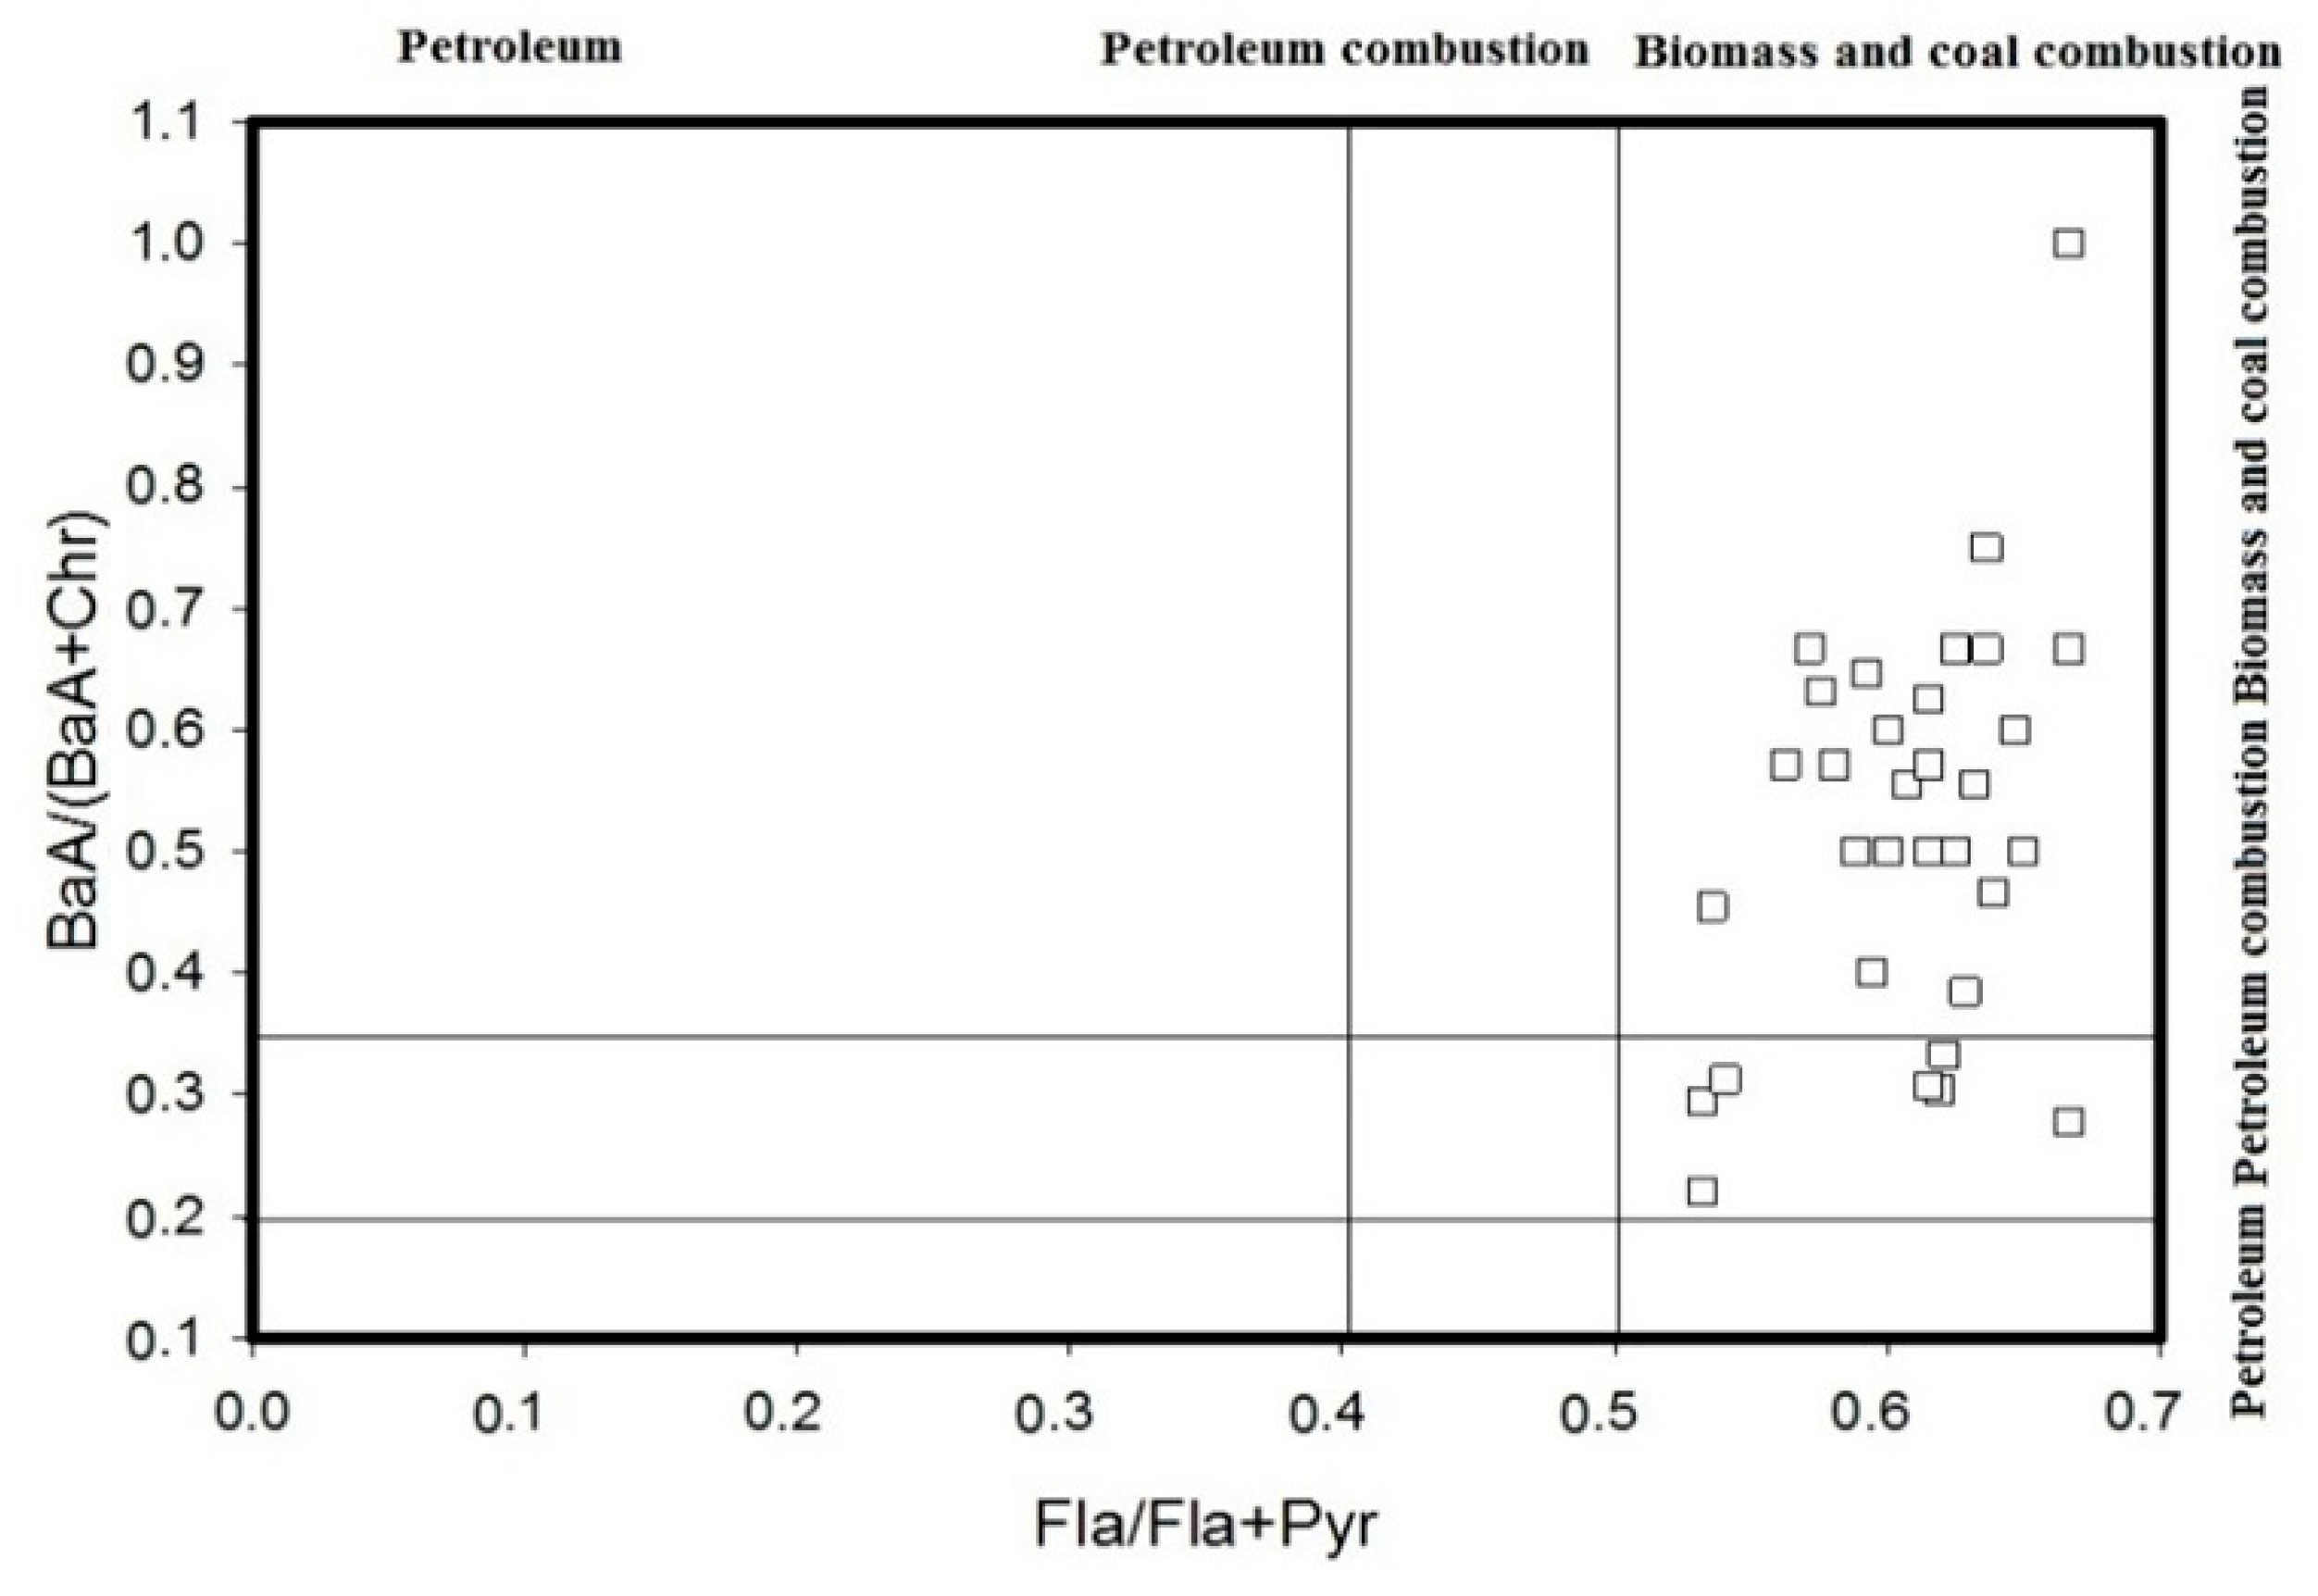
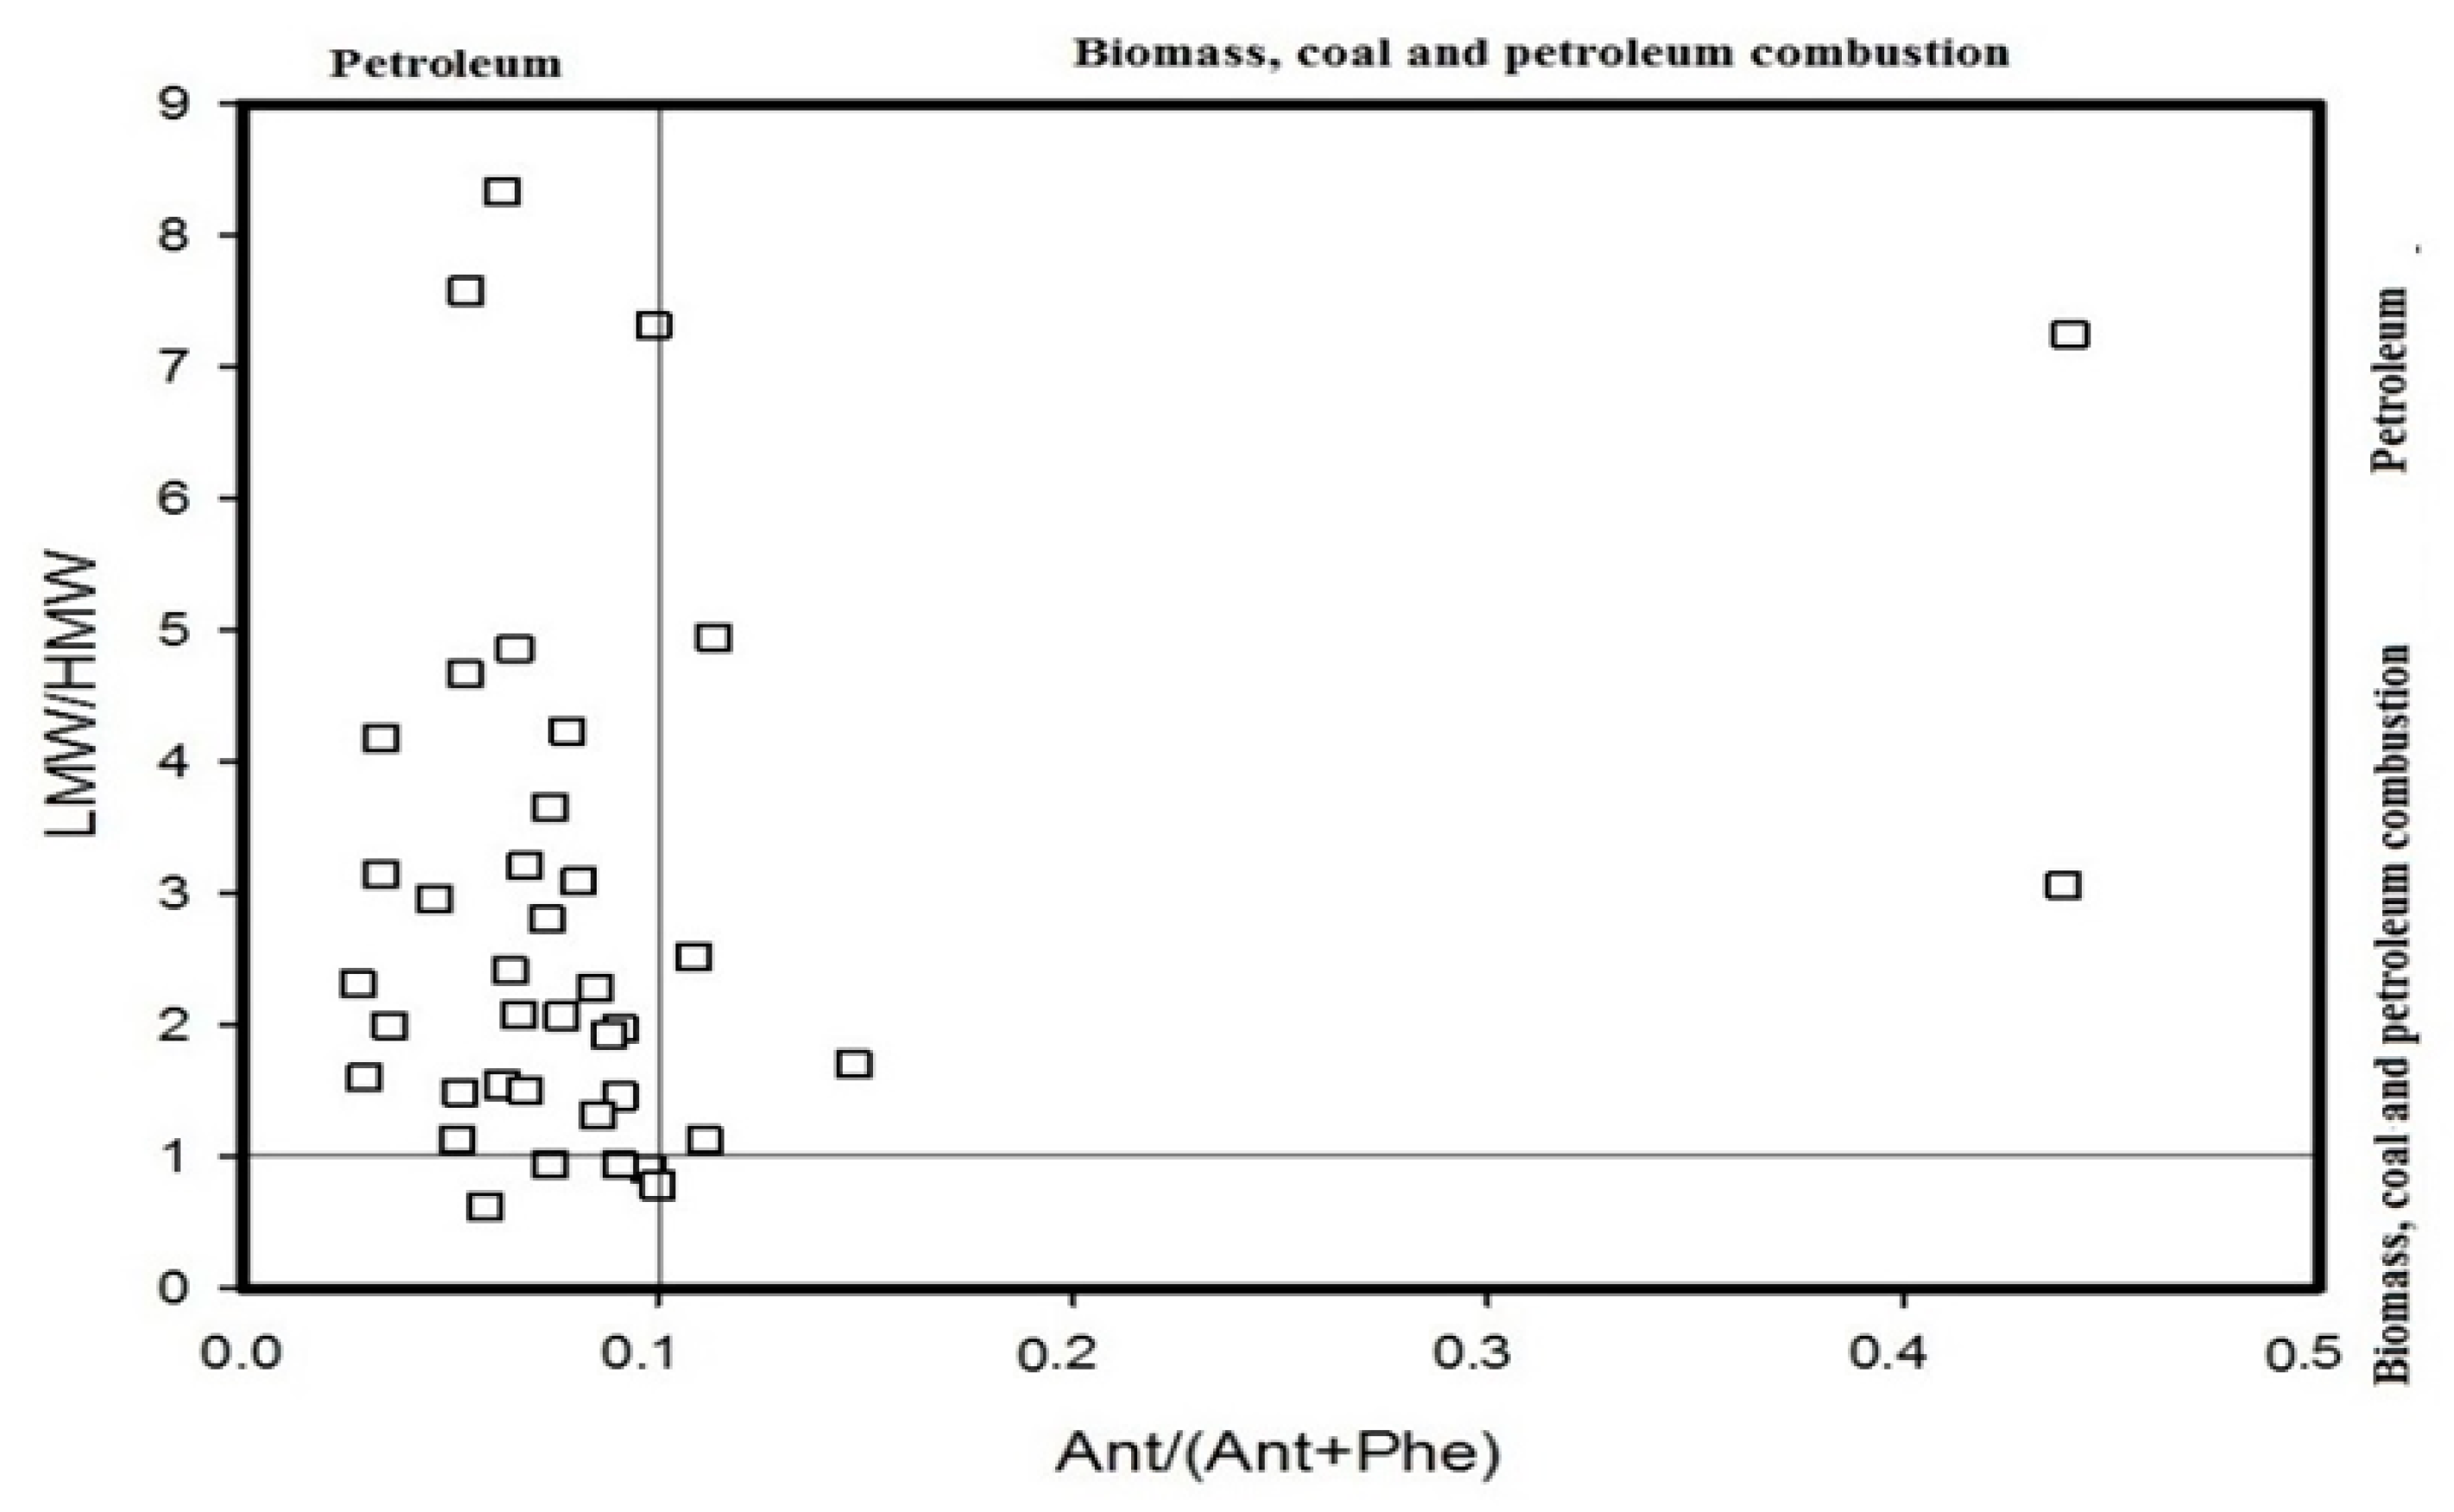
4.1. Diagnostic Ratio Method
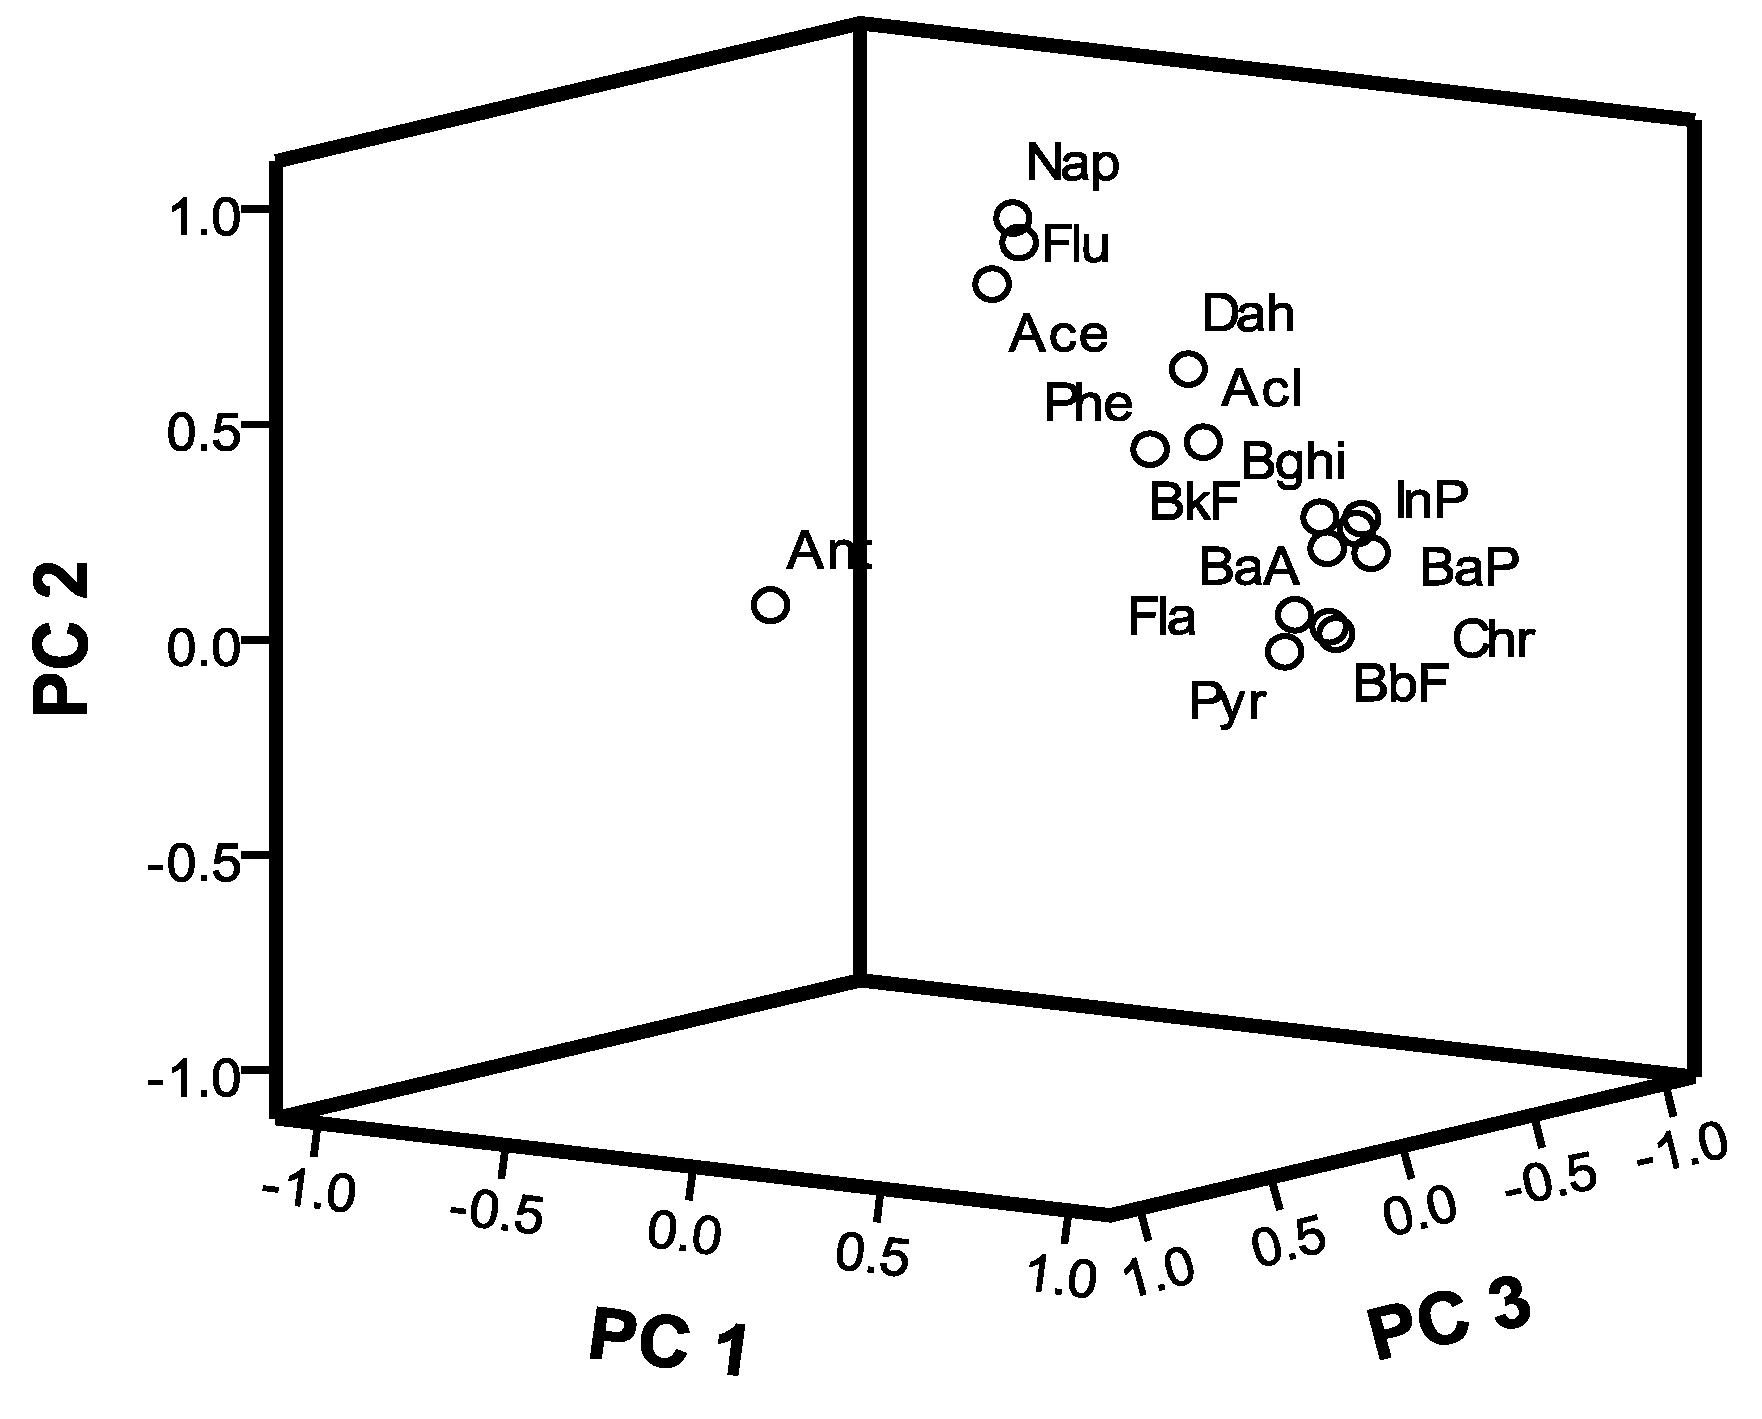
According to the diagnostic ratio method, it can be summarized that all the ratios (i.e., BaA/(BaA + Chr), Fla/(Fla + Pyr), Ind/(Ind + Bghi), BaA/Bghi, Ant/(Ant + Phe) and LMW/HMW) can be used to analyse the source of these PAHs. The results are shown in Figure 5, Figure 6 and Figure 7. Figure 5 shows that the BaA/(BaA + Chr) values for most of the samples are >0.35, while the Fla/(Fla + Pyr) values of all of the samples are >0.5. This suggests that the PAHs in the soil samples come from the combustion of coal and biomass and that only a small quantity of them comes from the combustion of petroleum. With reference to Figure 6, the Ind/(Ind + Bghi) values for most of the samples range from 0.2 to 0.5, and the BaA/Bghi values are less than 0.9. This means that almost all of the PAHs at the sampling sites in the Momoge Wetland come from the combustion of petroleum and other traffic fuel. The PAHs in a few sampling sites come from the combustion of coal and biomass. With reference to Figure 7, the Ant/(Ant + Phe) values for most of the sampling sites are <0.1, while the values of LMW/HMW are >1. That is to say, most of the PAHs at these sampling sites come from fossil oil. In conclusion, the major sources of the PAHs in the soil of the Momoge Wetland not only include combustion of coal, biomass and petroleum but also include direct contamination by petroleum.

4.2. PCA-MLR

The diagnostic ratio method could determine the source of PAHs in this area but not the proportion of each source. Thus, the PCA-MLR model was used, and three components with eigenvalues greater than ‘1’ were extracted by the model (Table 3 and Figure 8). They accounted for 80.926% of the total variance. Principal component 1 (PC1) explained 58.204% of the total variance and was characterized by higher loadings of Acl, Phe, Fla, Pyr, BaA, Chr, BbF, BkF, BaP, Ind, Dah and Bghi. Among these, Phe, Fla, Pyr and Chr indicate sources related to the combustion of coal; BaA, BbF, BkF and BaP indicate sources related to the combustion of petroleum; Ind, Dah and Bghi indicate sources related to the combustion of gasoline and diesel. The combustion source is possibly associated with rapid urbanization resulting in a large amount of petroleum and coal consumption. Principal component 2 (PC2) explained 15.441% of the total variance; it was mainly loaded with components of Nap, Ace and Flu in which a higher loading of Nap was associated with a petroleum spill. This might mean that during petroleum-related activities, PAH transfers to soil occur during petroleum exploration, production and transportation and will likely remain closely related to the local petroleum field. Principal component 3 (PC3) explained 7.281% of the total variance and was dominated by Ant. While this single component cannot reflect the source of the PAH well, principal component 3 is considered to be related to other sources (i.e., non-petroleum and non-combustion).
The three principal components were standardized as independent variables, and the contents of Σ16 PAHs in soil samples were standardized as dependent variables; then a MLR analysis was conducted. The relevant data are shown in Table 4. It can be seen that the standardized coefficient of source from the combustion of coal and petroleum, petroleum and other are 0.81, 0.519 and −0.037, respectively. The contribution ratios of each of these three sources were 59.3%, 2.7% and 0.0%, respectively. The coefficient of determination is 0.942, which meets the requirements of regression analysis.

5. Pollution Assessment and Ecology Risk Assessment of PAHs in Soils of the Momoge Wetland

5.1. Pollution Assessment of PAHs in Soils of the Momoge Wetland

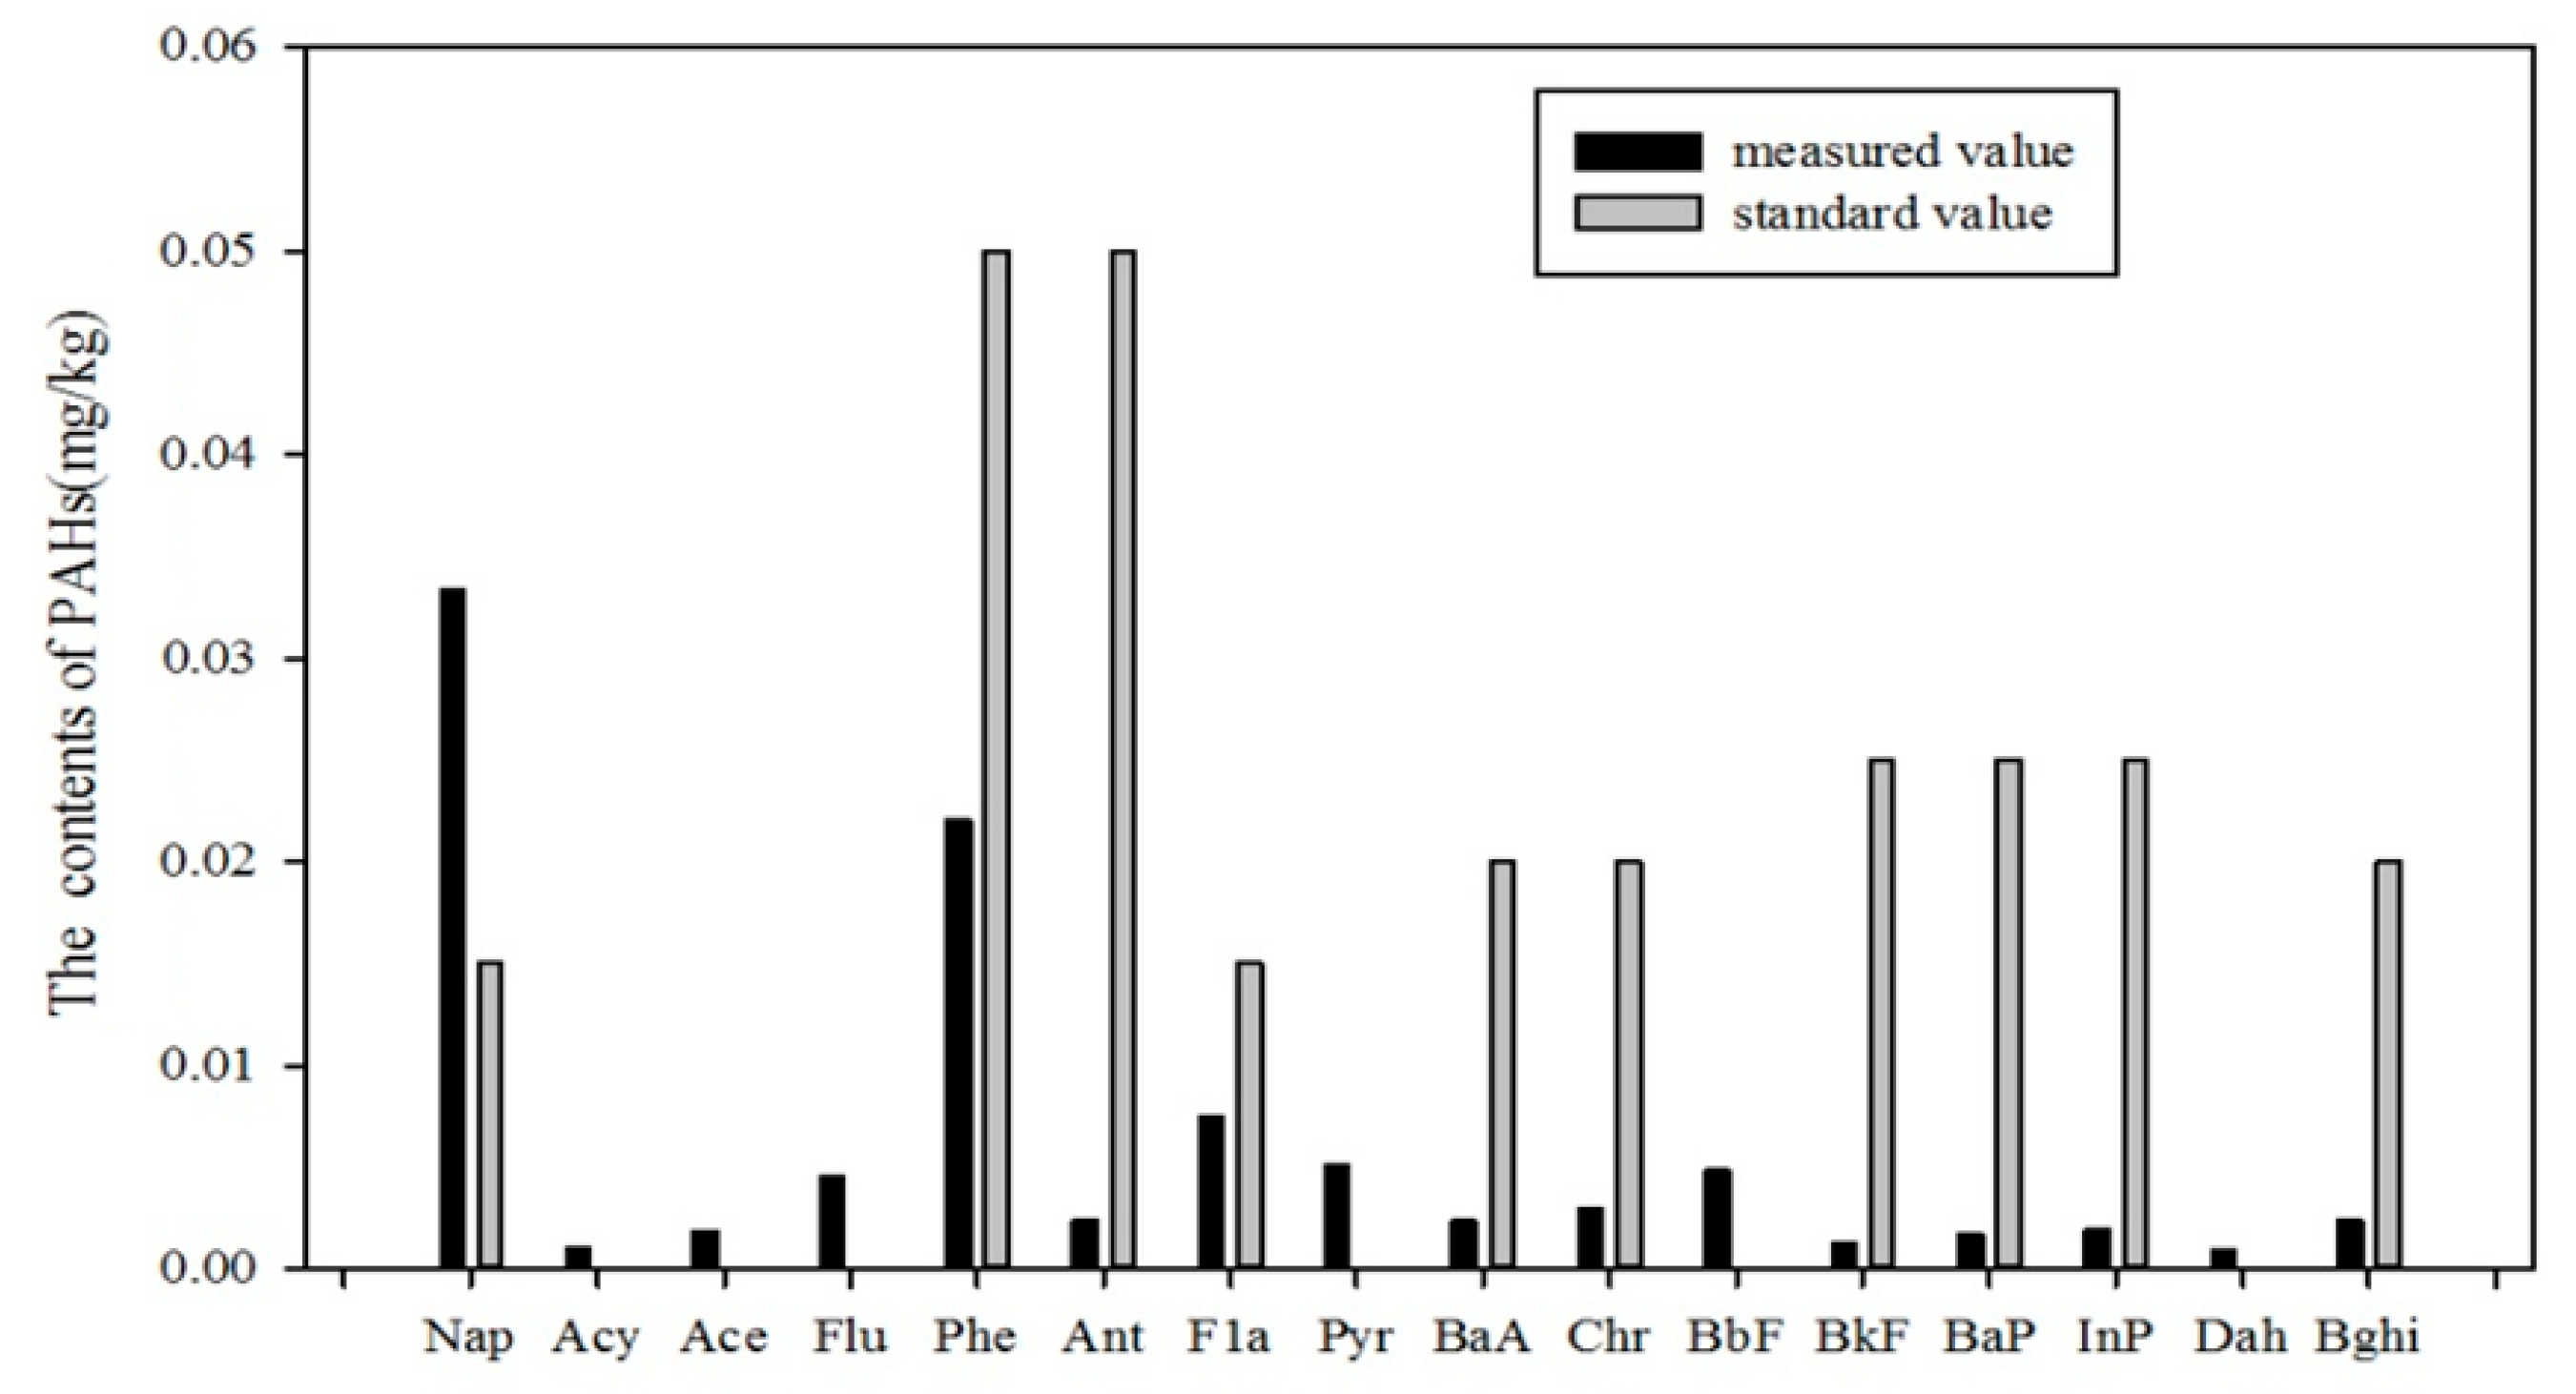
5.1.1. Standard Index Method

Owing to the fact that neither domestic soil environmental quality standards nor the study of the background values of soil in Jilin Province have listed the standard value and background value of PAHs in soils, the average values of the 16 PAHs collected in 39 soil samples were compared with the standard values provided by the Dutch government, as shown in Figure 9. It shows that the mean values of the content of the 16 PAHs are all far below their standard values except for Nap. This indicates that the local area may be contaminated by Nap and that Nap contamination is likely to have come from leaks that occurred during the process of local petroleum exploitation.

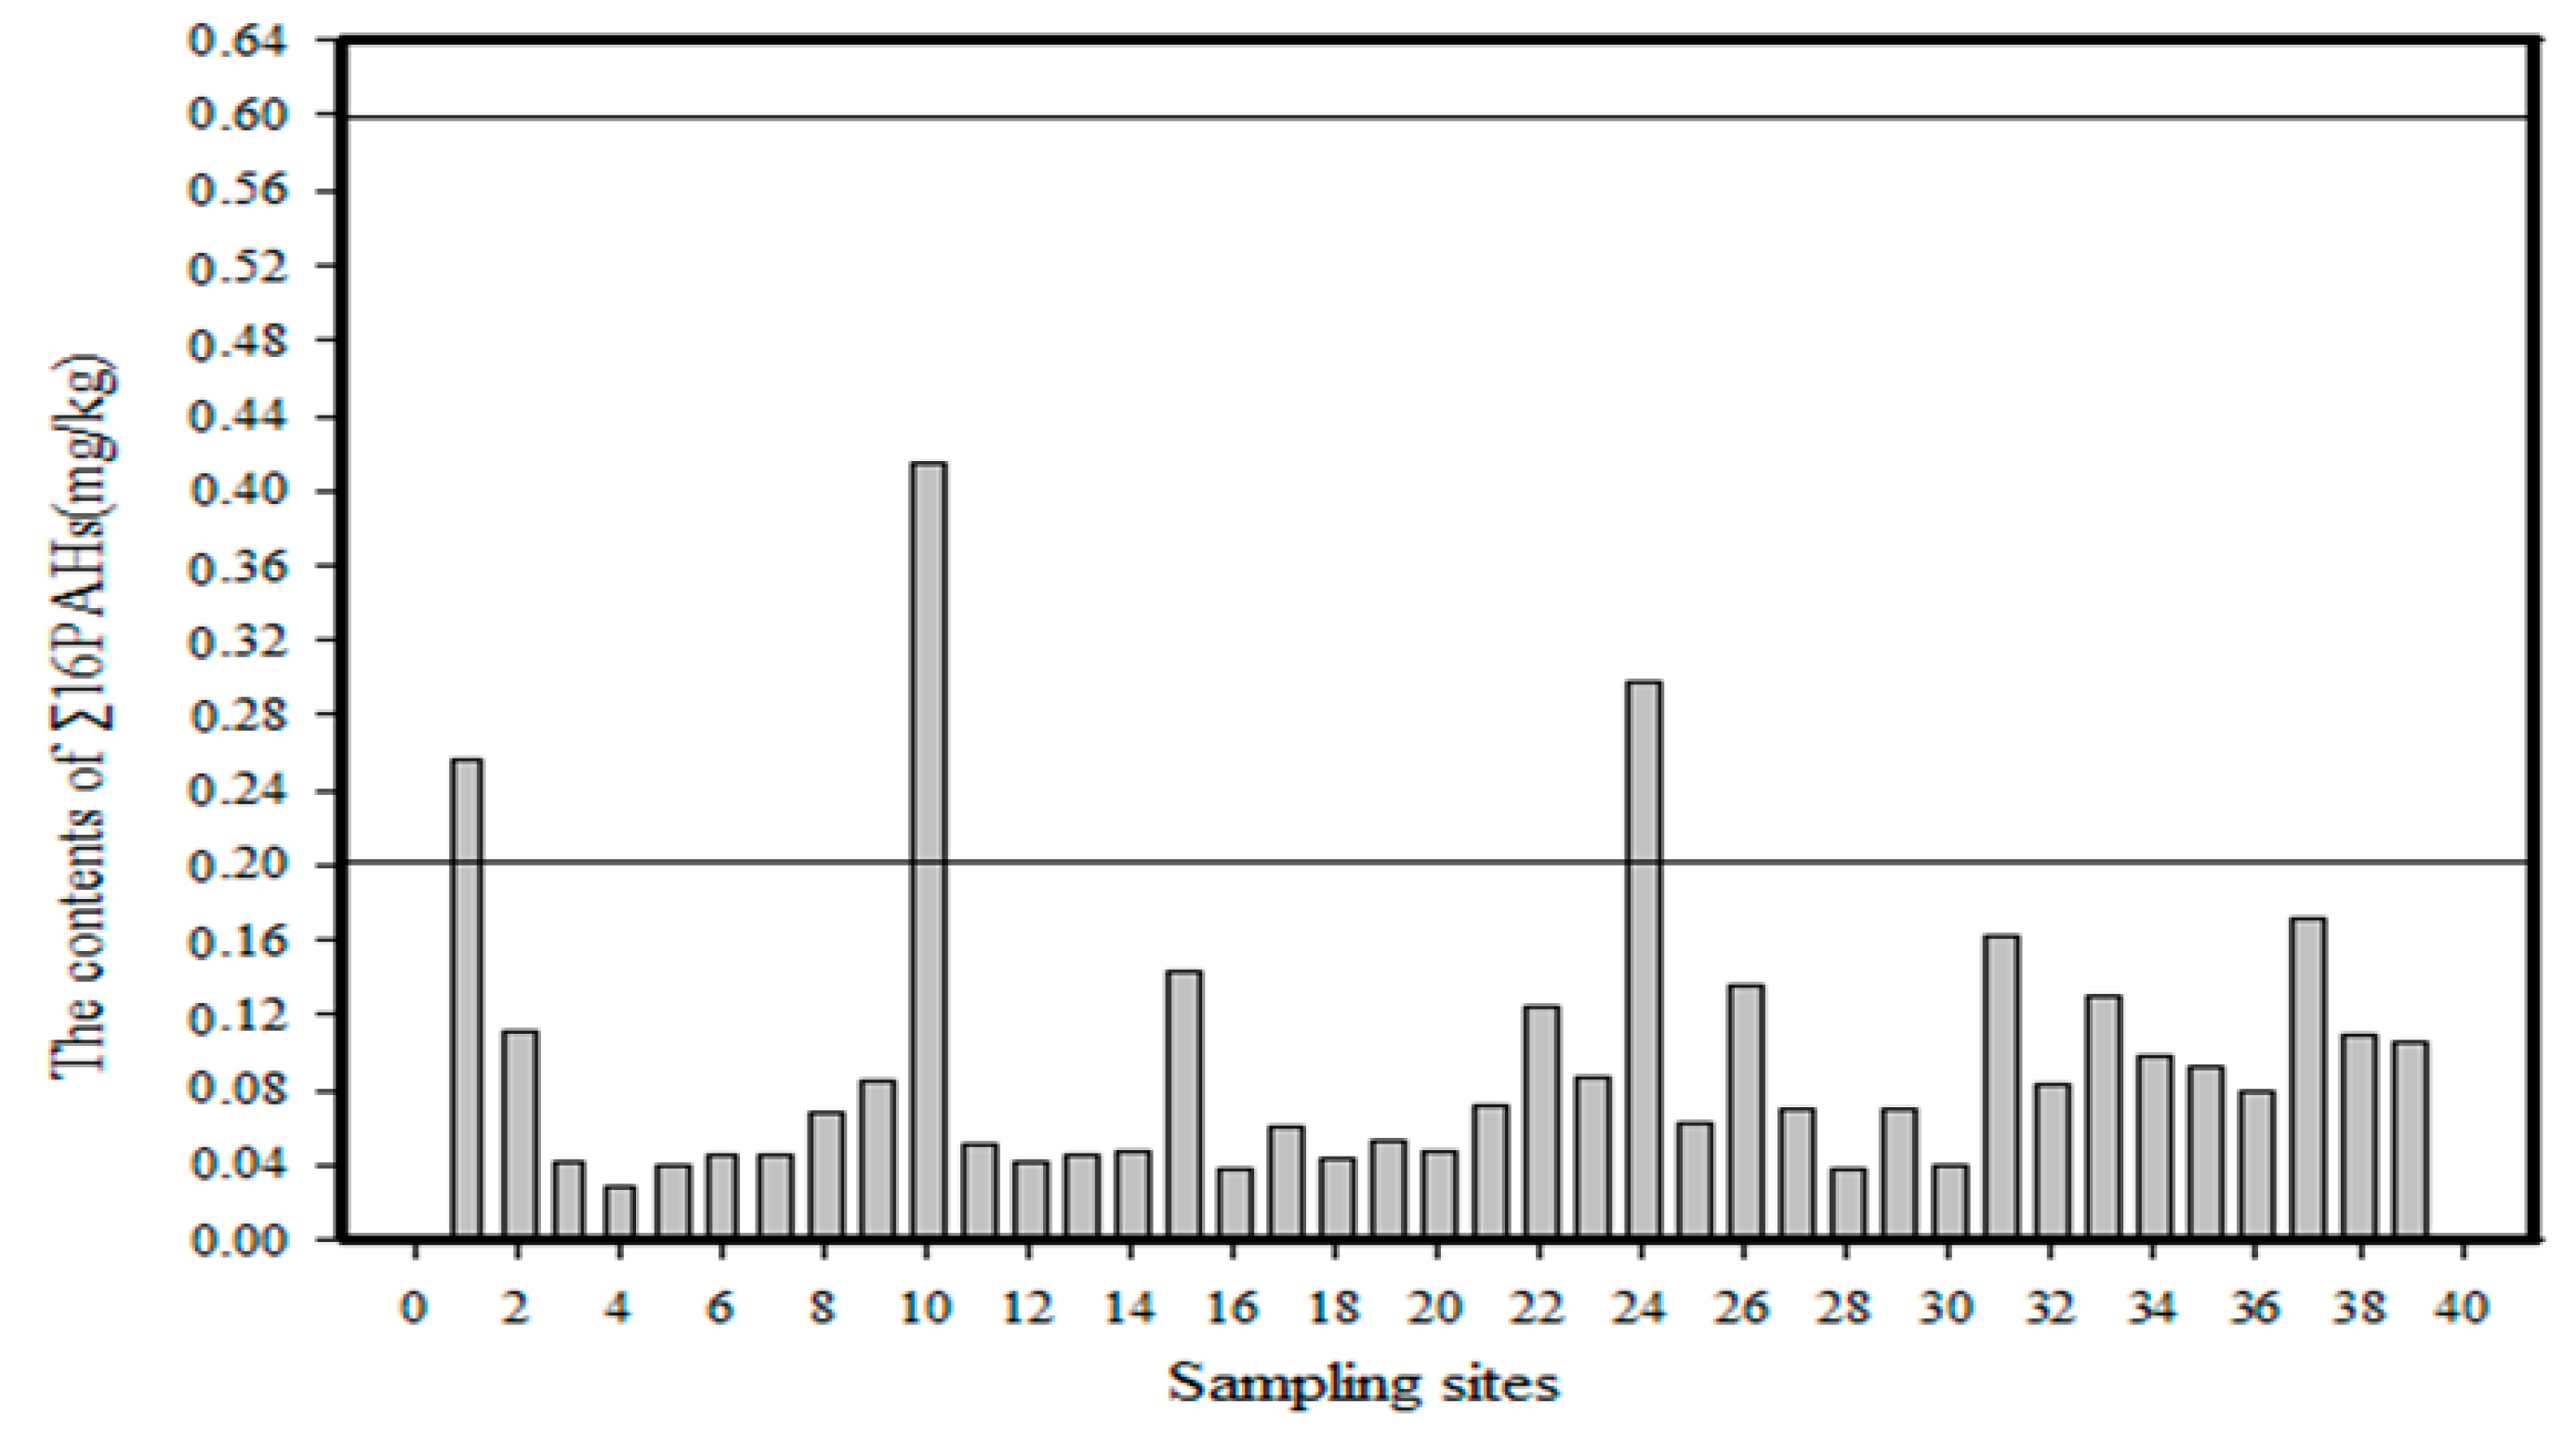
5.1.2. Pollution Interval Value Method

According to the classification of pollution intervals created by scholars, the PAH pollution in the soil of the Momoge Wetland was divided into two categories: non-contaminated soil and lightly polluted soil; the details of the situation are depicted in Figure 10. It can be seen that the PAH contents at the No. 1 sampling point, No. 10 sampling point and No. 24 sampling point are all between (0.2 and 0.6) mg/kg, meaning that the soil is lightly polluted. The results for the other 36 sampling sites are all <0.2 mg/kg, indicating that the soil is not polluted.

5.2. Ecological Risk Assessment of PAHs in Soils in the Momoge Wetland

5.2.1. Biological Toxicity Assessment

Comparing the ERL value and ERM value of PAHs with the measured values of each the PAHs, the biological toxicity level of the soil samples can be determined. The statistical values are shown in Table 5. It indicates that the total concentrations of Acl, Ace, Flu, Phe, Ant, Fla, Pyr, BaA, Chr and 16 PAHs in 39 soil samples are all less than the ERL value. Therefore, the total biological toxicity of the above-mentioned PAHs and 16 types of PAHs in 39 soil samples is <10%, which is not biologically toxic. In contrast, the Nap content in two of the soil samples is higher than the ERL value and lower than the ERM value. The contents of Nap in the other 37 soil samples are lower than the ERL value. In other words, there are two soil samples that showed biological toxicity ranging from 10% to 50%, and this should be classified as accidental biological toxicity.

5.2.2. Normalization of Organic Carbon

The 13 types of PAHs (Nap, Acl, Ace, Flu, Phe, Ant, Fla, Pyr, BaA, Chr, BbF, BkF and BaP) in 39 soil samples were analysed statistically, and the results are shown in Figure 11. Here it can be seen that the content of the 13 types of PAHs in nearly all the soil samples are lower than the TEC value. The one exception was the No. 10 soil sample in which the PAH content was higher than the TEC value (0.29 mg/kg) and lower than the MEC value (1.8 mg/kg). In accordance with the definition of normalization of organic carbon, there is no existing ecological risk from each of the 39 soil samples except the No. 10 soil sample, and the ecological risk of the No. 10 soil sample is accidental.

6. Conclusions

The following conclusions can be drawn from the results of this research.
(1)
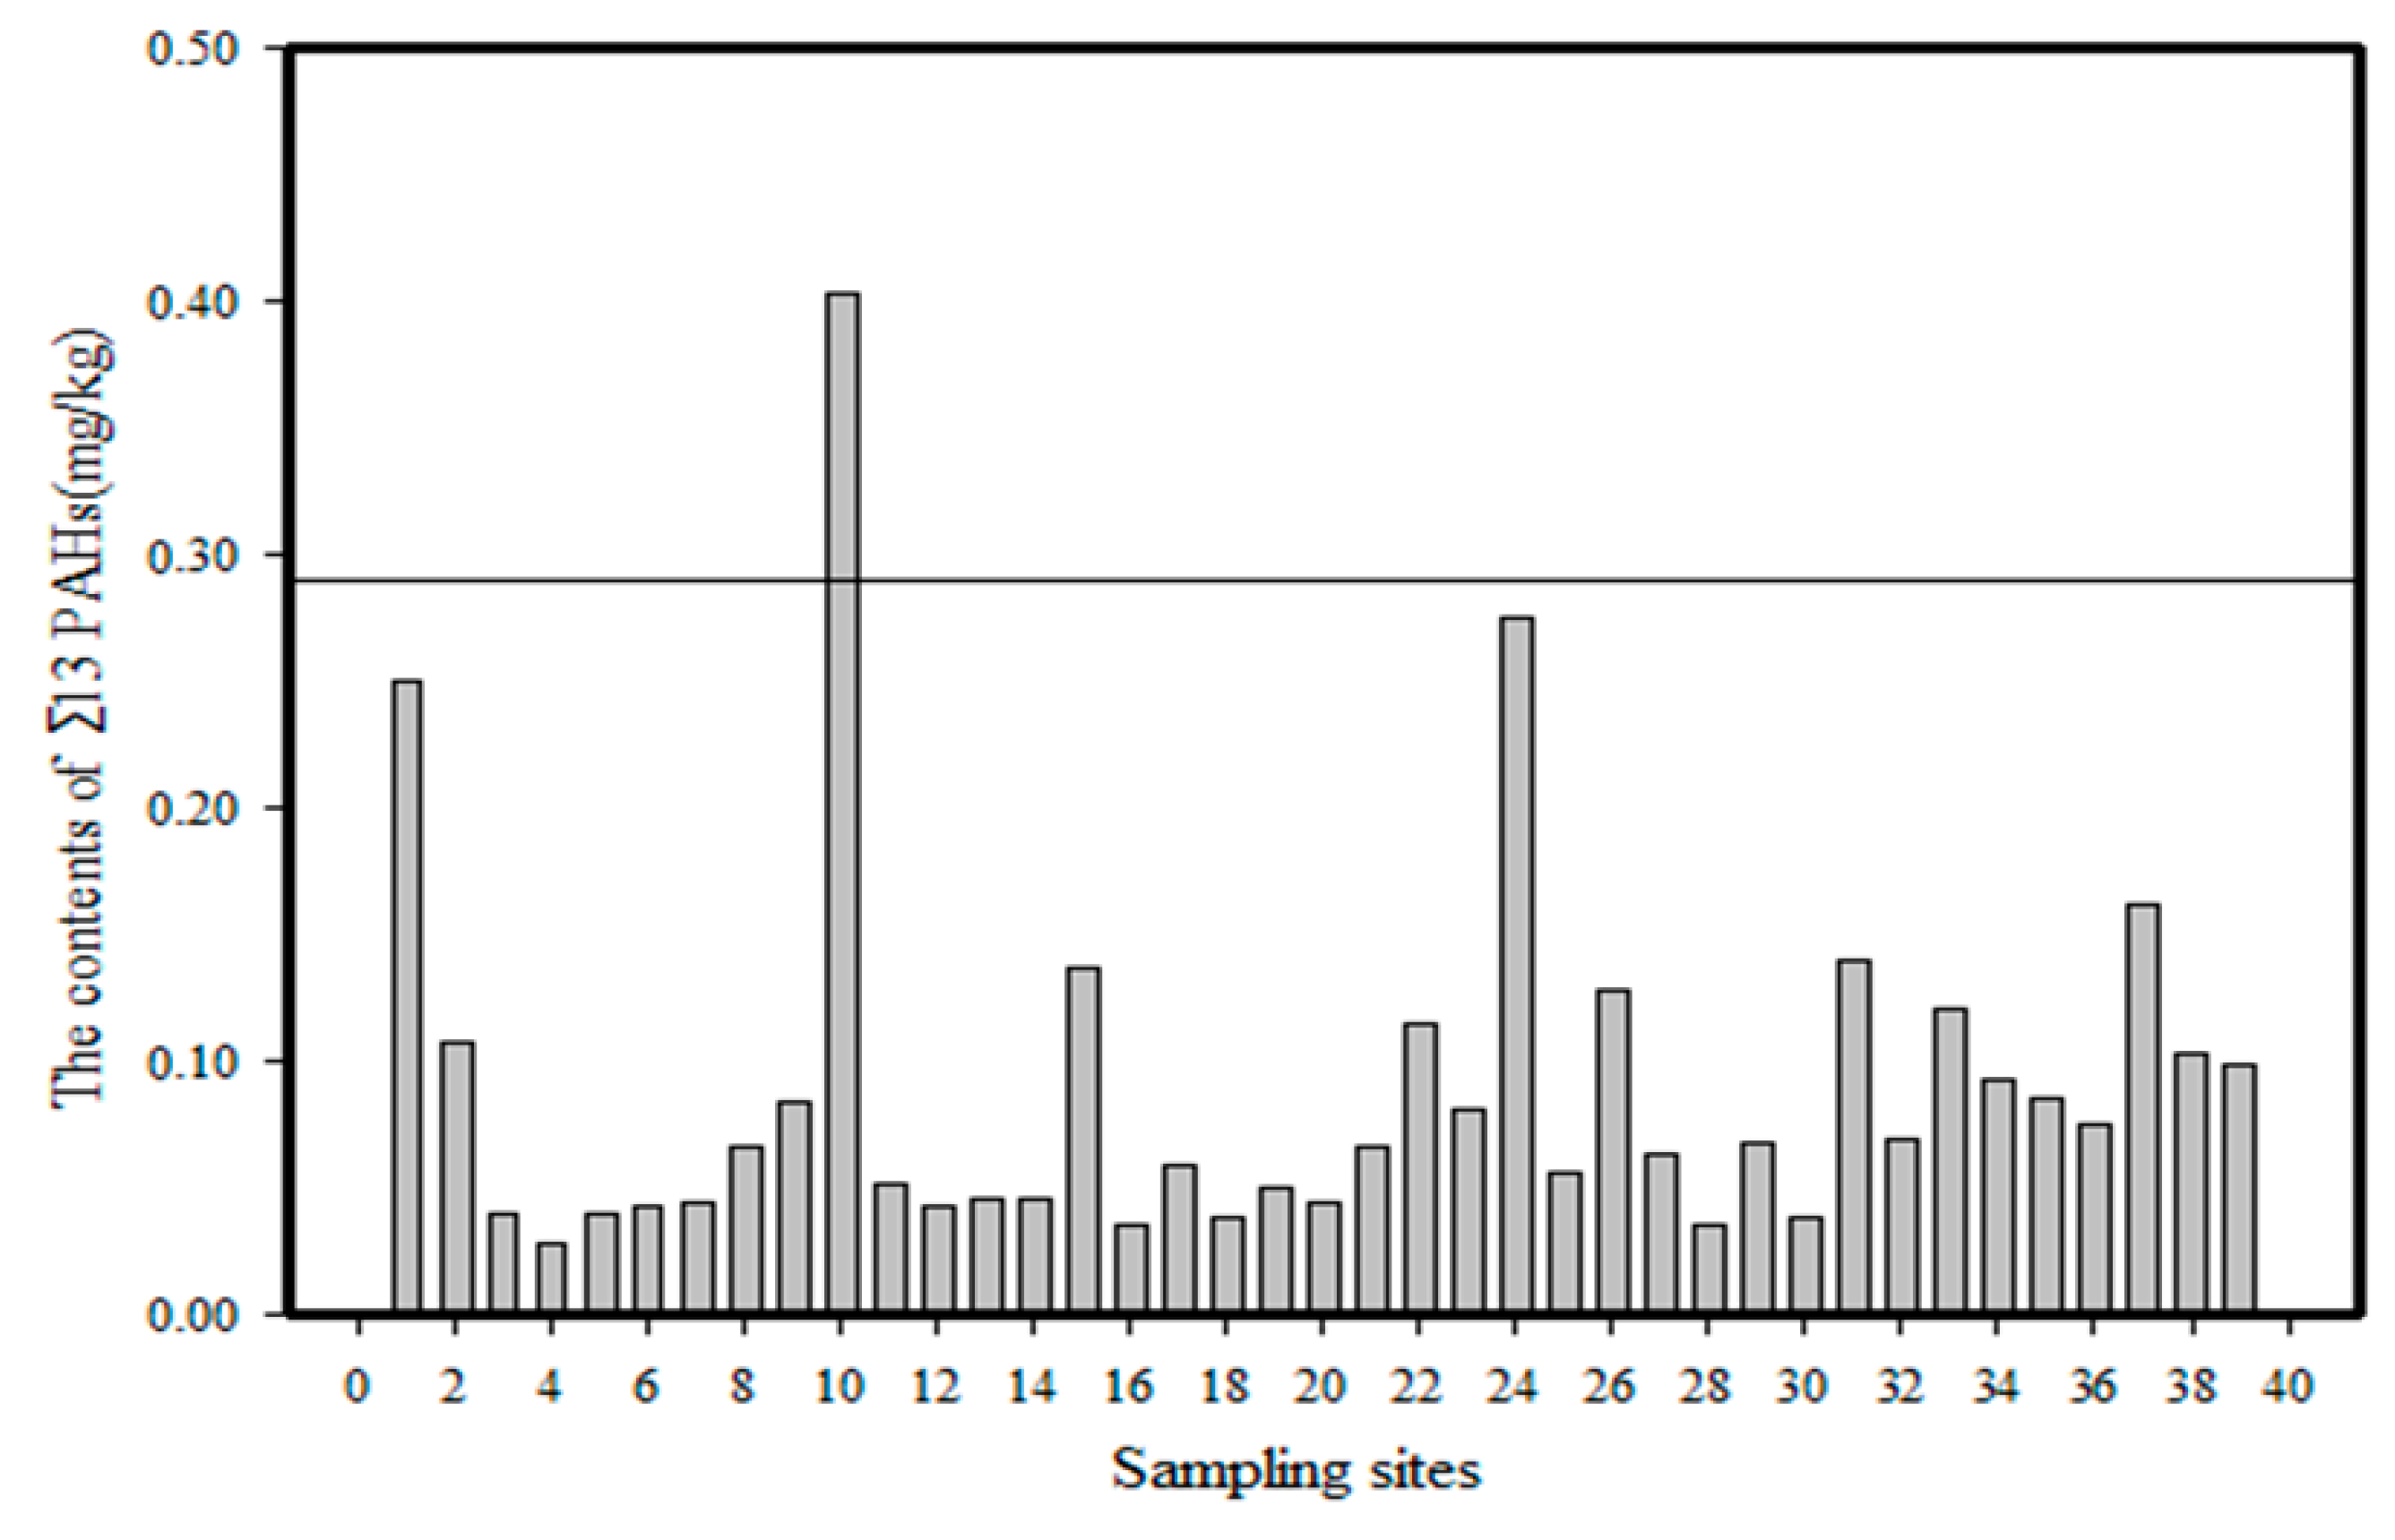
The summarised PAH content (Σ16 PAHs) in the Momoge wetland soil samples was in the range (0.029–0.4152) mg/kg. The average content was 0.096 mg/kg. PAHs in wetland soil were primarily 2–3-rings PAHs. The content of Σ16 PAHs in the No. 10 soil sample was the highest, and that in the No. 4 soil sample was the lowest.
(2)
The diagnostic ratio and PCA-MLR model methods were utilized to conduct source identifications. The results showed that PAHs in the Momoge Wetland soil have multiple sources: petroleum source, combustion of petroleum and combustion of coal. The summation of the combustion of petroleum and coal sources account for 38.0% and 59.3%, respectively.
(3)
By comparing local data with international standards and pollution range methods, we could reach the conclusion that the Nap content in the Momoge wetland soil is excessive, and that there are some sampling sites that exhibit low-grade contamination. The result of biotoxicity and ecological assessments shows that there are two sampling sites with occasional ecological toxic hazards. The result of the organic carbon normalization method shows that only at the 10th sample point does ecological risk currently exist.
(4)
The sources of PAHs in the Momoge Wetland soil are multiple. It should be noted that, in the future, the soil PAHs should be monitored more often and associated with stronger protective measures.

Acknowledgments

This project was supported by the Key Scientific Research Programs of Jilin Province (No. 20140204041SF), a project of the Changchun City Technology Bureau (No. 16SS06), and the Department of Environmental Protection Project of Jilin Province (No. 201501).

Author Contributions

Xuejun Liu and Lianxi Sheng conceived and designed the experiments; Xuejun Liu performed the experiments; Jianling Xu, Hanxi Wang and Xiaoxue Zheng analyzed the data; Xuejun Liu contributed reagents/materials/analysis tools; Xuejun Liu wrote the paper.

Conflicts of Interest

The authors declare no conflict of interest.

References

  1. Wu, Y.; Hao, J.; Li, P. Spatial distribution and change of metal elements in soil in Mount Beigu wetland. J. Jiangsu Univ. (Nat. Sci. Ed.) 2005, 26, 340–344. (In Chinese) [Google Scholar]
  2. State Forestry Administration Bureau of China. 2nd National Wetland Resource Survey. Available online: http://www.forestry.gov.cn/main/65/content-758154.html (accessed on 16 November 2016).
  3. Zhu, X.; Sun, Q. Review of Wetland Research. J. Jiangxi For. Technol. 2007, 3, 47–49. (In Chinese) [Google Scholar]
  4. He, C.; Zhao, K.; Yu, G.; Zhao, Z.; Wang, G. Research Progress of Wetland Ecological Process. Adv. Earth Sci. 2000, 15, 164–171. [Google Scholar]
  5. Liu, Q.; Xie, W.; You, J.; Zhao, X.; Lu, Z. Environmentally Chemical Behaviors of Heavy Metals in Wetland Sediments: A Review. Soils 2013, 45, 8–16. (In Chinese) [Google Scholar]
  6. Xu, X.; Huang, S. Advances in studies on migration and transformation of polycyclic aromatic hydrocarbons in surface water. Environ. Sci. Technol. 2011, 34, 26–33. [Google Scholar]
  7. Wise, S.A.; Sander, L.C.; Schantz, M.M. Analytical Methods for Determination of Polycyclic Aromatic Hydrocarbons (PAHs)—A Historical Perspective on the 16 U.S. EPA Priority Pollutant PAHs. Polycycl. Aromat. Compd. 2015, 35, 109–134. [Google Scholar] [CrossRef]
  8. Ma, J.; Zhai, Y.; Wang, D. PAHs Enrichment and Influence in the Songhua River water environment on ecological environment. Environ. Sci. Manag. 2006, 31, 91–92. [Google Scholar]
  9. Dong, J. Modelling Environmental Fate and Risk Assessment of Polycyclic Aromatic Hydrocarbons in the Lanzhou Area. Doctoral Thesis, Lanzhou University, Lanzhou, China, May 2010. [Google Scholar]
  10. Cao, W.; Qiao, M.; Zhang, Y.; Liu, B. Removal of Polycyclic Aromatic Hydrocarbons (PAHs) and Their Derivatives in Typical Sewage Treatment Plants and Health Risk of Reclaimed Water. Asian J. Ecotoxicol. 2016, 11, 173–179. [Google Scholar]
  11. Momoge National Natural Reserve of Jilin Province. Available online: http://mmgnr.forestry.gov.cn/publicfiles/business/htmlfiles/mmgbhq/stzy/201305/16530.html (accessed on 16 November 2016).
  12. Pan, X.; Zhang, D.; Quan, L. Interactive factors leading to dying-off Carextato in Momoge wetland polluted by crude oil, Western Jilin, China. Chemosphere 2006, 65, 1772–1777. [Google Scholar] [CrossRef] [PubMed]
  13. Yuan, J.; Zhang, N.; Cao, Y. Protection and development of tourism resource in Momoge national natural reserve. J. Northeast Norm. Univ. (Nat. Sci. Ed.) 2005, 37, 109–114. (In Chinese) [Google Scholar]
  14. U.S. EPA. Method 3570: Microscale Solvent Extraction from Solids. Washington, DC: US Environmental Protection Agency; 2002. Available online: http://www.epa.gov/epaoswer/hazwaste/test/pdfs/3570.pdf (assessed on 17 November 2016). [Google Scholar]
  15. U.S. EPA. Method 8270D: Semivolatile Organic Compounds by Gas Chromatography/Mass Spectrometry (GC/MS). Washington, DC: US Environmental Protection Agency; 1996. Available online: http://www.epa.gov/epawaste/hazard/testmethods/sw846/pdfs/8270d.pdf (assessed on 17 November 2016). [Google Scholar]
  16. Zhao, L.; Hou, H.; Shangguan, Y.; Cheng, B.; Xu, Y.; Zhao, R.; Zhang, Y.; Hua, X. Occurrence, sources, and potential human health risks of polycyclic aromatic hydrocarbons in agricultural soils of the coal production area surrounding Xinzhou, China. Ecotoxicol. Environ. Saf. 2014, 108, 120–128. [Google Scholar] [CrossRef] [PubMed]
  17. Soclo, H.H.; Garrigues, P.; Ewald, M. Origin of polycyclic aromatic hydrocarbons (PAHs) in coastal marine sediments: Case studies in Cotonou (Benin) and Aquitaine (France) areas. Mar. Pollut. Bull. 2000, 40, 387–396. [Google Scholar] [CrossRef]
  18. Yunker, M.B.; Macdonald, R.W.; Goyette, D.; Paton, D.W.; Fowler, B.R.; Sullivan, D.; Boyd, J. Natural and anthropogenic inputs of hydrocarbons to the Strait of Georgia. Sci. Total Environ. 1999, 225, 181–209. [Google Scholar] [CrossRef]
  19. Sofowote, U.M.; Mccarry, B.E.; Marvin, C.H. Source apportionment of PAH in Hamilton Harbour suspended sediments: Comparison of two factor analysis methods. Environ. Sci. Technol. 2008, 42, 6007–6014. [Google Scholar] [CrossRef] [PubMed]
  20. Wang, K.; Shen, Y.; Zhang, S.; Ye, Y.; Shen, Q.; Hu, J.; Wang, X. Application of spatial analysis and multivariate analysis techniques in distribution and source study of polycyclic aromatic hydrocarbons in the topsoil of Beijing, China. Environ. Geol. 2009, 56, 1041–1050. [Google Scholar] [CrossRef]
  21. Yang, Z.; Wang, L.; Niu, J.; Wang, J.; Shen, Z. Pollution assessment and source identifications of polycyclic aromatic hydrocarbons in sediments of the Yellow River Delta, a newly born wetland in China. Environ. Monit. Assess. 2009, 158, 561–571. [Google Scholar] [CrossRef] [PubMed]
  22. Dutch Ministry of Housing, Spatial Planning and Environment. Dutch Target and Intervention Values; ANNEXES Circular on Target Values and Intervention Values for Soil Remediation. Available online: http://159.226.251.229/videoplayer/annexS_I2000Dutch%20Environmental%20Standards.pdf?ich_u_r_i=954de0071dbc21ae8bf19c80e0e18d9d&ich_s_t_a_r_t=0&ich_e_n_d=0&ich_k_e_y=1745018916750263292454&ich_t_y_p_e=1&ich_d_i_s_k_i_d=6&ich_u_n_i_t=1 (accessed on 17 November 2016).
  23. Barbara, M.K. Polycyclic aromatic hydrocarbons in agricultural soils in Poland: Preliminary proposals for criteria to evaluate the level of soil contamination. Appl. Geochem. 1996, 11, 121–127. [Google Scholar]
  24. Long, E.R.; Macdonald, D.D.; Smith, S.L.; Calder, F.D. Incidence of adverse biological effects within ranges of chemical concentrations in marine and estuary sediments. Environ. Manag. 1995, 19, 81–97. [Google Scholar] [CrossRef]
  25. Swartz, R.C. Consensus sediment quality guidelines for polycyclic aromatic hydrocarbons mixtures. Environ. Toxicol. Chem. 1999, 18, 780–787. [Google Scholar] [CrossRef]
  26. Zhou, H.; Zhao, J.; Lu, J.; Wang, Y.; Yuan, H.; Wan, X. Distribution, sources and ecological risk assessment of polycyclic aromatic hydrocarbons in sediments from Baiyangdian wetland. Asian J. Ecotoxicol. 2008, 3, 291–299. (In Chinese) [Google Scholar]
  27. Wang, Z.; Liu, Z.; Yang, Y.; Liu, M. Distribution of PAHs in tissues of wetland plants and the surrounding sediments in the Chongming wetland, Shanghai, China. Chemosphere 2012, 89, 221–227. [Google Scholar] [CrossRef] [PubMed]
  28. Yang, W.; Lang, Y.; Li, G.; Liu, W. Distribution of polycyclic aromatic hydrocarbons (PAHs) and health risk assessment in Jiaozhou bay wetland. Environ. Chem. 2013, 10, 1989–1990. (In Chinese) [Google Scholar]
  29. Liao, S.; Lang, Y.; Wang, Y. Distribution and sources of PAHs in soil from Liaohe Estuarine wetland. Environ. Sci. 2011, 32, 1094–1100. [Google Scholar]
  30. Yuan, H.; Ye, S.; Gao, M.; He, X. Distribution and Ecological Risk Assessment of Polycyclic Aromatic Hydrocarbons (PAHs) in the Surface Soil of Wetlands in the Southern Yellow River. Mar. Geol. Front. 2011, 27, 24–28. (In Chinese) [Google Scholar]
  31. Yuan, H.; Zhao, G.; Pang, S.; Gao, G.; Ye, S. Polycylic aromatic hydrocarbons (PAHs) exposure and their source analysis in the northern wetland of the yellow river delta. Mar. Geol. Quat. Geol. 2008, 26, 57–62. (In Chinese) [Google Scholar]
  32. Zhang, Y.; Liu, M.; Chen, H.; Hou, G. Source identification of polycyclic aromatic hydrocarbons in different ecological wetland components of the Qinkenpao Wetland in Northeast China. Ecotoxicol. Environ. Saf. 2014, 102, 160–167. [Google Scholar] [CrossRef] [PubMed]
  33. Zhang, Y. The Distribution and Source Analysis of PAHs in the Typical Wetlands of Sanjiang Plain. Master’s Thesis, Jilin University, Changchun, China, June 2013. [Google Scholar]
  34. Liu, J.; Qi, S.; Zhang, G.; Zhang, W. Polycyclic aromatic hydrocarbons in Lalu wetland of Lasa city and their source. Geophys. Geochem. Explor. 2003, 27, 490–492. (In Chinese) [Google Scholar]
  35. R, X.; Bai, J.; Wang, J.; Lu, Q.; Zhao, Q.; Cui, B.; Liu, X. Polycyclic aromatic hydrocarbons (PAHs) in wetland soils under different land uses in a coastal estuary: Toxic levels, sources and relationships with soil organic matter and water-stable aggregates. Chemosphere 2014, 110, 8–16. [Google Scholar]
  36. Kimbrough, K.L.; Dickhut, R.M. Assessment of polycyclic aromatic hydrocarbon input to urban wetlands in relation to adjacent land use. Mar. Pollut. Bull. 2006, 52, 1355–1363. [Google Scholar] [CrossRef] [PubMed]
  37. Sartori, F.; Wade, T.L.; Sericano, J.T.; Mohanty, B.P.; Smith, K.A. Polycyclic aromatic hydrocarbons in soil of the Canadian river floodplain in Oklahoma. J. Environ. Manag. 2010, 39, 568–579. [Google Scholar] [CrossRef] [PubMed]
Figure 1. Location of sampling sites in the Momoge Wetland.
Ijerph 14 00085 g001
Figure 2. The polycyclic aromatic hydrocarbon (PAHs) content in the soils of the Momoge Wetland.
Ijerph 14 00085 g002
Figure 3. The contents of PAHs in soils of the Momoge Wetland.
Ijerph 14 00085 g003
Figure 4. The contents of PAHs in Momoge Wetland soils.
Ijerph 14 00085 g004
Figure 5. Source identifications of PAHs in soils of the Momoge Wetland (1).
Ijerph 14 00085 g005
Figure 6. Source identifications of PAHs in soils of the Momoge Wetland (2).
Ijerph 14 00085 g006
Figure 7. Source identifications of PAHs in soils of the Momoge Wetland (3).
Ijerph 14 00085 g007
Figure 8. The Principal component loading plot of 16 PAHs.
Ijerph 14 00085 g008
Figure 9. Comparison of the determinations with standard values for PAHs of soils in the Momoge Wetland.
Ijerph 14 00085 g009
Figure 10. Degree of PAH contamination of the soil in Momoge Wetland.
Ijerph 14 00085 g010
Figure 11. Ecological risk assessment based on organic carbon normalization method of PAHs in soils of the Momoge Wetland.
Ijerph 14 00085 g011
Table 1. Recovery efficiencies of 16 polycyclic aromatic hydrocarbons (PAHs).
PAHsRate of Recovery (%)PAHsRate of Recovery (%)
Nap89–109BaA103–125
Acl107–116Chr87–106
Ace92–113BbF110–116
Flu100–125BkF101–109
Phe93–116BaP90–115
Ant99–123Ind98–109
F1a105–129Dah90–91
Pyr112–101Bghi104–106
Table 2. The PAH content in wetlands at home and abroad.
DistrictRange of the Contents of 16 PAHs (mg/kg)
Baiyangdian Wetland [26]0.325–1.739 *
Chongming Wetland in Shanghai [27]0.039–0.136
Jiaozhou Bay Wetland [28]0.176–0.563
Liaohe Estuary Wetland [29]0.293–1.937
south of Yellow River Delta Wetland [30]0.071–1.826
north of Yellow River Delta Wetland [31]0.027–0.129
Qinkenpa Wetland in Daqing [32]0.023–0.250
typical wetland in Three-river-plain [33]2.909–5.645
Lalu Wetland in Tibet [34]0.082–0.195
Zhujiang Estuary Wetland [35]0.427–1.019
estuary wetland in Elizabeth [36]1.200–22.200
floodplains wetland in Canada [37]0.016–12.000
This study0.029–0.415
* Refers to the contents of 15 types of PAHs, except for Chr, which was found in the Baiyangdian Wetland.
Table 3. The component matrix of PAHs in soil samples of the Momoge Wetland.
PAHsPrincipal Component
123
Nap0.4310.812−0.170
Acl0.7810.1940.046
Ace0.4690.7080.060
Flu0.5530.7700.017
Phe0.8020.2420.265
Ant0.0640.2760.782
Fla0.918−0.2350.217
Pyr0.879−0.3010.259
BaA0.804−0.083−0.187
Chr0.906−0.2980.105
BbF0.930−0.3170.127
BkF0.907−0.141−0.017
BaP0.818−0.145−0.270
Ind0.923−0.198−0.135
Dah0.5380.328−0.359
Bghi0.873−0.124−0.228
Eigenvalues9.3132.4701.165
Variance %58.20415.4417.281
Cumulative variance %58.20473.64580.926
Table 4. Multiple linear regression (MLR) results.
Principal ComponentPC1PC2PC3
Source of PAHsCombustion source of petroleum and coalPetroleum sourceOther source
Standardized regression coefficient0.810.519−0.037
Contribution ratio59.3%38.0%2.7%
Conditional probability0.0000.0000.384
Coefficient of determination0.942
Table 5. Biological toxicity assessment form of PAHs in soils of the Momoge Wetland.
PAHsERL (mg/kg)ERM (mg/kg)Range of Concentration (mg/kg)Number of Samples with a Concentration Less than ERL
Nap0.16002.10000.0041–0.295537
Acl0.04400.64000.0000–0.003639
Ace0.01600.50000.0000–0.004739
Flu0.01900.54000.0020–0.015639
Phe0.24001.50000.0122–0.074139
Ant0.08531.10000.0005–0.016939
Fla0.60005.10000.0020–0.046539
Pyr0.66502.60000.0010–0.040939
BaA0.26101.60000.0010–0.006239
Chr0.38402.80000.0000–0.019939
BbF0.0000–0.0388-
BkF0.0000–0.0051-
BaP0.43001.60000.0005–0.004639
Ind0.0000–0.0097-
Dah0.06340.26000.0000–0.006639
Bghi0.0000–0.0127-
Σ16 PAHs4.022044.7920.0290–0.415239
“-“: It represent that it can’t count number of samples with a concentration less than ERL.

