Evaluation of Environmental Risk Due to Metro System Construction in Jinan, China

 ,
,
Abstract
:1. Introduction
2. Study Area and Data Sources
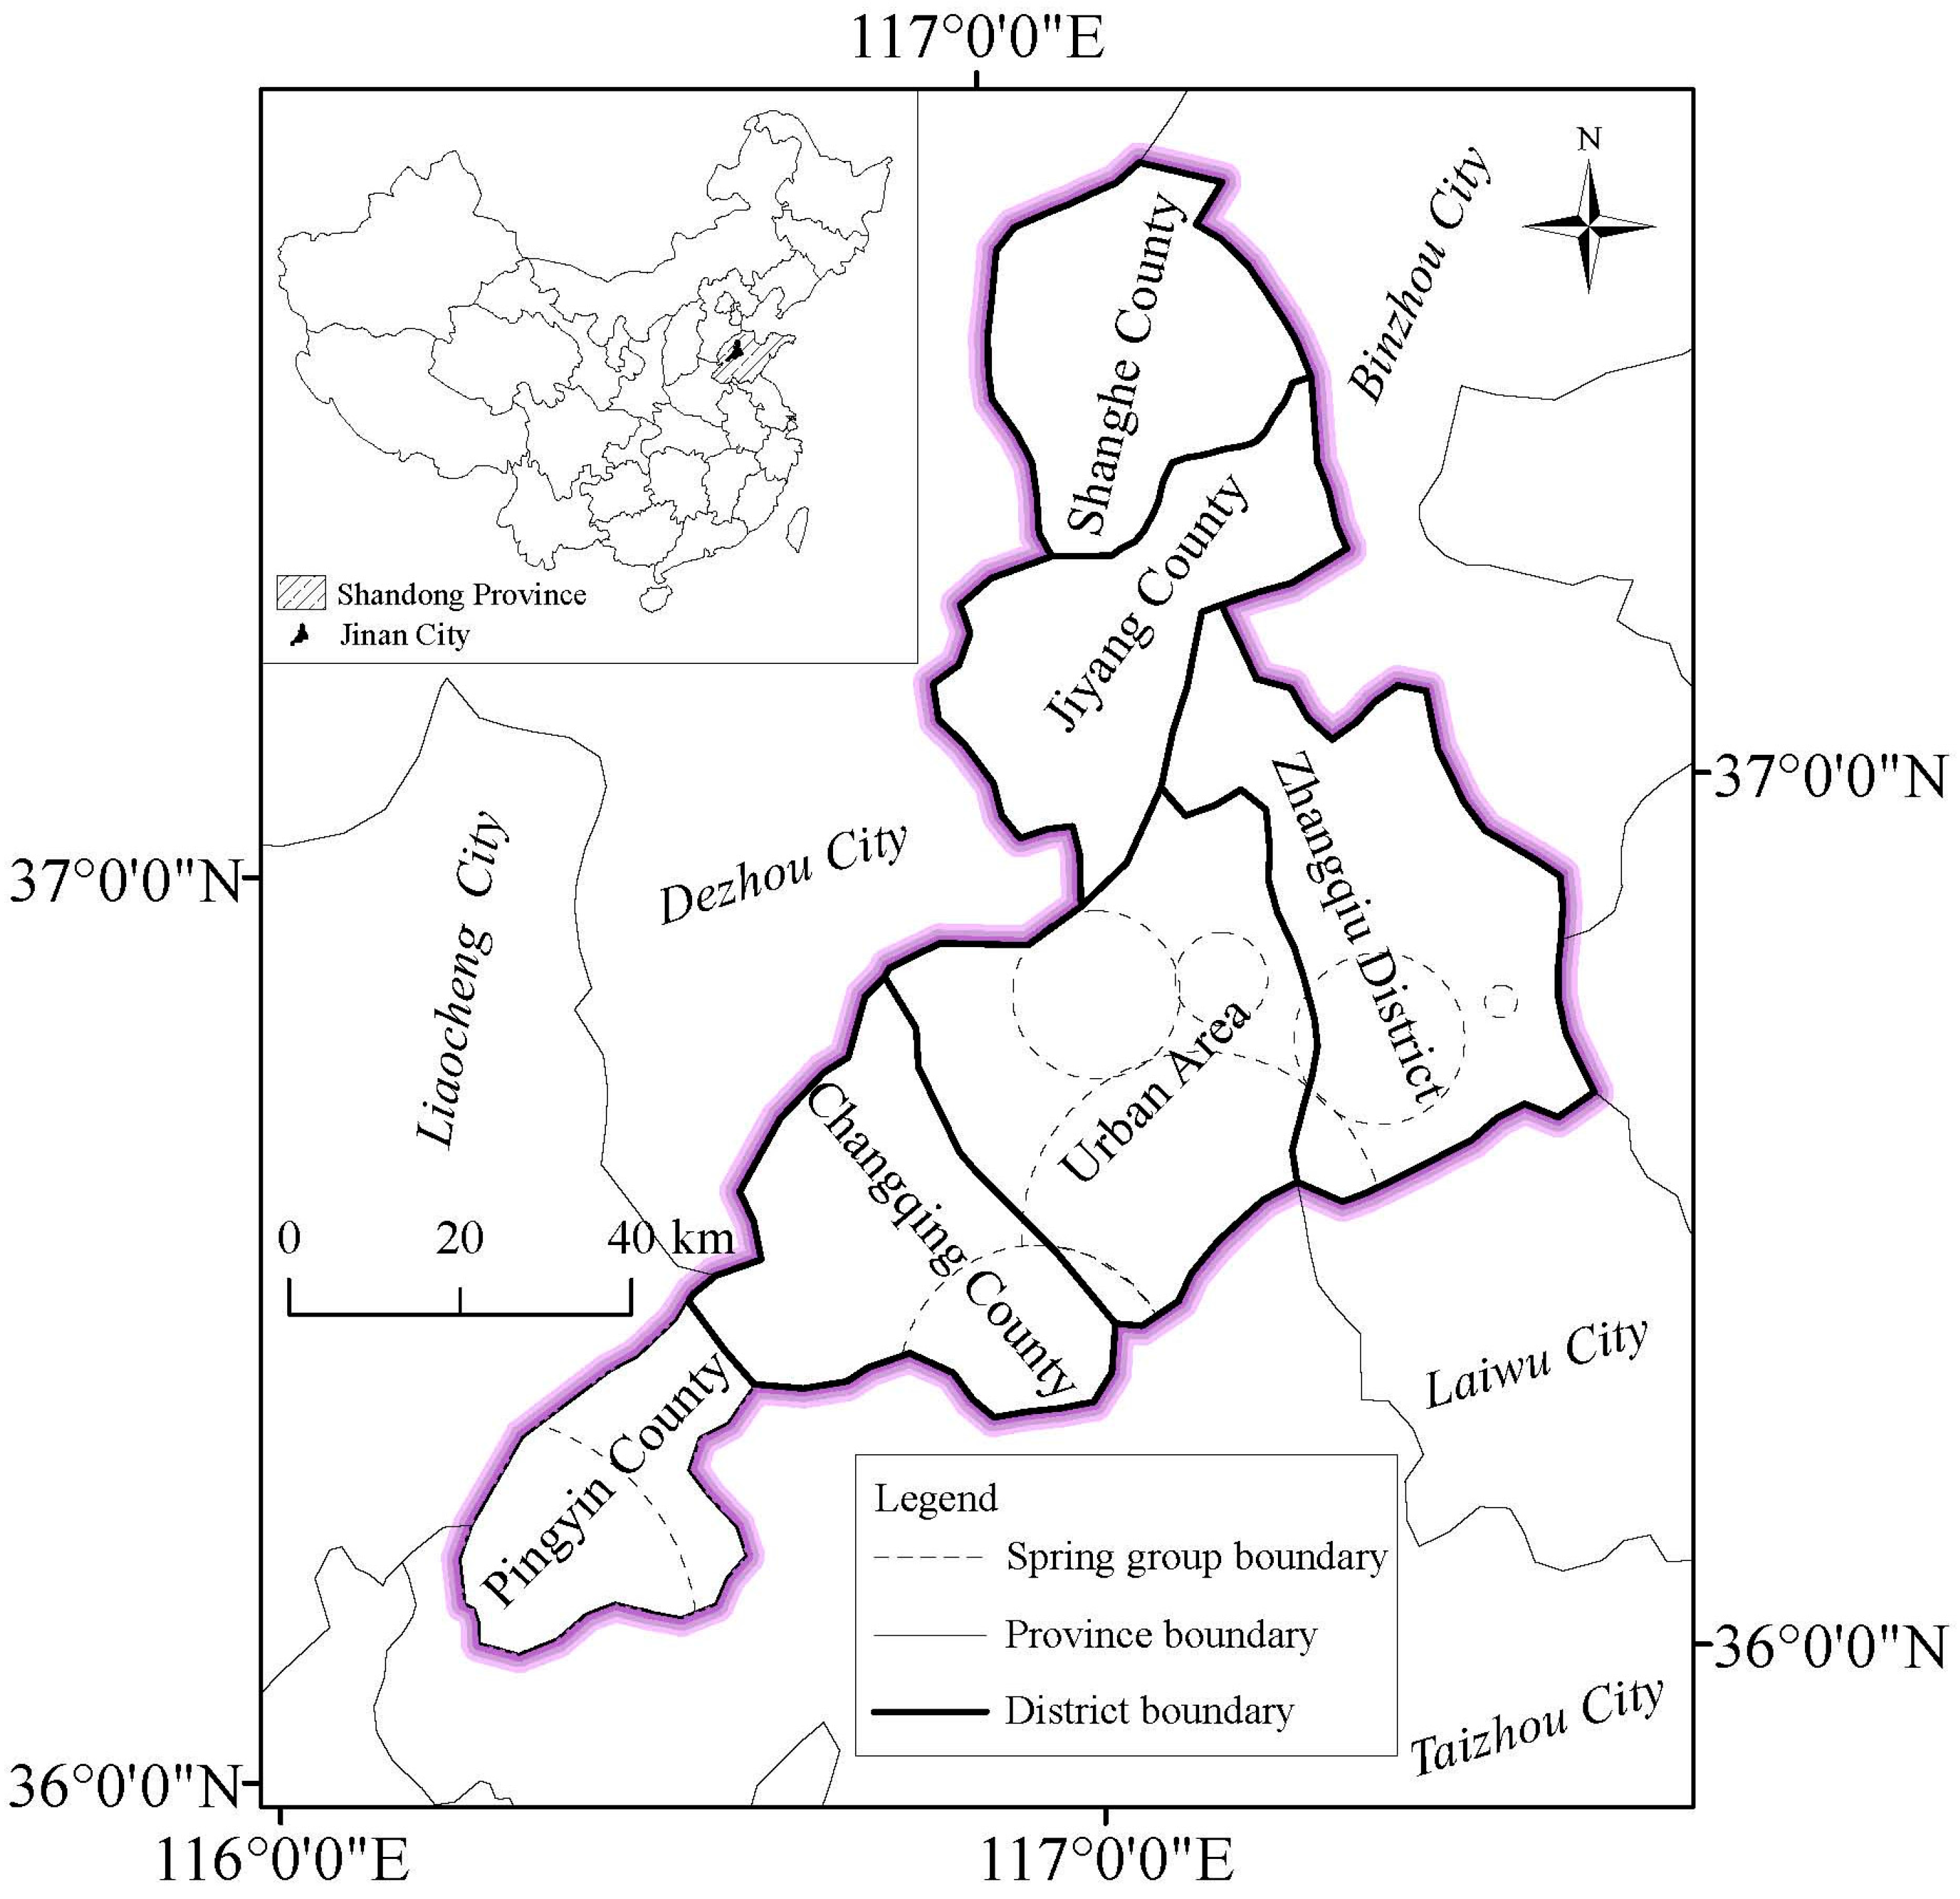
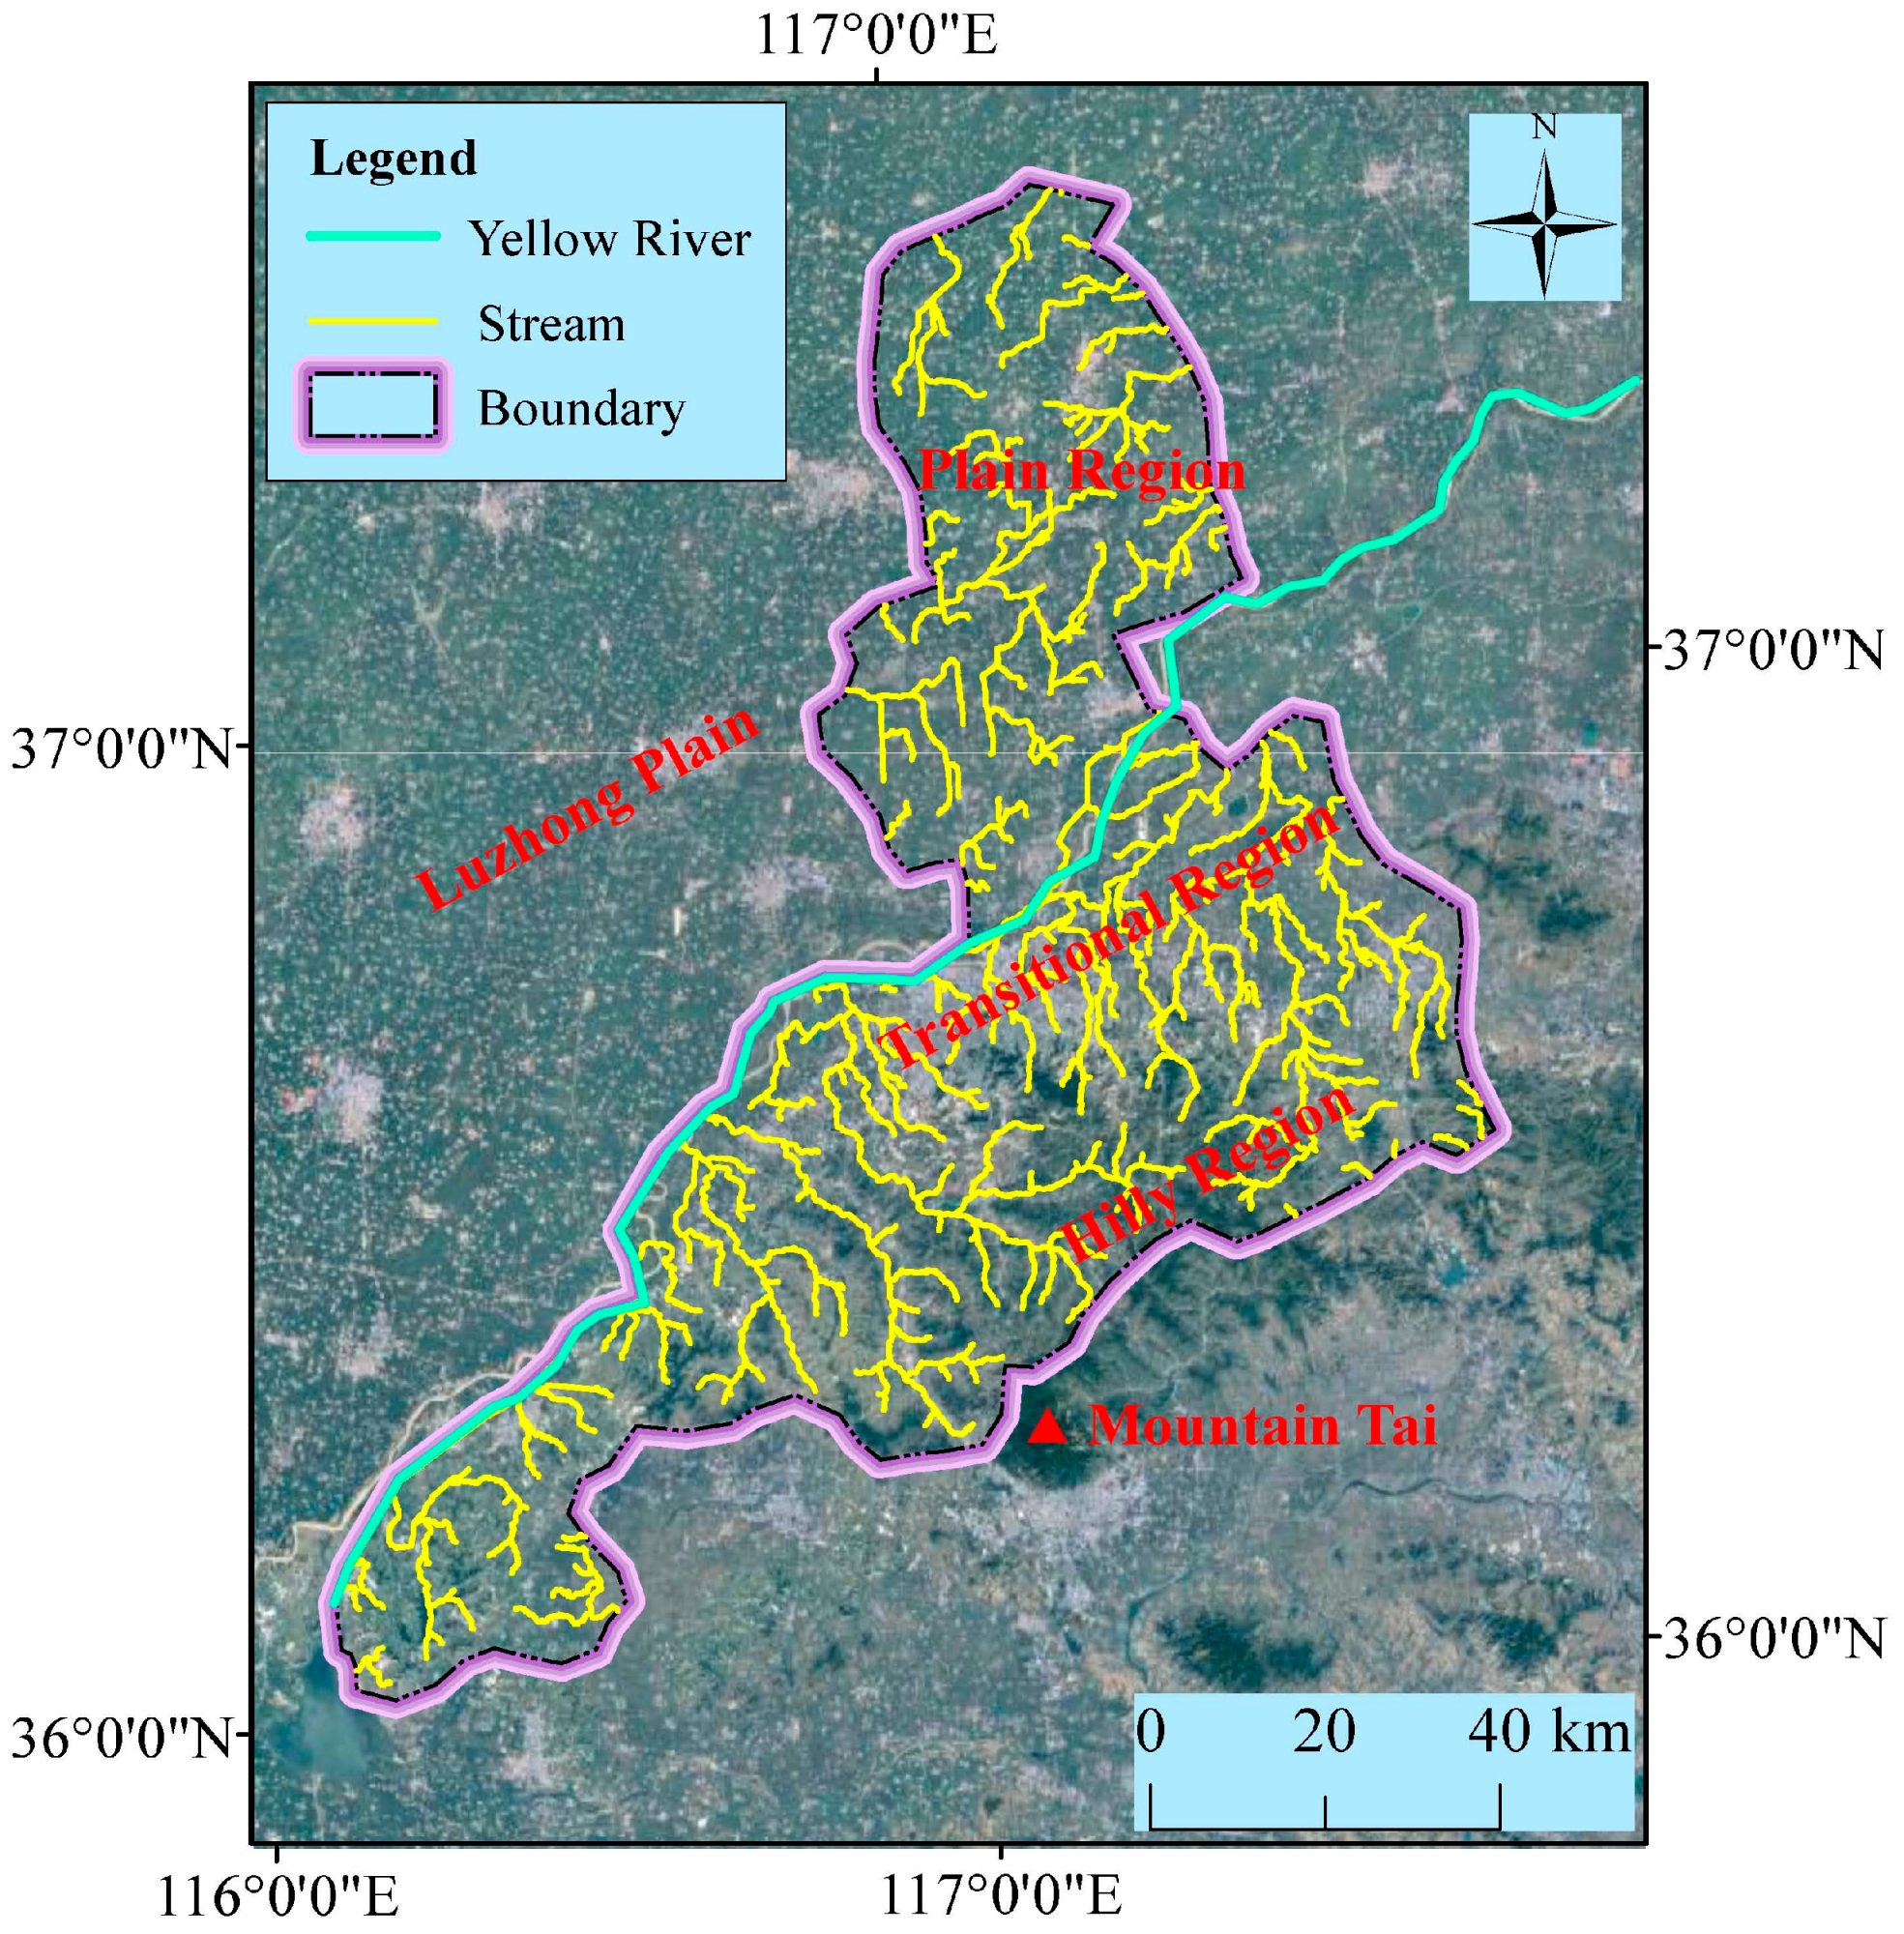
2.1. Study Area
2.2. Data Sources
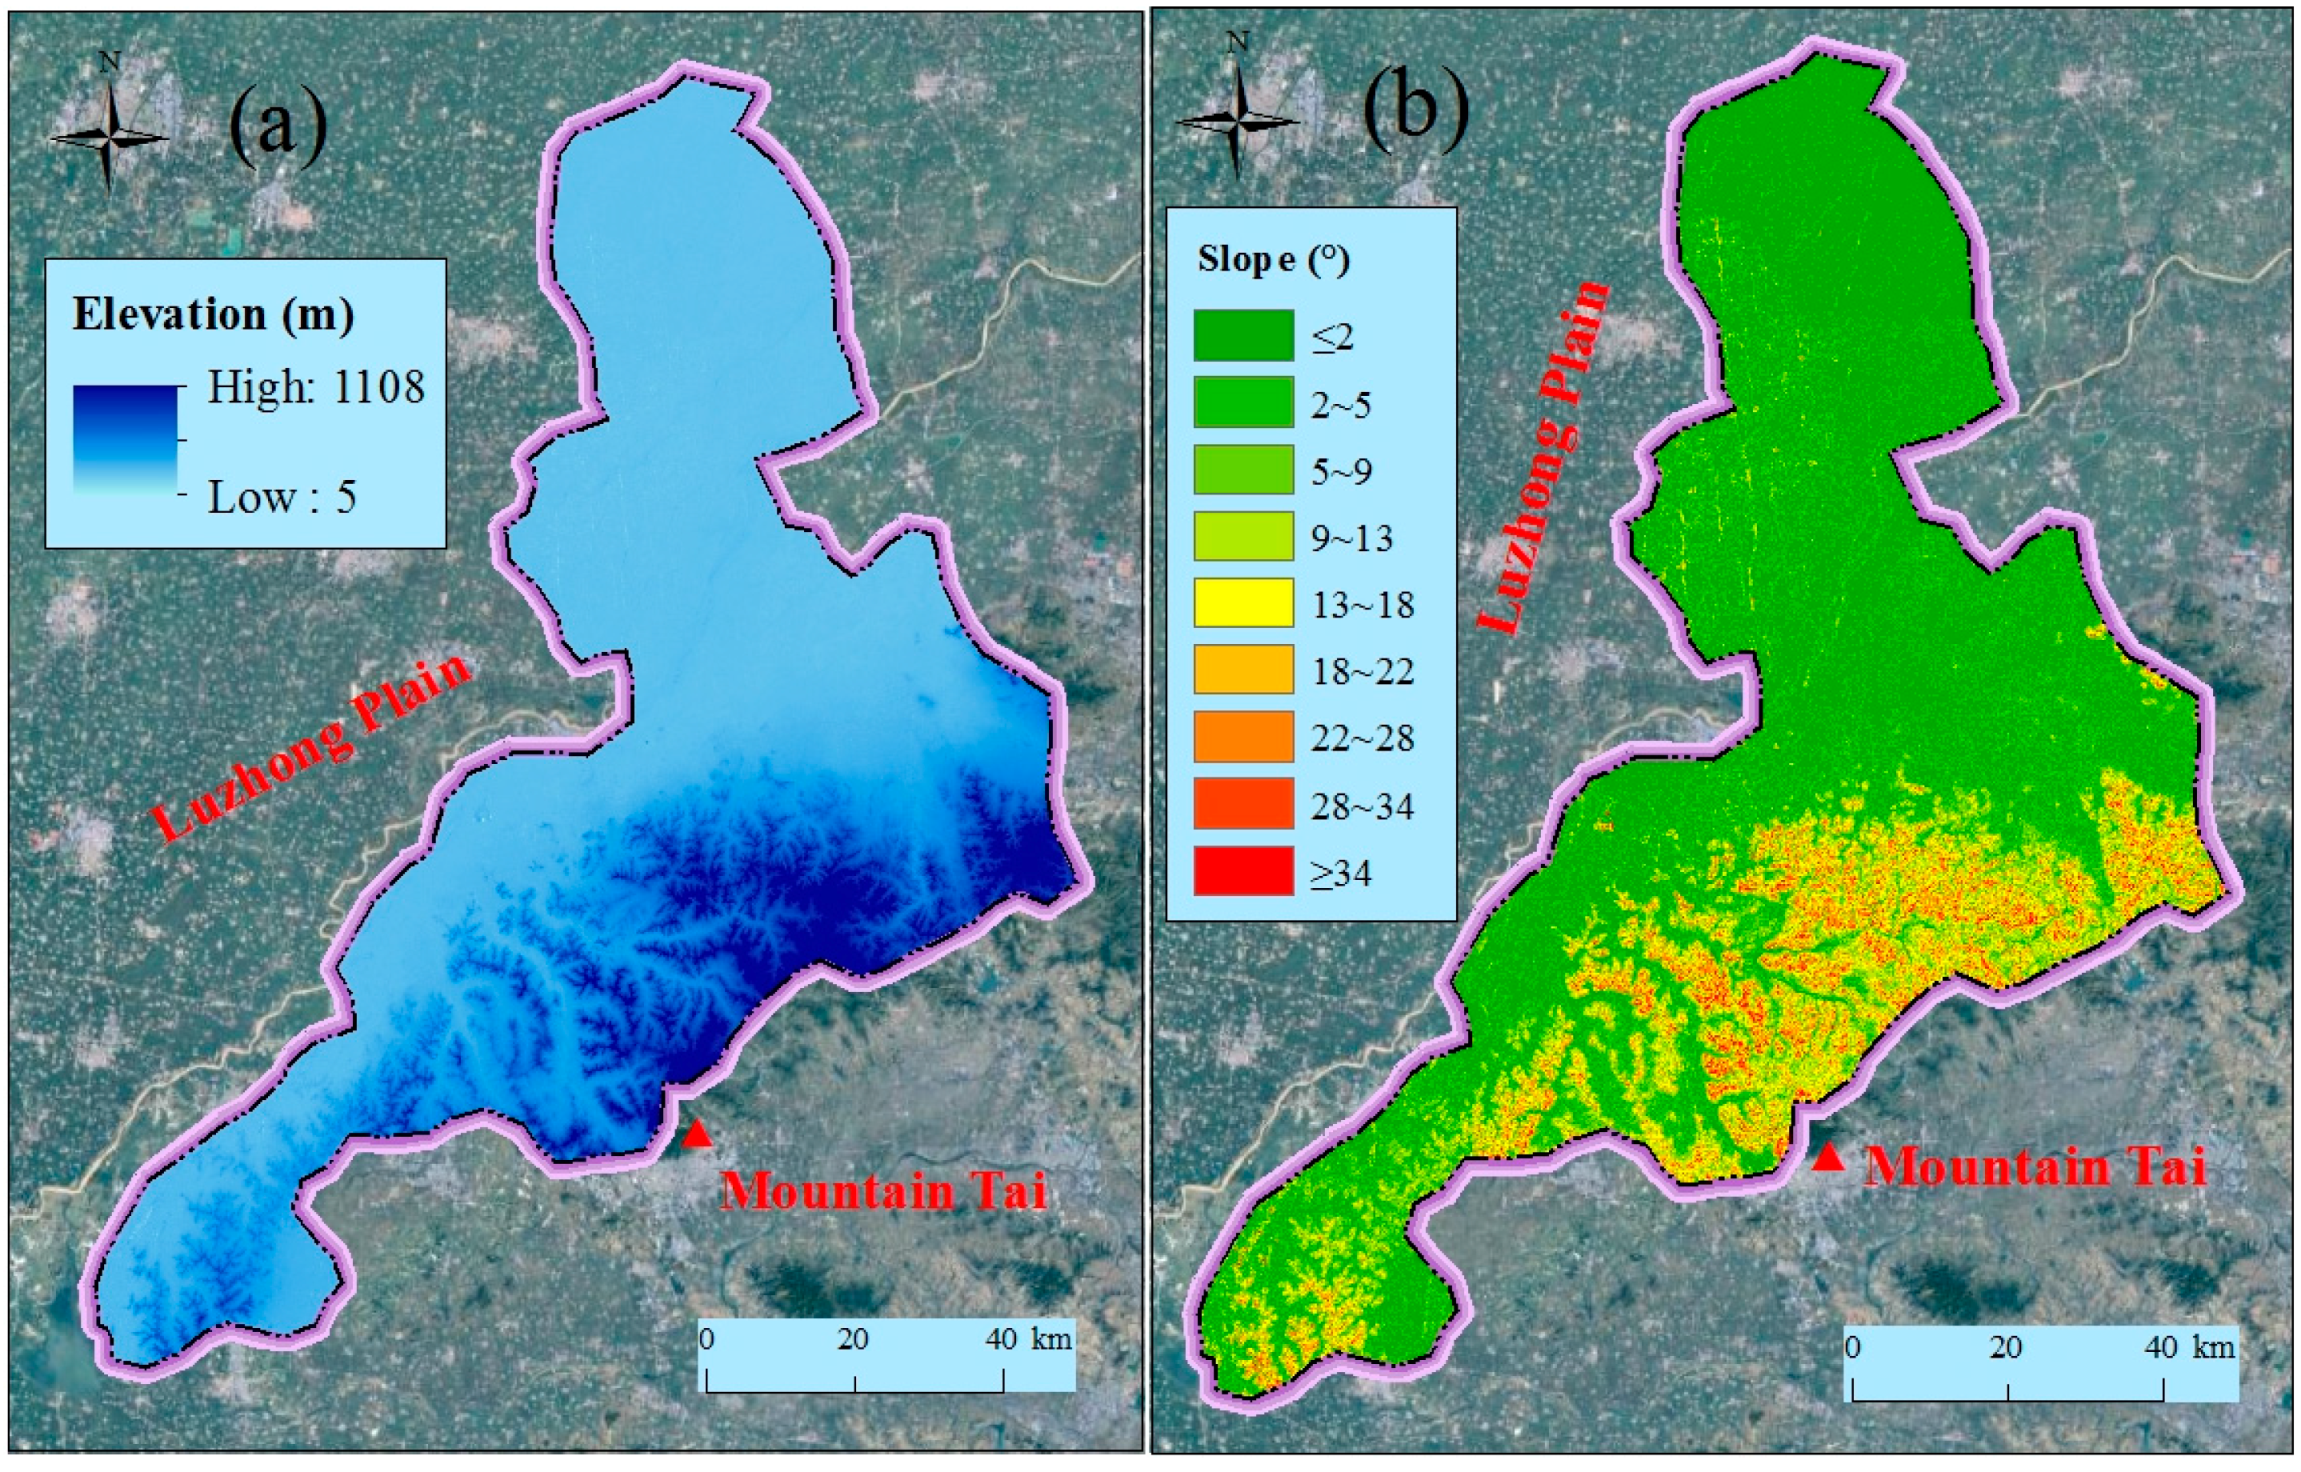
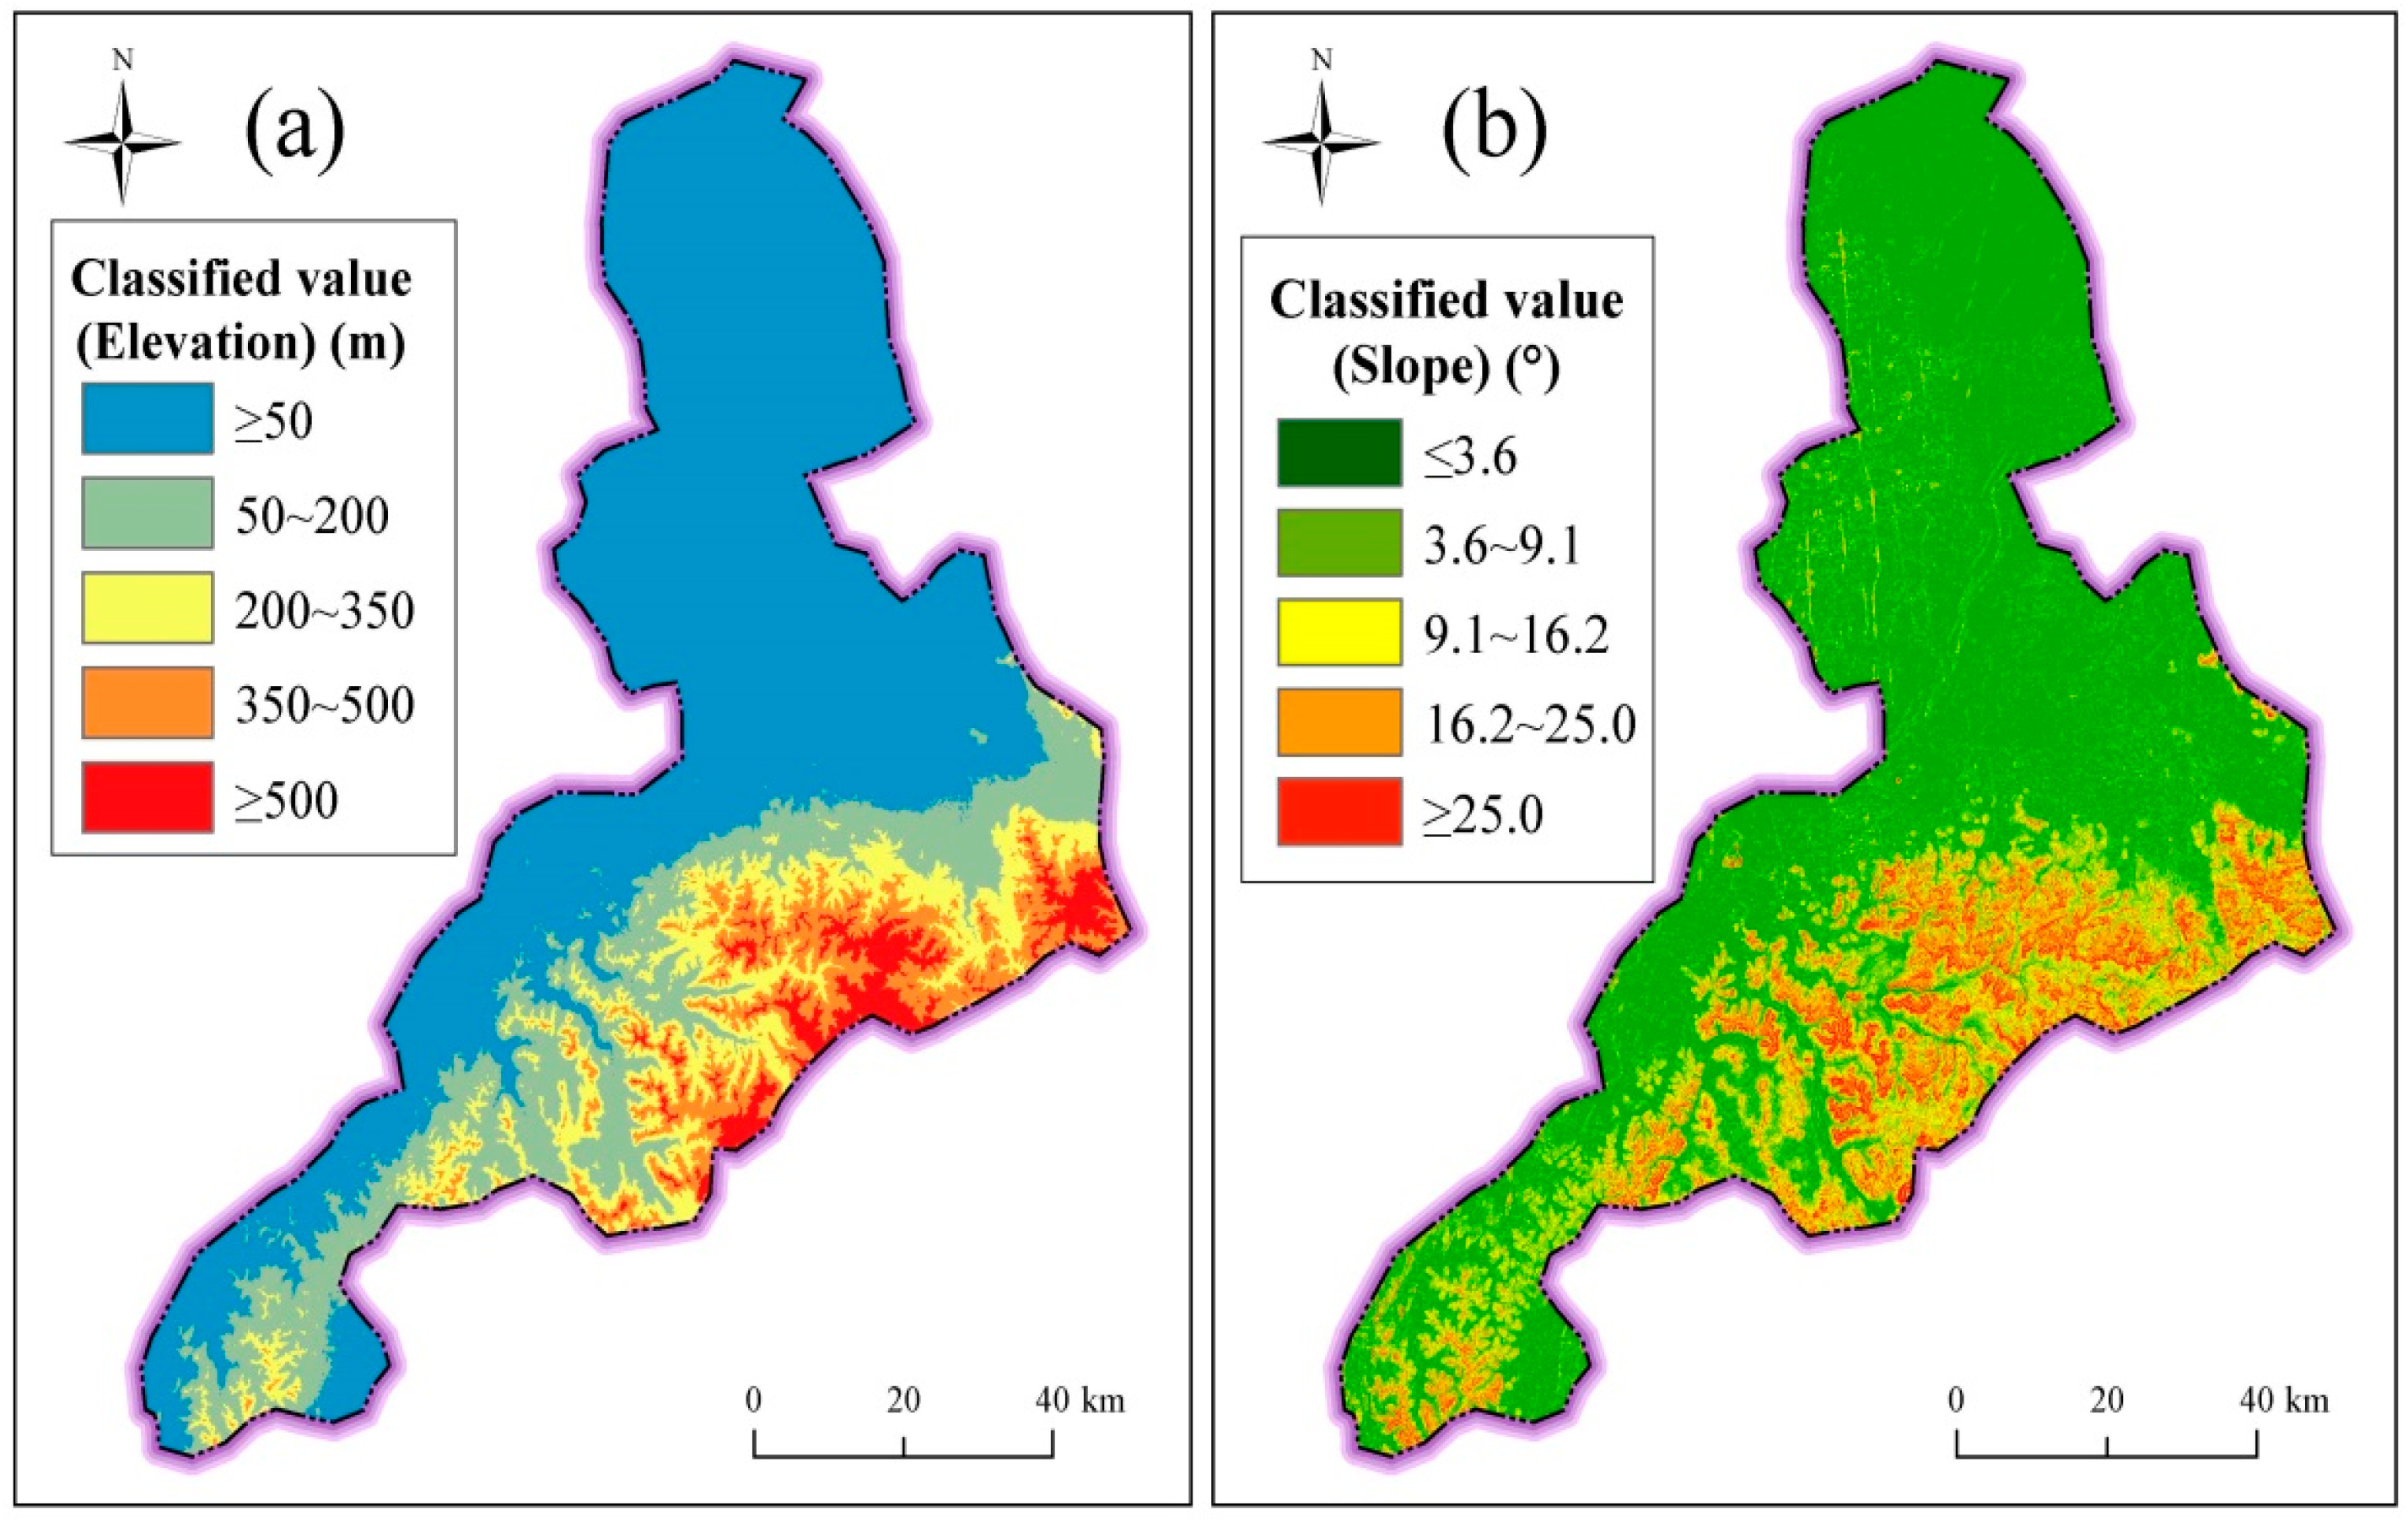
2.2.1. Topography
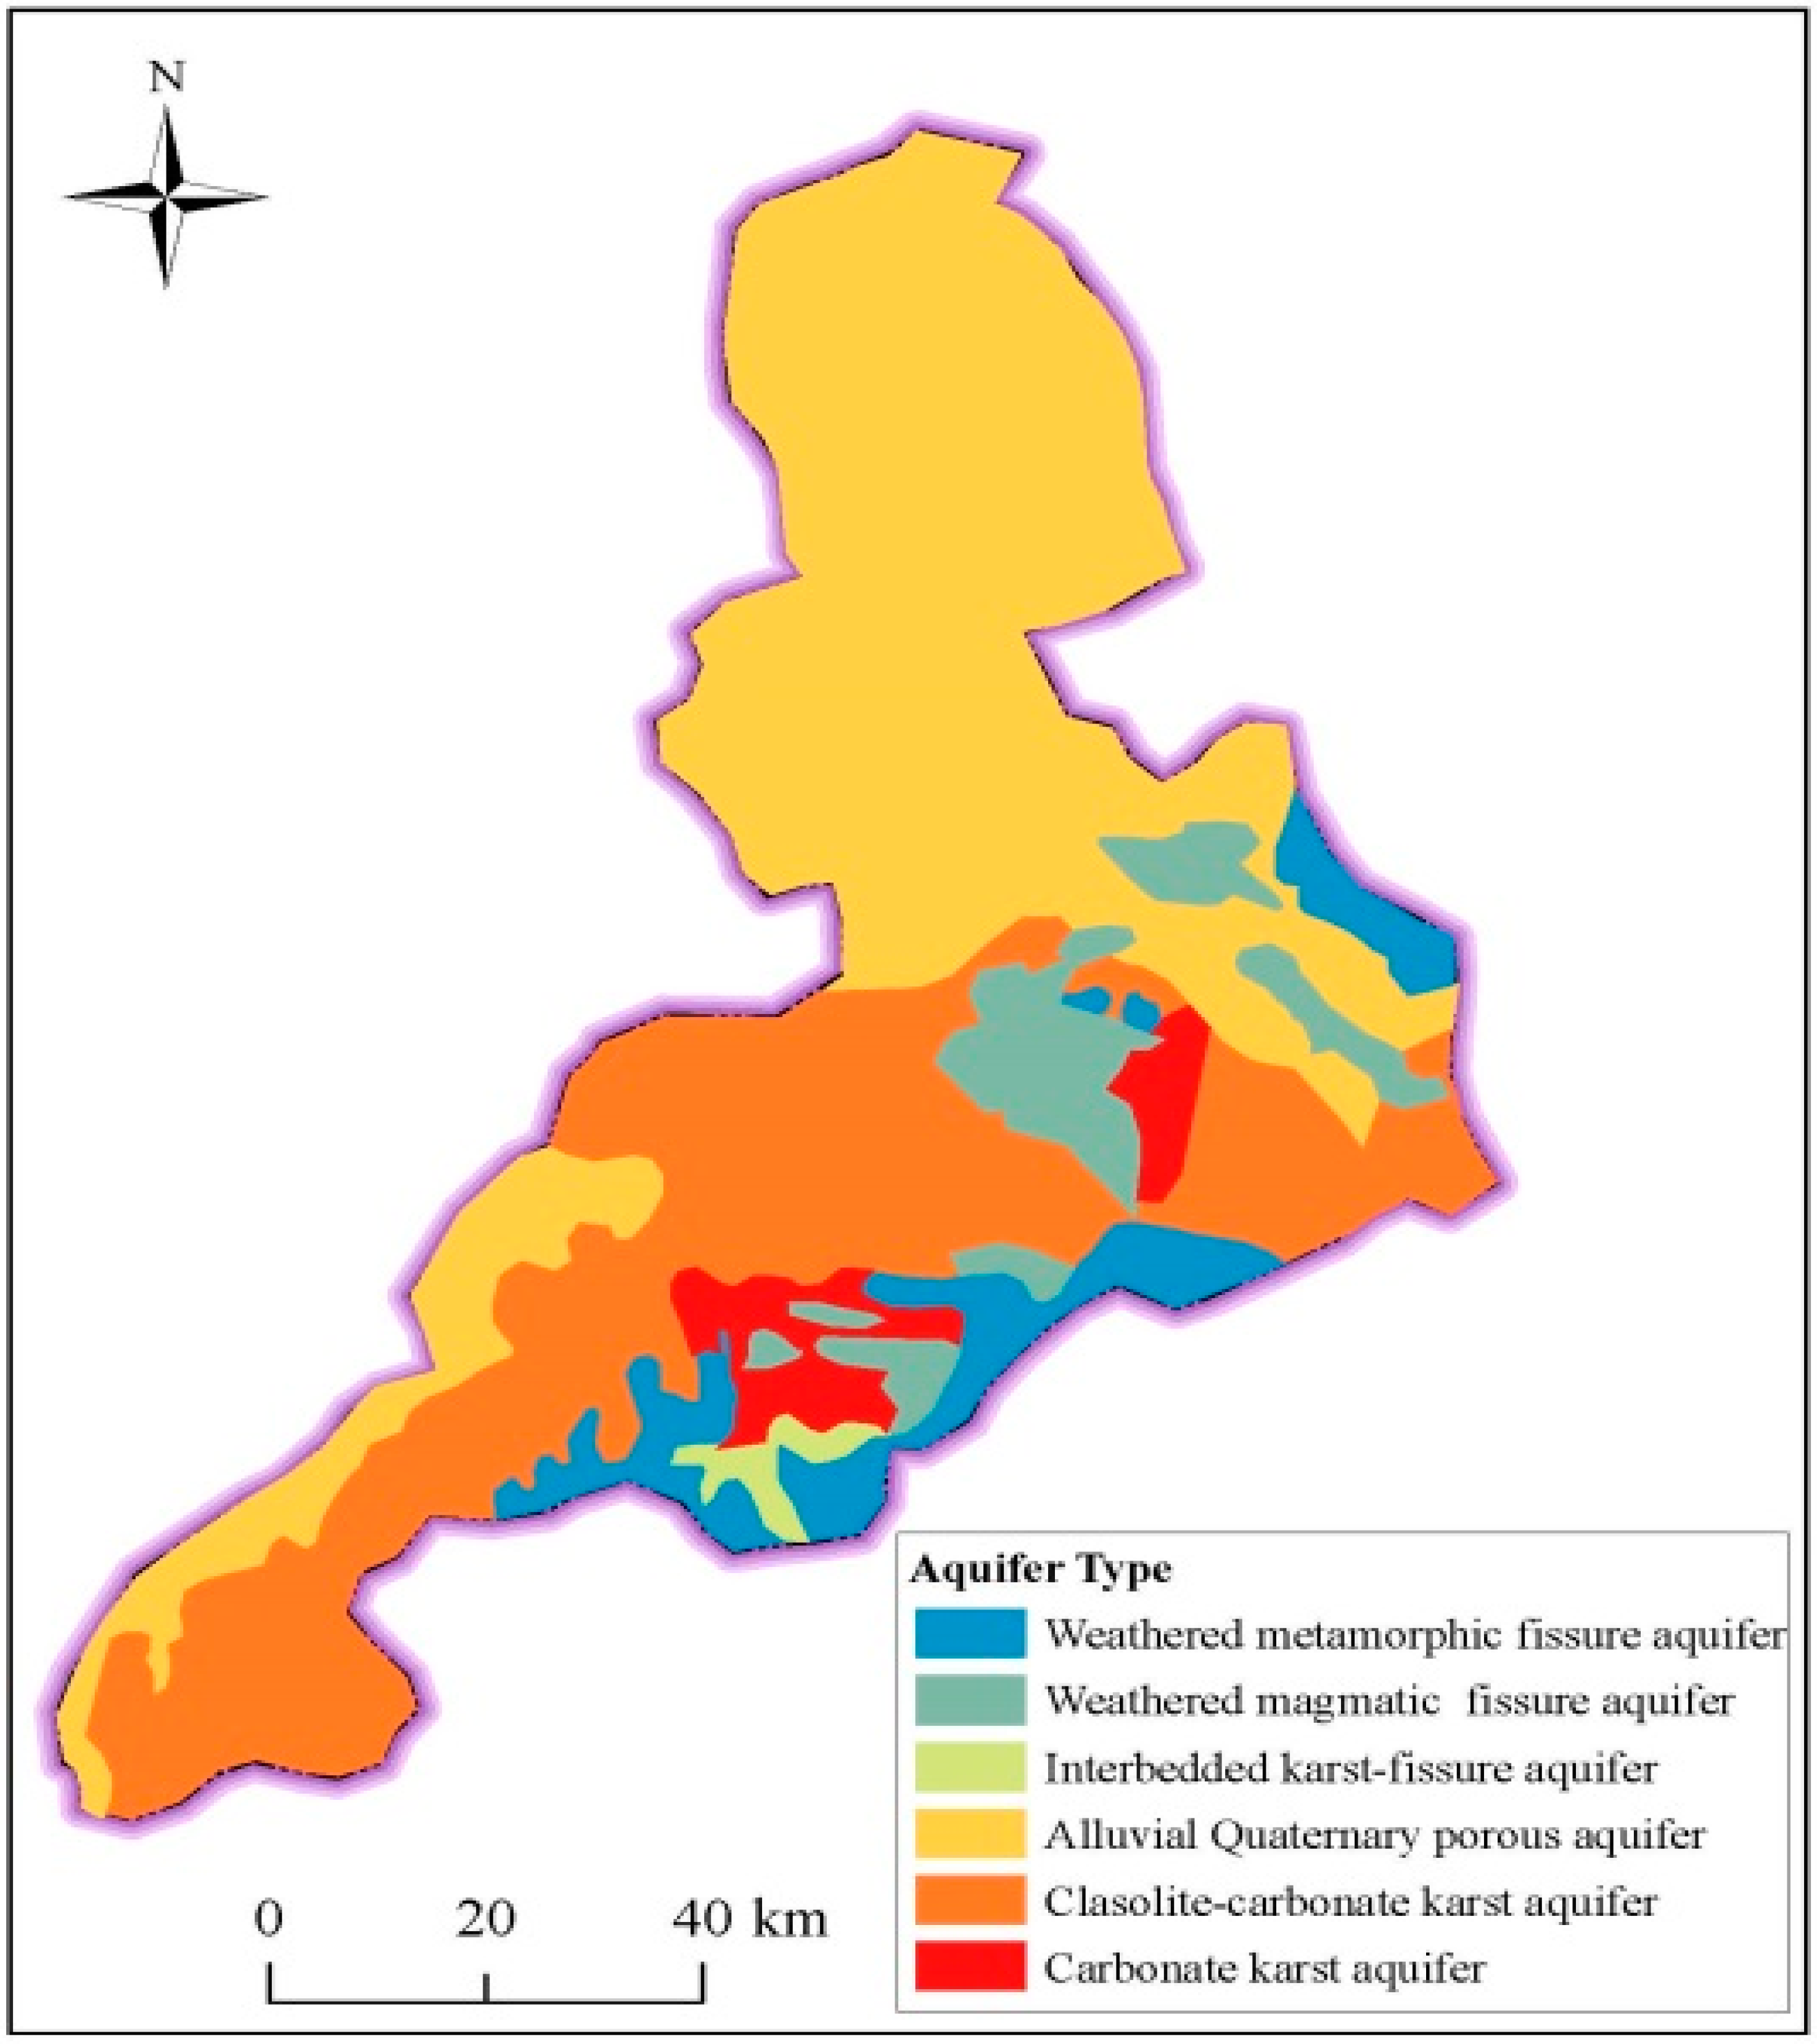
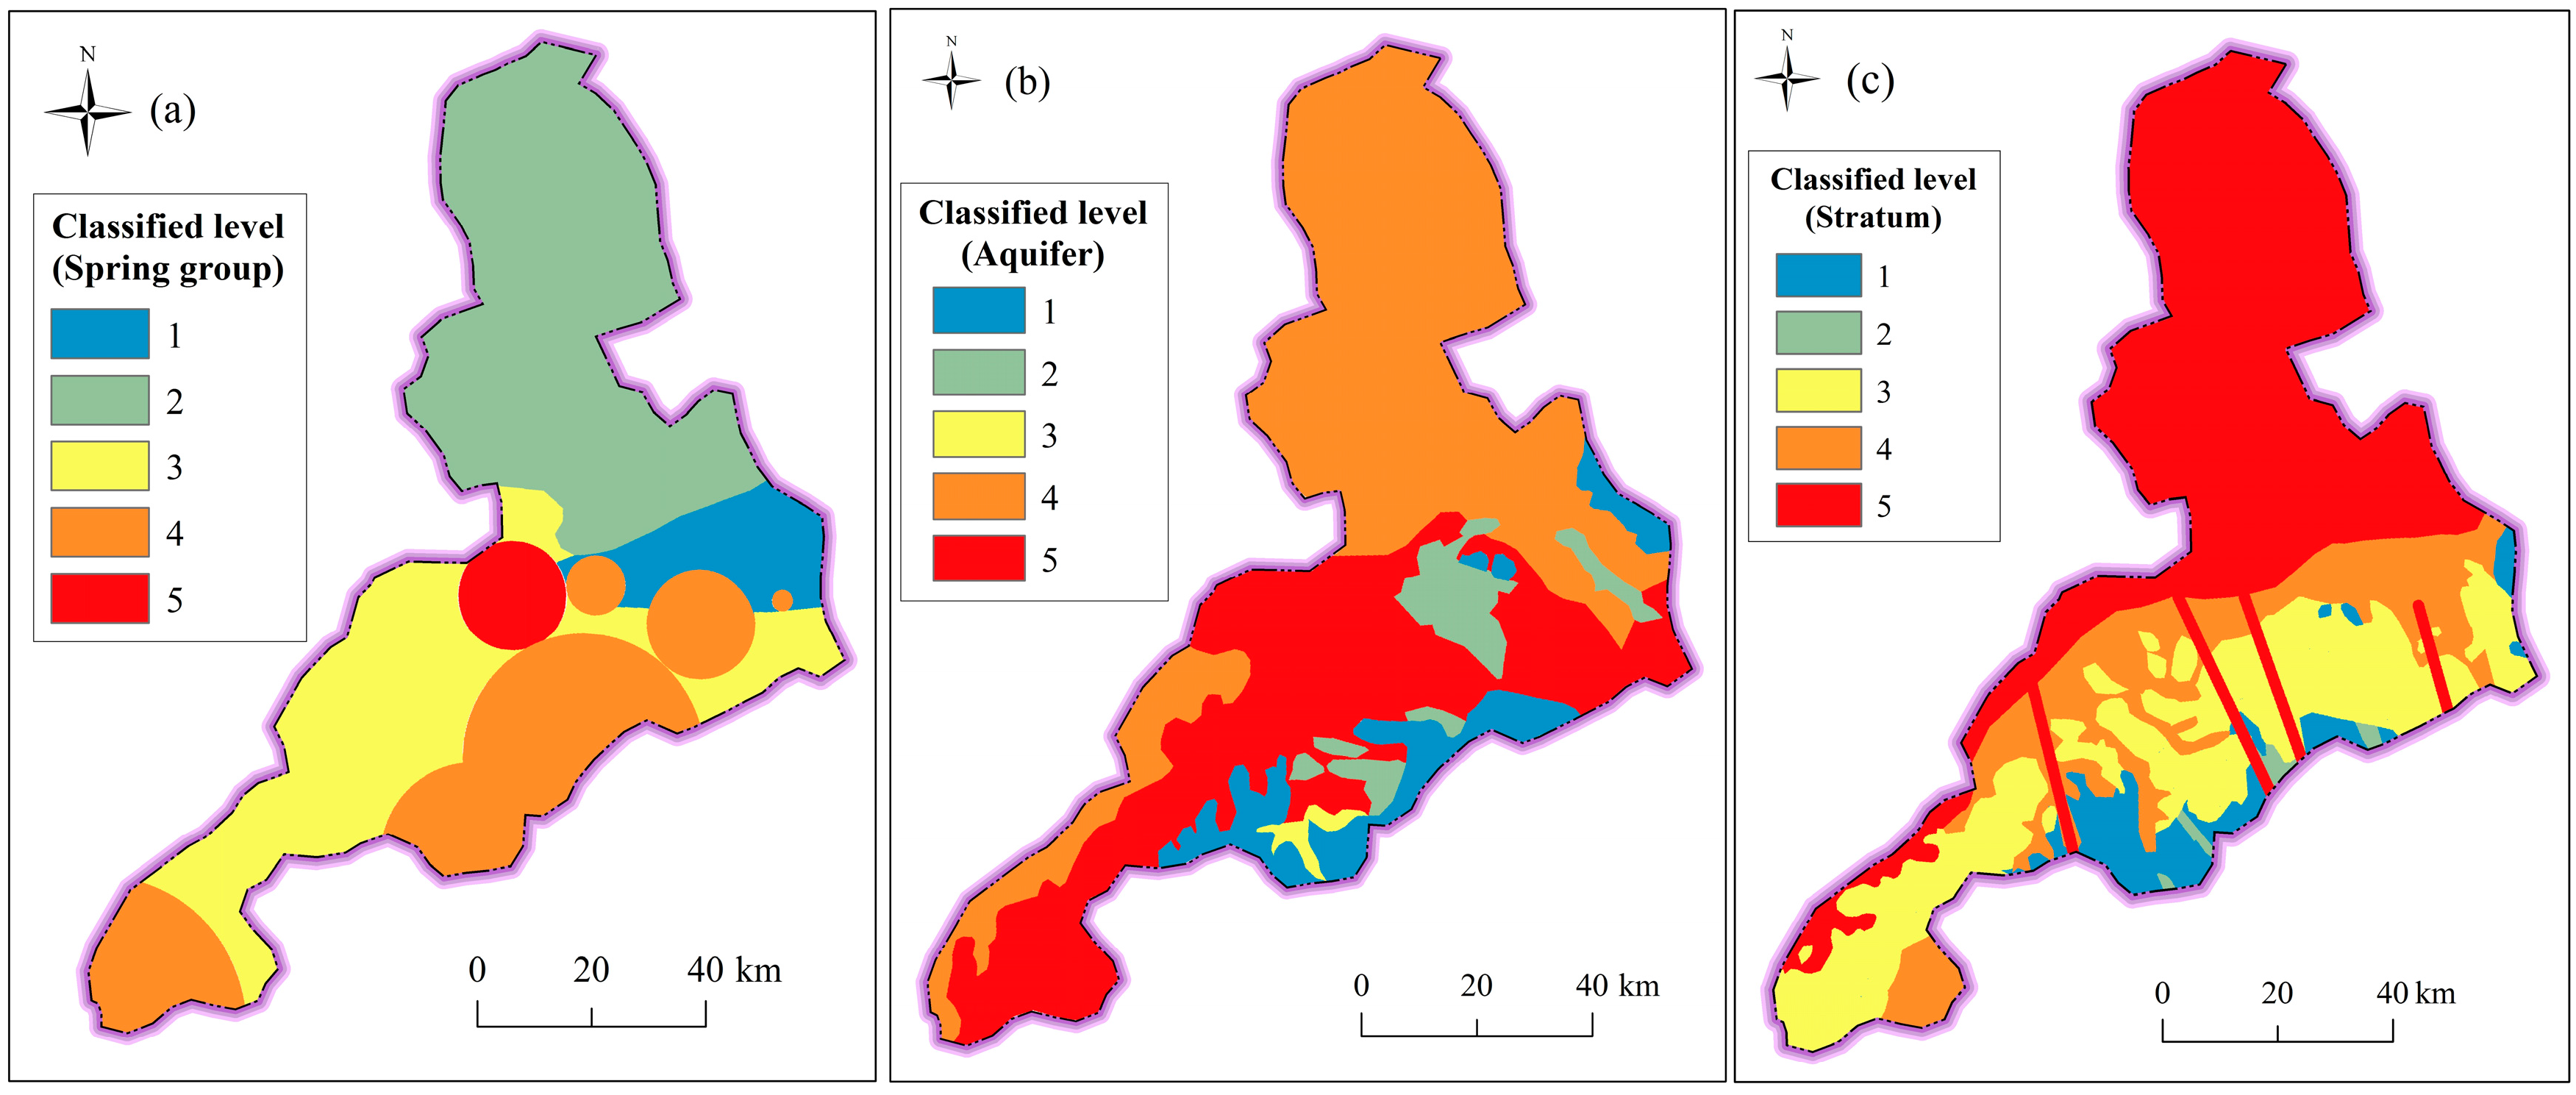
2.2.2. Hydrogeology
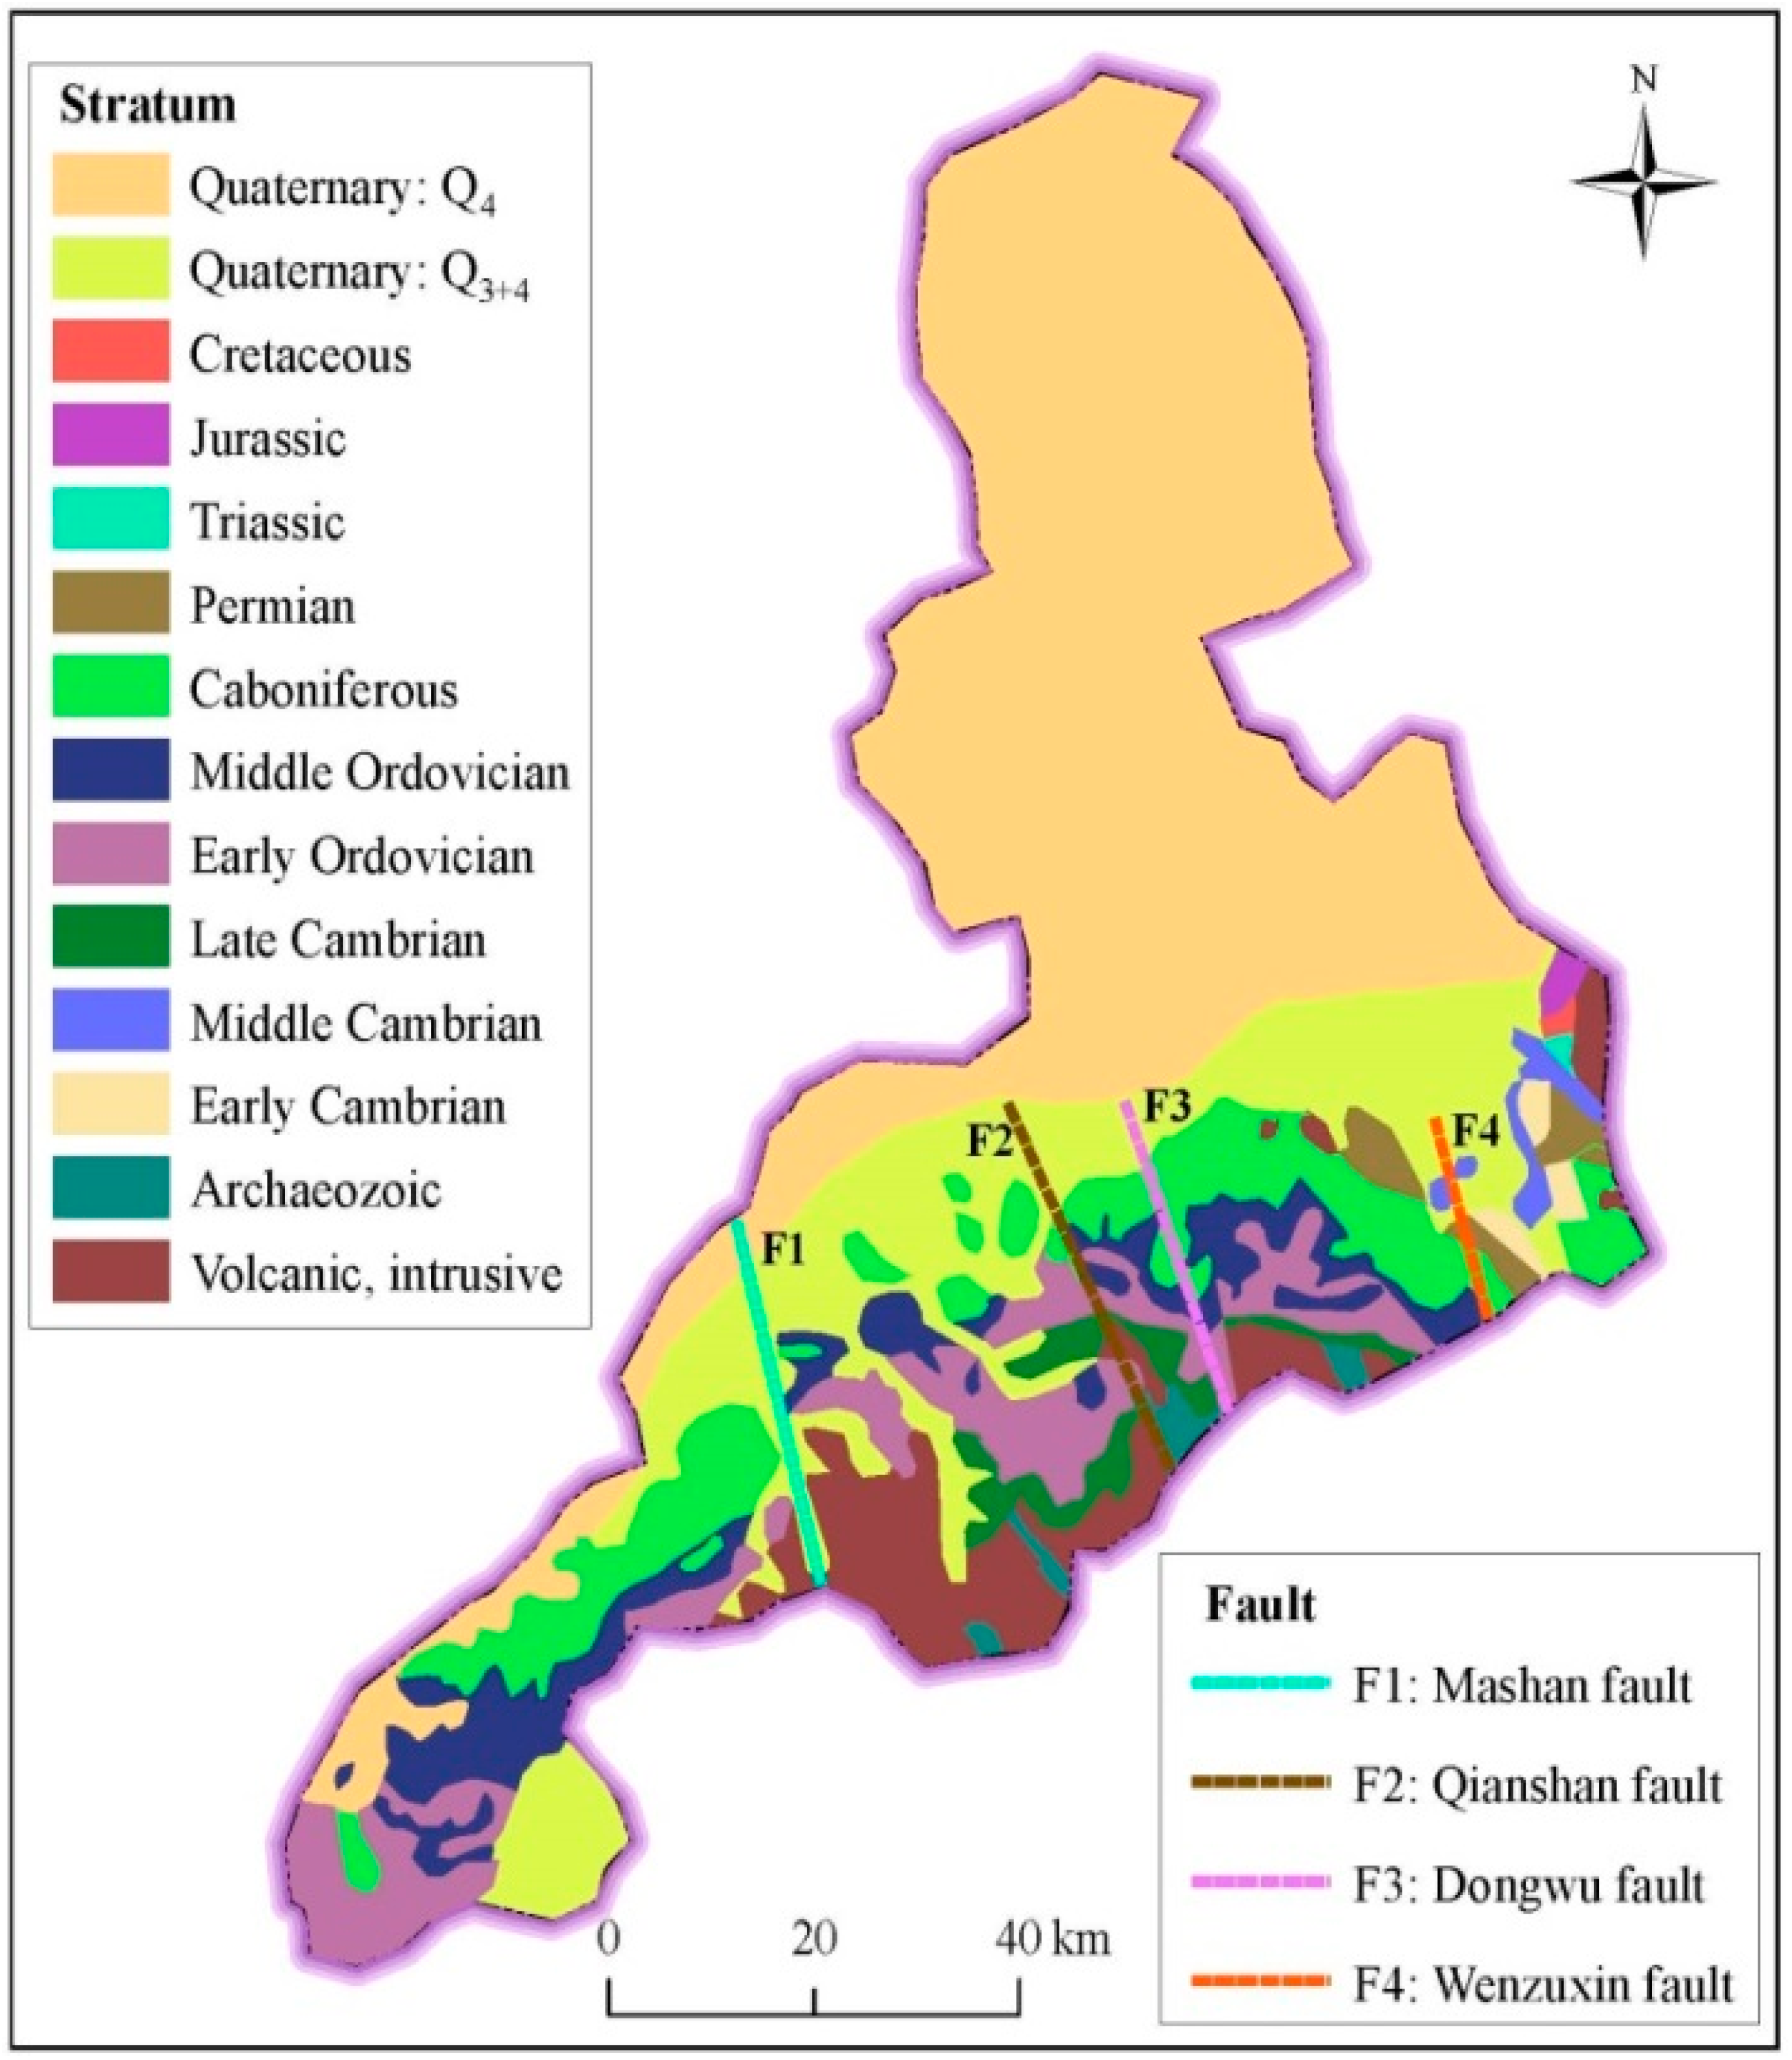
2.2.3. Engineering Geology
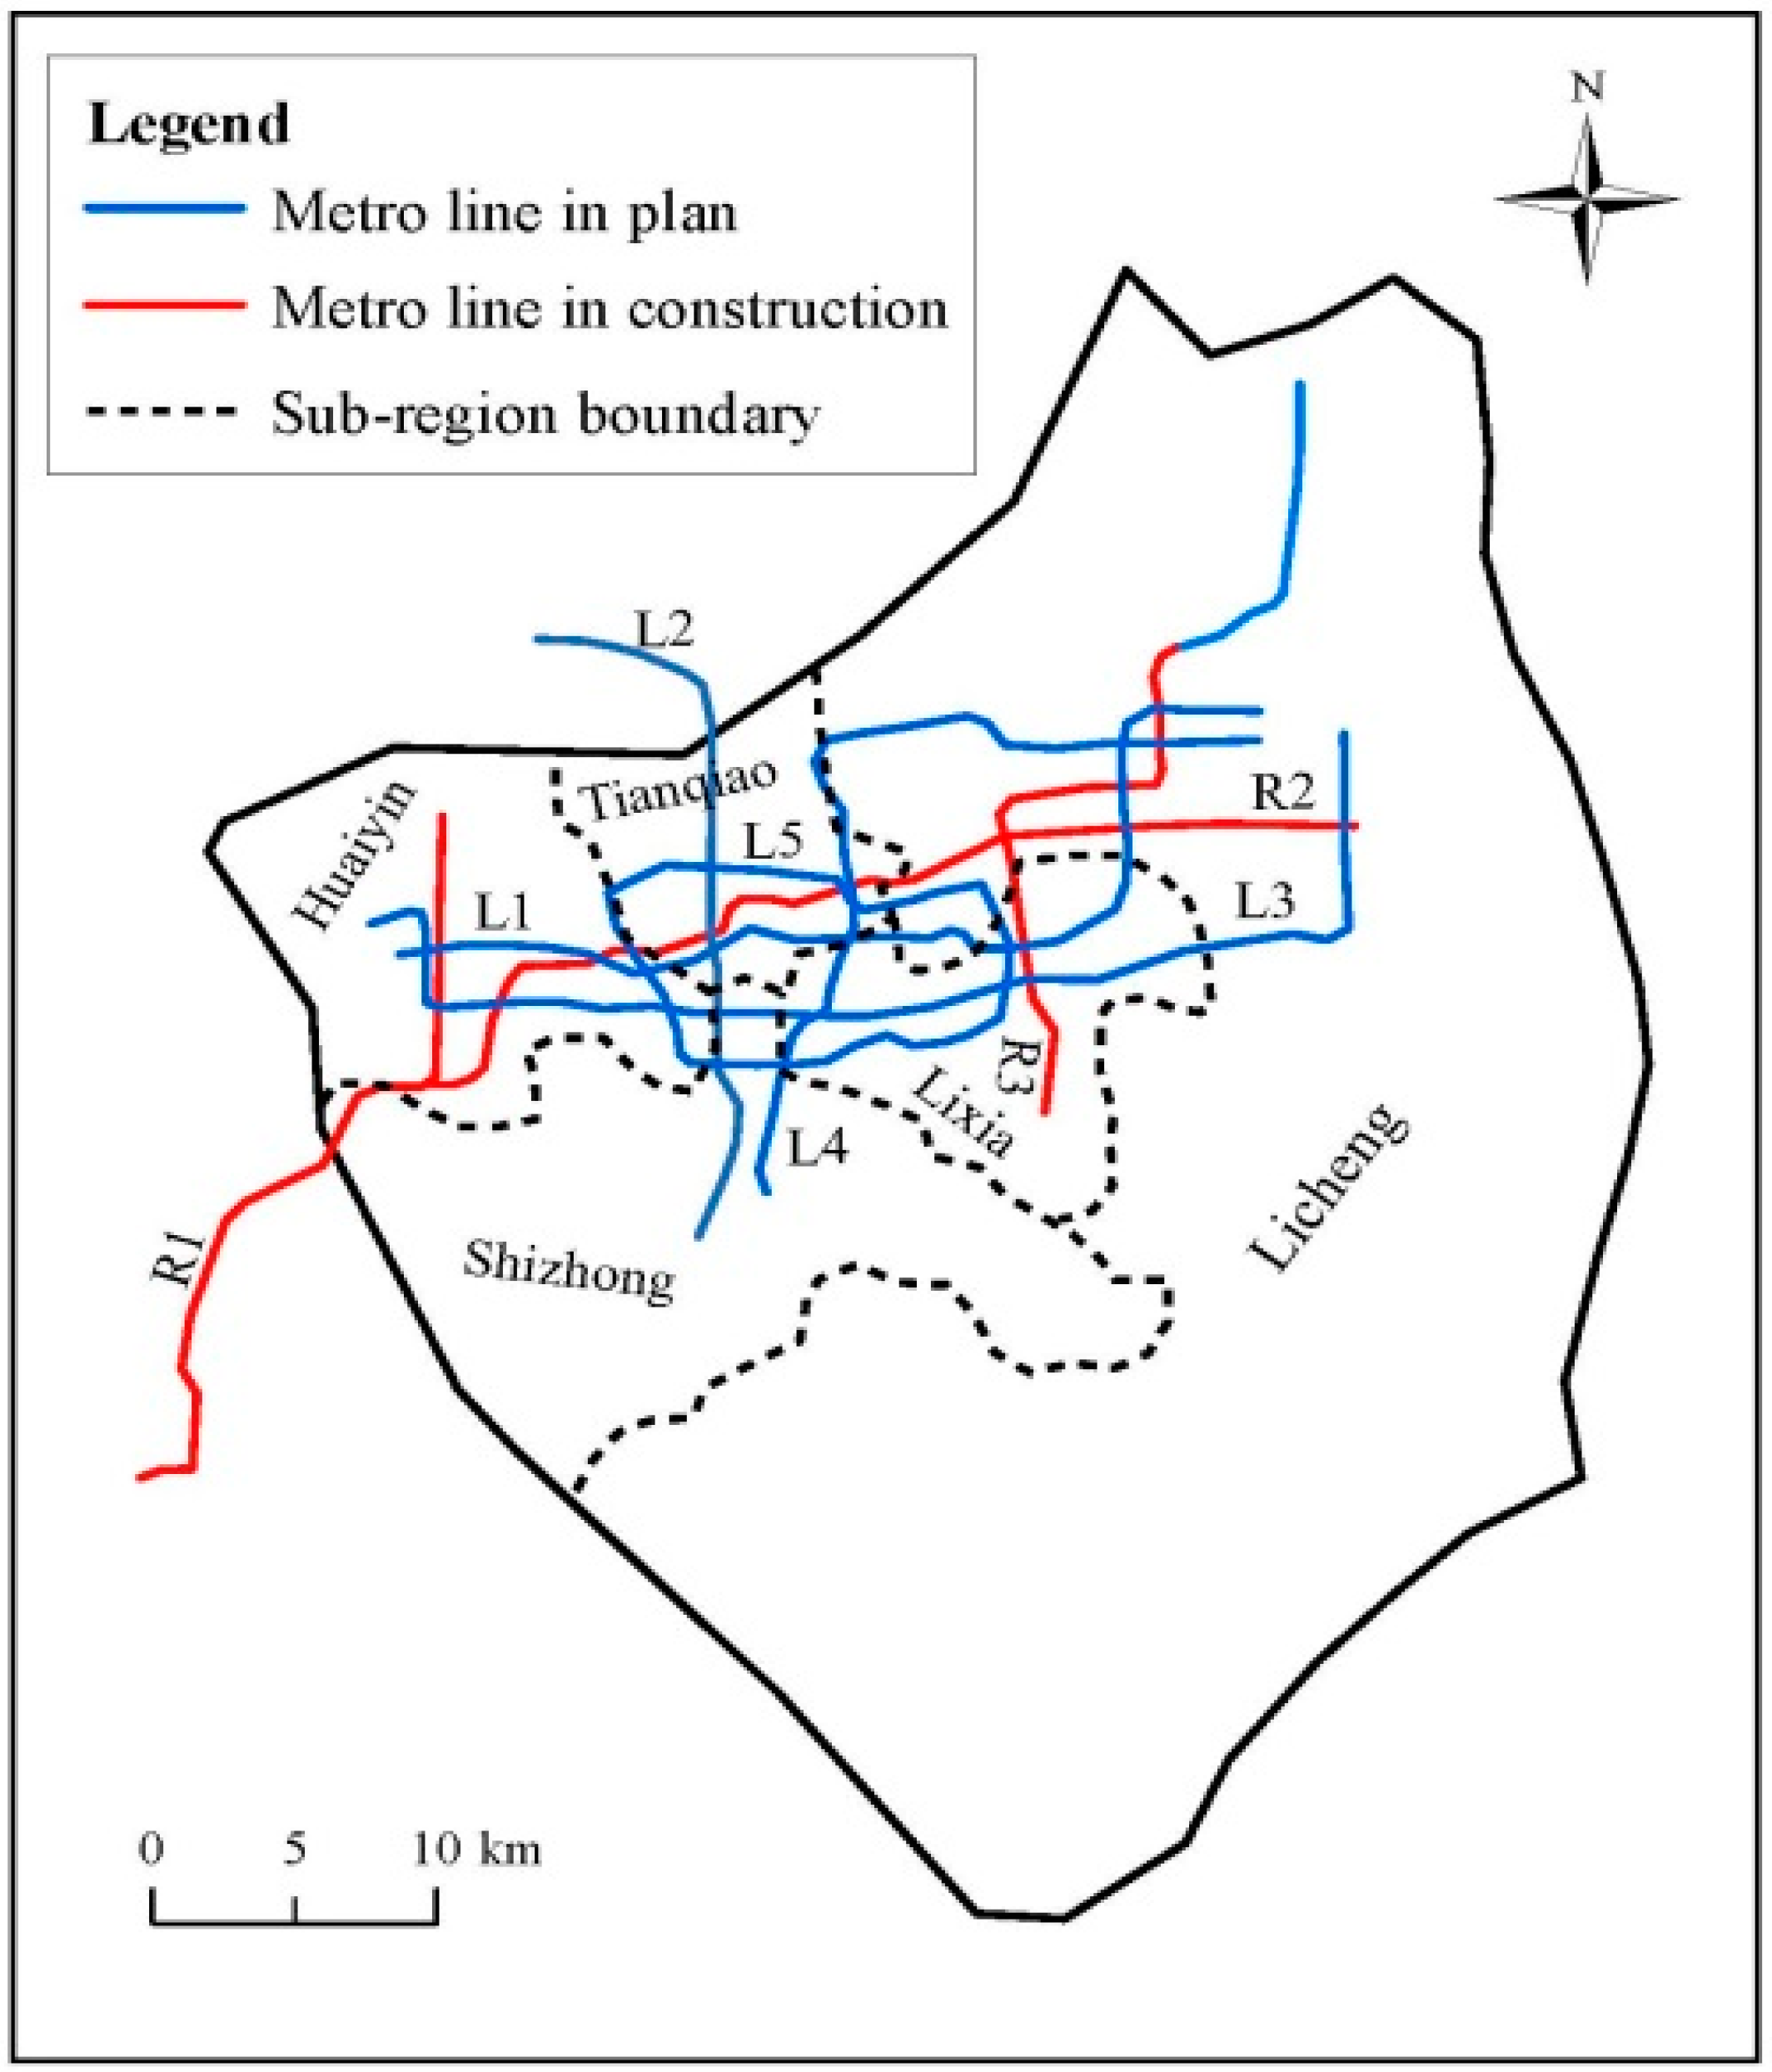
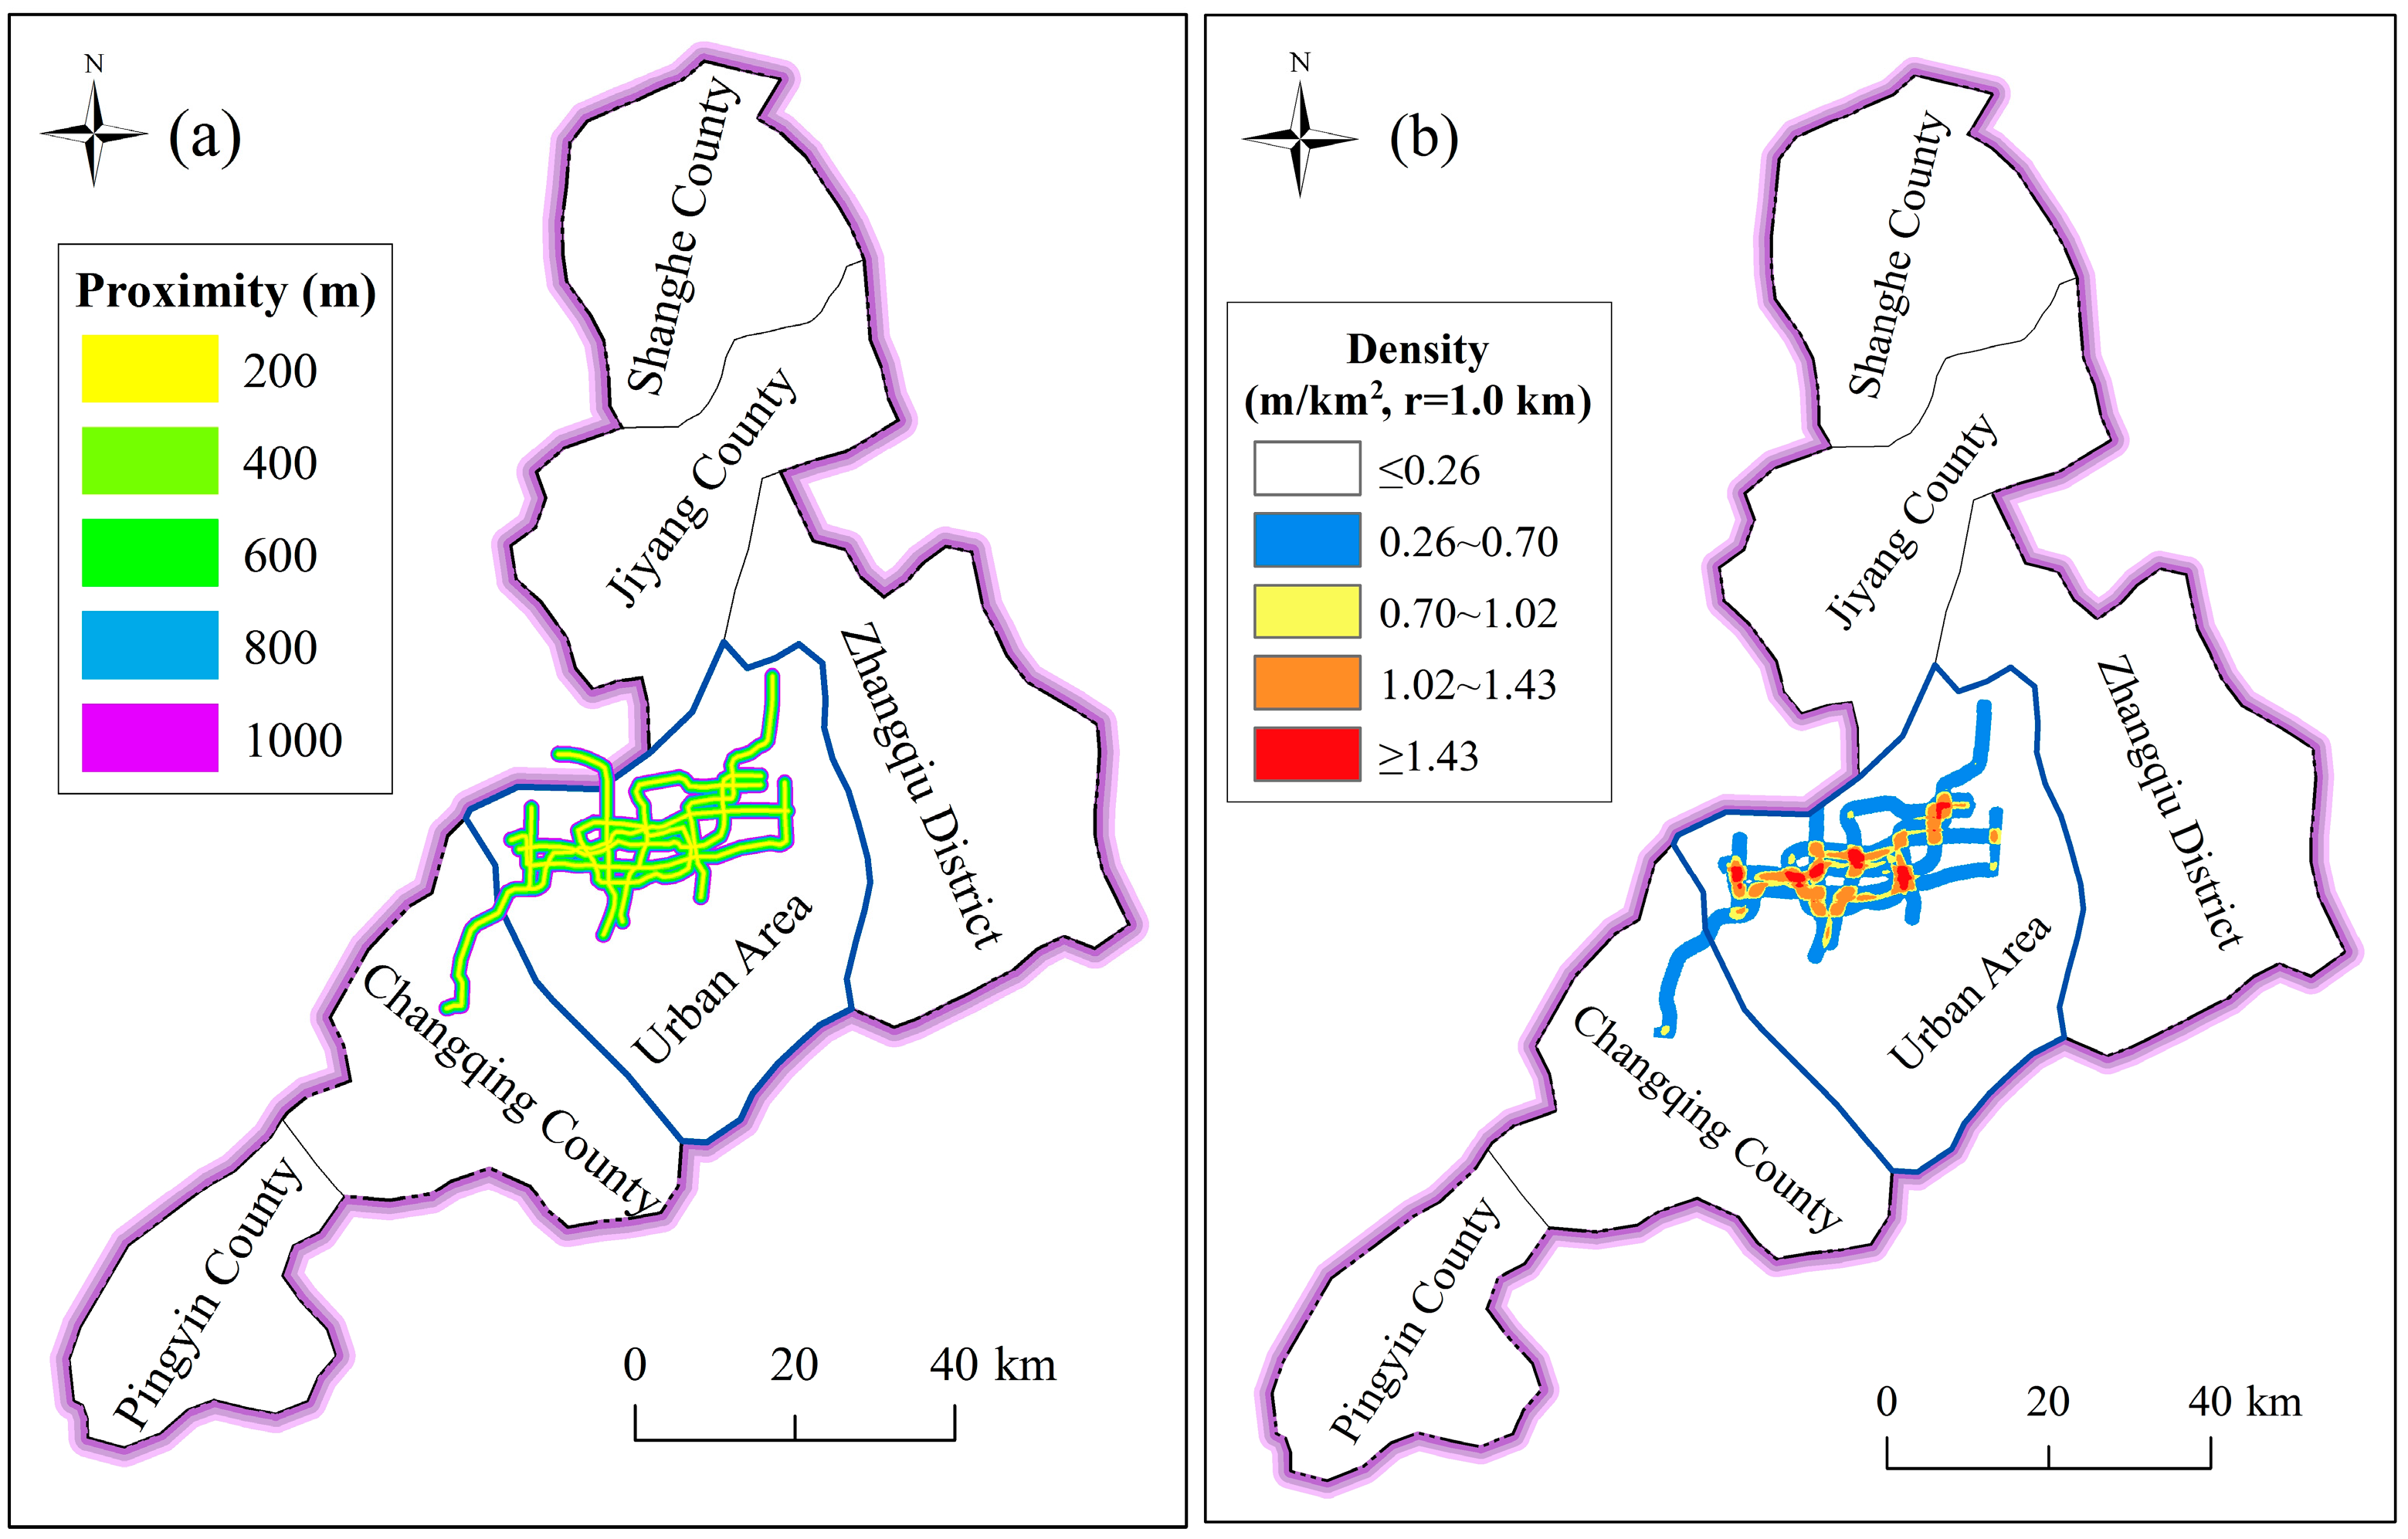
2.2.4. Distribution of Metro Lines
3. Methodology
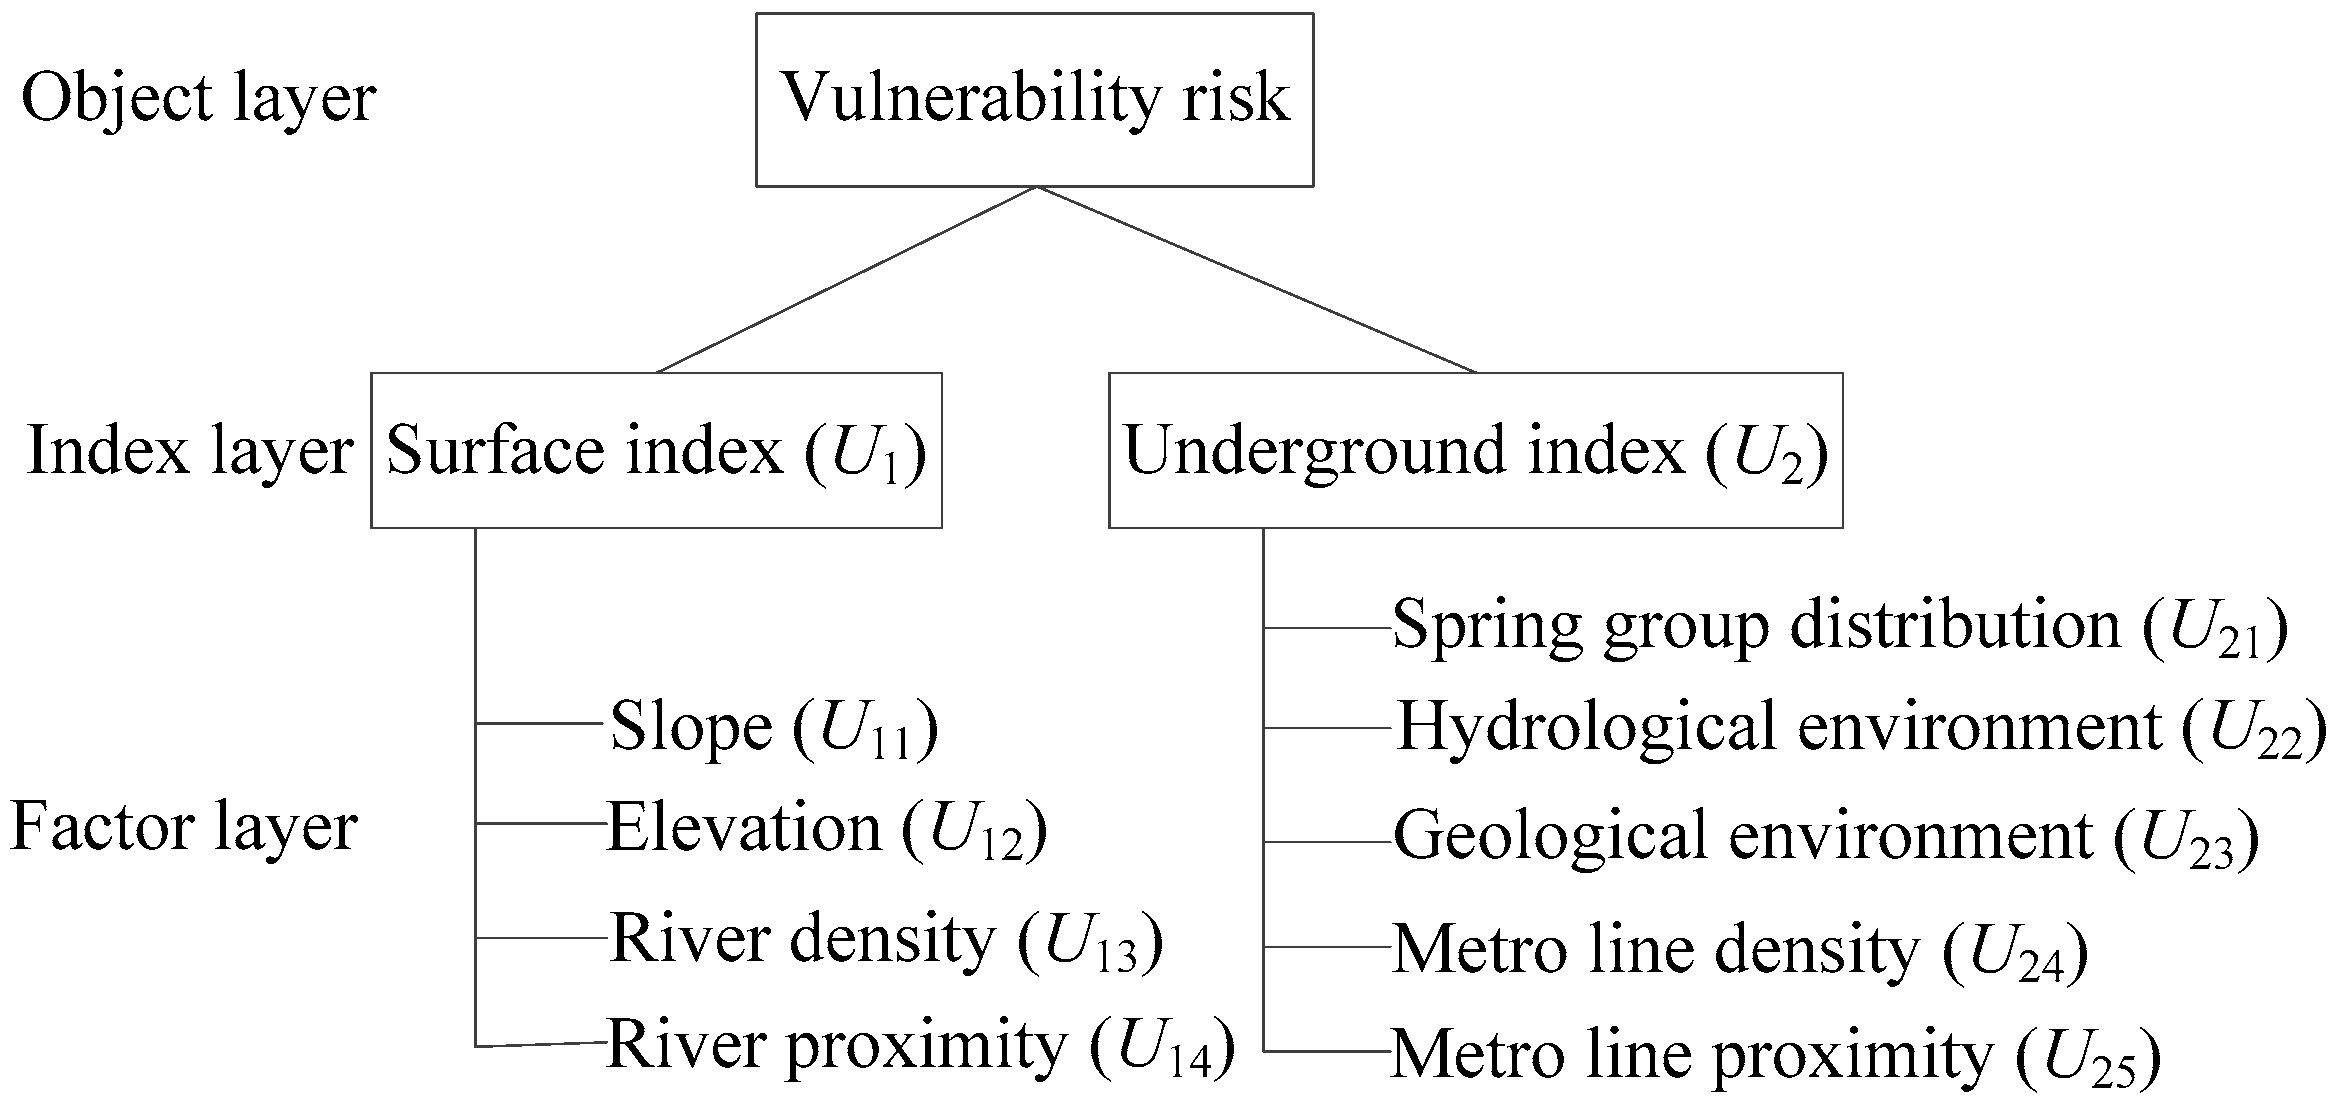
3.1. Risk Assessment Model
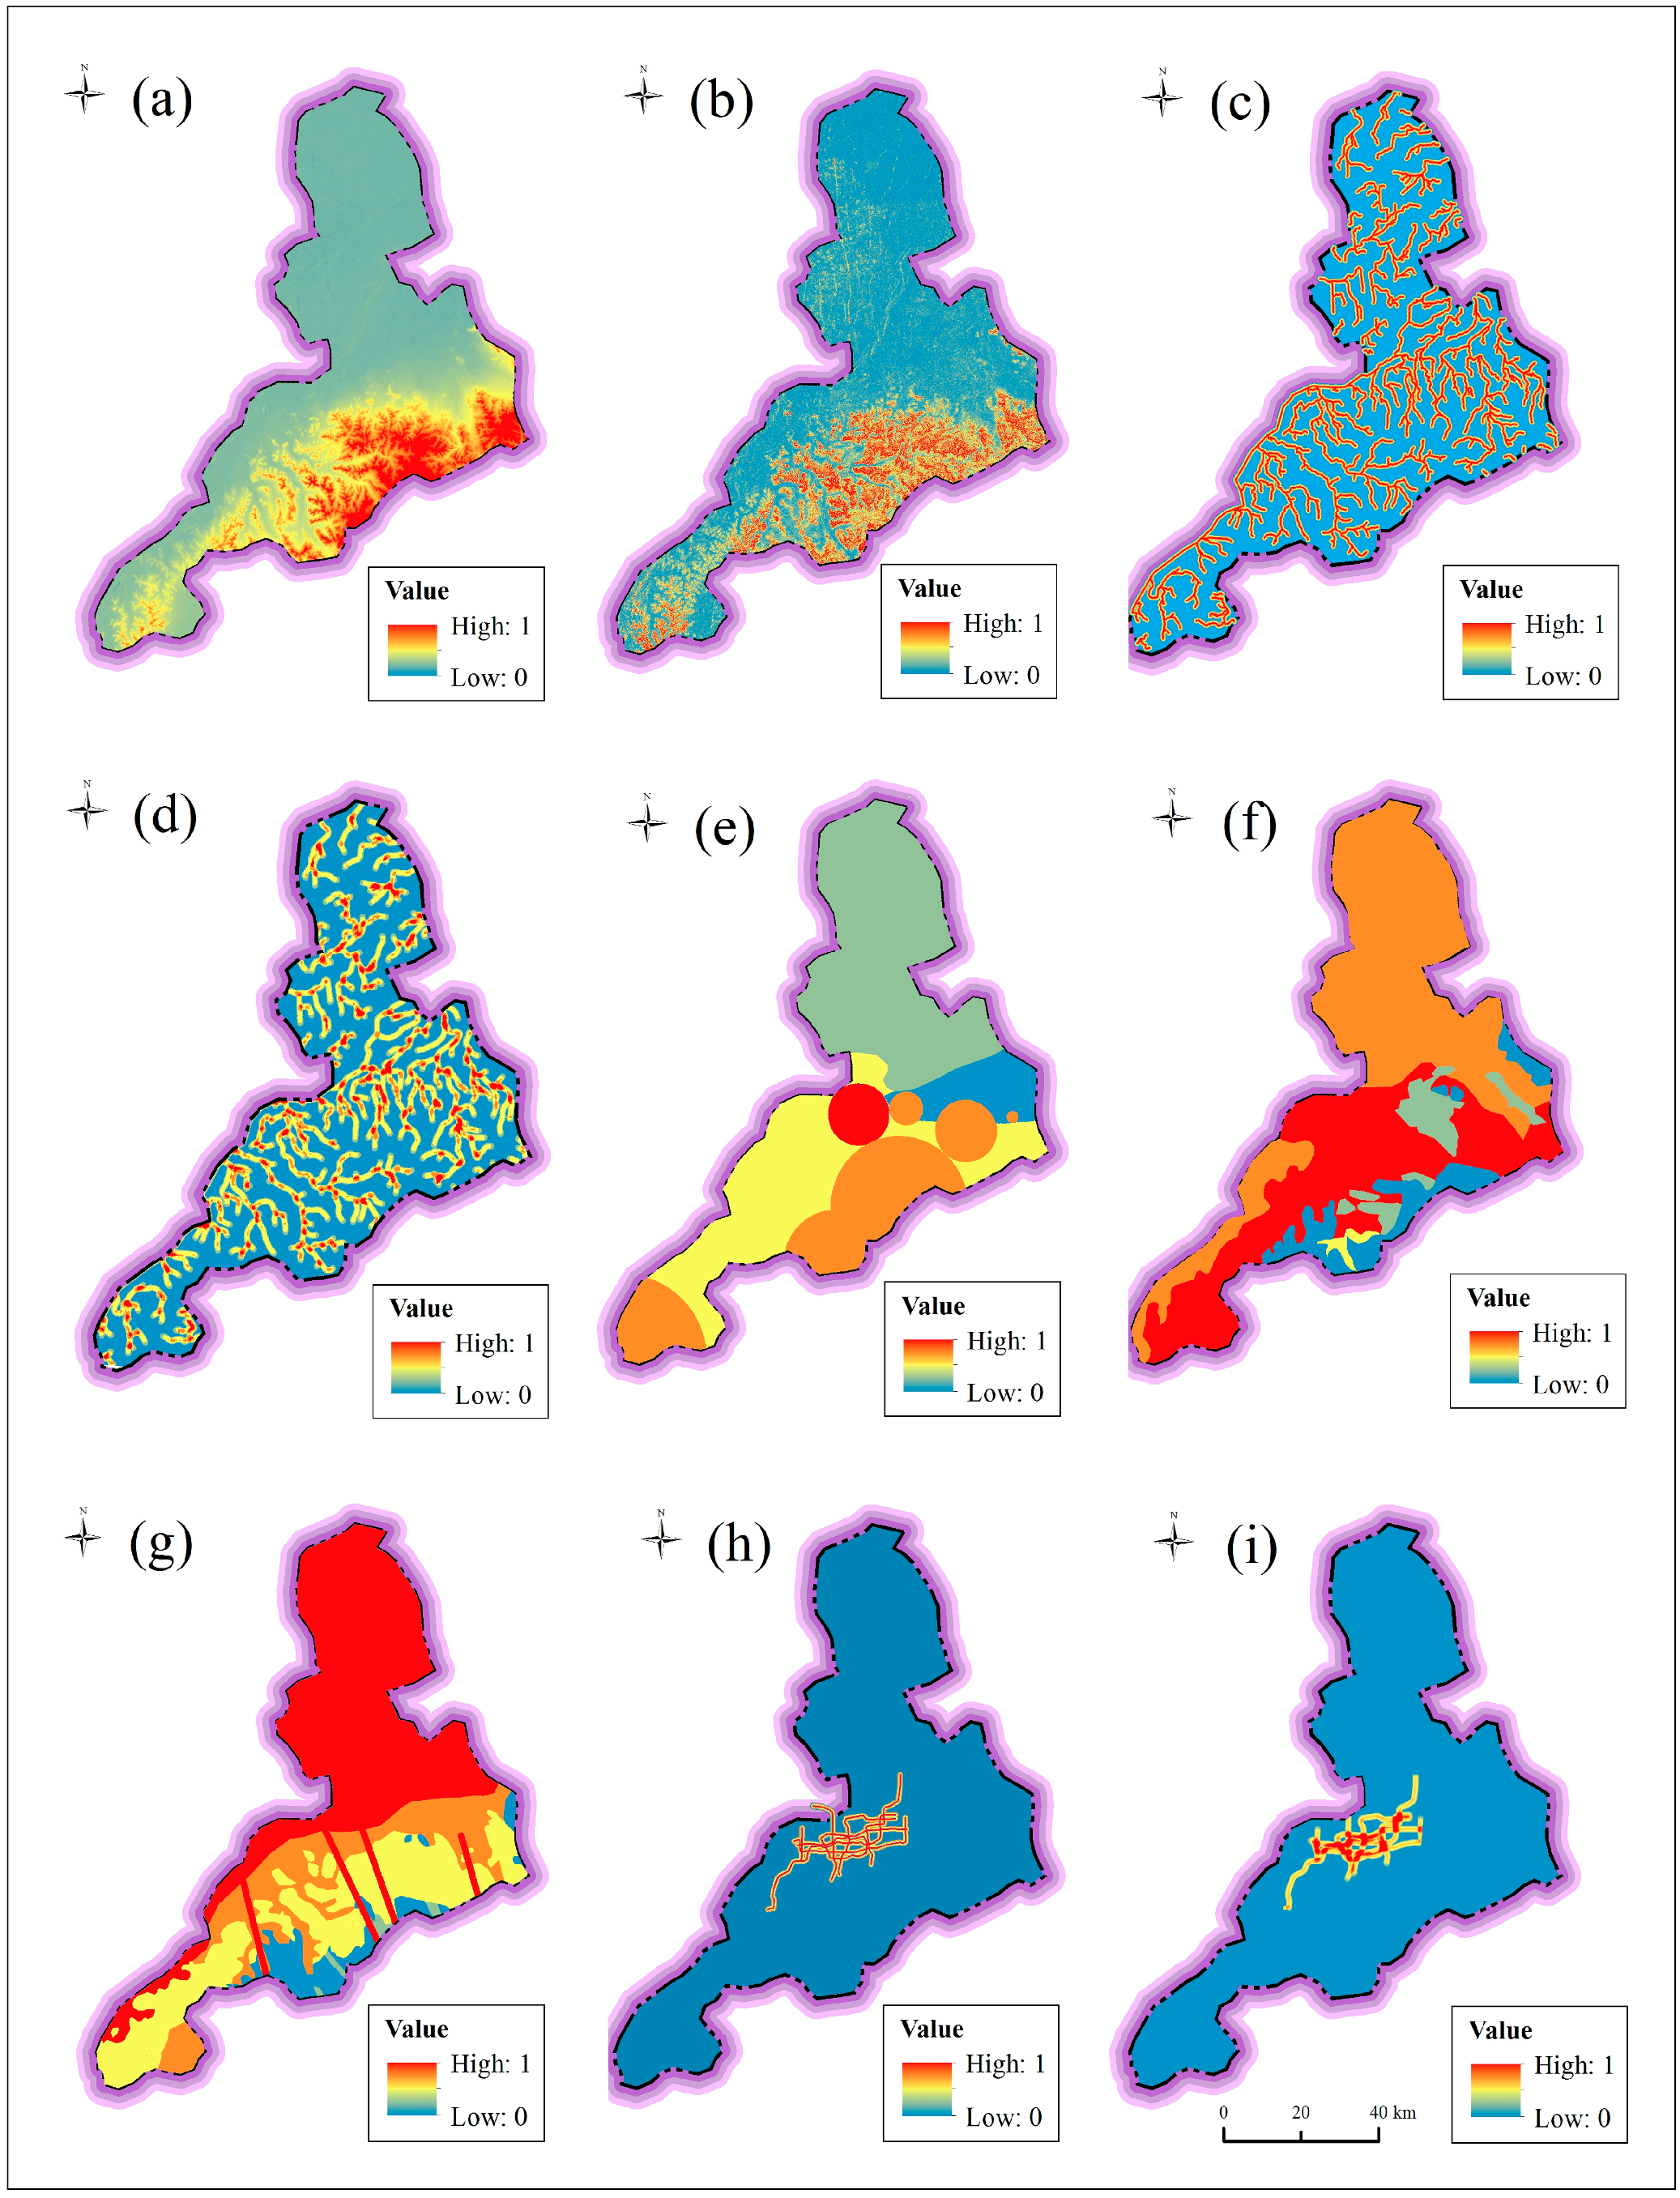
3.2. Processing of Each Index
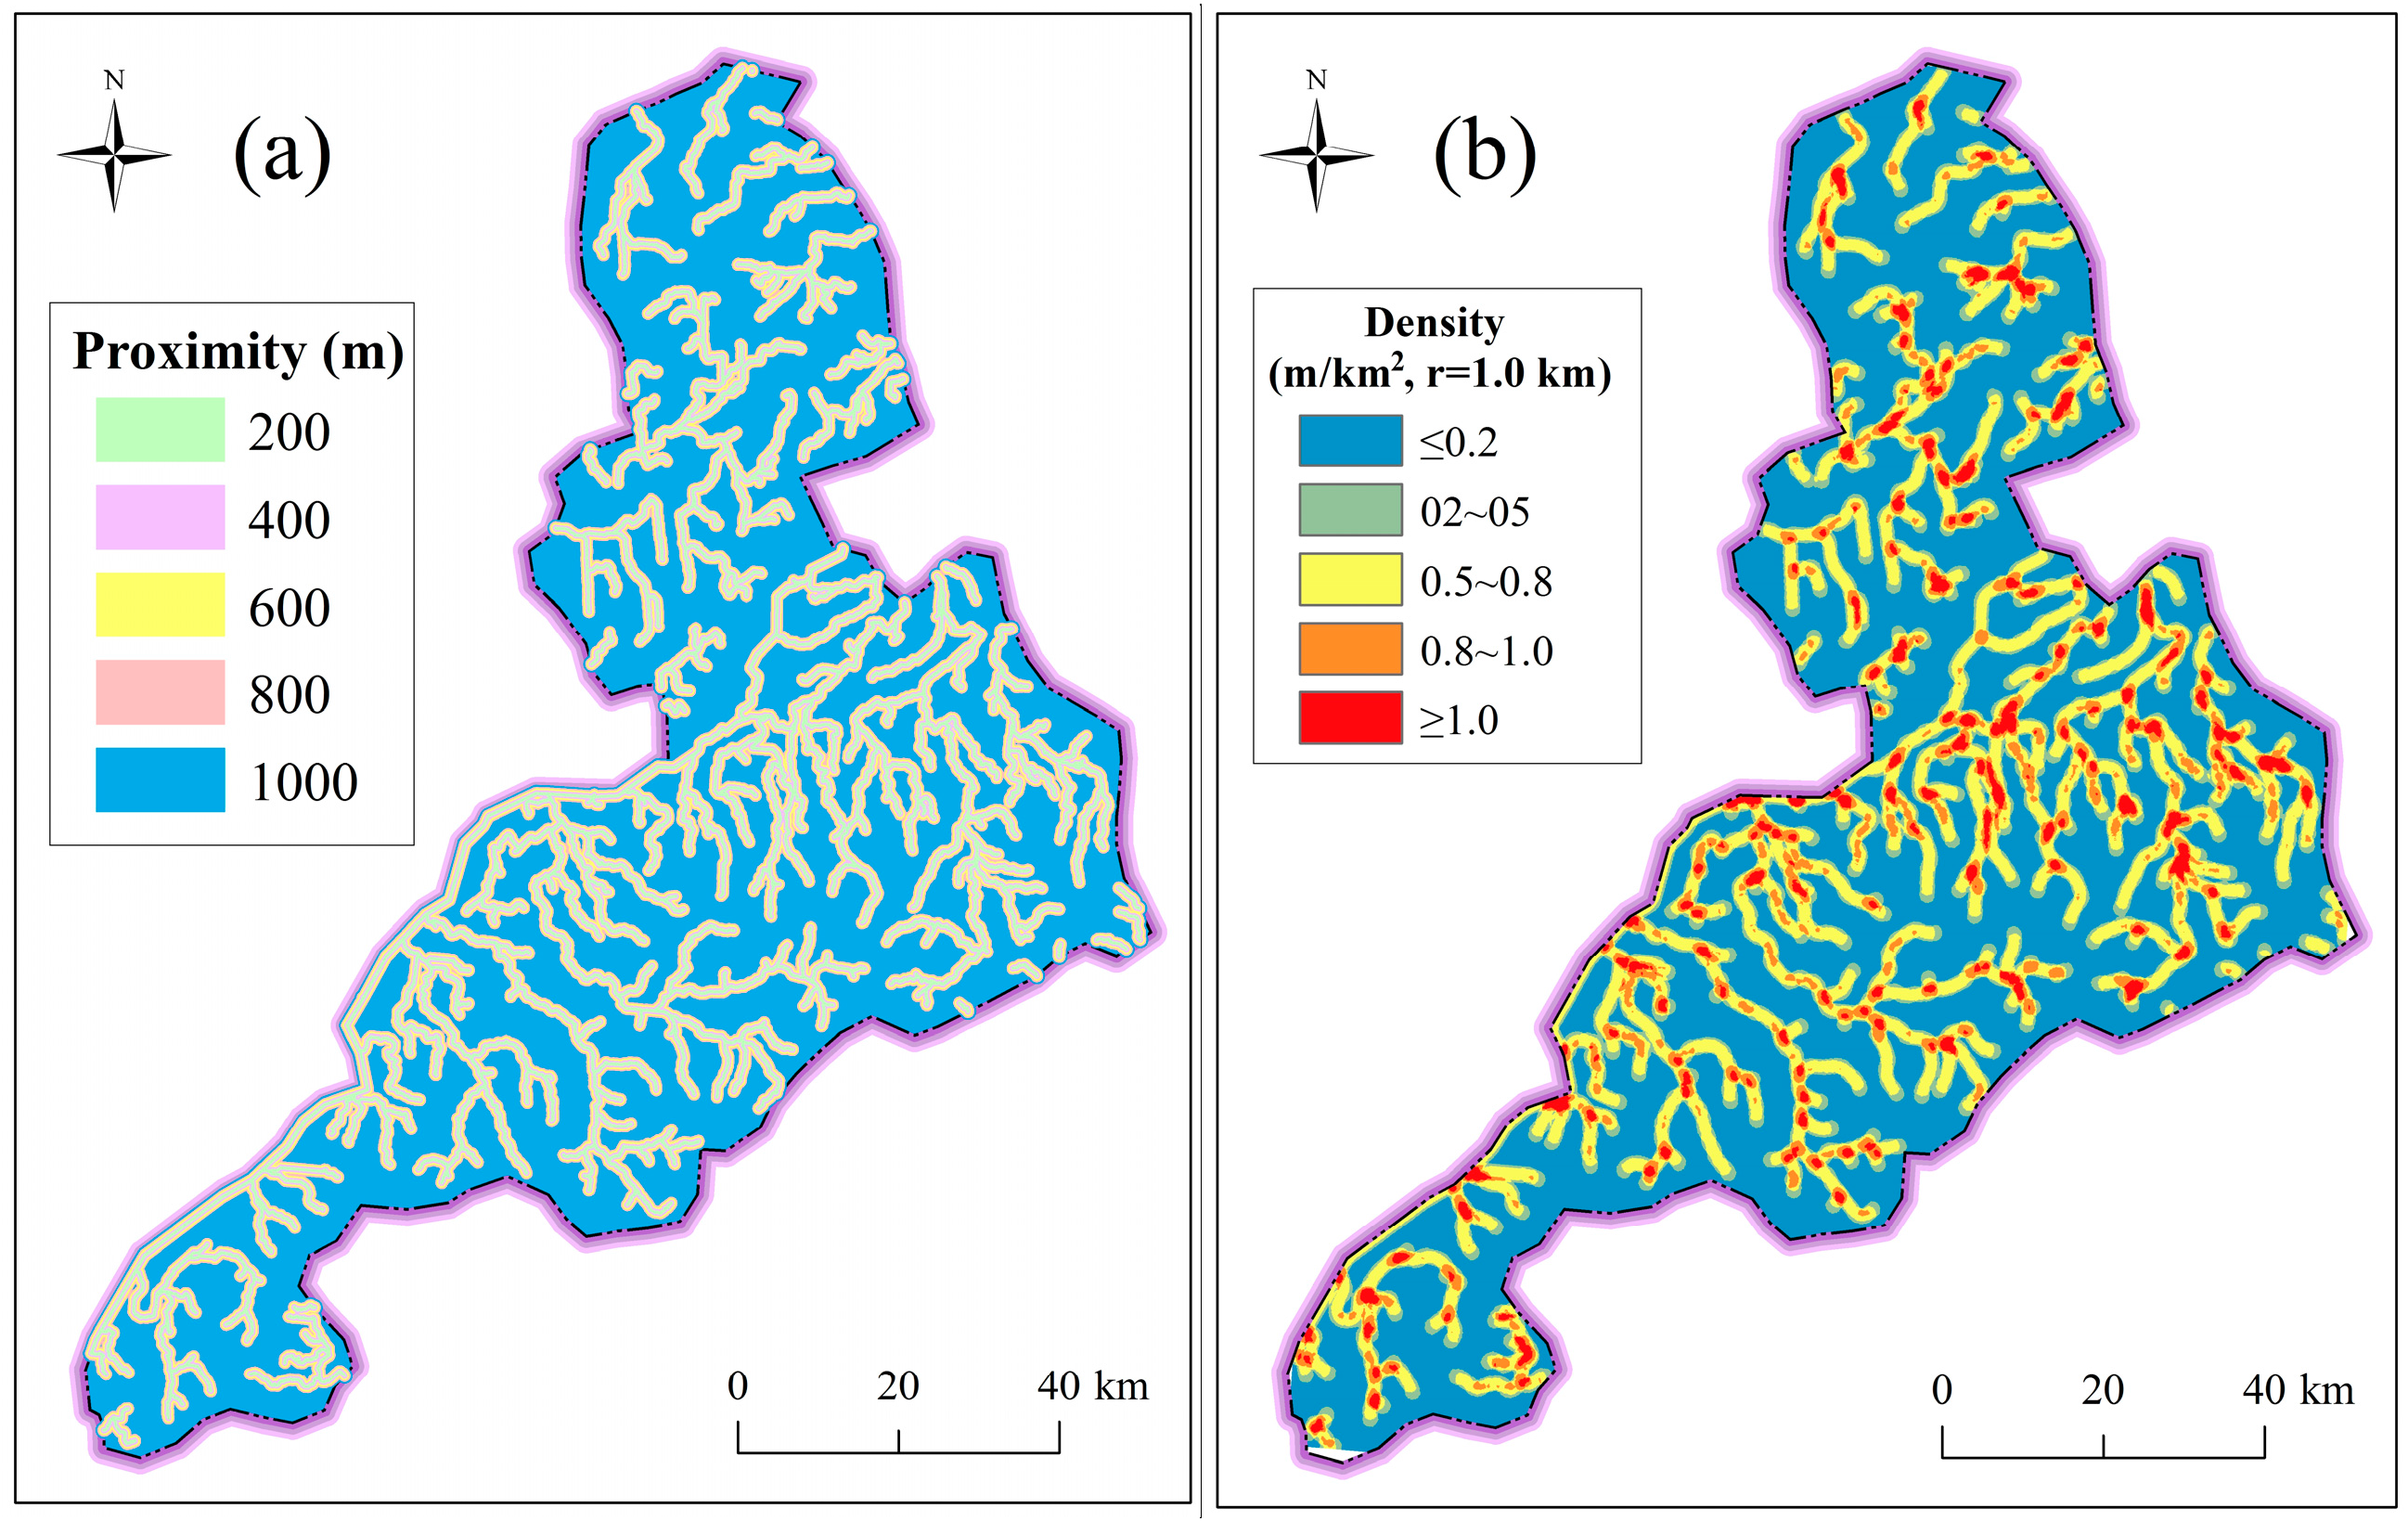
3.2.1. Surface Index
3.2.2. Underground Index
3.3. Weight Calculation by AHP
3.4. Normalization
4. Results
4.1. Assessment of Surface Index
4.2. Assessment of Underground Index
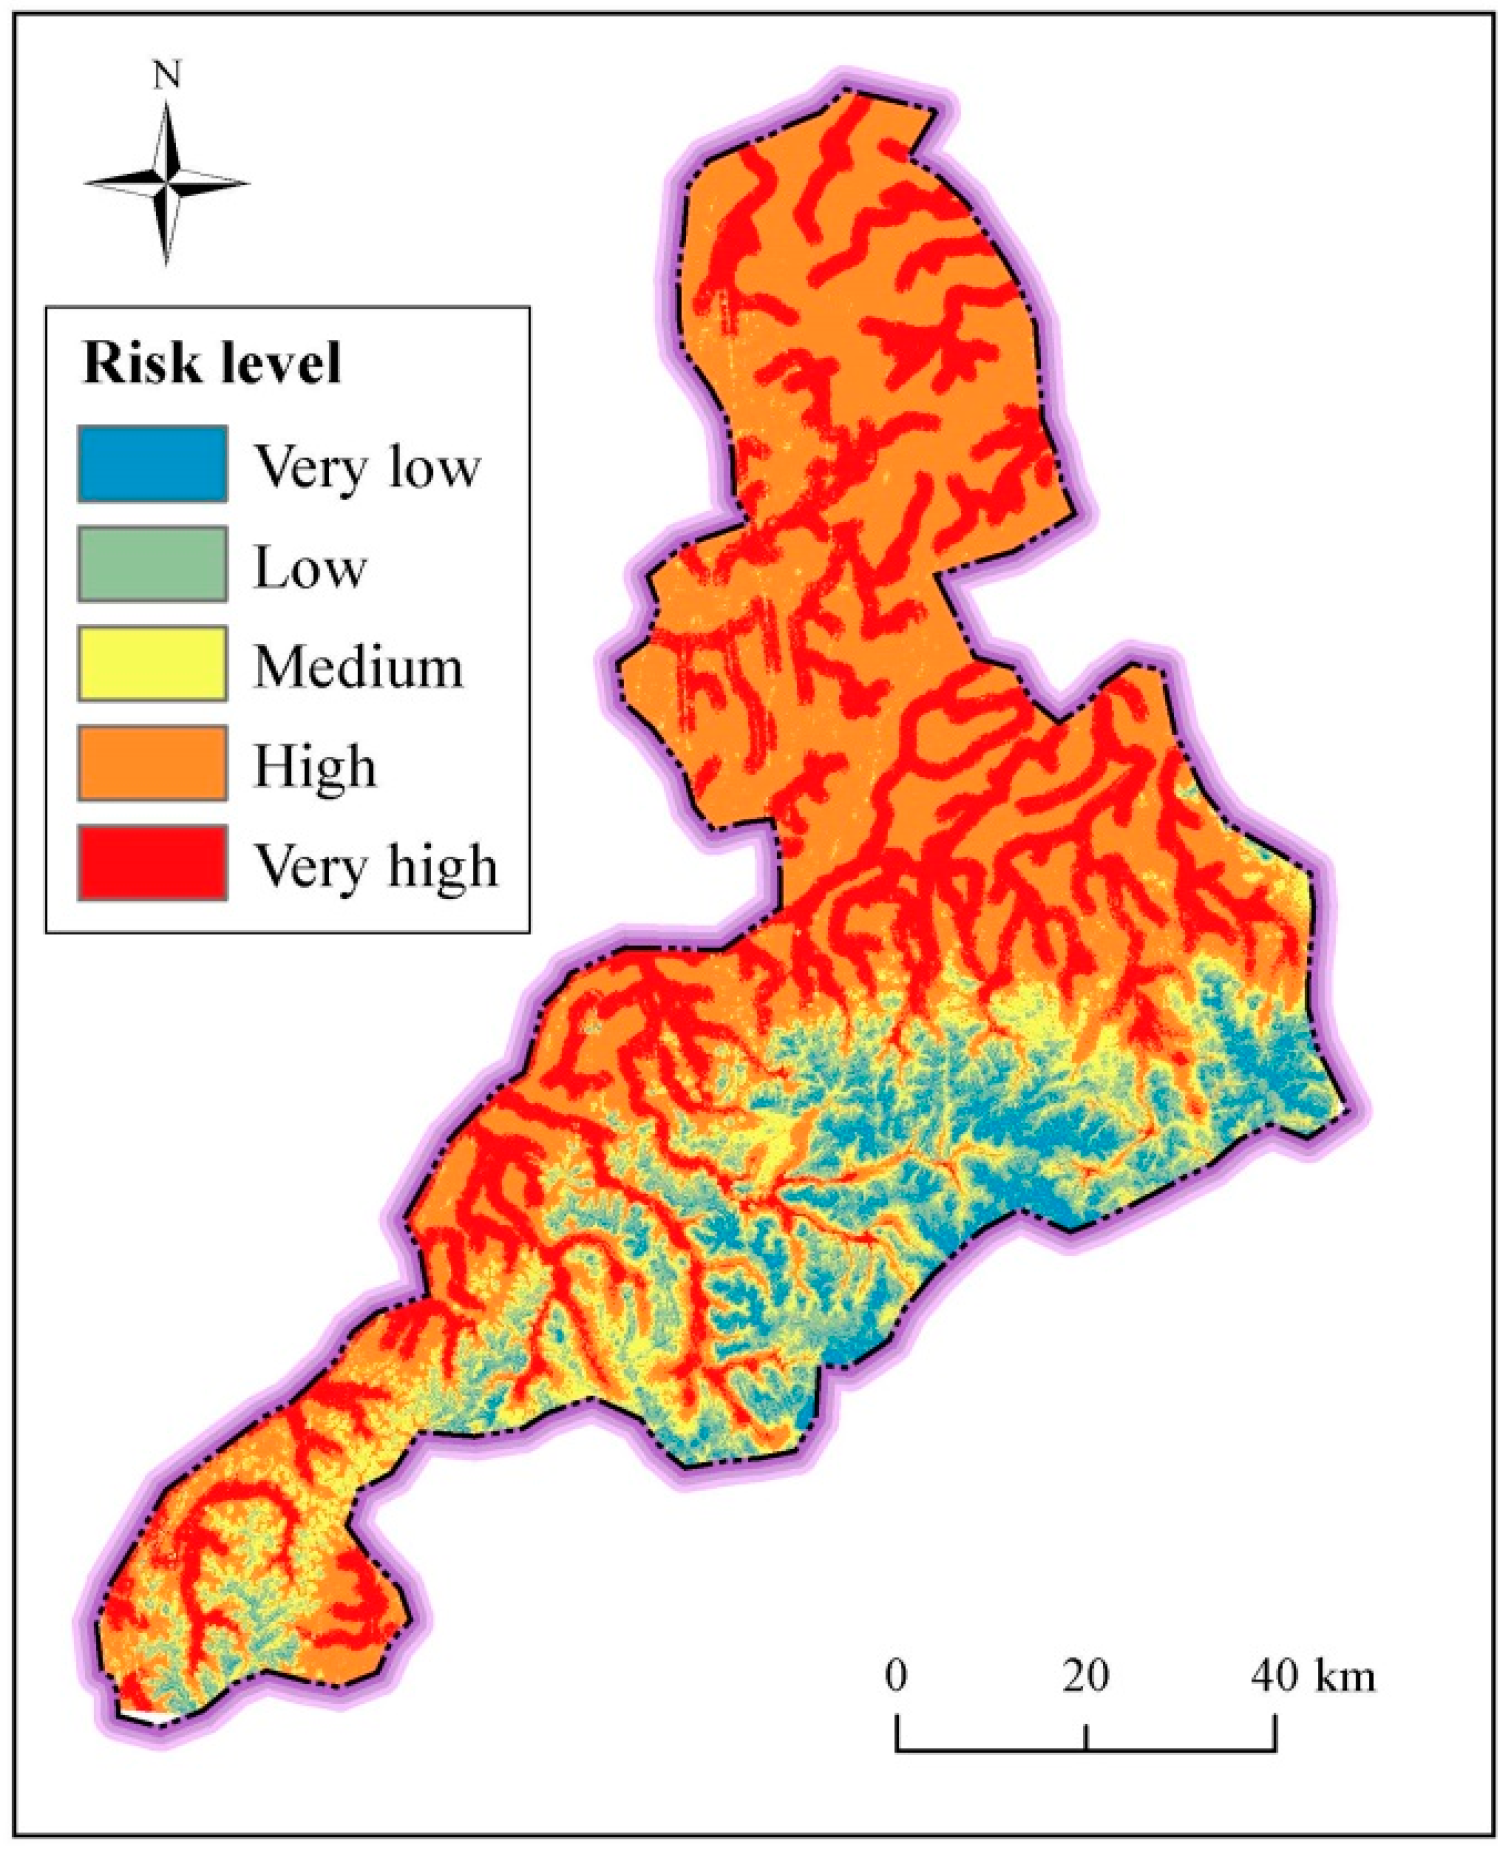
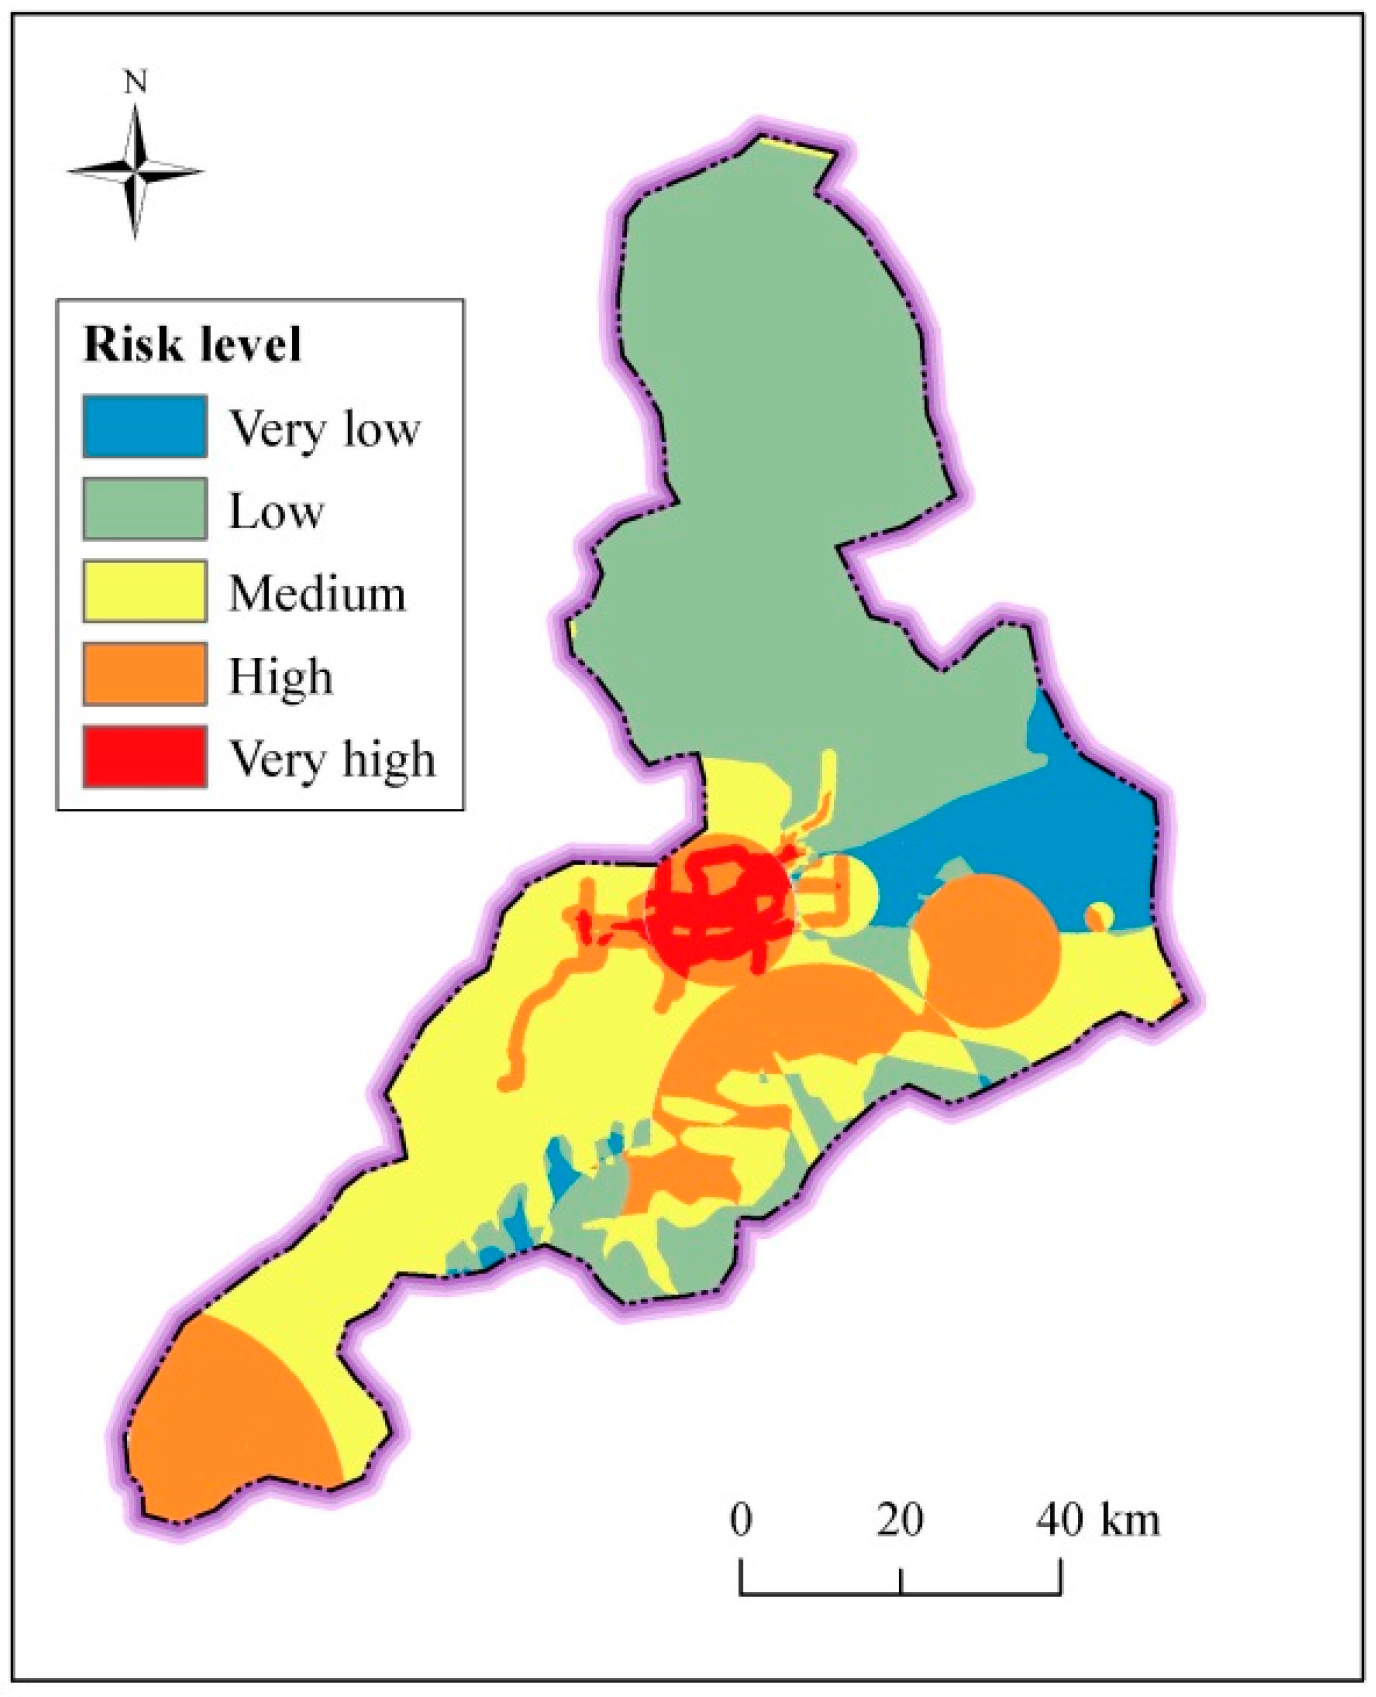
4.3. Spatial Distribution of Risk Assessment
4.4. Risk Level of Metro Line
5. Discussion
5.1. Uncertainties of AHP
5.2. Suggestive Countermeasures
6. Conclusions
- The AHP method incorporated into GIS can make a comprehensive and reasonable assessment result of risk level of groundwater seepage environment in Jinan City. The method can also be applied to other region based on different characteristics of environment. The results from the proposed method are useful for practical decision-making during urban planning.
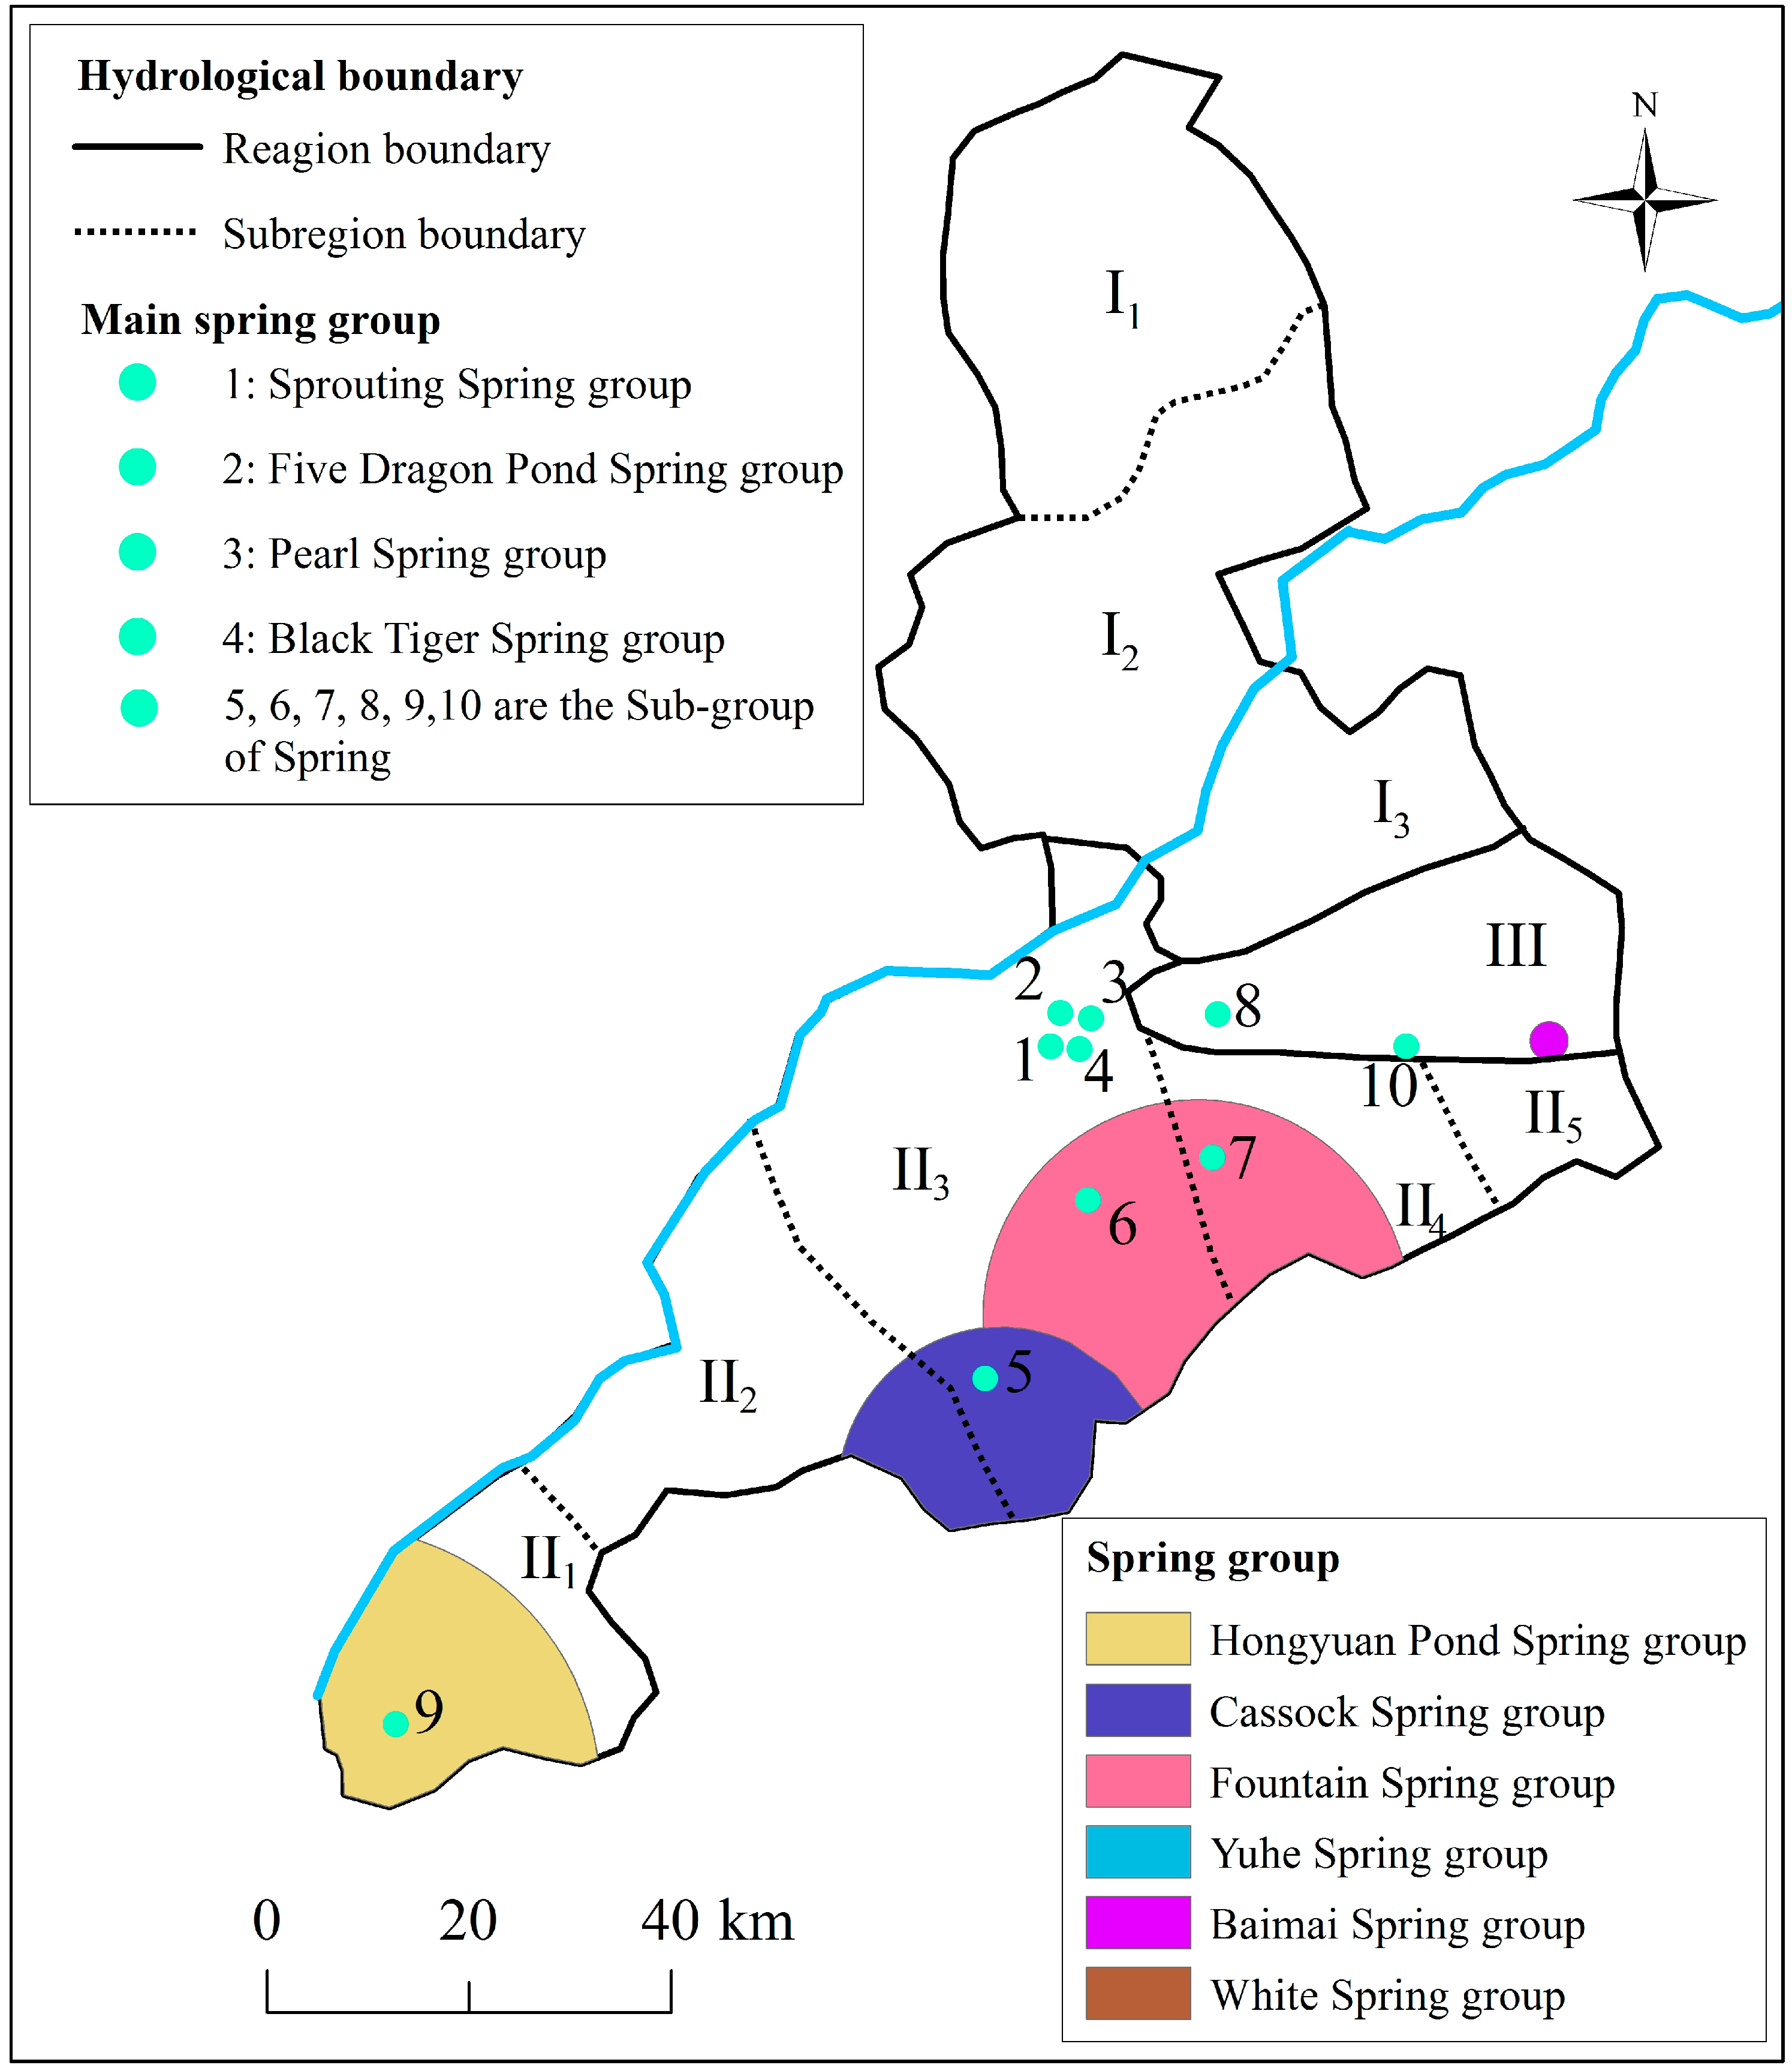
- The assessment of surface index shows that the regions with the high and very high risk level exceed 98% in Shanghe County and Jiyang County, where there are flat topography and intensive river system. The assessment of underground index shows that the areas with the high and very high risk level exceed 56% in urban area and Pingyin County, where distribute many spring groups and active faults. The areas with the distribution of spring groups and active faults are often vulnerable to bear the disturbance of anthropic activities.
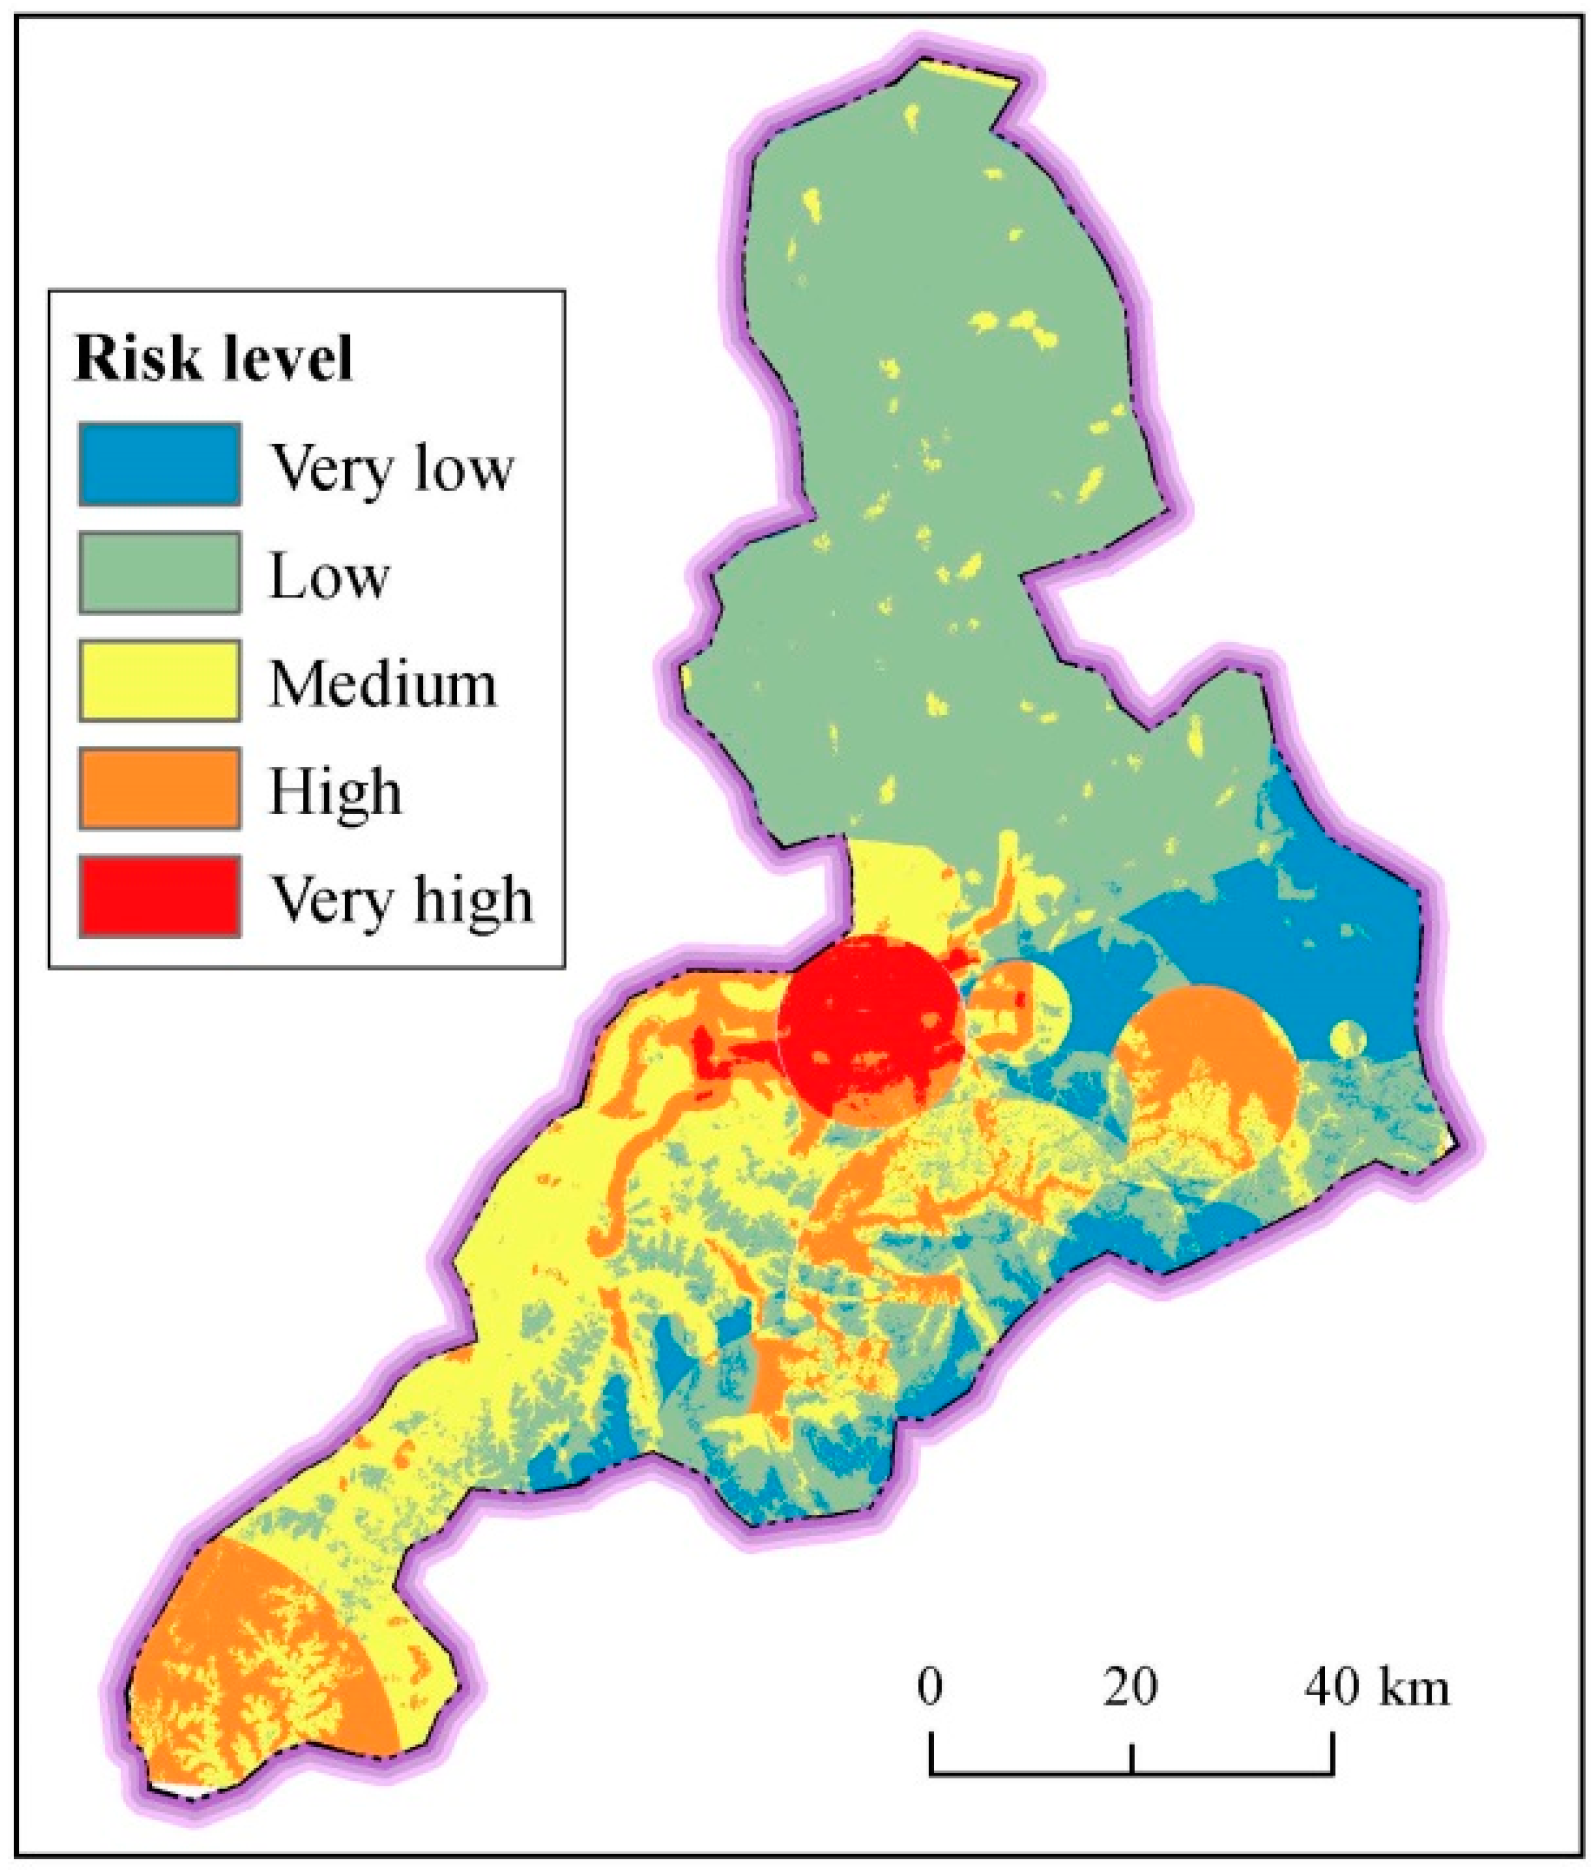
- The comprehensive assessment result shows that about 14% of the urban area belongs to very high risk level, where the main four spring groups distributed. The regions of relatively high risk are 20% in urban area, 9.46% in Changqing County and 43% in Pingyin County, where the characteristics of hydrogeology and geology are vulnerable for metro line construction.
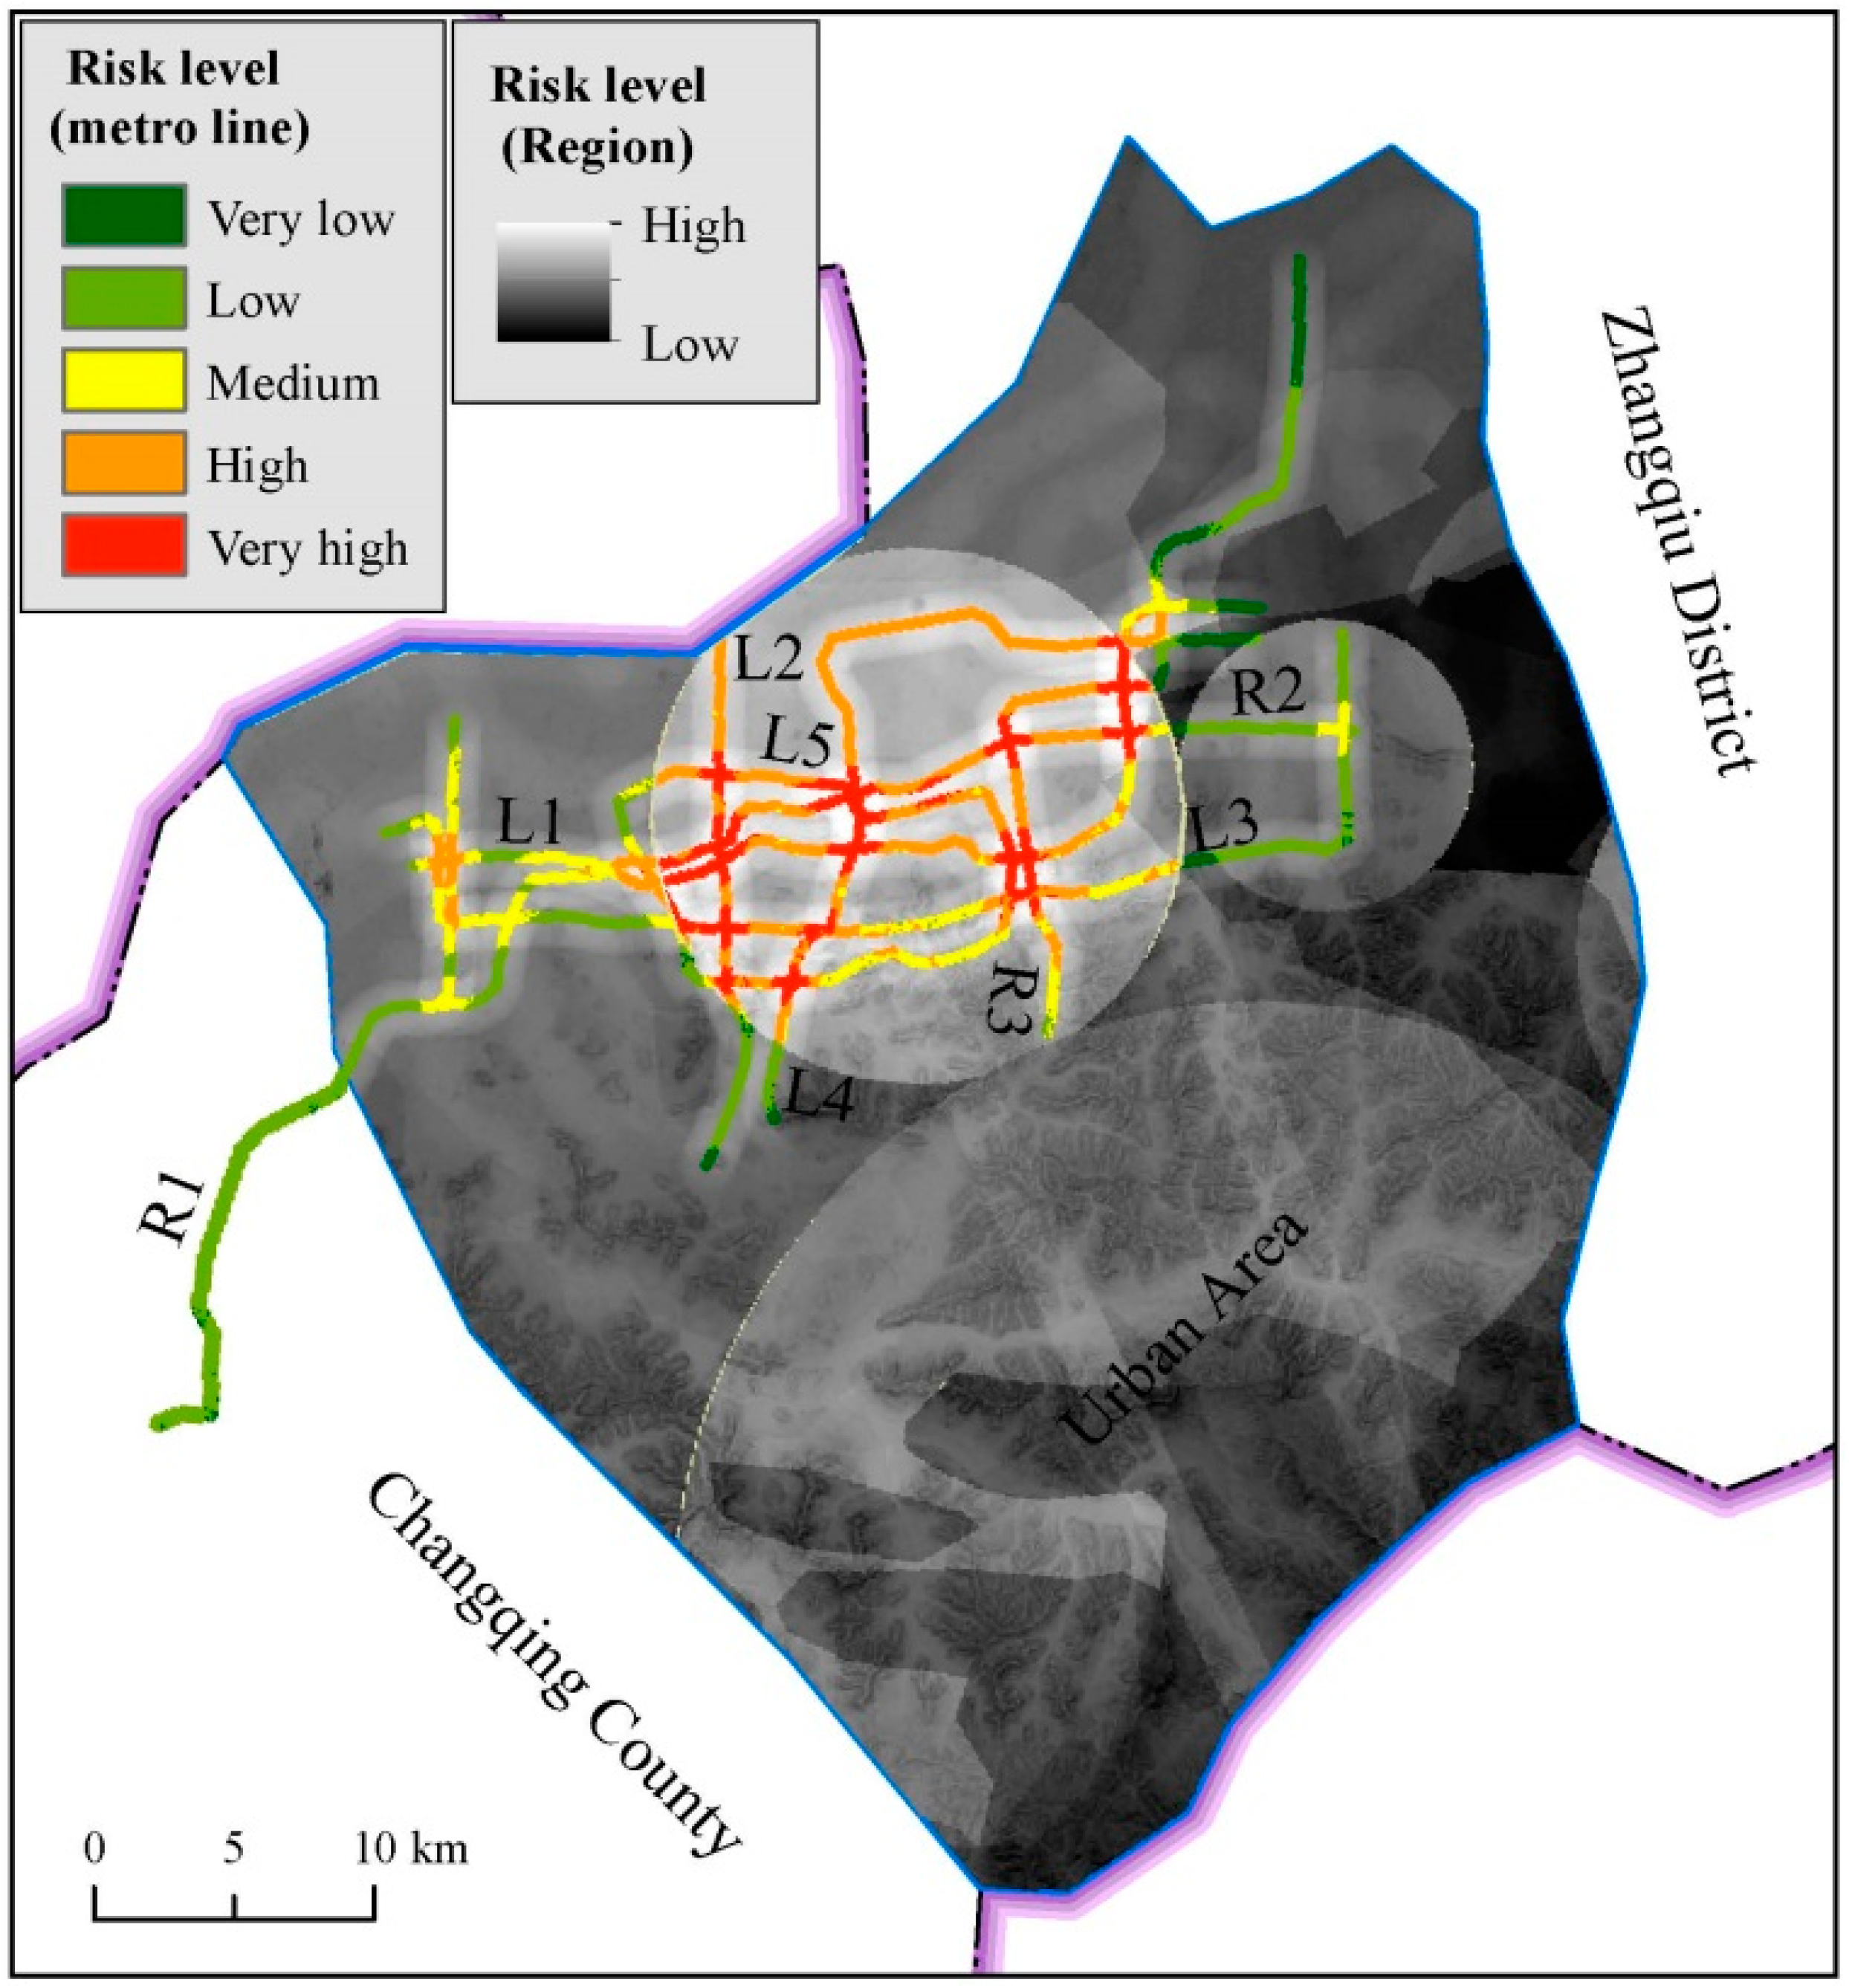
- According to the assessment result of risk level in the whole Jinan City, in the high risk region where there are four main spring groups; metro lines R1, R2, and R3 are under construction; and metro lines L1, L2, L3, L4 and L5 are planned have very high and high risk. It is suggested to construct elevated tunnel rather than underground tunnel to protect spring groups.
Acknowledgments
Author Contributions
Conflicts of Interest
References
- Jinan Surveying and Mapping Institute (JSMI). Standard Stratum in Jinan City; Jinan Surveying and Mapping Institute (JSMI): Jinan City, China, 2014. (In Chinese) [Google Scholar]
- Wang, Q. The Integrated Research of Evaluating and Protection of Groundwater in Jinan. Master’s Thesis, Shandong University, Jinan, China, 2007. (In Chinese). [Google Scholar]
- Wang, J.L.; Jin, M.G.; Lu, G.P.; Zhang, D.L.; Kang, F.X.; Jia, B.J. Investigation of discharge-area groundwaters for recharge source characterization on different scales: The case of Jinan in northern China. Hydrogeol. J. 2016, 24, 1723–1737. [Google Scholar] [CrossRef]
- Wu, H.N.; Shen, S.L.; Yang, J. Identification of tunnel settlement caused by land subsidence in soft deposit of Shanghai. J. Perform. Constr. Facil. ASCE 2017. [Google Scholar] [CrossRef]
- Han, C. Study of the Impact of Underground Space Development on the Spring in Jinan City. Master’s Thesis, Jinan University, Jinan, China, 2015. (In Chinese). [Google Scholar]
- Chai, J.C.; Shen, S.L.; Zhu, H.H.; Zhang, X.L. Land subsidence due to groundwater drawdown in Shanghai. Géotechnique 2004, 54, 143–148. [Google Scholar] [CrossRef]
- Chai, J.C.; Shen, S.L.; Ding, W.Q.; Zhu, H.H.; Cater, J.P. Numerical investigation of the failure of a building in Shanghai, China. Comput. Geotech. 2014, 55, 482–493. [Google Scholar] [CrossRef]
- Shen, S.L.; Wu, H.N.; Cui, Y.J.; Yin, Z.Y. Long-term settlement behavior of the metro tunnel in Shanghai. Tunn. Undergr. Space Technol. 2014, 40, 309–323. [Google Scholar] [CrossRef]
- Wu, H.N.; Shen, S.L.; Liao, S.M.; Yin, Z.Y. Longitudinal structural modelling of shield tunnels considering shearing dislocation between segmental rings. Tunn. Undergr. Space Technol. 2015, 50, 317–323. [Google Scholar] [CrossRef]
- Cui, Q.L.; Shen, S.L.; Xu, Y.S.; Wu, H.N.; Yin, Z.Y. Mitigation of geohazards during deep excavation in Karst region with caverns: A case study. Eng. Geol. 2015, 195, 16–27. [Google Scholar] [CrossRef]
- Cui, Q.L.; Shen, S.L.; Xu, Y.S.; Yin, Z.Y.; Horpibulsuk, S. Field performance of jacking pipe during jacking in soft deposits. Tunn. Undergr. Space Technol. 2015, 49, 336–344. [Google Scholar] [CrossRef]
- Cheng, W.C.; Ni, J.C.; Shen, S.L. Experimental and analytical modeling of shield segment under cyclic loading. Int. J. Geomech. ASCE 2017, 17, 04016146. [Google Scholar] [CrossRef]
- Cheng, W.C.; Ni, J.C.; Shen, S.L.; Huang, H.W. Investigation of factors affecting jacking force: A case study. ICE Proc. Civ. Eng. -Geotech. Eng. 2017, 170, 322–334. [Google Scholar] [CrossRef]
- Shen, S.L.; Wang, Z.F.; Cheng, W.C. Estimation of lateral displacement induced by jet grouting in clayey soils. Geotechnique 2017, 67, 621–630. [Google Scholar] [CrossRef]
- Wang, J.X.; Feng, B.; Liu, Y.; Wu, L.G.; Zhu, Y.F.; Zhang, X.S.; Tang, Y.Q.; Yang, P. Controlling subsidence caused by de-watering in a deep foundation pit. Bull. Eng. Geol. Environ. 2012, 71, 545–555. [Google Scholar] [CrossRef]
- Wang, J.X.; Hu, L.S.; Wu, L.G.; Tang, Y.Q.; Zhu, Y.F.; Yang, P. Hydraulic barrier function of the underground continuous concrete wall in the pit of subway station and its optimization. Environ. Geol. 2009, 57, 447–453. [Google Scholar] [CrossRef]
- Xu, Y.S.; Shen, S.L.; Ren, D.J.; Wu, H.N. Factor analysis of land subsidence in Shanghai: A view based on Strategic Environmental Assessment. Sustainability 2016, 8, 573. [Google Scholar] [CrossRef]
- Shen, S.L.; Ma, L.; Xu, Y.S.; Yin, Z.Y. Interpretation of increased deformation rate in aquifer, I.V. due to groundwater pumping in Shanghai. Can. Geotech. J. 2013, 50, 1129–1142. [Google Scholar] [CrossRef]
- Shen, S.L.; Wang, Z.F.; Yang, J.; Ho, C.E. Generalized approach for prediction of jet grout column diameter. J. Geotech. Geoenviron. Eng. 2013, 139, 2060–2069. [Google Scholar] [CrossRef]
- Wu, Y.X.; Shen, S.L.; Yuan, D.J. Characteristics of dewatering induced drawdown curve under blocking effect of retaining wall in aquifer. J. Hydrol. 2016, 539, 554–566. [Google Scholar] [CrossRef]
- Shen, S.L.; Xu, Y.S. Numerical evaluation of land subsidence induced by groundwater pumping in Shanghai. Can. Geotech. J. 2011, 48, 1378–1392. [Google Scholar] [CrossRef]
- Wu, Y.X.; Shen, S.L.; Xu, Y.S.; Yin, Z.Y. Characteristics of groundwater seepage with cutoff wall in gravel aquifer. I: Field observations. Can. Geotech. J. 2015, 52, 1526–1538. [Google Scholar]
- Wu, Y.X.; Shen, J.S.; Cheng, W.C.; Hino, T. Semi-analytical solution to pumping test data with barrier, wellbore storage, and partial penetration effects. Eng. Geol. 2017, 226, 44–51. [Google Scholar] [CrossRef]
- Agliardi, F.; Crosta, G.; Zanchi, A. Structural constraints on deep-seated slope deformation kinematics. Eng. Geol. 2001, 59, 83–102. [Google Scholar] [CrossRef]
- Ni, J.C.; Cheng, W.C.; Ge, L. A case history of field pumping tests in a deep gravel formation in the Taipei Basin, Taiwan. Eng. Geol. 2011, 117, 17–28. [Google Scholar] [CrossRef]
- Ni, J.C.; Cheng, W.C.; Ge, L. A simple data reduction method for pumping tests with tidal, partial penetration, and storage effects. Soils Found. 2013, 53, 894–902. [Google Scholar] [CrossRef]
- Pujades, E.; López, A.; Carrera, J.; Vázquez-Suñé, E.; Jurado, A. Barrier effect of underground structures on aquifers. Eng. Geol. 2012, 145, 41–49. [Google Scholar] [CrossRef]
- Pujades, E.; Vázquez-Suñé, E.; Carrera, J.; Vilarrasa, V.; De Simone, S.; Jurado, A.; Ledesma, A.; Ramos, G.; Lloret, A. Deep enclosures versus pumping to reduce settlements during shaft excavations. Eng. Geol. 2014, 169, 100–111. [Google Scholar] [CrossRef]
- Ma, L.; Xu, Y.S.; Shen, S.L.; Sun, W.J. Evaluation of the hydraulic conductivity of aquifers with piles. Hydrogeol. J. 2014, 22, 371–382. [Google Scholar] [CrossRef]
- Yu, G.R. Jinan Urban Infrastructure Development and Utilization of Underground Space. Master’s Thesis, Tongji University, Shanghai, China, 2007. (In Chinese). [Google Scholar]
- Beijing Urban Construction Exploration & Surveying Institute (BUCESI). Spring Impact Study of Construction of Jinan Rail Traffic; Beijing Urban Construction Exploration & Surveying Institute (BUCESI): Beijing, China, 2011. (In Chinese) [Google Scholar]
- Beijing Urban Construction Exploration & Surveying Institute (BUCESI). Spring Impact Study of Construction of Jinan Rail Network Planning; Beijing Urban Construction Exploration & Surveying Institute (BUCESI): Beijing, China, 2013. (In Chinese) [Google Scholar]
- Xu, Y.S.; Shen, J.S.; Wu, H.N.; Zhang, N. Risk and impacts on the environment of free-phase biogas in Quaternary deposits along the coastal region of Shanghai. Ocean Eng. 2017, 137, 129–137. [Google Scholar] [CrossRef]
- Xu, Y.S.; Shen, S.L.; Ma, L.; Sun, W.J.; Yin, Z.Y. Evaluation of the blocking effect of retaining walls on groundwater seepage in aquifers with different insertion depths. Eng. Geol. 2014, 183, 254–264. [Google Scholar] [CrossRef]
- Xu, Y.S.; Yuan, Y.; Shen, S.L.; Yin, Z.Y.; Wu, H.N.; Ma, L. Investigation into subsidence hazards due to groundwater pumping from Aquifer, I.I. in Changzhou, China. Natl. Hazards 2015, 78, 281–296. [Google Scholar] [CrossRef]
- Shen, S.L.; Cui, Q.L.; Ho, E.C.; Xu, Y.S. Ground response to multiple parallel Microtunneling operations in cemented silty clay and sand. J. Geotech. Geoenviron. Eng. 2016, 142, 04016001. [Google Scholar] [CrossRef]
- Shen, S.L.; Wang, J.P.; Wu, H.N.; Xu, Y.S.; Ye, G.L.; Yin, Z.Y. Evaluation of hydraulic conductivity for both marine and deltaic deposit based on piezocone test. Ocean Eng. 2015, 110, 174–182. [Google Scholar] [CrossRef]
- Shen, S.L.; Wu, Y.X.; Xu, Y.S.; Hino, T.; Wu, H.N. Evaluation of hydraulic parameter based on groundwater pumping test of multi-aquifer system of Tianjin. Comput. Geotech. 2015, 68, 196–207. [Google Scholar] [CrossRef]
- Yin, Z.Y.; Chang, C.S.; Hicher, P.Y. Micromechanical modelling for effect of inherent anisotropy on cyclic behaviour of sand. Int. J. Solids Struct. 2010, 47, 1933–1951. [Google Scholar] [CrossRef]
- Yin, Z.Y.; Chang, C.S.; Karstunen, M.; Hicher, P.Y. An anisotropic elastic viscoplastic model for soft clays. Int. J. Solids Struct. 2010, 47, 665–677. [Google Scholar] [CrossRef]
- Yin, Z.Y.; Karstunen, M.; Chang, C.S.; Koskinen, M.; Lojander, M. Modeling time-dependent behavior of soft sensitive clay. ASCE J. Geotech. Geoenviron. Eng. 2011, 137, 1103–1113. [Google Scholar] [CrossRef]
- Yin, Z.Y.; Hattab, M.; Hicher, P.Y. Multiscale modeling of a sensitive marine clay. Int. J. Numer. Anal. Methods Geomech. 2011, 35, 1682–1702. [Google Scholar] [CrossRef]
- Yin, Z.Y.; Chang, C.S. Stress dilatancy behavior for sand under loading and unloading conditions. Int. J. Numer. Anal. Methods Geomech. 2013, 37, 855–870. [Google Scholar] [CrossRef]
- Yin, Z.Y.; Zhao, J.; Hicher, P.Y. A micromechanics-based model for sand-silt mixtures. Int. J. Solids Struct. 2014, 51, 1350–1363. [Google Scholar] [CrossRef]
- Saaty, T.L. Decision making with the analytic hierarchy process. Int. J. Serv. Sci. 2008, 1, 83–98. [Google Scholar] [CrossRef]
- Sadiq, R.; Tesfamariam, S. Environmental decision-making under uncertainty using intuitionistic fuzzy analytic hierarchy process (IF-AHP). Stoch. Environ. Res. Risk. Assess. 2009, 23, 75–91. [Google Scholar] [CrossRef]
- Lyu, H.M.; Wang, G.F.; Shen, J.S.; Lu, L.H.; Wang, G.Q. Analysis and GIS mapping of flooding hazards on 10 May 2016, Guangzhou, China. Water 2016, 8, 447. [Google Scholar] [CrossRef]
- Lyu, H.M.; Wang, G.F.; Cheng, W.C.; Shen, S.L. Tornado hazards on June 23rd in Jiangsu Province, China: Preliminary investigation and analysis. Natl. Hazards 2017, 85, 597–604. [Google Scholar] [CrossRef]
- Saaty, T.L. Creative Thinking, Problem Solving and Decision Making; Rws Publications: Pittsburgh, PA, USA, 2010. [Google Scholar]
- Shen, S.L.; Wu, Y.X.; Misra, A. Calculation of head difference at two sides of a cut-off barrier during excavation dewatering. Comput. Geotech. 2017, 91, 192–202. [Google Scholar] [CrossRef]
- Tan, Y.; Lu, Y. Forensic diagnosis of a leaking accident during excavation. J. Perform. Constr. Facil. ASCE 2017, 31, 04017061. [Google Scholar] [CrossRef]
- Tan, Y.; Lu, Y. Why excavation of a small air shaft caused excessively large displacements: Forensic investigation. J. Perform. Constr. Facil. ASCE 2017, 31, 04016083. [Google Scholar] [CrossRef]
- Tan, Y.; Zhu, H.; Peng, F.; Karlsrud, K.; Wei, B. Characterization of semi-top-down excavation for subway station in Shanghai soft ground. Tunn. Undergr. Space Technol. 2017, 68, 244–261. [Google Scholar] [CrossRef]
- Tan, Y.; Huang, R.; Kang, Z.; Wei, B. Covered semi-top-down excavation of subway station surrounded by closely spaced buildings in downtown Shanghai: Building response. J. Perform. Constr. Facil. ASCE 2016, 30, 04016040. [Google Scholar] [CrossRef]


| Code | Region Name | Type | Code | Sub-Region |
|---|---|---|---|---|
| I | Alluvial plain of Yellow River | Pore water | I1 | Shang River area |
| I2 | Jiyang River area | |||
| I3 | North area of Xiaoqing River | |||
| II | North boundary of the Mount Tai | Karstic water | II1 | Pingying monoclinic area |
| II2 | Changqing monoclinic area | |||
| II3 | Jinan monoclinic area | |||
| II4 | Guodian monoclinic area | |||
| II5 | Monoclinic area around Ming River | |||
| II6 | Monoclinic area around Xiaoqing River | |||
| III | Piedmont alluvial plain | Pore water | III | Piedmont alluvial plain |
| Region | Sub-Region | Recharge | Discharge | Exploitable Capacity | Current Exploitation | Risk Level |
|---|---|---|---|---|---|---|
| I | I1 | 69.77 | 28.81 | 40.96 | 32.05 | 2 |
| I2 | 73.46 | 24.83 | 48.63 | 20.82 | ||
| I3 | 23.23 | 9.56 | 13.67 | 4.46 | ||
| Subtotal | 166.46 | 63.20 | 103.26 | 57.33 | ||
| II | II1 | 13.92 | 1.15 | 12.77 | 7.09 | 3 |
| II2 | 15.91 | - | 15.91 | 4.93 | ||
| II3 | 58.99 | 23.97 | 35.02 | 36.27 | ||
| II4 | 34.55 | 8.01 | 26.54 | 32.21 | ||
| II5 | 32.05 | 17.39 | 14.66 | 14.48 | ||
| II6 | 30.85 | 9.06 | 21.79 | 13.64 | ||
| Subtotal | 186.27 | 59.58 | 126.69 | 108.62 | ||
| III | III | 48.22 | 16.49 | 31.73 | 40.33 | 1 |
| Aquifer Type | Geological Time | Discharge Capacity (m3/day) | Class |
|---|---|---|---|
| Fissure water in metamorphic rocks and magmatic rocks | σ, Ar | Generally: <100 | 1 |
| Fissure water in Weathered magmatic | Є1, Є2, Є3 | Generally: <100 | 2 |
| Partially: 100–500 | |||
| Interbedded karst-fissure aquifer | Є2z, Є3f | Generally: <500 | 3 |
| Partially: 500–1000 | |||
| Alluvial Quaternary porous aquifer | Q4 | Generally: <200 | 4 |
| Q2 | Piedmont: 50–300 | ||
| Q3 | Alluvial fan: 1000–2000 | ||
| Karstic aquifer in carbonate | Є2z, Є3f, O1, O2 | Hills: 100–500 | 5 |
| Piedmont: 1000–5000 | |||
| Partially: >10,000 |
| U11 | U12 | U13 | U14 | wi | |
|---|---|---|---|---|---|
| U11 | 1 | 2 | 3 | 3 | 0.475 |
| U12 | 1/2 | 1 | 1 | 2 | 0.231 |
| U13 | 1/3 | 1/3 | 1 | 4 | 0.188 |
| U14 | 1/3 | 1/2 | 1/4 | 1 | 0.105 |
| U21 | U22 | U23 | U24 | U25 | wi | |
|---|---|---|---|---|---|---|
| U21 | 1 | 1 | 2 | 3 | 3 | 0.321 |
| U22 | 1 | 1 | 1 | 2 | 3 | 0.259 |
| U23 | 1/2 | 1 | 1 | 2 | 3 | 0.208 |
| U24 | 1/3 | 1/2 | 1/2 | 1 | 1 | 0.109 |
| U25 | 1/3 | 1/3 | 1/2 | 1 | 1 | 0.101 |
| Object Layer | Sub-Object Layer | Factor Layer | wi | wi |
|---|---|---|---|---|
| Geoenvironment risk | Surface index U1 | Topographical slope (U11) | 0.475 | 0.363 |
| Topographical elevation (U12) | 0.231 | |||
| River density (U13) | 0.188 | |||
| River proximity (U14) | 0.105 | |||
| Underground index U2 | Spring group distribution (U21) | 0.321 | 0.637 | |
| Hydrogeology (U22) | 0.259 | |||
| Geological environment (U23) | 0.208 | |||
| Metro line density (U24) | 0.109 | |||
| Metro line proximity (U25) | 0.101 |
| District | Risk Coverage of Surface Index (%) | ||||
|---|---|---|---|---|---|
| Very Low | Low | Medium | High | Very High | |
| Shanghe County | 0 | 0.01 | 0.58 | 65.09 | 34.32 |
| Jiyang County | 0 | 0.02 | 10.02 | 66.54 | 32.42 |
| Zhangqiu District | 7.79 | 13.12 | 12.53 | 40.63 | 25.93 |
| Urban Area | 10.90 | 19.58 | 17.42 | 28.83 | 23.27 |
| Changqing County | 5.03 | 16.15 | 21.72 | 33.06 | 24.04 |
| Pingyin County | 0.1 | 8.13 | 23.64 | 42.62 | 24.65 |
| District | Risk Coverage of Underground Index (%) | ||||
|---|---|---|---|---|---|
| Very Low | Low | Medium | High | Very High | |
| Shanghe County | 99.18 | 0.02 | 0 | 0 | 0 |
| Jiyang County | 73.97 | 26.03 | 0 | 0 | 0 |
| Zhangqiu District | 67.77 | 15.14 | 17.09 | 0 | 0 |
| Urban Area | 0.9 | 8.43 | 27.55 | 36.84 | 26.28 |
| Changqing County | 0.02 | 24.41 | 65.54 | 10.03 | 0 |
| Pingyin County | 0.1 | 0.02 | 43.22 | 56.66 | 0 |
| District | Comprehensive Risk Coverage (%) | ||||
|---|---|---|---|---|---|
| Very Low | Low | Medium | High | Very High | |
| Shanghe County | 0.23 | 96.48 | 3.28 | 0.01 | 0 |
| Jiyang County | 0.16 | 94.56 | 5.27 | 0.01 | 0 |
| Zhangqiu District | 31.24 | 49.70 | 8.71 | 10.35 | 0 |
| Urban Area | 9.23 | 25.34 | 31.50 | 20.04 | 13.89 |
| Changqing County | 10.54 | 29.11 | 50.90 | 9.46 | 0 |
| Pingyin County | 0 | 7.31 | 49.97 | 42.72 | 0 |
© 2017 by the authors. Licensee MDPI, Basel, Switzerland. This article is an open access article distributed under the terms and conditions of the Creative Commons Attribution (CC BY) license (http://creativecommons.org/licenses/by/4.0/).
Share and Cite
Wang, G.-F.; Lyu, H.-M.; Shen, J.S.; Lu, L.-H.; Li, G.; Arulrajah, A. Evaluation of Environmental Risk Due to Metro System Construction in Jinan, China. Int. J. Environ. Res. Public Health 2017, 14, 1114. https://doi.org/10.3390/ijerph14101114
Wang G-F, Lyu H-M, Shen JS, Lu L-H, Li G, Arulrajah A. Evaluation of Environmental Risk Due to Metro System Construction in Jinan, China. International Journal of Environmental Research and Public Health. 2017; 14(10):1114. https://doi.org/10.3390/ijerph14101114
Chicago/Turabian StyleWang, Guo-Fu, Hai-Min Lyu, Jack Shuilong Shen, Lin-Hai Lu, Gang Li, and Arul Arulrajah. 2017. "Evaluation of Environmental Risk Due to Metro System Construction in Jinan, China" International Journal of Environmental Research and Public Health 14, no. 10: 1114. https://doi.org/10.3390/ijerph14101114