Comparison of Malaria Simulations Driven by Meteorological Observations and Reanalysis Products in Senegal

Abstract
:
1. Introduction
- -
- Real malaria data are unevenly distributed within countries and across regions;
- -
- The length of observed time series for malaria data is generally short (2001–2010 for Senegal).
- -
- The available data does not only depend on climate, but it also relies on other socioeconomic factors. It is thus important to disentangle the influence of climate on malaria compared to other driving factors. Consequently, we aim to address the following questions:
- -
- Where does malaria happen regularly, occasionally, and never?
- -
- When and how does the malaria transmission season take place?
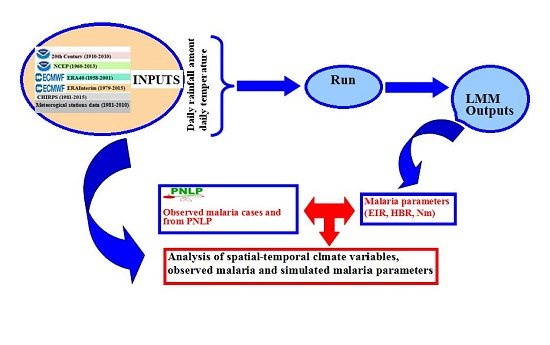
2. Materials and Methods
2.1. The Liverpool Malaria Model
2.2. Observed Datasets
3. Results
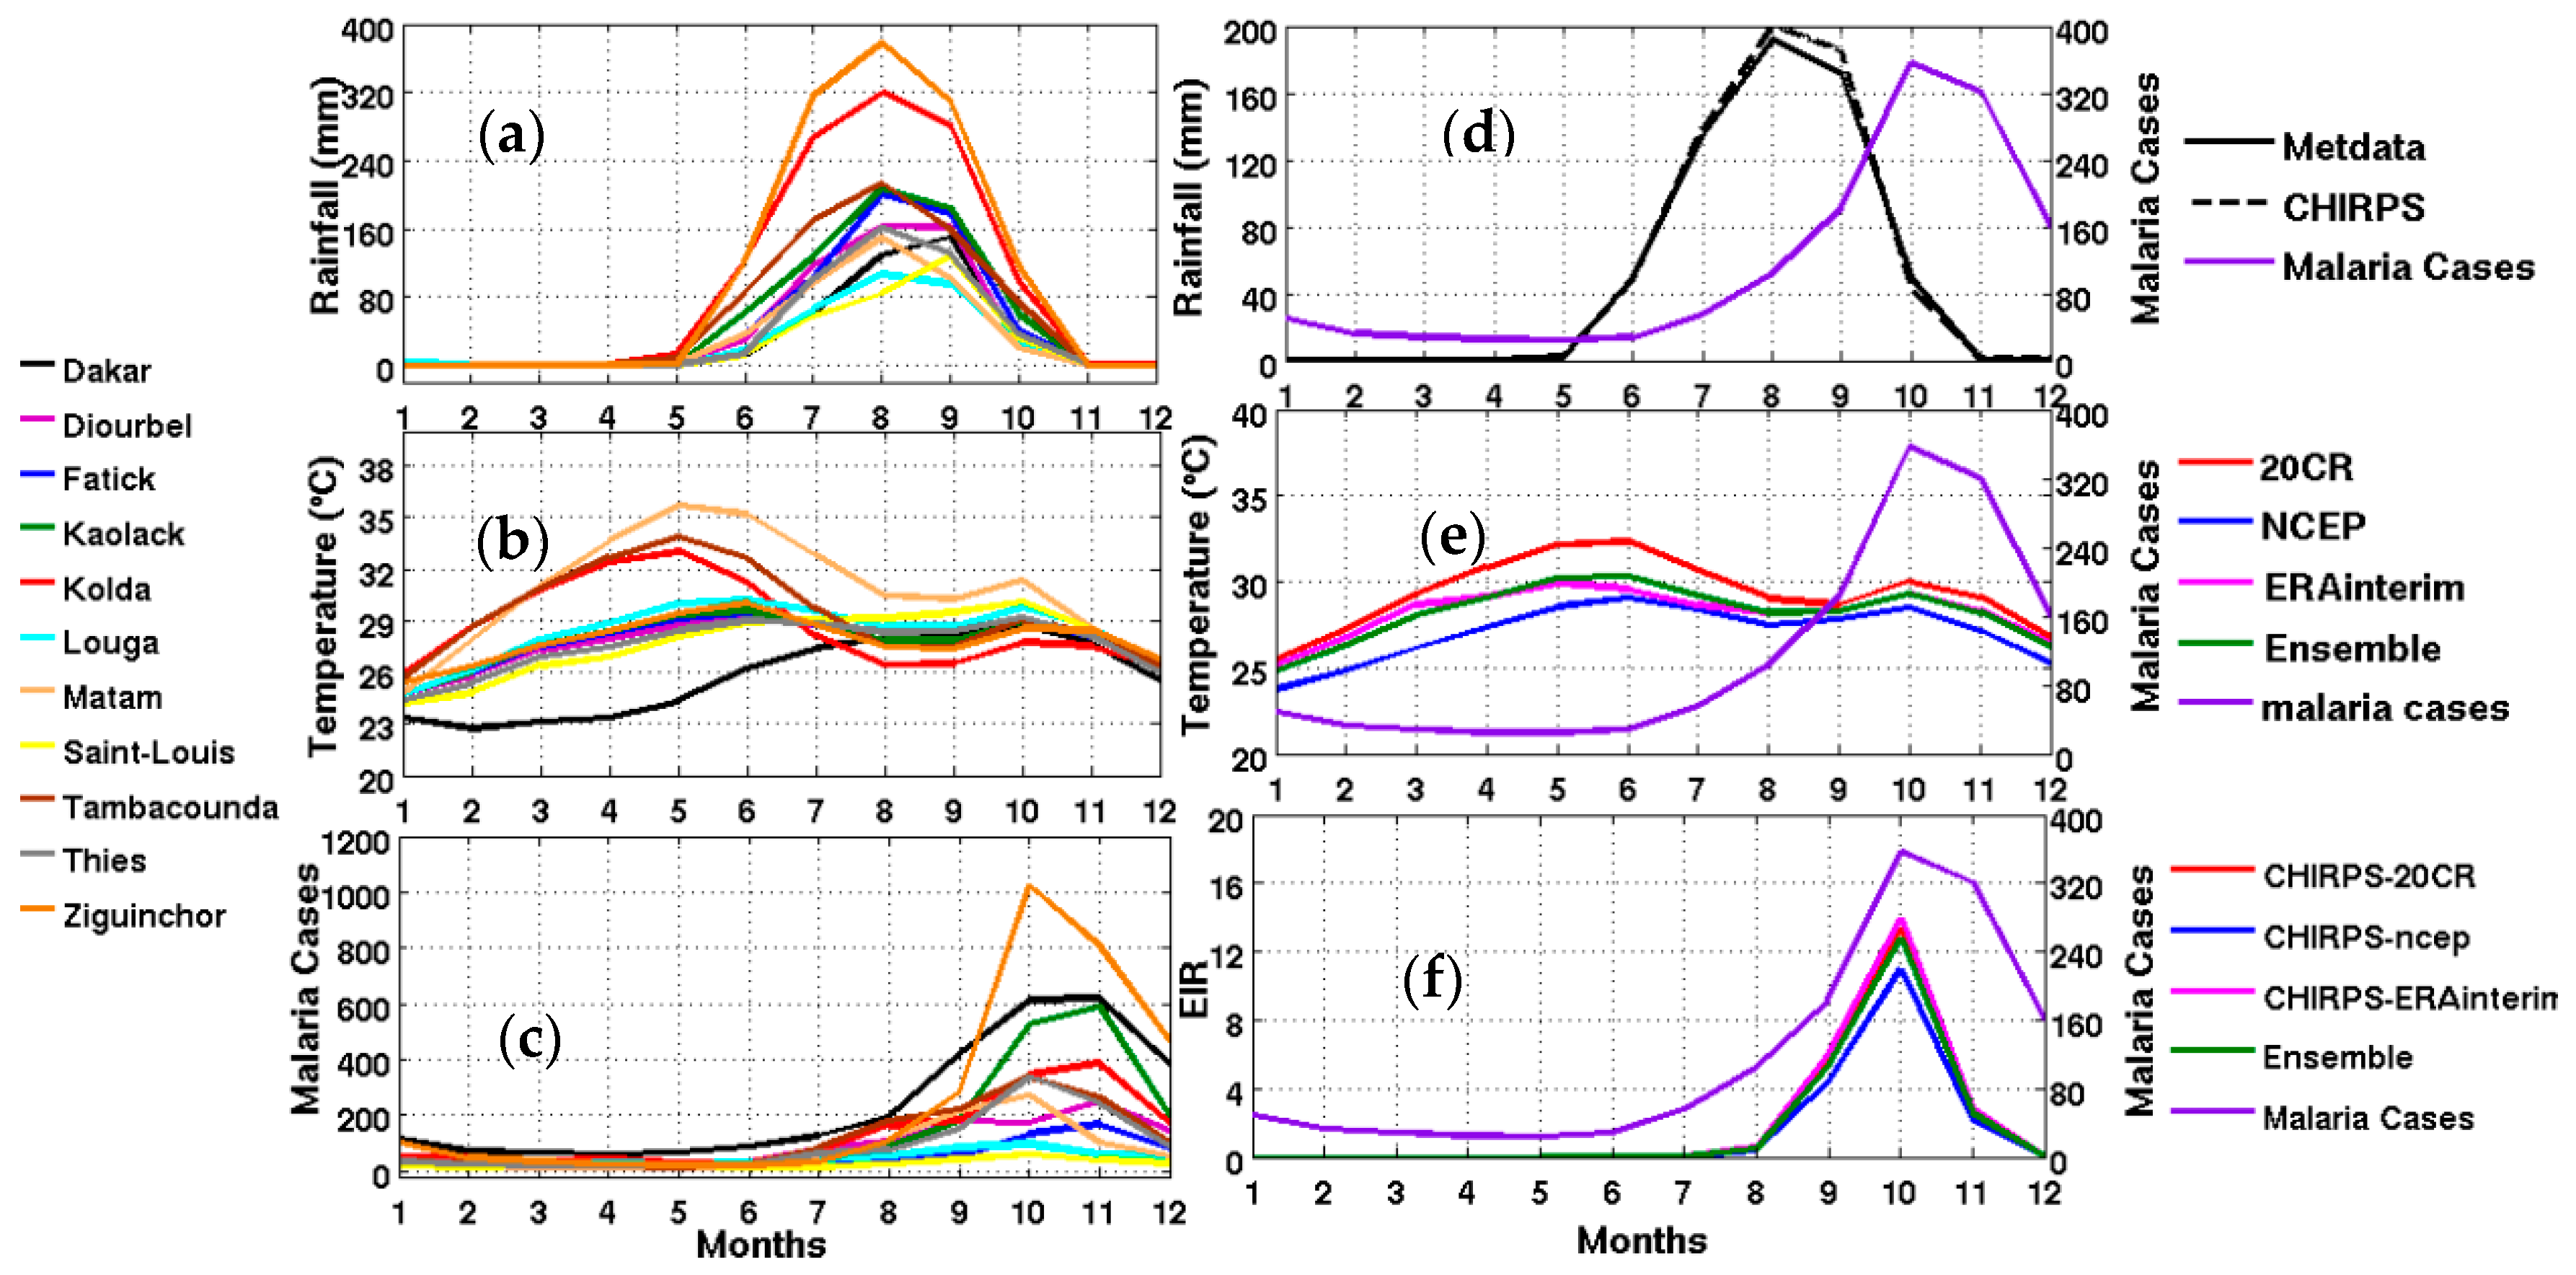
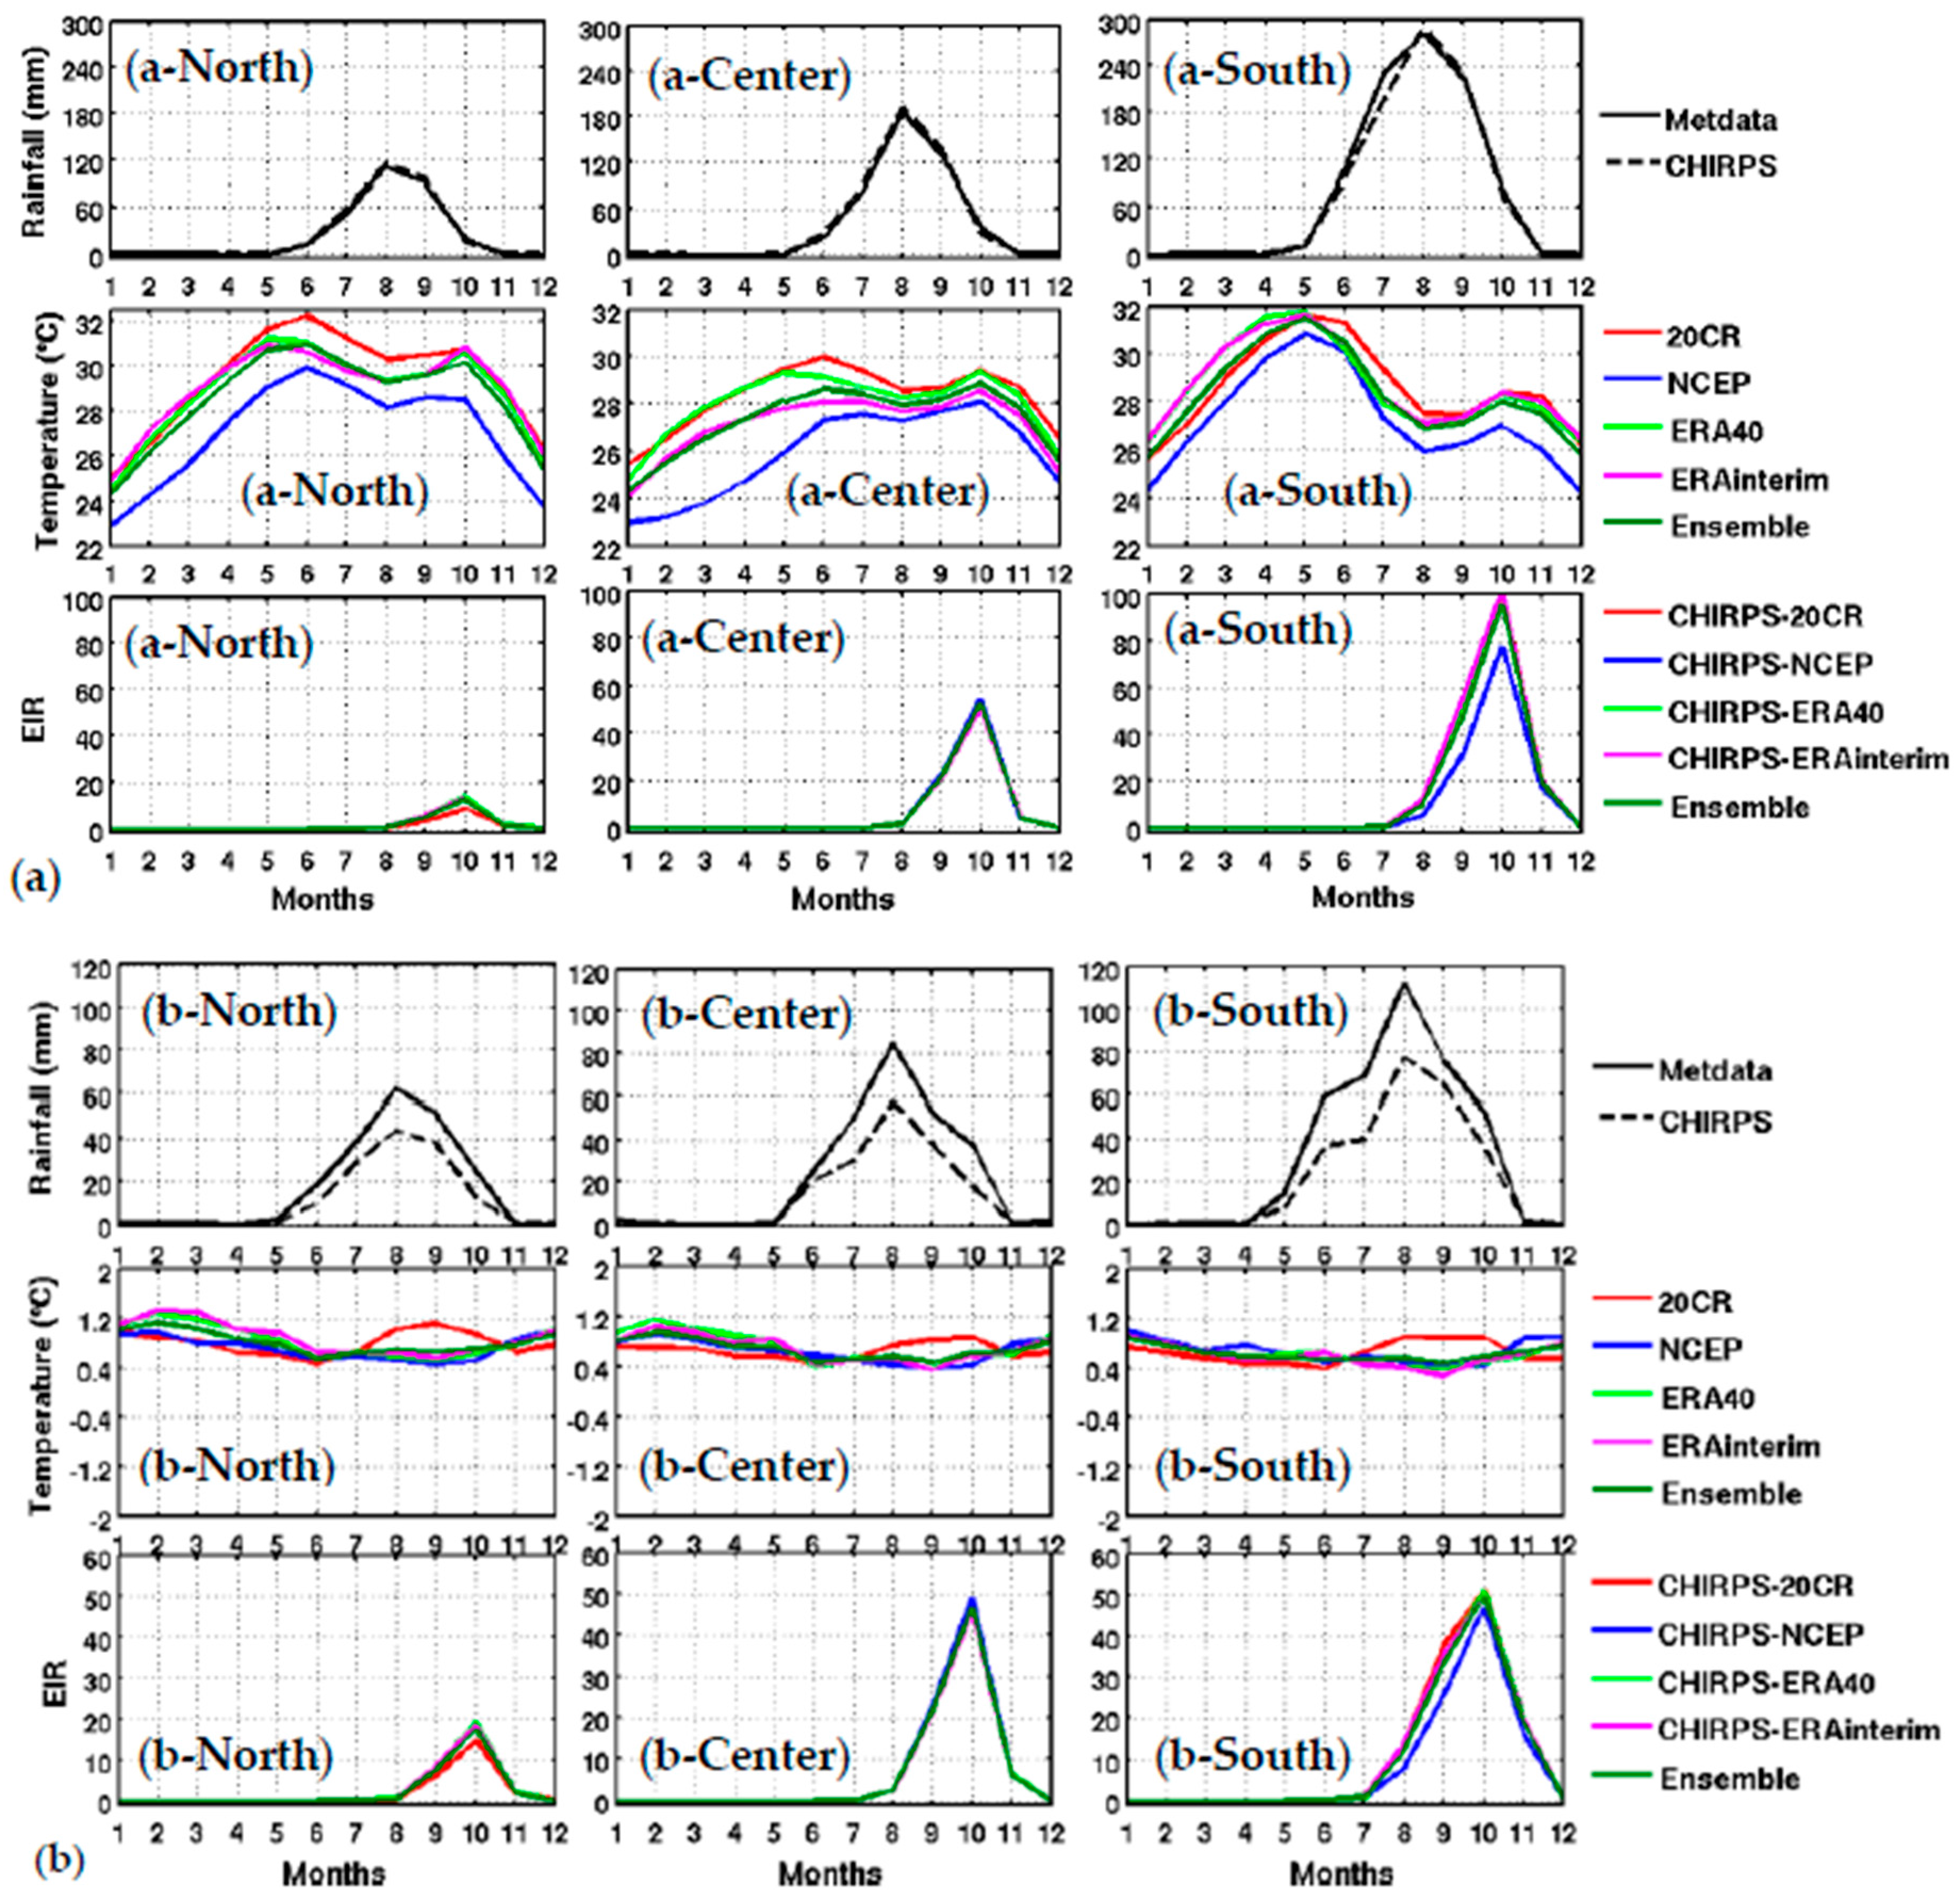
3.1. Climate Context
3.2. Seasonal Cycle of Observed Malaria
3.2.1. Observed Malaria Cases in Senegal
3.2.2. Evaluation of Malaria Simulations
3.3.3. Interannual and Long-Term Context
4. Discussion
5. Conclusions
Supplementary Materials
Acknowledgments
Author Contributions
Conflicts of Interest
References
- Bruce-Chwatt, L.J. Essential Malariology, 2nd ed.; John Wiley and Sons: New York, NY, USA, 1985; Volume 14, pp. 33–37. [Google Scholar]
- Gupta, S.; Hill, A.S. Dynamic interaction in malaria: Host heterogeneity meets parasite polymorphism. Proc. Soc. Lond. B 1998, 261, 361–370. [Google Scholar] [CrossRef] [PubMed]
- Singh, B.; Daneshvar, C. Plasmodium knowlesi Malaria in Malaysia. Med. J. Malays. 2010, 65, 166–172. [Google Scholar]
- Sinka, M.E.; Bangs, M.J.; Manguin, S.; Coetzee, M.; Mbogo, C.M.; Hemingway, J.; Patil, A.P.; Temperley, W.H.; Gething, P.W.; Kabaria, C.W.; et al. The dominant Anopheles vectors of human malaria in Africa, Europe and the Middle East: Occurrence data, distribution maps and bionomic précis. Parasites Vectors 2010, 3, 117. [Google Scholar] [CrossRef] [PubMed]
- Coetzee, M.; Craig, M.; Le Sueur, D. Distribution of African malaria mosquitoes belonging to the Anopheles gambiae complex. Parasitol. Today 2000, 13, 149–151. [Google Scholar] [CrossRef]
- Fontenille, D.; Lochouarn, L. The complexity of the malaria vectorial system in Africa. Parassitologia 1999, 41, 267–271. [Google Scholar] [PubMed]
- Hay, S.I.; Okiro, E.A.; Gething, P.W.; Patil, A.P.; Tatem, A.J.; Guerra, C.A.; Snow, R.W. Estimating the Global Clinical Burden of Plasmodium falciparum Malaria in 2007. PLoS Med. 2010, 7, e1000290. [Google Scholar] [CrossRef] [PubMed]
- Worrall, E.; Rietveld, A.; Delacollette, C. The burden of malaria epidemics and cost-effectiveness of interventions in epidemic situation in Africa. Am. J. Trop. Med. Hyg. 2014, 71, 136–140. [Google Scholar]
- McMichael, A.J.; Sloof, R.H.; Kovats, S. Changement Climatique et Santé Humaine—Risques et Mesures à Prendre, Contribution in WHO; World Health Organization: Geneva, Switzerland, 1996. [Google Scholar]
- Thomson, M.C.; Doblas-Reyes, F.J.; Mason, S.J.; Hagedorn, R.; Connor, S.J.; Phindela, T.; Morse, A.P.; Palmer, T.N. Malaria early warning based on seasonal climate forecasts from multi-model ensembles. Nature 2006, 439, 576–579. [Google Scholar] [CrossRef] [PubMed]
- Sachs, J.; Malaney, P. The economic and social burden of malaria. Nature 2002, 415, 680–685. [Google Scholar] [CrossRef] [PubMed]
- World Health Organization. The World Health Report 2005: Make Every Mother and Child Count; World Health Organization: Geneva, Switzerland, 2005. [Google Scholar]
- Hulme, M. Rainfall changes in Africa: 1931–1960 to 1961–1990. Int. J. Climatol. 1992, 12, 685–699. [Google Scholar] [CrossRef]
- Folland, C.K.; Palmer, T.N.; Parker, D.E. Sahel rainfall and worlwide sea temperature 1901–1985. Nature 1986, 320, 601–607. [Google Scholar]
- Dai, A.; Lamb, P.J.; Trenberth, K.E.; Hulme, M.; Jones, P.D.; Xie, P. The recent Sahel drought is real. Int. J. Climatol. 2004, 24, 1323–1331. [Google Scholar] [CrossRef]
- Lebel, T.; Ali, A. Recent trends in the Central and Western Sahel rainfall regime 1990–2007. J. Hydrol. 2009, 375, 1–2. [Google Scholar] [CrossRef]
- Mouchet, J.; Faye, O.; Julvez, J.; Manguin, S. Drought and malaria retreat in the Sahel, West Africa. Lancet 1996, 348, 1735–1736. [Google Scholar] [CrossRef]
- Faye, O.; Fontenille, D.; Herve, J.P.; Diack, P.A.; Diallo, S.; Mouchet, J. Le paludisme en zone sahélienne du Sénégal: Données entomologiques sur la transmission. Ann. Soc. Belg. Med. Trop. 1993, 73, 21–30. (In French) [Google Scholar] [PubMed]
- Rogier, C.; Trape, J.F. Malaria attacks in children exposed to high transmission: Who is protected? Trans. R. Soc. Trop. Med. Hyg. 1993, 87, 245–246. [Google Scholar] [CrossRef]
- Carnevale, P.; Robert, V.; Molez, J.F.; Baudon, D. Faciès épidémiologique des paludismes en Afrique sub-saharienne. Etudes Med. 1984, 3, 123–133. (In French) [Google Scholar]
- Doumbo, O.; Sangare, O.; Touré, Y. Malaria in the Sahel: The Example of Mali. Tropical Transmissible Diseases; John Libbey Eurotext: Montrouge, France, 1989; pp. 11–32. [Google Scholar]
- Faye, O.; Gaye, O.; Fontenille, D.; Hébrard, G.; Konate, L.; Sy, N.; Herve, J.P.; Toure, Y.T.; Diallo, S.; Molez, J.F. Malaria decrease and drought in the Niayes area of northwestern Senegal. Cah. Sante 1995, 5, 299–305. [Google Scholar]
- Pagès, F.; Texier, G.; Pradines, B. Malaria transmission in Dakar: A two-year survey. Malar. J. 2008, 7, 178. [Google Scholar] [CrossRef] [PubMed]
- Lehmann, T.; Dao, A.; Yaro, A.S.; Adamou, A.; Kassogue, Y.; Diallo, M.; Sékou, T.; Coscaron-Arias, C. Aestivation of the African Malaria Mosquito, Anopheles gambiae in the Sahel. Am. J. Trop. Med. Hyg. 2010, 83, 601–606. [Google Scholar] [CrossRef] [PubMed]
- Fontenille, D.; Lochouarn, L.; Diagne, N.; Sokhna, C.; Lemasson, J.J.; Diatta, M.; Konate, L.; Faye, F.; Rogier, C.; Trape, J.F. High annual and seasonal variations in malaria transmission by anophelines and vector species composition in Dielmo, a holoendemic area in Senegal. Am. J. Trop. Med. Hyg. 1997, 56, 247–253. [Google Scholar] [CrossRef] [PubMed]
- Scott, T.W.; Takken, W. Feeding strategies of anthropophilic mosquitoes result in increased risk of pathogen transmission. Trends Parasitol. 2012, 28, 114–121. [Google Scholar] [CrossRef] [PubMed]
- Koella, J.C.; Sørensen, F.L.; Anderson, R.A. The malaria parasite, Plasmodium falciparum, increases the frequency of multiple feeding of its mosquito vector, Anopheles gambiae. Proc. Boil. Sci. 1998, 265, 763–768. [Google Scholar] [CrossRef] [PubMed]
- Nájera, J.A.; Kouznetsov, R.L.; Delacollette, C. Malaria Epidemics: Detection and Control, Forecasting and Prevention; World Health Organization: Geneva, Switzerland, 1998. [Google Scholar]
- Badara, S.; Dia, I.; Konate, L.; Ayala, D.; Fontenille, D.; Cohuet, A. Population genetic structure of the malaria vector Anopheles funestus, in a recently re-colonized area of the Senegal River basin and human-induced environmental changes. Parasites Vectors 2012, 5, 188. [Google Scholar]
- Grover-Kopec, E.K.; Blumenthal, M.B.; Ceccato, P.; Dinku, T.; Omumbo, J.A.; Connor, S.J. Web-based climate information resources for malaria control in Africa. Malaria J. 2006, 5, 38. [Google Scholar] [CrossRef] [PubMed]
- Ndiaye, F.; Molez, J.F.; Trape, J.F. Endémie palustre. In La Situation Démographique et Épidémiologique Dans la Zone de Niakhar au Senegal: 1984–1996; Delaunay, V., Ed.; Orstom: Dakar, Senegal, 1998; pp. 118–122. [Google Scholar]
- Fontenille, D.; Lochouarn, L.; Diatta, M.; Sokhna, C.; Dia, I.; Diagne, N.; Lemasson, J.J.; Ba, K.; Tall, A.; Rogier, C.; et al. Four years’ entomological study of the transmission of seasonal malaria in Senegal and the bionomics of Anopheles gambiae and A. arabiensis. Trans. R. Soc. Trop. Med. Hyg. 1997, 91, 647–652. [Google Scholar]
- Freeman, T.; Bradley, M. Temperature is predictive of severe malaria years in Zimbabwe. Trans. R. Soc. Trop. Med. Hyg. 1996, 90, 232. [Google Scholar] [CrossRef]
- Patz, J.A.; Olson, S.H. Malaria risk and temperature: Influences from global climate change and local land use practices. Proc. Natl. Acad. Sci. USA 2006, 103, 5635–5636. [Google Scholar] [CrossRef] [PubMed]
- Murdock, C.C.; Paaijmans, K.P.; Bell, A.S.; King, J.G.; Hillyer, J.F.; Read, A.F.; Thomas, M.B. Complex effects of temperature on mosquito immune function. Proc. R. Soc. B 2012, 279, 3357–3366. [Google Scholar] [CrossRef] [PubMed]
- Alonso, D.; Menno, M.J.; Pascual, M. Epidemic malaria and warmer temperatures in recent decades in an East African highland. Proc. R. Soc. B 2011. [Google Scholar] [CrossRef] [PubMed]
- Bouma, M.J.; Dye, C.; van der Kaay, H.J. El Niño Southern Oscillation as a Possible Early Warning System for Falciparum Malaria Epidemics in Northern Pakistan: Épidémiologie et de Contrôle du Paludisme Dans le Nord du Pakistan; Universities Press: Dordrecht, The Netherlands, 1995; pp. 45–57. [Google Scholar]
- Lindsay, S.W.; Birley, M.H. Climate change and malaria transmission. Ann. Trop. Med. Parasitol. 1996, 6, 5. [Google Scholar] [CrossRef]
- Tanser, F.C.; Sharp, B.; Le Sueur, D. Potential effect of climate change on malaria transmission in Africa. Lancet 2003, 362, 1792–1798. [Google Scholar] [CrossRef]
- Besancenot, J.P.; Ndione, J.A.; Handschumacher, P.; Ibrahima, M.; Laaidi, K. Climat, eau et santé au Sahel ouest-Africain. Science Changements Planétaires/Sécheresse 2004, 15, 233–241. (In French) [Google Scholar]
- Ndione, J.A.; Diop, M.; Lacaux, J.P.; Gaye, A.T. Variabilitée intrasaisonnière de la Pluviomètrie et émergence de la fièvre de la vallée du rift (FVR) dans la vallée du fleuve Sénégal: Nouvelles considérations. Climatologie 2008, 5, 83–97. (In French) [Google Scholar]
- Ndione, J.A.; Besancenot, J.P.; Lacaux, J.P.; Sabatier, P. Environnement et épidémiologie de la fièvre de la vallée du Rift (FVR) dans le bassin inférieur du fleuve Sénéegal. Environ. Risques Sante 2003, 2, 176–182. (In French) [Google Scholar]
- Caminade, C.; Ndione, J.A.; Kebe, C.M.F.; Jones, A.E.; Danuor, S.; Tay, S.; Tourre, Y.M.; Lacaux, J.P.; Vignolles, C.; JDuchemin, J.B.; et al. Mapping Rift Valley fever and malaria risk over West Africa using climatic indicators. Atmos. Sci. Lett. 2011, 12, 96–103. [Google Scholar] [CrossRef]
- Hoshen, M.B.; Morse, A.P. A weather-driven model of malaria transmission. Malar. J. 2004, 3, 32. [Google Scholar] [CrossRef] [PubMed] [Green Version]
- Ermert, V.; Fink, A.H.; Jones, A.E.; Morse, A.P. Development of a new version of the Liverpool Malaria Model. I. Refining the parameter settings and mathematical formulation of basic processes based on a literature review. Malar. J. 2011, 10, 35. [Google Scholar] [CrossRef] [PubMed]
- Morse, A.P.; Doblas-Reyes, F.J.; Hoshen, M.B.; Hagedorn, R.; Palmer, T.N. A forecast quality assessment of an end-to-end probabilistic multi-model seasonal forecast system using a malaria model. Tellus 2005, 57, 464–475. [Google Scholar] [CrossRef]
- Jones, A.; Morse, A. Application and validation of a seasonal ensemble prediction system using a dynamic malaria model. J. Clim. 2010, 23, 4202–4215. [Google Scholar] [CrossRef]
- Ermert, V.; Fink, A.H.; Jones, A.E.; Morse, A.P. Development of a new version of the Liverpool Malaria Model. II. Calibration and validation for West Africa. Malar. J. 2011, 10, 62. [Google Scholar] [CrossRef] [PubMed]
- Diouf, I.; Deme, A.; Ndione, J.A.; Gaye, A.T.; Rodriguez, F.B.; Cisse, M. Climate and health: Observation and modeling of malaria in the Ferlo (Senegal). C. R. Biol. Acad. Sci. 2013, 336, 253–260. [Google Scholar] [CrossRef] [PubMed]
- Ermert, V.; Fink, A.H.; Morse, A.P.; Paeth, H. The Impact of Regional Climate Change on Malaria Risk due to Greenhouse Forcing and Land-Use Changes in Tropical Africa. Res. Environ. Health Perspect. 2012, 120, 77–84. [Google Scholar] [CrossRef] [PubMed]
- Ndione, J.A. Bilan climatique de l’Observatoire ROSELT du Ferlo (Sénégal); Rapport Technique de Consultation, Phase-1; CSE: Toronto, ON, Canada, 2002; p. 37. [Google Scholar]
- Deuxième Communication Nationale du Sénégal sur Changements Climatiques: Vulnérabilité du Secteur de la Santé. Available online: http://unfccc.int/resource/docs/natc/sennc2.pdf (accessed on 14 September 2017).
- Programme Nationale de Lutte contre le Paludisme. Situation de la Lutte Contre le Paludisme au Sénégal. Enquête Nationale sur le Paludisme au Sénégal Entre 2008 et 2009 (ENPS-II); ICF Macro: Calverto, MD, USA, 2009. (In French) [Google Scholar]
- Ndiaye, S.; Ayad, M. Enquête Nationale sur le Paludisme au Sénégal 2008–2009; Centre de Recherche pour le Développement Humain (Sénégal) et ICF Macro: Calverton, MD, USA, 2009. (In French) [Google Scholar]
- Giardina, F.; Gosoniu, L.; Konate, L.; Diouf, M.B.; Perry, R.; Gaye, O.; Faye, O.; Vounatsou, P. Estimating the burden of malaria in Senegal: Bayesian zero-inflated binomial geostatistical modeling of the MIS 2008 data. PLoS ONE 2012, 7, e32625. [Google Scholar] [CrossRef]
- Compo, G.P.; Whitaker, J.S.; Sardeshmukh, P.D.; Matsui, N.; Allan, R.J.; Yin, X.; Gleason, B.E.; Vose, R.S.; Rutledge, G.; Bessemoulin, P.; et al. The twentieth century reanalysis project. Q. J. R. Meteorol. Soc. 2011, 137, 1–28. [Google Scholar] [CrossRef]
- Kalnay, E.; Kanamitsu, M.; Kistler, R.; Collins, W.; Deaven, D.; Gandin, L.; Joseph, D. The NCEP/NCAR 40-year reanalysis project. Bull. Am. Meteorol. Soc. 1996, 77, 437–471. [Google Scholar] [CrossRef]
- Uppala, S.M.; Kållberg, P.W.; Simmons, A.J.; Andrae, U.; Bechtold, V.; Fiorino, M.; Woollen, J. The ERA-40 re-analysis. Q. J. R. Meteorol. Soc. 2005, 131, 2961–3012. [Google Scholar] [CrossRef]
- Simmons, A.; Uppala, S.; Dee, D.; Kobayashi, S. ERA-Interim: New ECMWF reanalysis products from 1989 onwards. ECMWF Newslett. 2007, 110, 25–35. [Google Scholar]
- US Geological Survey. A Quasi-Global Precipitation Time Series for Drought Monitoring. Available online: https://pubs.usgs.gov/ds/832/pdf/ds832.pdf (accessed on 14 September 2017).
- Jones, A.E.; Morse, A.P. Skill of ENSEMBLES seasonal re-forecasts for epidemic malaria prediction in West Africa. Geophys. Res. Lett. 2012, 39, 5. [Google Scholar] [CrossRef]
- Van der Linden, P.J.; Mitchell, J.F.B. ENSEMBLES. Climate Change and Its Impacts: Summary of Research and Results from the ENSEMBLES Project; Met Office Hadley Centre: Exeter, UK, 2009. [Google Scholar]
- Nicholson, S.E.; Grist, J.P. A conceptual model for understanding rainfall variability in the West African Sahel on interannual and interdecadal timescales. Int. J. Climatol. 2001, 21, 1733–1757. [Google Scholar] [CrossRef]
- Diouf, I. Climate and Health: Observations and Modeling of Seasonal Malaria Incidence for Its Predictability over Senegal and the Sahel. Ph.D. Thesis, Cheikh Anta Diop (UCAD), Dakar, Senegal, 2016. [Google Scholar]
- Ndiath, M.; Sarr, J.B.; Lobna, G.; Catherine, M.; Sougoufara, S.; Konate, L.; Remoue, F.; Hermann, E.; Trape, J.F.; Riveau, G.; et al. Low and seasonal malaria transmission in the middle Senegal River basin: Identification and characteristics of Anopheles vectors. Parasites Vectors 2012, 5, 21. [Google Scholar] [CrossRef] [PubMed]
- Sow, S.; de Vlas, S.J.; Engels, D.; Gryseels, B. Water-related disease patterns before and after the construction of the Diama dam in northern Senegal. Ann. Trop. Med. Parasitol. 2002, 96, 575–586. [Google Scholar] [CrossRef] [PubMed]
- Dia, I.; Konate, L.; Samb, B.; Sarr, J.B.; Diop, A.; Rogerie, F.; Faye, M.; Riveau, G.; Remoue, F.; Diallo, M.; et al. Bionomics of malaria vectors and relationship with malaria transmission and epidemiology in three physiographic zones in the Senegal River Basin. Acta Trop. 2008, 105, 145–153. [Google Scholar] [CrossRef] [PubMed]
- Faye, O.; Diagne, M.; Ndiongue, S.; Sy, M.; Diack, P.A. Le Paludisme Dans la Zone du Périmètre Irrigué de Diomandou; Podor. Sénégal: Résultats des enquêtes effectuées de juin 1990 à novembre 1991. Doc. Orstom Dakar 1992, 92, 23. (In French) [Google Scholar]
- Monjour, L.; Richard-Lenoble, D.; Sidatt, M.; Druilhe, P.; Mogahed, A.; Gentilini, M. Geographic distribution of malaria in the valley of the Senegal River: School survey (sero-immunologic evaluation, year 1973). Bull. Soc. Pathol. Exot. Ses Fil. 1982, 75, 491–496. [Google Scholar]
- Faye, O.; Gaye, O.; Konaté, L.; Molez, J.F.; Feller-Dansokho, E.; Hervé, J.P. Prediction and prevention of malaria epidemics in the valley of the Senegal River. Cah. Detudes Rech. Francoph. Sante 1998, 8, 347–352. [Google Scholar]
- Tourre, Y.M.; Lacaux, J.P.; Vignolles, C.; Ndione, J.A.; Lafaye, M. Mapping of zones potentially occupied by mosquitoes (ZPOMs) Aedes vexans and Culex poicipiles, the main vectors of Rift Valley fever in Senegal. Geospat. Health 2008, 3, 69–79. [Google Scholar] [CrossRef] [PubMed]
- Lemasson, J.J.; Fontenille, D.; Lochouarn, L.; Dia, I.; Simard, F. Comparison of behaviour and vector efficiency of anopheles gambiae and anopheles arabiensis (diptera: Culicidae) in Barkedji, a Sahelian area of Senegal. J. Med. Entomol. 1997, 34, 396–403. [Google Scholar] [CrossRef] [PubMed]
- Ngom, H.M.; Ndione, J.A.; Ba, Y.; Konaté, L.; Faye, O.; Diallo, M.; Dia, I. Spatio-temporal analysis of host preferences and feeding patterns of malaria vectors in the sylvo-pastoral area of Senegal: Impact of landscape classes. Parasites Vectors 2013, 6, 332. [Google Scholar] [CrossRef] [PubMed]
- Traoré, L.M.; Fontenille, D.; Diallo, M.; Ba, Y.; Zeller, H.G.; Mondo, M.; Adam, F.; Thonon, J.; Maiga, A. Arbovirus surveillance from 1990 to 1995 in the Barkedji area (Ferlo) of Senegal, a possible natural focus of Rift Valley Fever virus. J. Med. Entomol. 2001, 38, 480–492. [Google Scholar] [CrossRef]
- Bomblies, A.; Eltahir, E.A. Assessment of the impact of climate shifts on malaria transmission in the Sahel. Ecohealth 2009, 6, 426–437. [Google Scholar] [CrossRef] [PubMed]
- Machault, V.; Vignolles, V.C.; Pagès, F. Spatial heterogeneity and temporal evolution of malaria transmission risk in Dakar, Senegal, according to remotely sensed environmental data. Malar. J. 2010, 9, 252. [Google Scholar] [CrossRef] [PubMed]
- MacHaultc, V.; Gadiaga, L.; Vignolles, C. Highly focused anopheline breeding sites and malaria transmission in Dakar. Malar. J. 2009, 8, 138. [Google Scholar] [CrossRef] [PubMed]
- Trape, J.F.; Lefebvre-Zante, E.; Legros, F.; Ndiaye, G.; Bouganali, H.; Druille, P.; Salem, G. Vector Density Gradients and the Epidemiology of Urban Malaria in Dakar, Senegal. Am. J. Trop. Med. Hyg. 1992, 47, 181–189. [Google Scholar] [CrossRef] [PubMed]
- Diallo, S.; Ndir, O.; Faye, O.; Diop, B.M.; Dieng, Y. Malaria in the Southern Sanitary District of Dakar (Senegal). Parasitemia and malaria attacks. Bull. Soc. Pathol. Exot. 1998, 91, 208–213. [Google Scholar] [PubMed]
- Samb, LM. Epidémiologie du Paludisme et de la Bilharziose à Wassadou, Département de Tambacounda. Ph.D. Thesis, Université Cheikh Anta Diop de Dakar, Dakar, Senegal, 1993. [Google Scholar]
- Gianotti, R.L.; Bomblies, A.; Eltahir, E.A.B. Hydrologic modeling to screen potential environmental management methods for malaria vector control in Niger. Water Resour. Res. 2009, 45, W08438. [Google Scholar] [CrossRef]
- Le Sueur, D.; Binka, F.; Lengeler, C.; de Savigny, D.; Snow, R.W.; Teuscher, T.; Touré, Y.T. An atlas of malaria in Africa. Afr. Health 1997, 19, 23–24. [Google Scholar] [PubMed]
- Manzanas, R.; Amekudzi, L.K.; Preko, K.; Herrera, S.; Gutiérrez, J.M. Precipitation variability and trends in Ghana: An intercomparison of observational and reanalysis products. Clim. Chang. 2014, 124, 805–819. [Google Scholar] [CrossRef]
- Michele, M.; Rienecker, M.J.; Suarez, R.G.; Ricardo, T.; Julio, B.; Emily, L.; Michael, G.B.; Siegfried, D.S.; Lawrence, T.; Gi-Kong, K.; et al. MERRA: NASA’s modern-era retrospective analysis for research and applications. J. Clim. 2011, 24, 3624–3648. [Google Scholar]
- Smith, K.R.; Woodward, A.; Campbell-Lendrum, D.; Chadee, D.; Honda, Y.; Liu, Q.; Olwoch, J.; Revich, B.; Sauerborn, R. Human health: Impacts, adaptation, and co-benefits. In Part A: Global and Sectoral Aspects Contribution of Working Group II to the Fifth Assessment Report of the Intergovernmental Panel on Climate Change; Cambridge University Press: Cambridge, UK, 2014; pp. 709–754. [Google Scholar]
- Nicholson, S.E.; Some, B.; Kone, B. An analysis on recent rainfall conditions in West Africa, including the rainy season of 1997 ENSO year. J. Clim. 2000, 13, 2628–2640. [Google Scholar] [CrossRef]
- Giannini, A.; Saravanan, R.; Chang, P. Oceanic forcing of Sahel rainfall on interannual to interdecadal time scales. Science 2003, 302, 1027–1030. [Google Scholar] [CrossRef] [PubMed]
- Mohino, E.; Janicot, S.; Bader, J. Sahel rainfall and decadal to multi-decadal SST variability. Clim. Dyn. 2011, 37, 419–440. [Google Scholar] [CrossRef]
- Koenraadt, C.J.M.; Githeko, A.K.; Takken, W. The effects of rainfall and evapotranspiration on the temporal dynamics of Anopheles gambiae s.s. and Anopheles arabiensis in a Kenyan village. Acta Trop. 2004, 90, 141–153. [Google Scholar] [CrossRef] [PubMed]
- Nagpal, B.N.; Sharma, V.P. Indian Anophelines. New Delhi: Baba Barkha Nath Printers and Lebanon; Science Publishers, Inc.: Lebanon, NH, USA, 1995. [Google Scholar]
- Fillinger, U.; Sonye, G.; Killeen, G.F.; Knols, B.G.; Becker, N. The practical importance of permanent and semipermanent habitats for controlling aquatic stages of Anopheles gambiae sensu lato mosquitoes: Operational observations from a rural town in Western Kenya. Trop. Med. Int. Health 2004, 9, 1274–1289. [Google Scholar] [CrossRef] [PubMed]
- Sabatier, P.; Fontaine, B.; Roucou, P.; Bicout, D. Analysis of Climate Change and Impacts on Water and Health; ACCIES: Paris, France, 2008. [Google Scholar]


| Observations | ||||||||||||||
|---|---|---|---|---|---|---|---|---|---|---|---|---|---|---|
| Datasets | Period | Stations | ||||||||||||
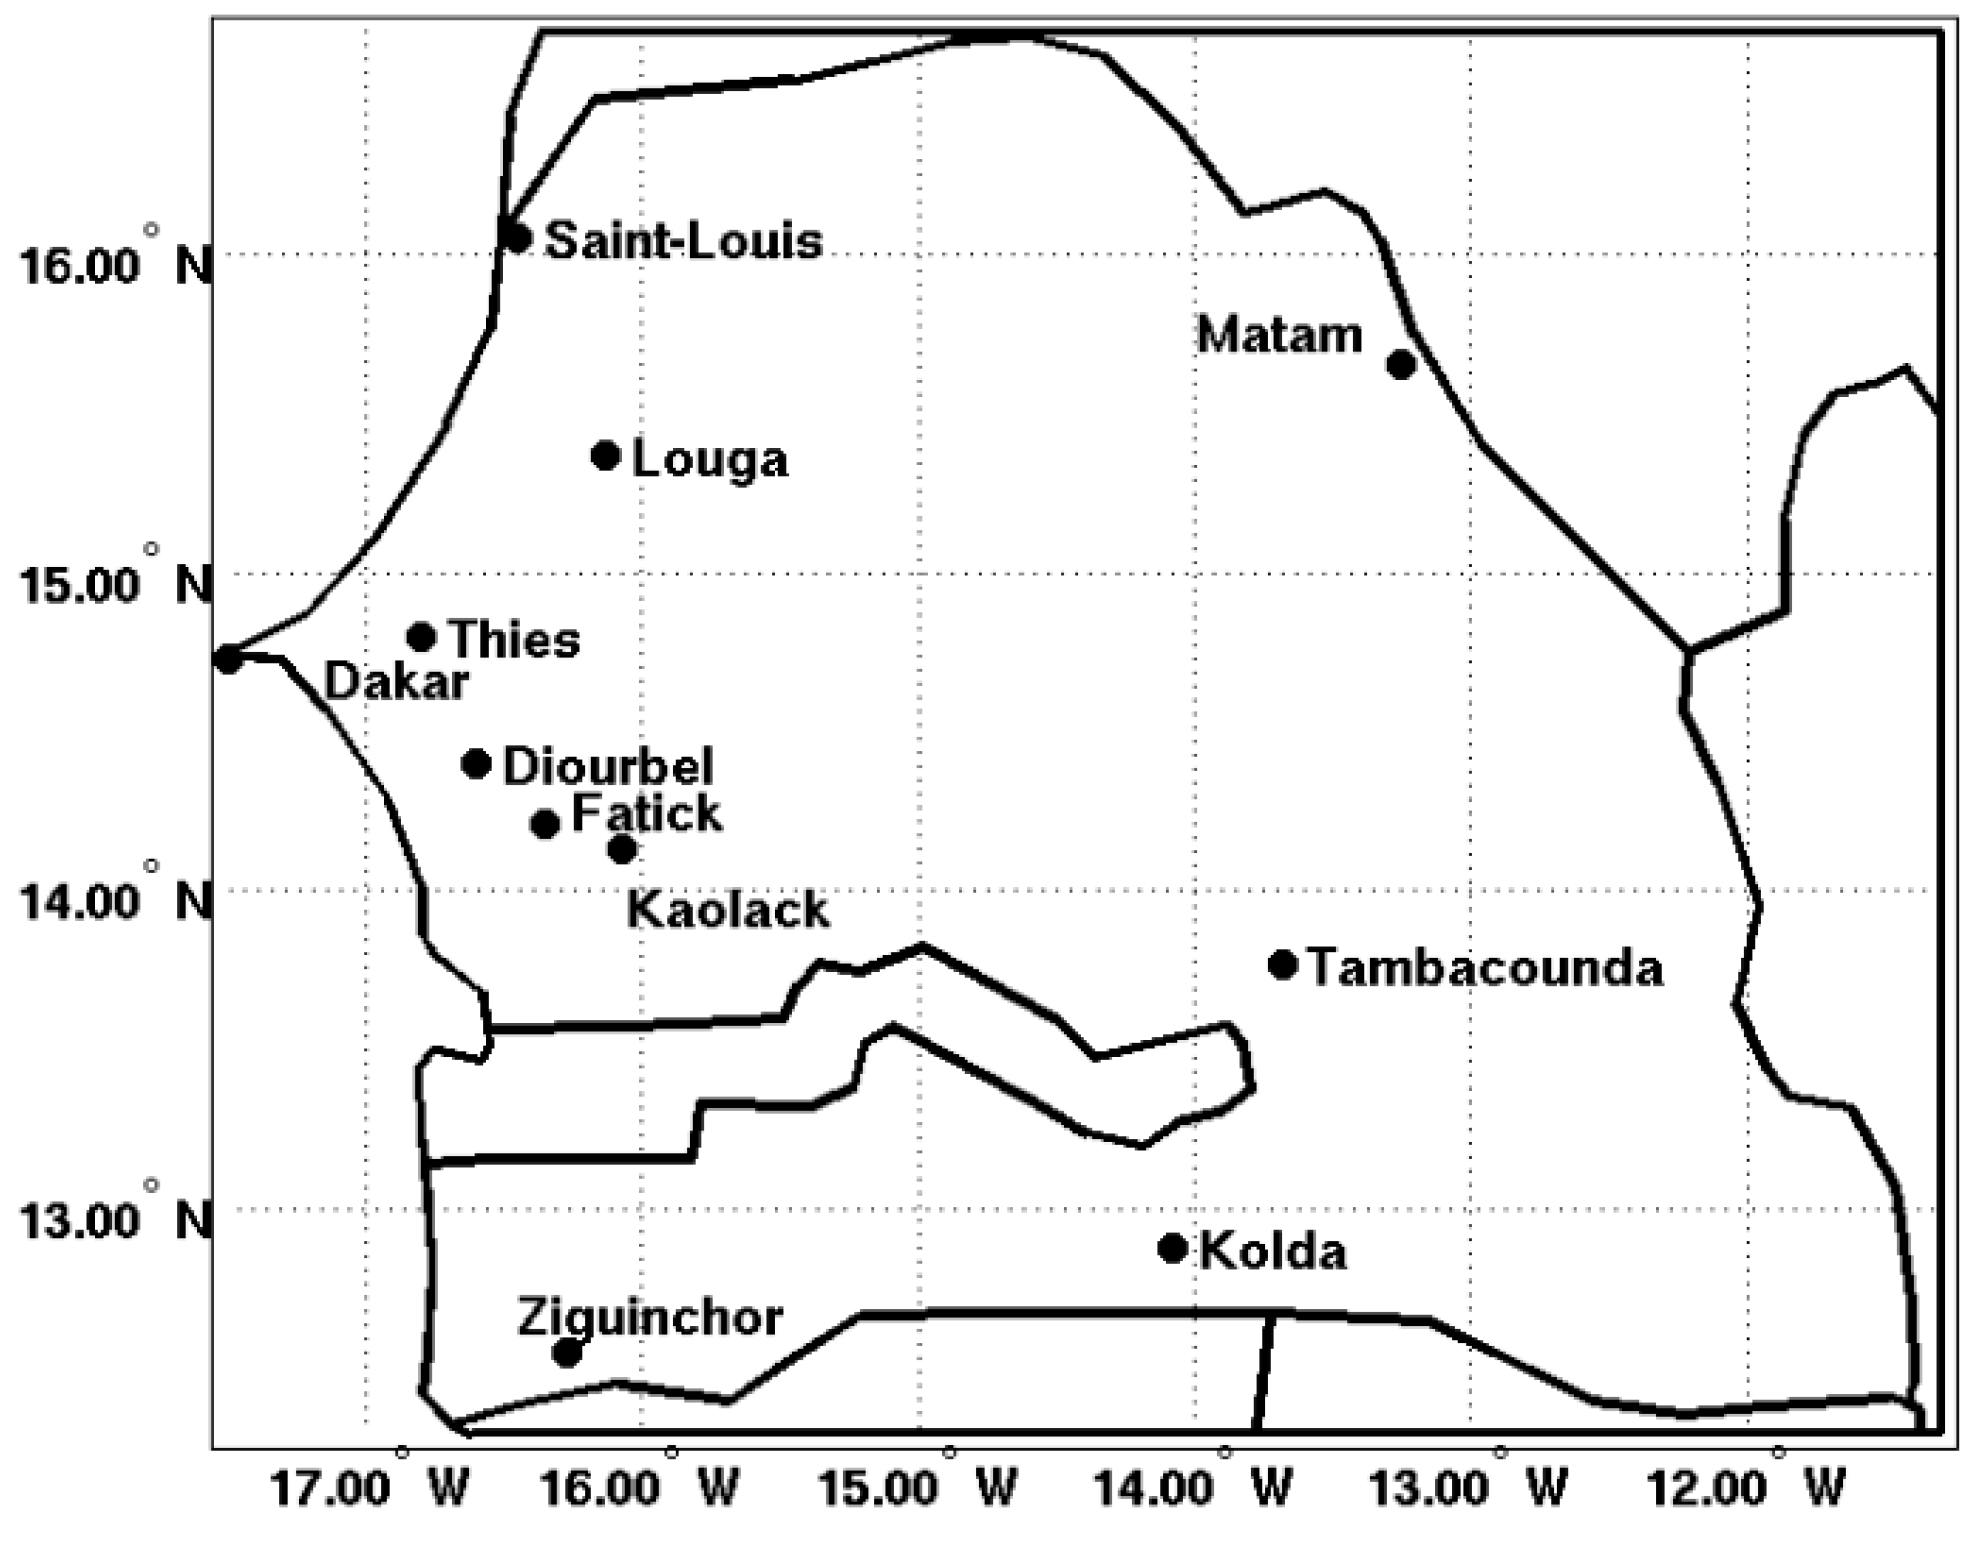
| Malaria cases | 2001–2016 | Dakar 14.73° N, 17.5° W | Diourbel 14.4° N, 16.6° W | Fatick 14.21° N, 16.35° W | Kaolack 14.13° N, 16.07° W | Kolda 14.88° N, 14.08° W | Louga 15.37° N, 16.13° W | Matam 15.65° N, 13.25° W | Saint-Louis 16.05° N, 16.45° W | Tambacounda 13.77° N, 13.68° W | Thies 14.8° N, 17° W | Ziguinchor 12.55° N, 16.27° W | ||
| Meteorological and CHIRPS rainfall | 1981–2010 | |||||||||||||
| Reanalysis Inputs | ||||||||||||||
| Datasets | Period | Grid | ||||||||||||
| 20th Century Reanalysis Project daily averages [56] | 1910–2009 | 2.5° × 2.5° | ||||||||||||
| NCEP [57] | 1960–2013 | 2.5° × 2.5° | ||||||||||||
| ERA40 [58] | 1958–2001 | 2.5° × 2.5° | ||||||||||||
| ERA Interim [59] | 1979–2015 | 1.5° × 1.5° | ||||||||||||
© 2017 by the authors. Licensee MDPI, Basel, Switzerland. This article is an open access article distributed under the terms and conditions of the Creative Commons Attribution (CC BY) license (http://creativecommons.org/licenses/by/4.0/).
Share and Cite
Diouf, I.; Rodriguez-Fonseca, B.; Deme, A.; Caminade, C.; Morse, A.P.; Cisse, M.; Sy, I.; Dia, I.; Ermert, V.; Ndione, J.-A.; et al. Comparison of Malaria Simulations Driven by Meteorological Observations and Reanalysis Products in Senegal. Int. J. Environ. Res. Public Health 2017, 14, 1119. https://doi.org/10.3390/ijerph14101119
Diouf I, Rodriguez-Fonseca B, Deme A, Caminade C, Morse AP, Cisse M, Sy I, Dia I, Ermert V, Ndione J-A, et al. Comparison of Malaria Simulations Driven by Meteorological Observations and Reanalysis Products in Senegal. International Journal of Environmental Research and Public Health. 2017; 14(10):1119. https://doi.org/10.3390/ijerph14101119
Chicago/Turabian StyleDiouf, Ibrahima, Belen Rodriguez-Fonseca, Abdoulaye Deme, Cyril Caminade, Andrew P. Morse, Moustapha Cisse, Ibrahima Sy, Ibrahima Dia, Volker Ermert, Jacques-André Ndione, and et al. 2017. "Comparison of Malaria Simulations Driven by Meteorological Observations and Reanalysis Products in Senegal" International Journal of Environmental Research and Public Health 14, no. 10: 1119. https://doi.org/10.3390/ijerph14101119