Long-Lasting Insecticide Net Ownership, Access and Use in Southwest Ethiopia: A Community-Based Cross-Sectional Study

Abstract
:1. Introduction
2. Materials and Methods
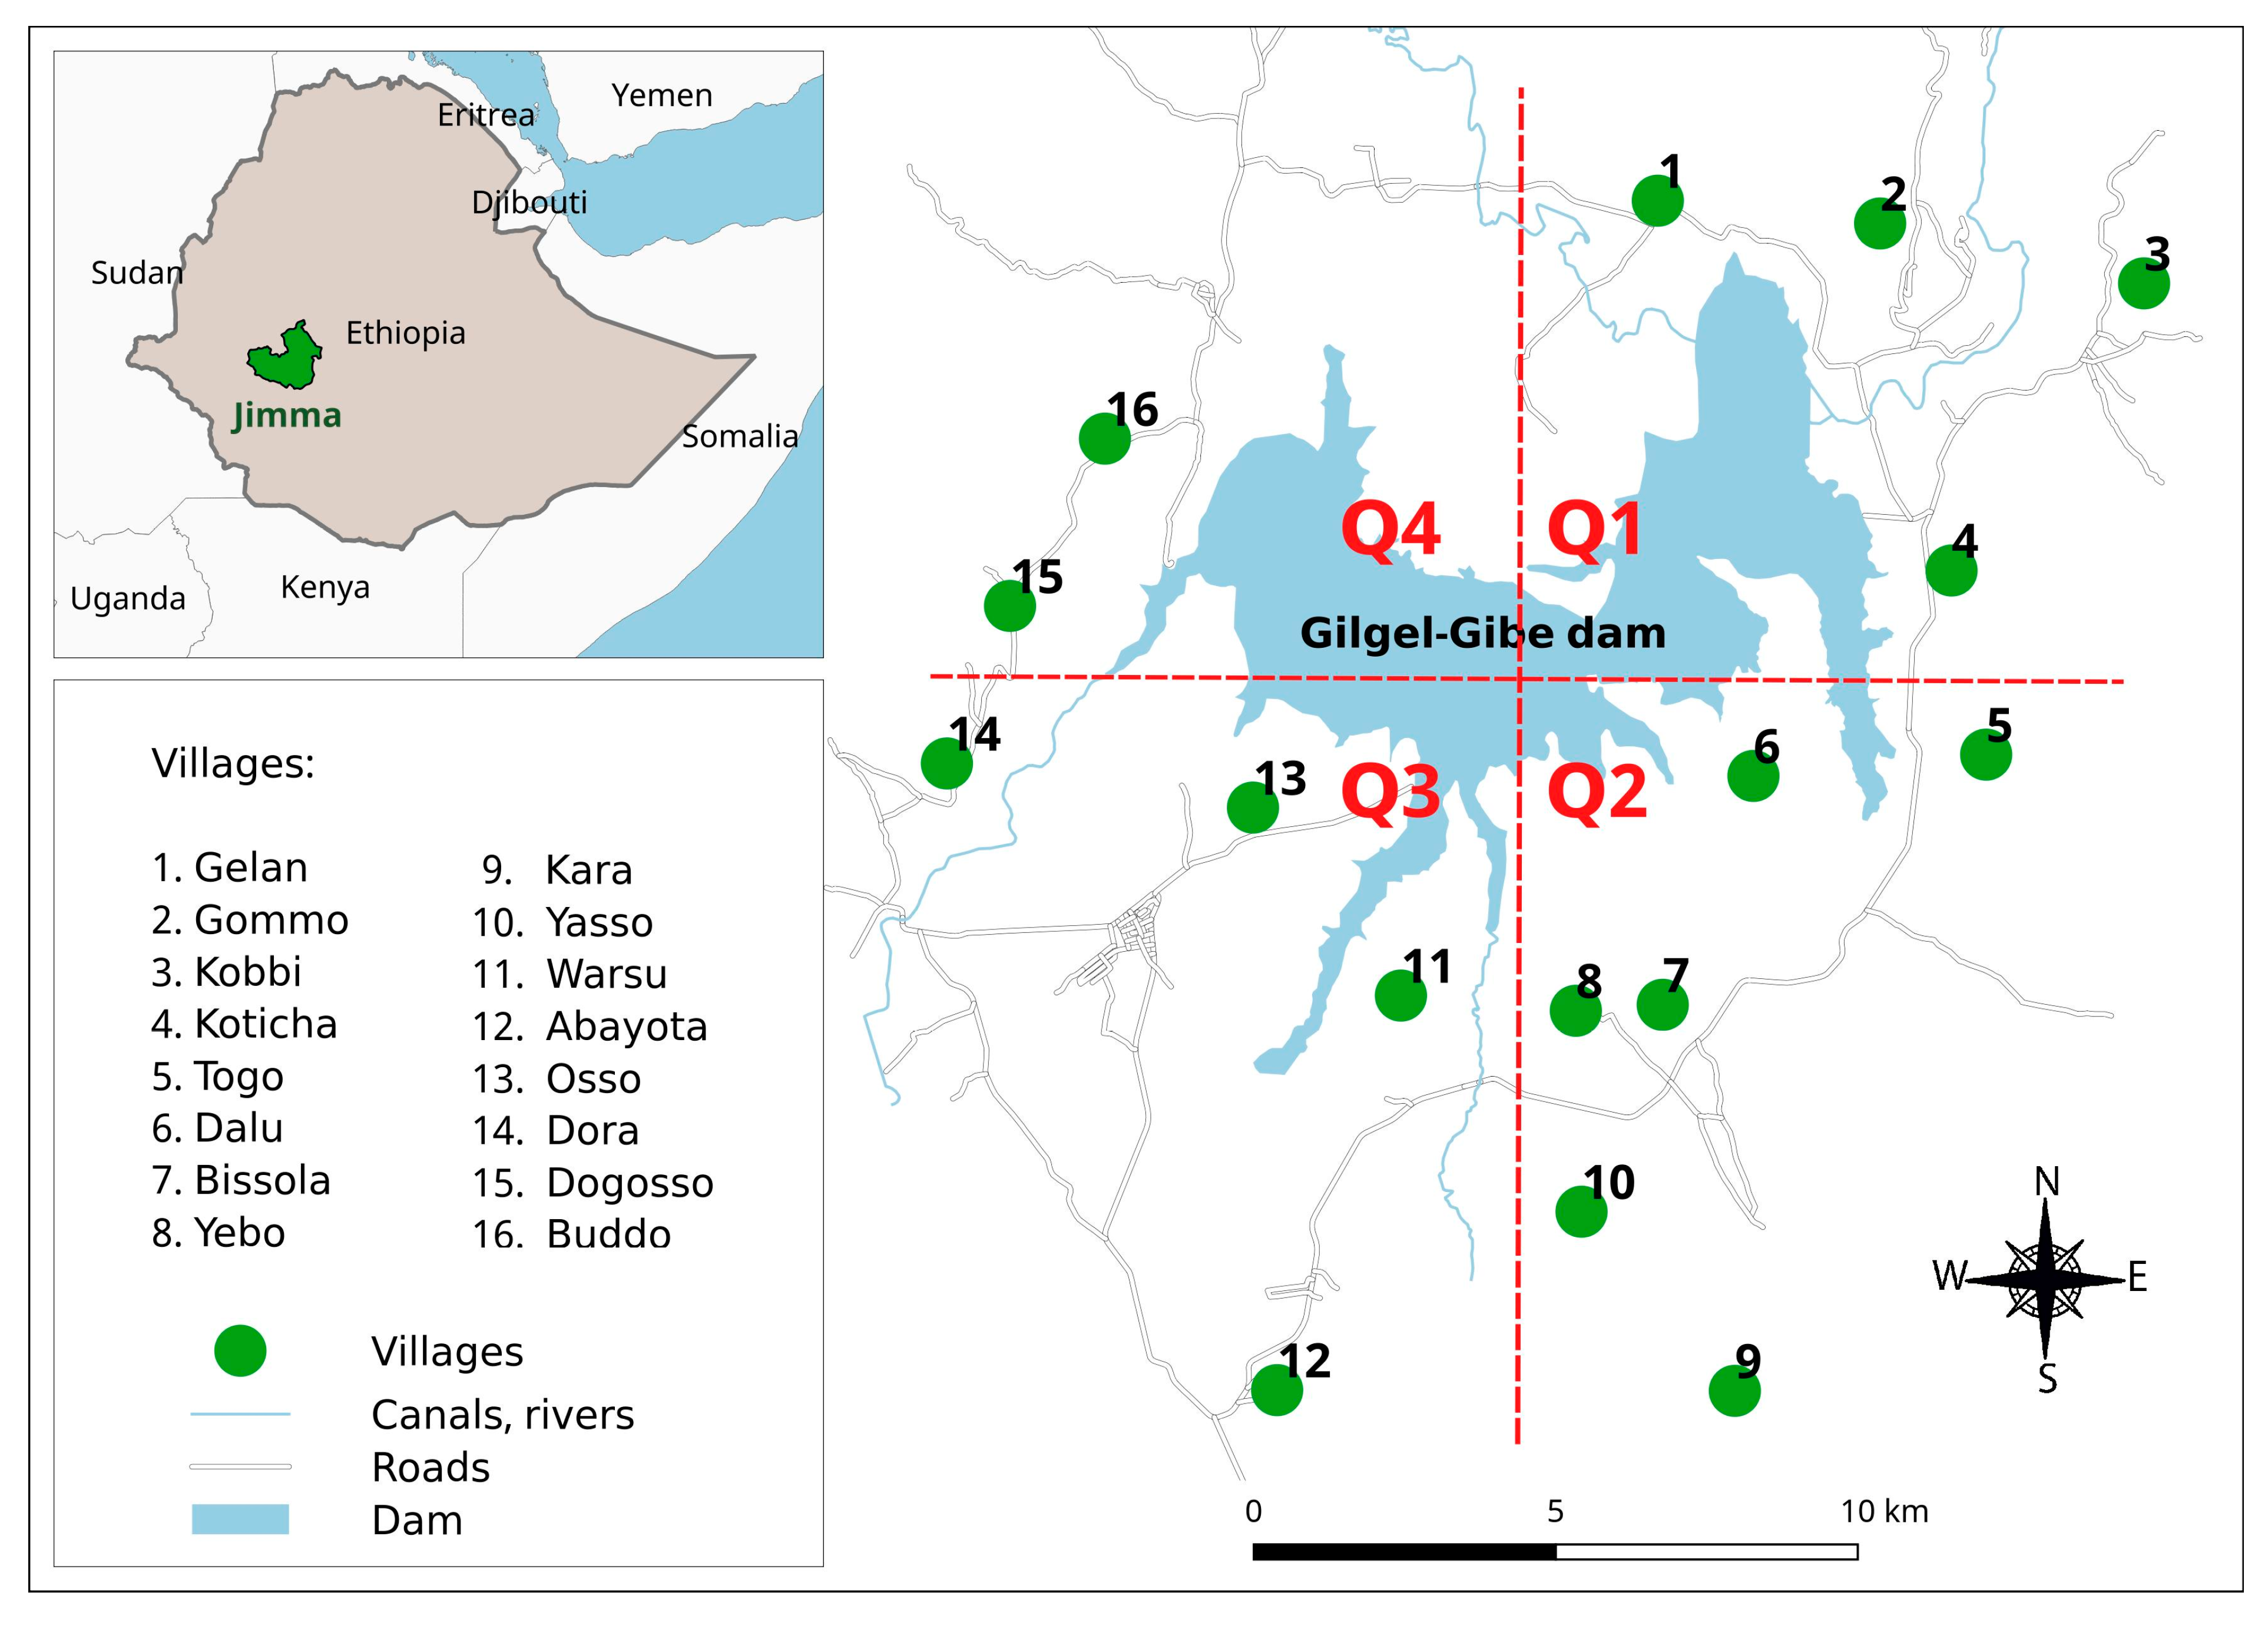
2.1. Study Area
2.2. Study Design and Population
2.3. Data Collection
2.4. Indicators of LLIN Coverage, Access and Use
2.5. Data Analysis
3. Results
3.1. LLIN Ownership, Access and Use
3.2. Risk Factors for Failure of Household Access to LLINs and Using LLINs at Household Level
4. Discussion
5. Conclusions
Supplementary Materials
Acknowledgments
Author Contributions
Conflicts of Interest
References
- World Health Organization. World Malaria Report (2015); World Health Organization: Geneva, Switzerland, 2015. [Google Scholar]
- President Malaria Initiative. Ethiopia Malaria Operation Plan FY 2015. Available online: https://www.pmi.gov/docs/default-source/default-document-library/malaria-operational-plans/fy-15/fy-2015-ethiopia-malaria-operational-plan.pdf?sfvrsn=3 (accessed on 24 October 2017).
- Federal Democratic Republic of Ethiopia Ministry of Health. HSDP IV Annual Performance Report 2014/2015. Addis Ababa, Ethiopia. Available online: https://www.pmi.gov (accessed on 8 August 2017).
- Malaria Prevention through Insecticide Treated Nets. Advocacy Brief. Malaria Consortium, Disease Control. Better Health. Malaria Consortium: London, UK, 2016. Available online: http://www.malariaconsortium.org/media-downloads/802/Malaria%20prevention%20through%20insecticide%20treated%20nets (accessed on 8 August 2017).
- Mugisha, F.; Arinaitwe, J. Sleeping arrangements and mosquito net use among under-fives: Results from the Uganda Demographic and Health Survey. Malar. J. 2003, 2, 40. [Google Scholar] [CrossRef] [PubMed] [Green Version]
- Graves, P.M.; Ngondi, J.M.; Hwang, J.; Getachew, A.; Gebre, T.; Mosher, A.W.; Reithinger, R. Factors associated with mosquito net use by individuals in households owning nets in Ethiopia. Malar. J. 2011, 10, 354. [Google Scholar] [CrossRef] [PubMed] [Green Version]
- WHO Recommendations for Achieving Universal Coverage with Long-Lasting Insecticidal Nets in Malaria Control (2014). Available online: http://www.who.int/malaria/publications/atoz/who_recommendation_coverage_llin/en (accessed on 12 August 2017).
- Ethiopia National Malaria Indicator Survey 2015. Ethiopian Public Health Institute: Addis Ababa, Ethiopia, 2015. Available online: http://www.ephi.gov.et/images/pictures/download2009/MIS-2015-Final-Report-December-_2016.pdf (accessed on 12 August 2017).
- Bekele, D.; Belyhun, Y.; Petros, B.; Deressa, W. Assessment of the effect of insecticide-treated nets and indoor residual spraying for malaria control in three rural kebeles of Adami Tulu District, South Central Ethiopia. Malar. J. 2012, 11, 127. [Google Scholar] [CrossRef] [PubMed]
- Deribew, A.; Birhanu, Z.; Sena, L.; Dejene, T.; Reda, A.A.; Sudhakar, M.; Deribe, K. The effect of household heads training about the use of treated bed nets on the burden of malaria and anaemia in under-five children: A cluster randomized trial in Ethiopia. Malar. J. 2012, 11, 8. [Google Scholar] [CrossRef] [PubMed]
- National Strategic Plan for Malaria Prevention Control and Elimination in Ethiopia 2011–2015. Addis Ababa. Available online: http://www.nationalplanningcycles.org/sites/default/files/country_docs/Ethiopia/ethiopia_malaria_national_strategic_plan_2011-2015_130810.pdf (accessed on 12 August 2017).
- Watiro, A.H.; Awoke, W. Insecticide-treated net ownership and utilization and factors that influence their use in Itang, Gambella region, Ethiopia: Cross-sectional study. Risk Manag. Healthc. Policy 2016, 9, 101. [Google Scholar] [CrossRef] [PubMed]
- Shargie, E.B.; Ngondi, J.; Graves, P.M.; Getachew, A.; Hwang, J.; Gebre, T.; Tadesse, Z. Rapid increase in ownership and use of long-lasting insecticidal nets and decrease in prevalence of malaria in three regional States of Ethiopia (2006–2007). J. Trop. Med. 2010. [Google Scholar] [CrossRef] [PubMed]
- Atieli, H.E.; Zhou, G.; Afrane, Y.; Lee, M.C.; Mwanzo, I.; Githeko, A.K.; Yan, G. Insecticide-treated net (ITN) ownership, usage, and malaria transmission in the highlands of western Kenya. Parasites Vectors 2011, 4, 113. [Google Scholar] [CrossRef] [PubMed]
- World Health Organization. World Malaria Report 2014; World Health Organization: Geneva, Switherland, 2014. [Google Scholar]
- Stewart, T.; Marchand, R.P. Factors That Affect the Success and Failure of Insecticide Treated Net Programs for Malaria Control in SE Asia and the Western Pacific; World Health Organization: Geneva, Switherland, 2003. [Google Scholar]
- Ruyange, M.M.; Condo, J.; Karema, C.; Binagwaho, A.; Rukundo, A.; Muyirukazi, Y. Factors associated with the non-use of insecticide-treated nets in Rwandan children. Malar. J. 2016, 15, 355. [Google Scholar] [CrossRef] [PubMed]
- Ntuku, H.M.; Ruckstuhl, L.; Julo-Réminiac, J.E.; Umesumbu, S.E.; Bokota, A.; Tshefu, A.K.; Lengeler, C. Long-lasting insecticidal net (LLIN) ownership, use and cost of implementation after a mass distribution campaign in Kasaï Occidental Province, Democratic Republic of Congo. Malar. J. 2017, 16, 22. [Google Scholar] [CrossRef] [PubMed]
- Teklemariam, Z.; Awoke, A.; Dessie, Y.; Weldegebreal, F. Ownership and utilization of insecticide-treated nets (ITNs) for malaria control in Harari National Regional State, Eastern Ethiopia. Pan Afr. Med. J. 2015, 21, 52. [Google Scholar] [CrossRef] [PubMed]
- Berkessa, T.; Oljira, D.; Tesfa, B. Insecticide treated nets use and its determinants among settlers of Southwest Ethiopia. BMC Public Health 2016, 16, 106. [Google Scholar] [CrossRef] [PubMed]
- Negash, K.; Haileselassie, B.; Tasew, A.; Ahmed, Y.; Getachew, M. Ownership and utilization of long-lasting insecticide-treated bed nets in Afar, northeast Ethiopia: A cross-sectional study. Pan Afr. Med. J. 2012, 13, 9. [Google Scholar] [PubMed]
- Deressa, W.; Fentie, G.; Girma, S.; Reithinger, R. Ownership and use of insecticide-treated nets in Oromia and Amhara Regional States of Ethiopia two years after a nationwide campaign. Trop. Med. Int. Health 2011, 16, 1552–1561. [Google Scholar] [CrossRef] [PubMed]
- Yewhalaw, D.; Legesse, W.; Van Bortel, W.; Gebre-Selassie, S.; Kloos, H.; Duchateau, L.; Speybroeck, N. Malaria and water resource development: The case of Gilgel-Gibe hydroelectric dam in Ethiopia. Malar. J. 2009, 8, 21. [Google Scholar] [CrossRef] [PubMed]
- Seyoum, D.; Kifle, Y.G.; Rondeau, V.; Yewhalaw, D.; Duchateau, L.; Rosas-Aguirre, A.; Speybroeck, N. Identification of different malaria patterns due to Plasmodium falciparum and Plasmodium vivax in Ethiopian children: A prospective cohort study. Malar. J. 2016, 15, 208. [Google Scholar] [CrossRef] [PubMed]
- Seyoum, D.; Yewhalaw, D.; Duchateau, L.; Brandt, P.; Rosas-Aguirre, A.; Speybroeck, N. Household level spatio-temporal analysis of Plasmodium falciparum and Plasmodium vivax malaria in Ethiopia. Parasites Vectors 2017, 10, 196. [Google Scholar] [CrossRef] [PubMed]
- Sena, L.D.; Deressa, W.A.; Ali, A.A. Predictors of long-lasting insecticide-treated bed net ownership and utilization: Evidence from community-based cross-sectional comparative study, Southwest Ethiopia. Malar. J. 2013, 12, 406. [Google Scholar] [CrossRef] [PubMed]
- Kasiulevičius, V.; Šapoka, V.; Filipavičiūtė, R. Sample size calculation in epidemiological studies. Gerontologija 2006, 7, 225–231. [Google Scholar]
- Measure for Evaluation: Roll Back Malaria Partnership. Household Survey Indicators for Malaria Control. June 2013. Available online: http://www.malariasurveys.org/documents/Household%20Survey%20Indicators%20for%20Malaria%20Control.pdf (accessed on 24 October 2017).
- Animut, A.; Negash, Y.; Kebede, N. Distribution and utilization of vector control strategies in a malarious village of Jabi Tehnan District, north-western Ethiopia. Malar. J. 2014, 13, 356. [Google Scholar] [CrossRef] [PubMed]
- StataCorp. Stata Statistical Software: Release 14; StataCorp LP: College Station, TX, USA, 2015. [Google Scholar]
- Gobena, T.; Berhane, Y.; Worku, A. Low long-lasting insecticide nets (LLINs) use among household members for protection against mosquito bite in Kersa, Eastern Ethiopia. BMC Public Health 2012, 12, 914. [Google Scholar] [CrossRef] [PubMed]
- World Health Organization. Vector Control Technical Expert Group Report on MPAC. Malaria Policy Advisory Comitee Meeting; World Health Organization: Geneva, Switzerland, 2013. [Google Scholar]
- Roll Back Malaria. Guidelines for Core Population-Based Indicators. Geneva: RBM Technical Working Paper No. 1; 2009 [Internet]. Available online: http://reliefweb.int/sites/reliefweb.int/files/resources/AC719D00E5DE6F5D492575B3001BE5A3-RMB-guideline-20009.pdf (accessed on 12 February 2017).
- Kilian, A.; Koenker, H.; Baba, E.; Onyefunafoa, E.O.; Selby, R.A.; Lokko, K.; Lynch, M. Universal coverage with insecticide-treated nets—Applying the revised indicators for ownership and use to the Nigeria 2010 malaria indicator survey data. Malar. J. 2013, 12, 314. [Google Scholar] [CrossRef] [PubMed]
- Kilian, A.; Koenker, H.; Paintain, L. Estimating population access to insecticide-treated nets from administrative data: Correction factor is needed. Malar. J. 2013, 12, 259. [Google Scholar] [CrossRef] [PubMed]
- President Malaria Initiative Ethiopia, Malaria Operation Plan FY 2017. Available online: https://www.pmi.gov/docs/default-source/default-document-library/malaria-operational-plans/fy17/fy-2017-ethiopia-malaria-operational-plan.pdf?sfvrsn=6 (accessed on 24 October 2017).
- Koenker, H.; Kilian, A. Recalculating the Net Use Gap: A Multi-Country Comparison of ITN Use versus ITN Access. PLoS ONE 2014, 9, e97496. [Google Scholar] [CrossRef] [PubMed]
- Bennett, A.; Smith, S.J.; Yambasu, S.; Jambai, A.; Alemu, W.; Kabano, A.; Eisele, T.P. Household possession and use of insecticide-treated mosquito nets in Sierra Leone 6 months after a national mass-distribution campaign. PLoS ONE 2012, 7, e37927. [Google Scholar] [CrossRef] [PubMed]
- Samadoulougou, S.; Pearcy, M.; Yé, Y.; Kirakoya-Samadoulougou, F. Progress in coverage of bed net ownership and use in Burkina Faso 2003–2014: Evidence from population-based surveys. Malar. J. 2017, 16, 302. [Google Scholar] [CrossRef] [PubMed]
- Bawo, L.L.; Harries, A.D.; Reid, T.; Massaquoi, M.; Jallah-Macauley, R.; Jones, J.J.; Hinneh, L. Coverage and use of insecticide-treated bed nets in households with children aged under five years in Liberia. Public Health Action 2012, 2, 112–116. [Google Scholar] [CrossRef] [PubMed] [Green Version]
- Biadgilign, S.; Reda, A.; Kedir, H. Determinants of ownership and utilization of insecticide-treated bed nets for malaria control in eastern Ethiopia. J. Trop. Med. 2012, 2012. [Google Scholar] [CrossRef] [PubMed]
- Singh, M.; Brown, G.; Rogerson, S.J. Ownership and use of insecticide-treated nets during pregnancy in sub-Saharan Africa: A review. Malar. J. 2013, 12, 268. [Google Scholar] [CrossRef] [PubMed]
- Matovu, F.; Goodman, C.; Wiseman, V.; Mwengee, W. How equitable is bed net ownership and utilisation in Tanzania? A practical application of the principles of horizontal and vertical equity. Malar. J. 2009, 8, 109. [Google Scholar] [CrossRef] [PubMed] [Green Version]
- Russell, C.L.; Sallau, A.; Emukah, E.; Graves, P.M.; Noland, G.S.; Ngondi, J.M.; Richards, F.O. Determinants of bed net use in Southeast Nigeria following mass distribution of LLINs: Implications for social behaviour change interventions. PLoS ONE 2015, 10, e0139447. [Google Scholar] [CrossRef] [PubMed]
- Singh, R.; Musa, J.; Singh, S.; Ebere, U.V. Knowledge, attitude and practices on malaria among the rural communities in Aliero, Northern Nigeria. J. Fam. Med. Prim. Care 2014, 3, 39. [Google Scholar] [CrossRef] [PubMed]
- Gryseels, C.; Uk, S.; Sluydts, V.; Durnez, L.; Phoeuk, P.; Suon, S.; Tho, S. Factors influencing the use of topical repellents: Implications for the effectiveness of malaria elimination strategies. Sci. Rep. 2015, 5, 16847. [Google Scholar] [CrossRef] [PubMed]
- World Health Organization (WHO). Global Malaria Programme. Long-Lasting Insecticidal Nets for Malaria Prevention. A Manual for Malaria Programme Managers. 2007. Available online: http://www.who.int/management/programme/LongLastingInsecticidalNetsMalaria.pdf (accessed on 5 July 2017).
- De beyl, C.Z.; Asamoah, O.E.; Selby, R.A. Continuous Distribution of LLINs through Primary Schools and Health Facilities in Ghana: Process Evaluation of the Pilot in the Eastern Region (2014). Malaria Consortium, Disease Control, Better Health. Johns Hopkins. Center for Communication Programs. Available online: http://www.malariaconsortium.org/media-downloads/231/Continuous%20distribution%20of%20LLINs%20through%20primary%20schools%20and%20health%20facilities%20in%20Ghana (accessed on 26 October 2017).
- Birhanu, Z.; Abebe, L.; Sudhakar, M.; Dissanayake, G.; Yihdego, Y.; Alemayehu, G.; Yewhalaw, D. Access to and use gaps of insecticide-treated nets among communities in Jimma Zone, southwestern Ethiopia: Baseline results from malaria education interventions. BMC Public Health 2015, 15, 1304. [Google Scholar] [CrossRef] [PubMed]
- Babalola, S.; Ricotta, E.; Awantang, G.; Lewicky, N.; Koenker, H.; Toso, M. Correlates of Intra-Household ITN Use in Liberia: A Multilevel Analysis of Household Survey Data. PLoS ONE 2016, 11, e0158331. [Google Scholar] [CrossRef] [PubMed]
- Koenker, H.; Keating, J.; Alilio, M.; Acosta, A.; Lynch, M.; Nafo-Traore, F. Strategic roles for behaviour change communication in a changing malaria landscape. Malar. J. 2014, 13, 1. [Google Scholar] [CrossRef] [PubMed]
- Rosas-Aguirre, A.; Guzmán-Guzmán, M.; Moreno-Gutierrez, D.; Rodriguez-Ferrucci, H.; Vargas-Pacherrez, D.; Acuña-González, Y. Long-lasting insecticide—Treated bednet ownership, retention and usage one year after their distribution in Loreto, Peru. Rev. Peru Med. Exp. Salud Publica 2011, 28, 228–236. [Google Scholar] [CrossRef] [PubMed]


| Indicator (Level) | Quadrant 1 | Quadrant 2 | Quadrant 3 | Quadrant 4 | Total | ||||||||||
|---|---|---|---|---|---|---|---|---|---|---|---|---|---|---|---|
| n/N | % | 95% CI | n/N | % | 95% CI | n/N | % | 95% CI | n/N | % | 95% CI | n/N | % | 95% CI | |
| I1 (HH) | 166/204 | 80.8 | (75.1, 85.6) | 269/306 | 88.0 | (83.9, 91.2) | 168/204 | 81.1 | (75.1, 85.9) | 74/102 | 72.2 | (62.4, 80.2) | 677/816 | 82.7 | (80.0, 85.1) |
| I2 (HH) | 141/204 | 68.6 | (62.1, 74.5) | 217/306 | 71.2 | (66.0, 76.1) | 143/204 | 68.8 | (62.1, 74.9) | 62/102 | 61.5 | (51.5, 70.6) | 563/816 | 68.9 | (65.6, 71.9) |
| I3 (Ind) | 151/204 | 74.2 | (68.5, 79.8) | 243/306 | 79.5 | (75.4, 83.4) | 154/204 | 75.8 | (70.2, 81.3) | 65/102 | 64.2 | (55.2, 73.2) | 614.5/816 | 75.3 | (68.4, 83.0) |
| I4 (HH) | 141/166 | 84.8 | (78.3, 89.6) | 217/269 | 81.0 | (75.9, 85.3) | 143/168 | 84.8 | (78.4, 89.6) | 62/74 | 85.2 | 75.6, 91.5) | 563/677 | 83.2 | (80.3, 85.9) |
| I5 (Ind) | 673/1070 | 62.9 | (59.9, 65.8) | 1104/1614 | 68.4 | (66.1, 70.7) | 689/1058 | 65.1 | (62.2, 67.9) | 292/581 | 50.2 | (46.1, 54.3) | 2758/4323 | 63.8 | (62.3, 65.2) |
| I6 (Ind) | 602/665 | 90.5 | (87.9, 92.6) | 918/1020 | 90.0 | (87.9, 91.7) | 583/641 | 90.9 | (88.4, 93.0) | 271/324 | 83.6 | (79.1, 87.4) | 2374/2650 | 89.5 | (88.3, 90.7) |
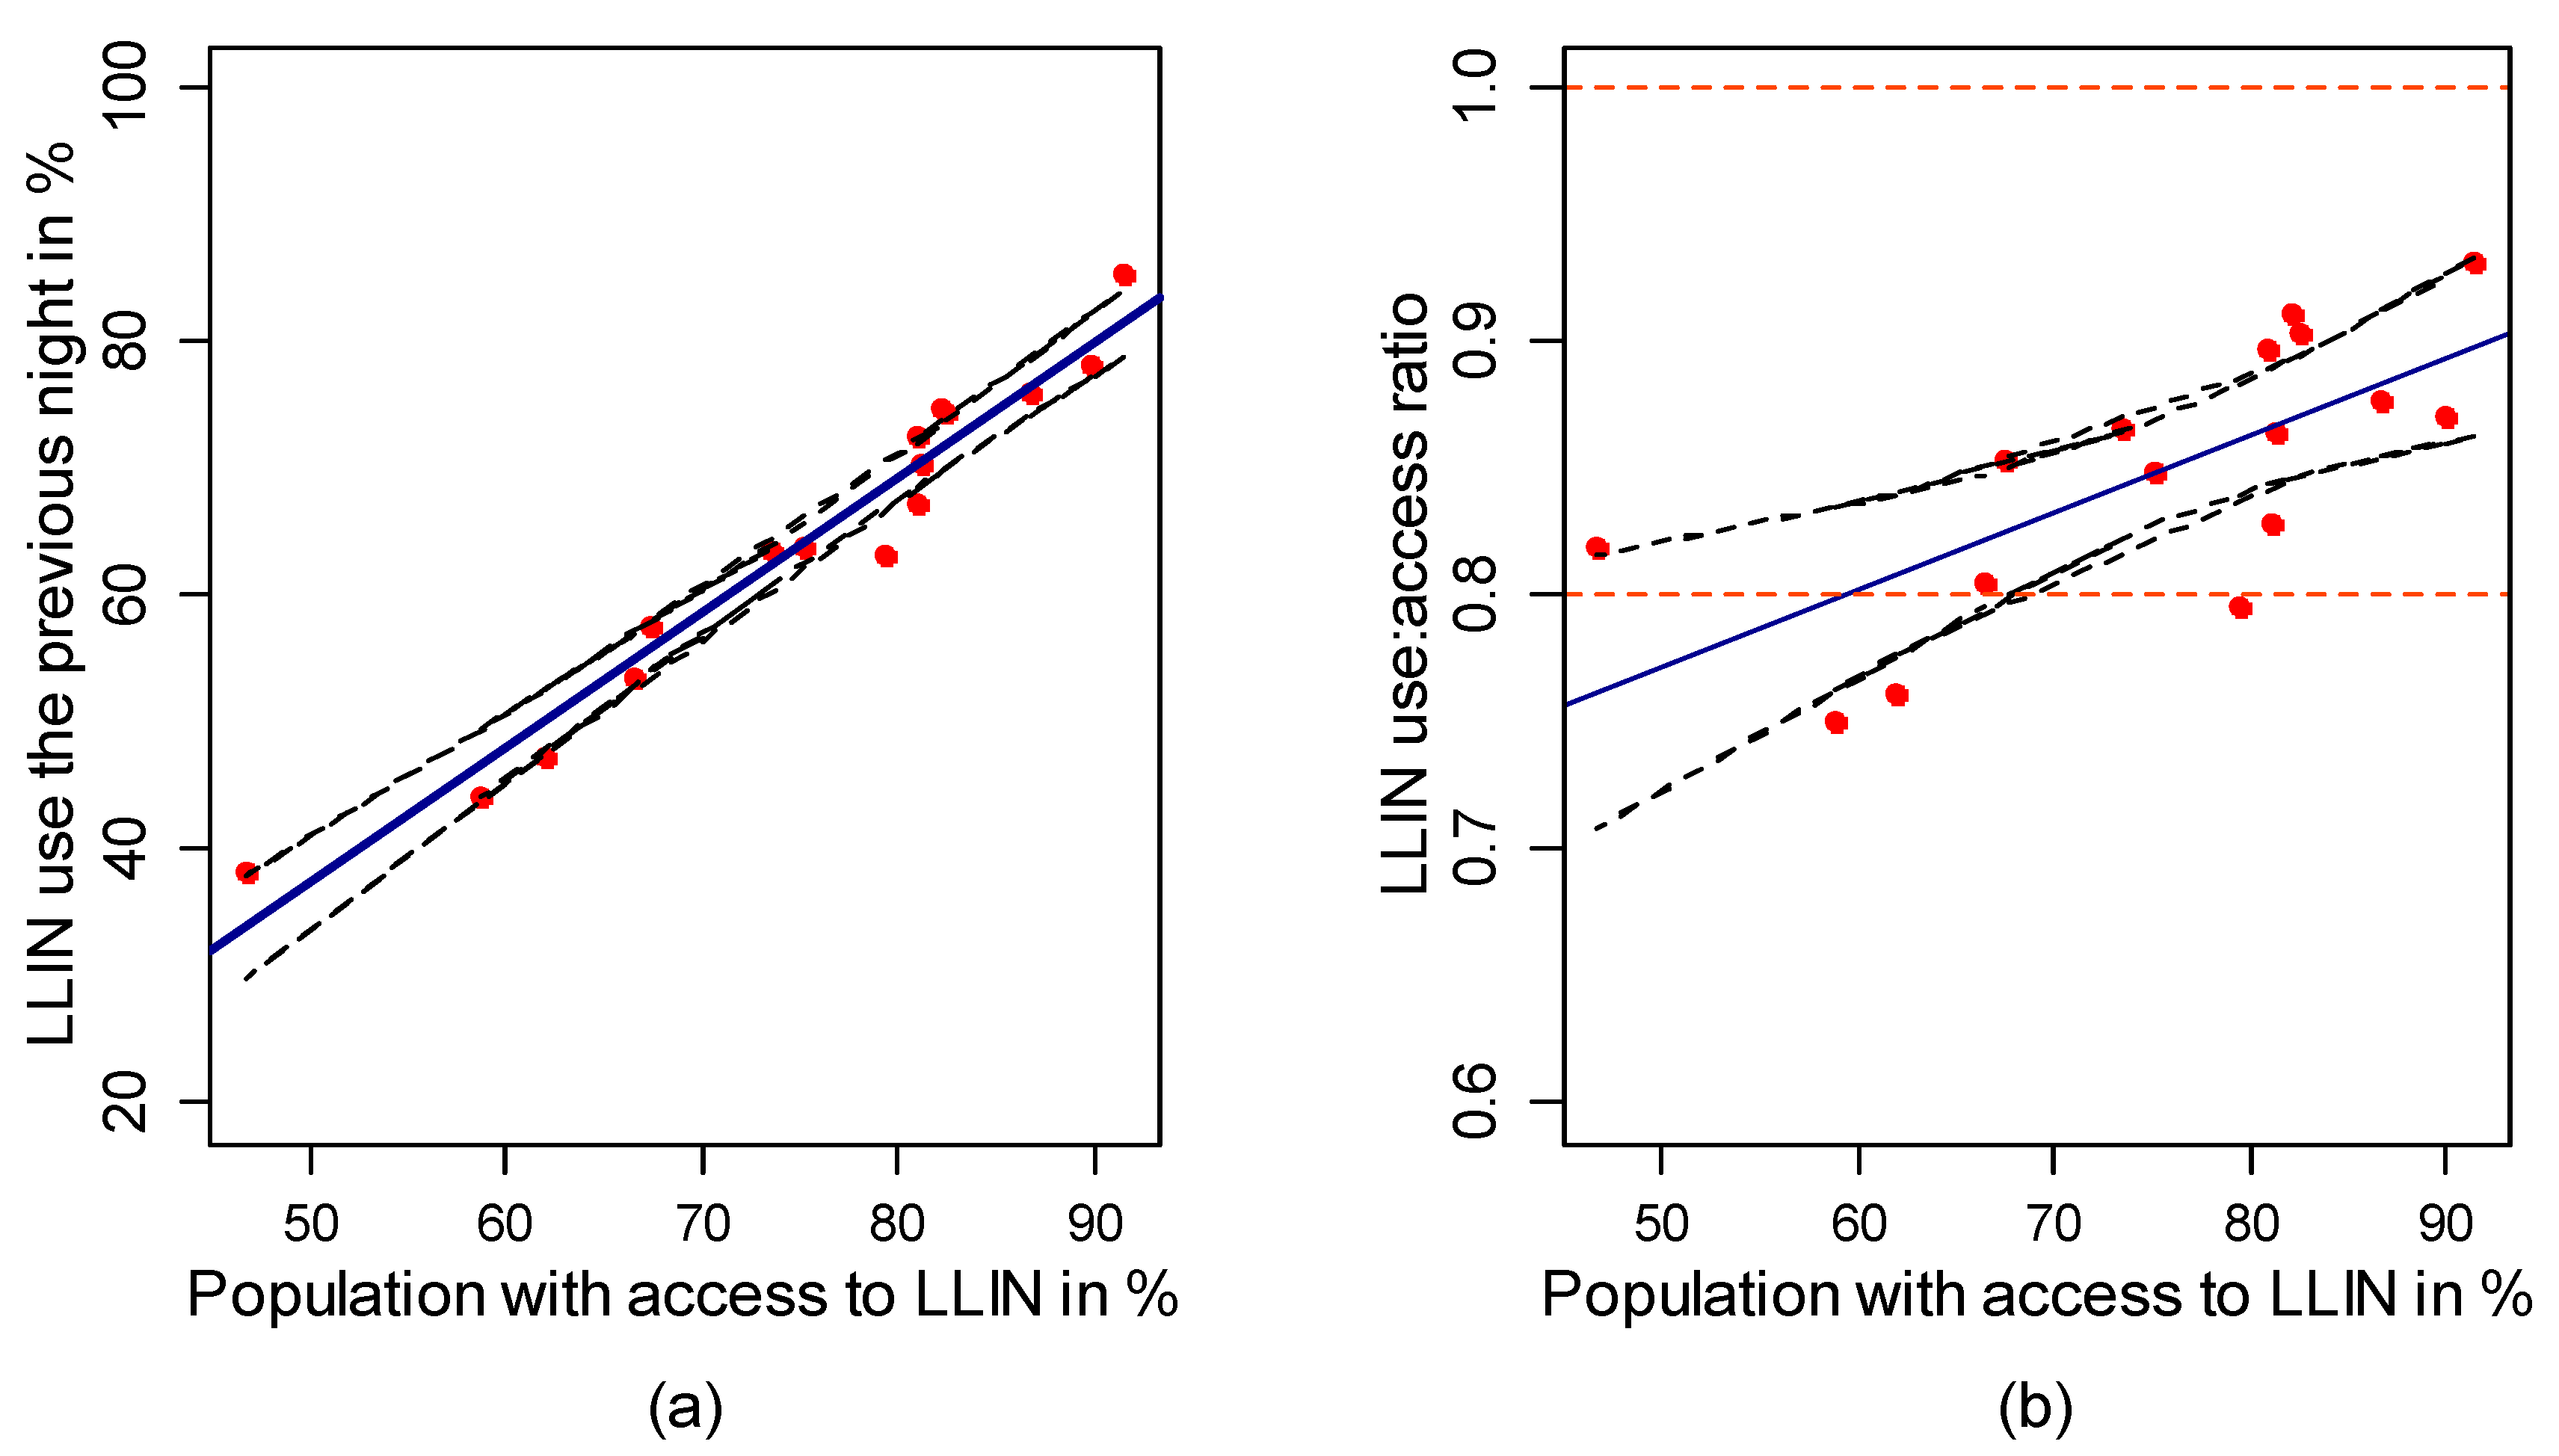
| I7 ratio | 0.85 | (0.83, 0.88) | 0.86 | (0.85, 0.88) | 0.86 | (0.84, 0.89) | 0.78 | (0.74, 0.84) | 0.85 | (0.79, 0.91) | |||||
| Covariates | Failure to HH Access to LLINs | Univariate | Multivariate | |||||||
|---|---|---|---|---|---|---|---|---|---|---|
| n | N | % | 95% CI | OR | 95% CI | p | AOR | 95% CI | ||
| Location of the village | Quadrant 1 | 63 | 204 | 31.4 | (25.5, 37.9) | 1 | 0.35 | |||
| Quadrant 2 | 89 | 306 | 28.7 | (23.9, 33.9) | 0.9 | (0.6, 1.3) | ||||
| Quadrant 3 | 61 | 204 | 31.2 | (25.2, 38.0) | 0.9 | (0.6, 1.5) | ||||
| Quadrant 4 | 40 | 102 | 38.5 | (29.4, 48.5) | 1.4 | (0.8, 2.3) | ||||
| Gender of HH head | Female | 30 | 103 | 29.6 | (21.4, 39.4) | 1 | 0.74 | |||
| Male | 223 | 713 | 31.3 | (28.0, 34.8) | 1.1 | (0.7, 1.7) | ||||
| Age of the HH head | ≤35 | 53 | 268 | 19.8 | (15.5, 25.0) | 1 | <0.01 | 1 | ||
| 36–40 | 47 | 147 | 31.9 | (24.8, 39.9) | 1.9 | (1.2, 3.0) * | 1.0 | (0.6, 1.6) | ||
| 41–50 | 80 | 205 | 39.9 | (33.3, 46.9) | 2.7 | (1.8, 4.1) ** | 1.7 | (1.1, 2.8) * | ||
| >51 | 73 | 196 | 36.5 | (29.9, 43.6) | 2.3 | (1.5, 3.6) ** | 1.9 | (1.2, 3.1) * | ||
| Education of HH | Above primary | 13 | 99 | 13.8 | (8.1, 22.5) | 1 | <0.01 | 1 | ||
| Primary | 40 | 142 | 27.7 | (20.9, 35.6) | 2.4 | (1.2, 6.3) * | 2.6 | (1.2, 5.6) * | ||
| No education | 200 | 575 | 13.8 | 31.1, 38.9) | 3.4 | (1.8, 6.3) ** | 3.1 | (1.6, 6.2) * | ||
| Occupation of HH head | Farmer | 245 | 789 | 31.1 | (27.9, 34.4) | 1 | 0.294 | |||
| Government employee | 3 | 17 | 19.3 | (6.3, 46.0) | 2.2 | (0.6, 7.7) | ||||
| Other | 5 | 10 | 49.5 | (21.8, 77.4) | 4.1 | (0.7, 24.1) | ||||
| Marital status of HH head | Married | 224 | 729 | 30.6 | (27.4, 34.0) | 1 | 0.049 | 1 | ||
| Widowed | 14 | 54 | 25.9 | (15.9, 39.5) | 0.8 | (0.4, 1.5) | 1.3 | (0.6, 2.8) | ||
| Single/divorced | 15 | 33 | 50.5 | (33.8, 67.2) | 2.3 | (1.1, 4.7) * | 3.8 | (1.6, 9.0) * | ||
| History of malaria in the past year of HH head | No | 192 | 664 | 29.2 | (25.8, 32.8) | 1 | 0.013 | 1 | ||
| Yes | 61 | 152 | 39.8 | (32.2, 47.8) | 1.6 | (1.10, 2.33) * | 1.1 | (0.7, 2.0) | ||
| Family size | 1–3 persons | 24 | 138 | 18.1 | (12.5, 25.7) | 1 | <0.01 | 1 | ||
| 4–6 persons | 92 | 451 | 20.4 | (16.9, 24.5) | 1.15 | (0.70, 1.91) | 1.5 | (0.9, 2.5) | ||
| ≥7 persons | 137 | 227 | 60.5 | (53.9, 66.7) | 6.9 | (4.1, 11.6) ** | 9.3 | (5.2, 16.9) ** | ||
| Predominant material in HH walls | Mud | 248 | 805 | 31 | (27.9, 34.3) | 1 | 0.571 | |||
| Cements | 5 | 11 | 39 | (15.9, 68.5) | 1.4 | (0.4, 4.9) | ||||
| Predominant material in HH roof | Iron | 92 | 281 | 32.7 | (27.3, 38.5) | 1 | 0.496 | |||
| Thatched | 161 | 535 | 30.3 | (26.5, 34.3) | 0.8 | (0.6, 1.2) | ||||
| Firewood use for cooking | No | 118 | 436 | 27.4 | (23.3, 31.8) | 1 | 0.016 | 1 | ||
| Yes | 135 | 380 | 35.4 | (30.6, 40.3) | 1.5 | (1.1, 2.0) * | 1.7 | (1.2, 2.4) * | ||
| Livestock ownership | No | 10 | 40 | 28.3 | (16.1, 44.8) | 1 | 0.707 | |||
| Yes | 243 | 776 | 31.3 | (28.1, 34.6) | 1.2 | (0.5, 2.4) | ||||
| History of malaria in the past year of any household member | No | 199 | 693 | 28.8 | (25.6, 32.3) | 1 | <0.01 | 1 | ||
| Yes | 54 | 123 | 44.4 | (35.7, 53.5) | 2.0 | (1.3, 3.0) * | 1.4 | (0.9, 2.4) | ||
| Discussion about malaria in the past month | No | 70 | 183 | 38.1 | (31.3, 45.3) | 1 | 0.021 | 1 | ||
| Yes | 183 | 633 | 29 | (25.5, 32.7) | 0.7 | (0.5, 0.9) * | 0.7 | (0.5, 1.1) | ||
| Covariates | Failure for Using LLINs | Univariate | Multivariate | |||||||
|---|---|---|---|---|---|---|---|---|---|---|
| n | N | % | 95% CI | OR | 95% CI | p | AOR | 95% CI | ||
| Location of the village | Quadrant 1 | 40 | 166 | 26.4 | (20.0, 34.0) | 1 | 0.42 | |||
| Quadrant 2 | 83 | 269 | 30.1 | (25.7, 36.5) | 1.2 | (0.8, 1.9) | ||||
| Quadrant 3 | 51 | 168 | 29.9 | (23.4, 37.3) | 1.2 | (0.7, 1.9) | ||||
| Quadrant 4 | 28 | 74 | 37.5 | (26.9, 49.4) | 1.7 | (0.9, 3.1) | ||||
| Gender of HH head | Female | 23 | 81 | 28.5 | (19.6, 39.5) | 1 | 0.72 | |||
| Male | 179 | 596 | 30.5 | (26.9, 34.4) | 1.1 | (0.64,1.86) | ||||
| Age of the HH head | ≤35 | 60 | 233 | 25.8 | (20.5, 31.8) | 1 | 0.147 | 1 | ||
| 36–40 | 41 | 127 | 32.3 | (24.6, 41.1) | 1.4 | (0.8, 2.2) | 0.8 | (0.5, 1.5) | ||
| 41–50 | 60 | 169 | 36.4 | (29.3, 44.0) | 1.7 | (1.1, 2.6) * | 0.9 | (0.5, 1.6) | ||
| >51 | 41 | 148 | 28.6 | (21.8, 36.7) | 1.2 | (0.7, 1.9) | 0.9 | (0.4, 1.7) | ||
| Education of HH | Above primary | 15 | 94 | 16.7 | (10.2, 26.1) | 1 | 0.001 | 1 | ||
| Primary | 27 | 116 | 23.6 | (16.7, 32.3) | 1.5 | (0.8, 3.1) | 1.4 | (0.6, 2.9) | ||
| No education | 160 | 467 | 34.7 | (30.5, 39.1) | 2.6 | (1.5, 4.8) ** | 2.3 | (1.2, 4.4) * | ||
| Occupation of HH head | Farmer | 195 | 655 | 30.2 | (26.8, 33.8) | 1 | 0.56 | |||
| Government employee | 4 | 15 | 24.6 | (9.3, 50.8) | 0.8 | (0.2, 2.4) | ||||
| Other | 3 | 7 | 47.4 | (16.7, 80.1) | 2.1 | (0.5, 9.5) | ||||
| Marital status of HH head | Married | 189 | 614 | 31.2 | (27.6, 35.0) | 1 | 0.28 | |||
| Widowed | 9 | 43 | 21.1 | (11.1, 36.2) | 0.6 | (0.3, 1.3) | ||||
| Single/divorced | 4 | 20 | 21.2 | (18.1, 35.1) | 0.6 | (0.2, 1.8) | ||||
| History of malaria in the past year of HH head | No | 159 | 559 | 28.7 | (25.0, 32.6) | 1 | 0.06 | 1 | ||
| Yes | 43 | 118 | 37.7 | (29.2, 46.9) | 1.5 | (0.9,2.3) | 1.1 | (0.6, 2.0) | ||
| Family size | 1–3 persons | 7 | 117 | 6.5 | (3.1, 13.1) | 1 | <0.001 | 1 | ||
| 4–6 persons | 120 | 388 | 31.4 | (26.9, 36.1) | 6.6 | (2.9, 14.7) ** | 7.4 | (2.6, 21.3) ** | ||
| ≥7 persons | 75 | 172 | 44 | (36.6, 51.7) | 11.3 | (4.9, 26.0) ** | 2.5 | (0.8, 8.2) | ||
| Predominant material in HH walls | Mud | 200 | 669 | 30.3 | (26.9, 33.9) | 1 | 0.7 | |||
| Cements | 2/8 | 8 | 24 | (5.7, 62.1) | 0.7 | (0.1, 3.8) | ||||
| Predominant material in HH roof | Iron | 62 | 227 | 27.8 | (22.2, 34.1) | 1 | 0.32 | |||
| Thatched | 140 | 450 | 31.5 | (27.4, 35.9) | 1.2 | (0.8, 1.7) | ||||
| Firewood use for cooking | No | 102 | 382 | 27.4 | (23.1, 32.1) | 1 | 0.08 | 1 | ||
| Yes | 100 | 295 | 33.9 | (28.6, 39.6) | 1.4 | (0.9, 1.9) | 1.4 | (0.9, 2.2) | ||
| Livestock ownership | No | 7 | 33 | 22.4 | (10.9, 40.6) | 1 | 0.34 | |||
| Yes | 195 | 644 | 30.6 | (27.2, 34.3) | 1.5 | (0.6, 3.7) | ||||
| History of malaria in the past year of any household member | No | 165 | 583 | 28.5 | (24.9, 32.3) | 1 | 0.01 | 1 | ||
| Yes | 37 | 94 | 41.6 | (31.9, 52.0) | 1.8 | (1.1, 2.8) * | 1.4 | (0.7, 2.6) | ||
| Discussion about malaria in the past month | No | 47 | 137 | 34 | (26.4, 42.5) | 1 | 0.28 | |||
| Yes | 155 | 540 | 29.2 | (25.6, 33.2) | 0.8 | (0.5, 1.2) | ||||
| HH access to LLINs | No | 95 | 114 | 83.25 | (75.12, 89.11) | 20.3 | (11.9, 34.9) ** | <0.01 | 34.0 | (17.1, 67.5) ** |
| Yes | 107 | 563 | 19.63 | (16.54, 23.14) | 1 | 1 | ||||
© 2017 by the authors. Licensee MDPI, Basel, Switzerland. This article is an open access article distributed under the terms and conditions of the Creative Commons Attribution (CC BY) license (http://creativecommons.org/licenses/by/4.0/).
Share and Cite
Seyoum, D.; Speybroeck, N.; Duchateau, L.; Brandt, P.; Rosas-Aguirre, A. Long-Lasting Insecticide Net Ownership, Access and Use in Southwest Ethiopia: A Community-Based Cross-Sectional Study. Int. J. Environ. Res. Public Health 2017, 14, 1312. https://doi.org/10.3390/ijerph14111312
Seyoum D, Speybroeck N, Duchateau L, Brandt P, Rosas-Aguirre A. Long-Lasting Insecticide Net Ownership, Access and Use in Southwest Ethiopia: A Community-Based Cross-Sectional Study. International Journal of Environmental Research and Public Health. 2017; 14(11):1312. https://doi.org/10.3390/ijerph14111312
Chicago/Turabian StyleSeyoum, Dinberu, Niko Speybroeck, Luc Duchateau, Patrick Brandt, and Angel Rosas-Aguirre. 2017. "Long-Lasting Insecticide Net Ownership, Access and Use in Southwest Ethiopia: A Community-Based Cross-Sectional Study" International Journal of Environmental Research and Public Health 14, no. 11: 1312. https://doi.org/10.3390/ijerph14111312