1. Introduction
Nowadays, the field of nanotechnology is accelerating in fabricating specifically engineered nanoparticles (NPs) which meet consumer needs. Economists predict, for the period from 2015 to 2020, an annual medial turnover of up to
$3 trillion [
1]. Next to first-generation NPs consisting of mono-elemental single sized nanomaterials, nowadays, complex nano-sized compounds, such as composites or oddly-shaped nanoparticles, are synthesized. For all these emerging NPs, information on fate and toxicity is vital knowledge to warrant the design of NPs that are safe for humans and the environment.
There are, nevertheless, concerns regarding NP-specific modifications needed for proper toxicity testing of NPs [
2,
3]. A first challenge with regard to NPs is that they often are synthesized in small quantities, especially in the design and testing phases of product development. Standard testing guidelines based on soluble chemicals, such as those prescribed by the OECD (Organization for Economic Co-operation and Development [
4]), typically prescribe a vast amount of compound to be used in at least five test concentrations having twenty replicates. In the case of zebrafish embryo testing, a minimum of 2 mL exposure medium per replicate is needed in common practice (guideline 236, 2013 [
4]). The exposure medium should be refreshed daily during the testing, whilst the maximum test duration is six days. This sums up to 240 mL of exposure suspension for each concentration to be tested and implies that, for instance, for testing a concentration of 1000 mg/L only (as often done in toxicity testing [
5]), 240 mg of compound is needed. For a full range of five concentrations up to 1000 mg/L, this adds up to 720 mg of compound. On top of this, quite some additional material is needed for fate characterization and assessment of the physicochemical properties of the NPs. After all, not only the chemical fate of the NP should be determined, but also the colloidal and particle fate and behavior. Size determination of the colloids in solution (via dynamic light scattering assessment) commonly requires 10 mg of the NPs, including samples for transmission electron microscopy pictures. The measurements of the total concentration demands for a minimum of 25 mg of the NPs, followed by the same amount of the NPs needed to measure the ion concentration in the samples. This adds up to additional amount of at least 60 mg for chemical assessments. Overall, the amount of NPs needed to generate the very basic data regarding the fate and effect profile, strongly exceeds the quantities of material typically available in the initial research and development (R and D) phases. Hence, novel strategies are needed to reduce these amounts as much as possible.
The second challenge is the fact that debate is still ongoing regarding the question: which dose metric to use in order to properly express toxicity of NPs? Given the differences in size and shape of NPs and subsequent impacts of these properties on particle toxicity, it is unlikely that the mass of NPs administered is a proper descriptor of the actual dose causing toxicity [
6,
7].
The third challenge is that only rarely acute effects due to exposure to NPs are shown. Therefore, the determination of responses requires either availability of modified experimental protocols enabling to screen more sensitive sub-lethal endpoints, or increased modeling efforts that allow prediction of sub-lethal effects of hitherto non-tested NPs. With modeling effort, data gaps can be filled via interpolating approaches using similarity analysis [
8] and eventually extrapolated between species via toxicity relationship assessments [
9].
In view of these challenges, the aim of our study was to develop novel testing strategies that allow for efficient fate and toxicity assessments that require only small amounts of testing materials whilst achieving the same sensitivity with regard to the assessment of the endpoints of toxicity as in the corresponding standardized OECD tests. Previously, attempts were already made to reduce the amount of material needed [
10,
11], and these attempts are further improved in this study. Our study aimed to: (a) develop new experimental testing strategies enabling to work with low quantities of NPs; (b) determine the best dose-metric to describe the toxicity of particles, and (c) develop translational models for dose-response predictions for NPs even for those NPs that are classified as inducing low toxicity.
Experiments were conducted using three differently shaped Ag NPs. Since Ag NPs were found to display relative high rates of ion release, they are a clear example of non-stable metallic NPs. Ag NPs are classified as being toxic with LC
50 values between 1 and 10 mg/L [
12]. Experiments were also conducted with TiO
2 NPs. These NPs are known to be chemically inert, thus allowing to test suspensions of stable metallic NPs as opposed to the tests performed with metallic NPs that dissolve during testing (non-stable NPs). TiO
2 is classified to be harmful to the ecosystem (LC
50 value between 10 and 100 mg/L [
12]). By comparing the predictive power of the translational models for non-stable NPs with predictions made for stable metallic NPs, the applicability of the model to a wide range of NPs was tested. The results obtained for non-spherical NPs are discussed in view of the development of a regulatory framework to assess the safety of manufactured nanomaterials.
2. Materials and Methods
2.1. Preparation of Particle Suspensions
Spherical Ag NPs with nominal size of 20 nm (nominal surface to volume ratio 0.3) were purchased from SkySpring Nanomaterials, Inc. (Houston, TX, USA). A suspension of Ag nanoplates was obtained from Moscow State University (Moscow, Russia). Elongated Ag rods with a nominal size of 50 nm × 0.6 to 12 μm (nominal surface to volume ratio of 0.08) in suspension were purchased from Fraunhofer ISC (Würzburg, Germany). Spherical TiO2 NPs with a nominal size of 20 nm (nominal surface to volume ratio 0.3) were obtained from Io-Li-Tec nanomaterials (Heilbronn, Germany). Bipyramidal TiO2 NPs and TiO2 nanoplates were obtained from the Centre of BioNano Interaction (University College Dublin, Dublin, Ireland). The Ag nanospheres and nanoplates were coated with PVP (polyvinylpyrrolidone), and all other NPs were uncoated. Stock solutions were prepared by weighing dry powdered Ag or TiO2 particles and adding them into egg water (consisting of 60 μg/mL Instant Ocean Sea Salt, Sera Marin, in Milli-Q water, pH 6.5–7.0). Ag+ solutions were obtained by adding silver nitrate (AgNO3: CAS 7761-88-8, Sigma Aldrich, Zwijndrecht, The Netherlands) to egg water. All stock solutions were freshly prepared and sonicated for 10 min in an ultrasonic water bath (USC200T, VWR, Amsterdam, The Netherlands). Prepared stock suspensions or manufactured suspensions were diluted using egg water and embryos were exposed immediately after preparation.
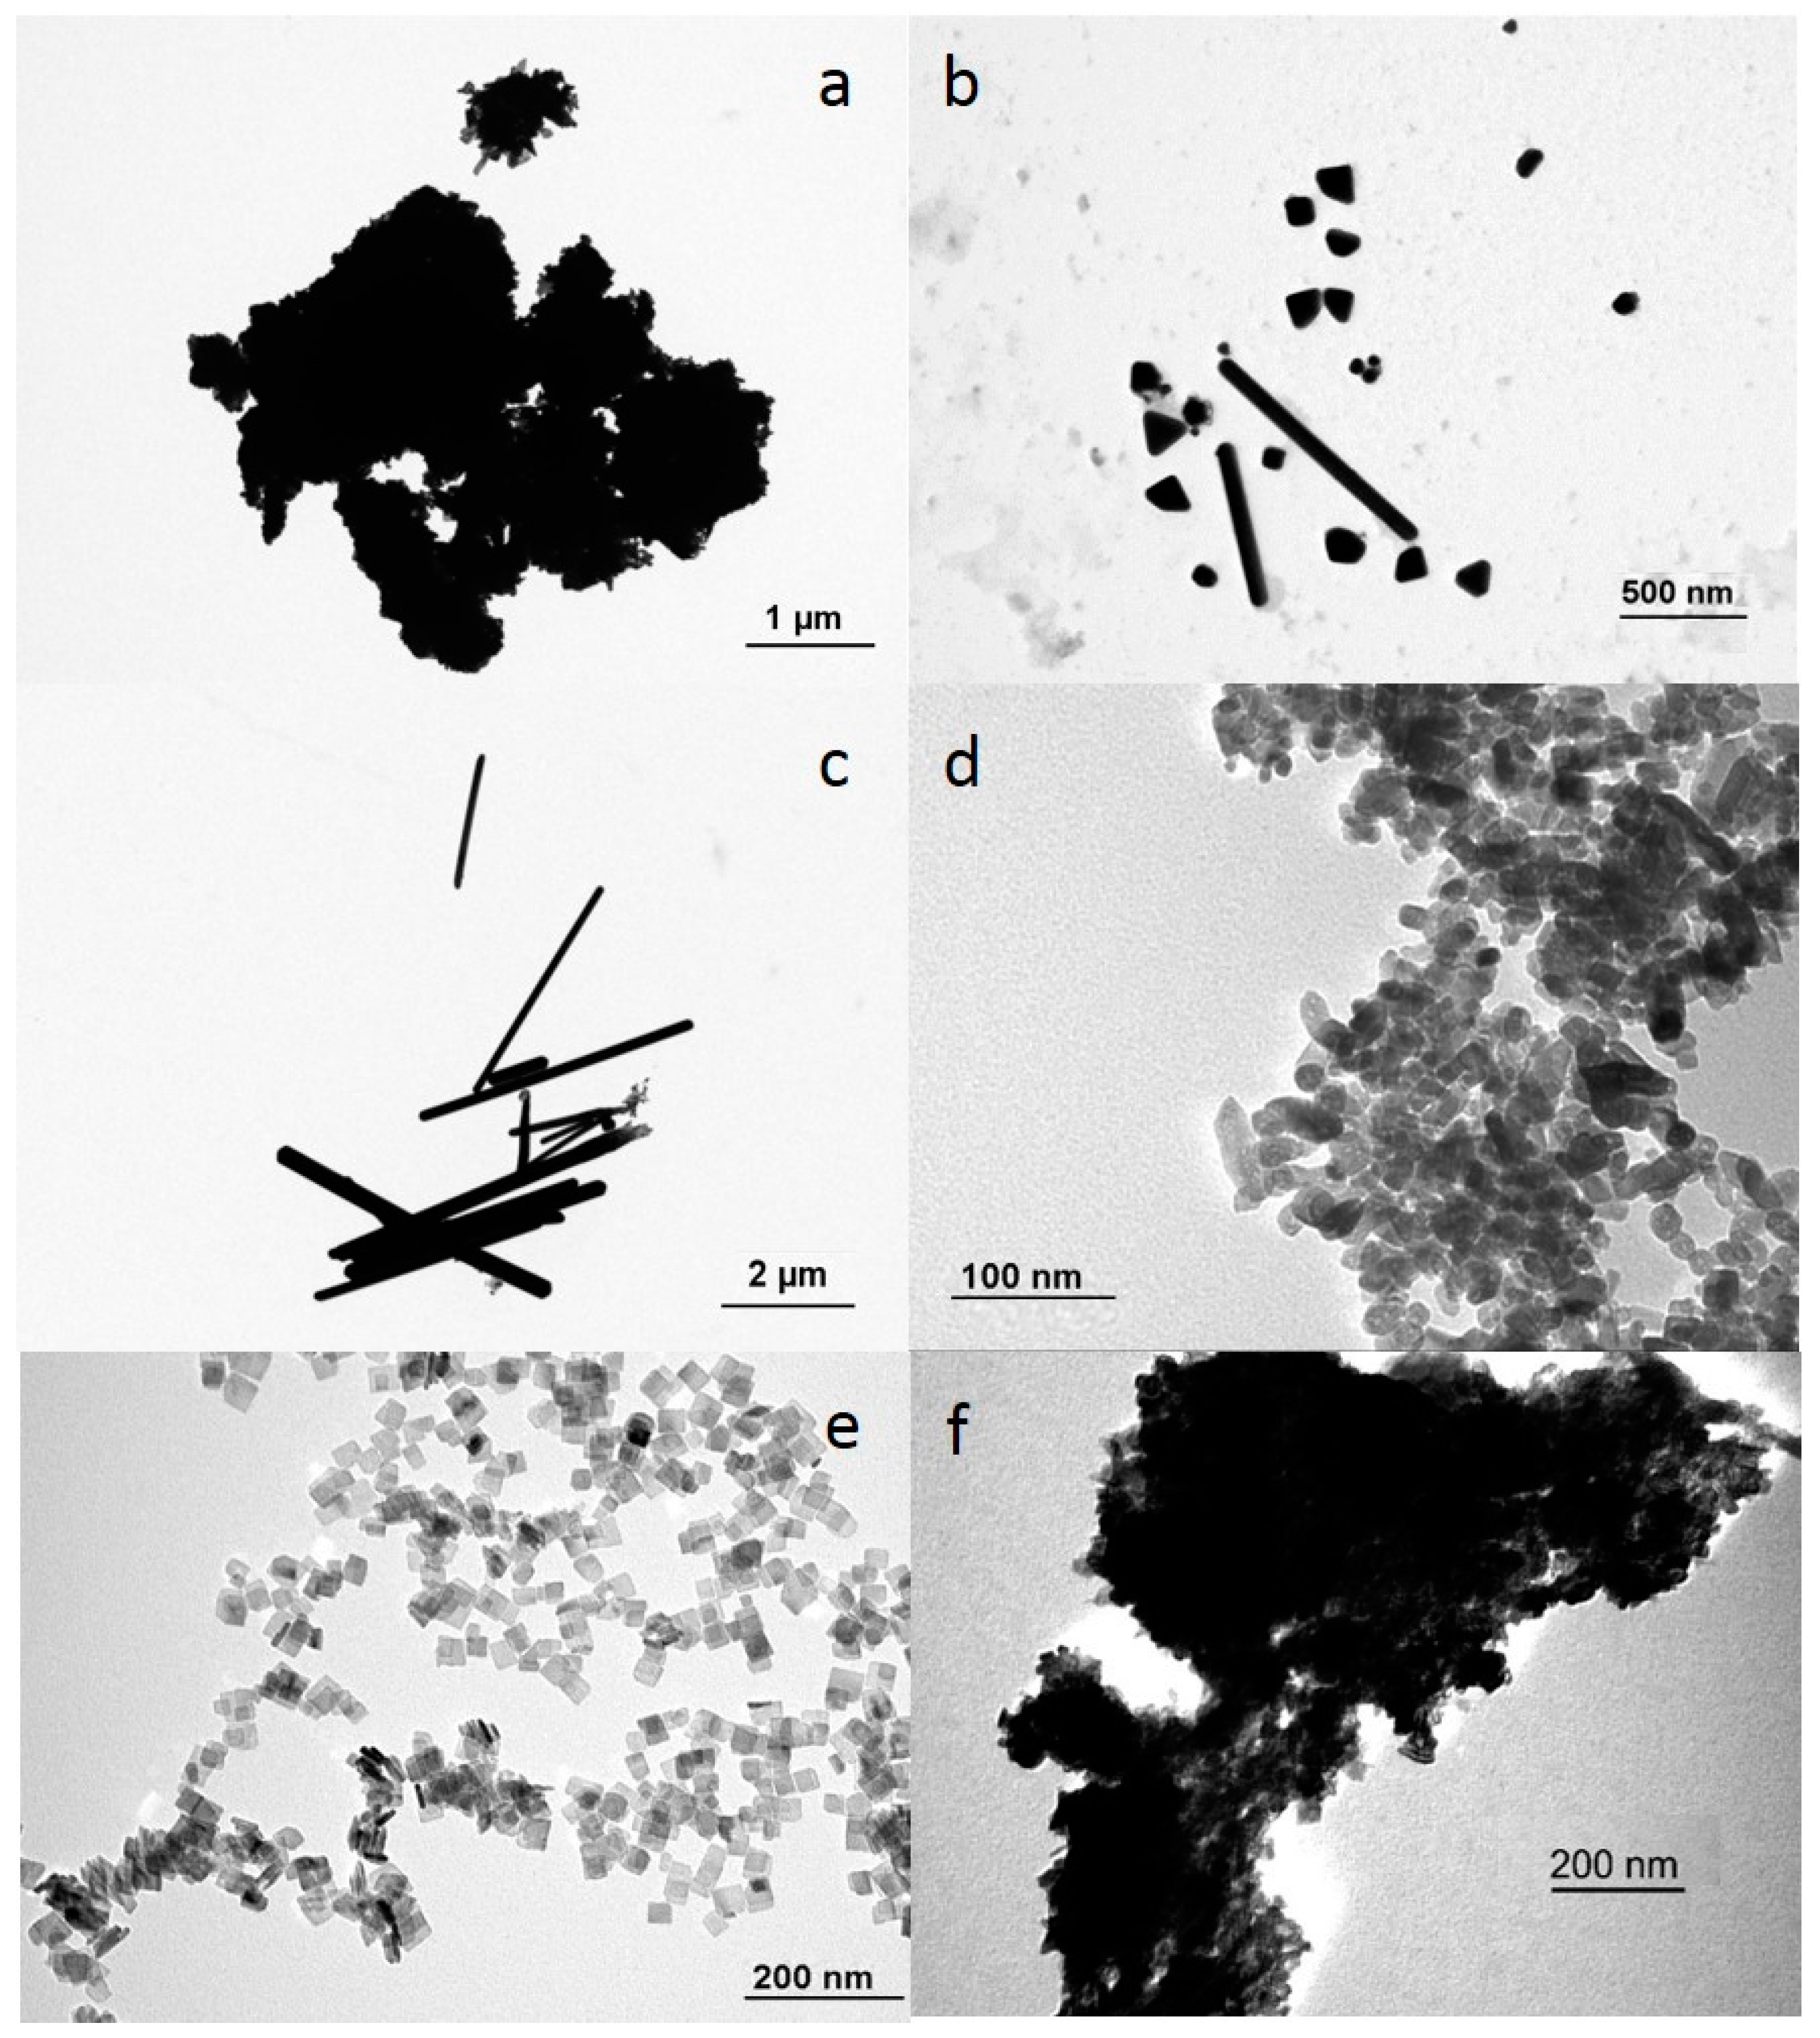
2.2. Physicochemical Characterization
The size and morphology of the suspended Ag NPs and TiO2 NPs were characterized using transmission electron microscopy (TEM; JEOL 1010, JEOL Ltd., Tokyo, Japan) after 1 h of incubation in egg water. Dynamic light scattering assessments were performed on a Zetasizer Nano-ZS instrument (Malvern Instruments Ltd., Malvern, UK). The assessments allowed detection of the size distribution and the zeta-potential of Ag and TiO2 suspensions in egg water at 1 h and 24 h.
The concentrations of dissolved Ag ions and AgNP
(total) in egg water were analyzed using flame atomic absorption spectroscopy (AAS; Perkin Elmer 1100B, Waltham, MA, USA). Freshly-prepared dispersions (
t = 0 h) and dispersions equilibrated for 24 h were used for this purpose. HCl (CAS 7647-01-0, Sigma Aldrich, Zwijndrecht, The Netherlands) was added to avoid loss of Ag due to precipitation and sorption to the wall of the vials. To determine concentrations of dissolved Ag ions in the particle suspensions, 7.5 mL of the supernatant was sampled after centrifugation of Ag NP suspensions at 5000×
g for 10 min to remove NPs and ultimately determine the soluble silver fraction in the solution [
13].
Titanium concentrations in the suspensions of nanoplates and nanobipyramids were analyzed following digestion with aqua regia (HCl: CAS 7647-01-0; HNO
3: CAS 7697-37-2, Sigma Aldrich, Zwijndrecht, The Netherlands) and are determined using ICP-OES (Vista-MPX, Varian Inc., Santa Clara, CA, USA). The centrifugation step to determine ion concentrations in suspension was not included for TiO
2 NPs because TiO
2 particles do not undergo dissolution in aquatic suspensions [
14]. Ti concentrations were measured immediately after preparation of the suspensions (0 h) and 24 h after preparation.
2.3. Experimental Setup
The OECD guideline 236 was modified as described in detail below. The modified experimental design uses in total roughly 1% of the amount of chemical required by the standard zebrafish embryo test protocol [
4].
2.4. Zebrafish Husbandry
Zebrafish were handled as described by animal welfare regulations established in 2014 and they were maintained according to standard protocols (
http://ZFIN.org). Adult zebrafish were maintained at 25 ± 5 °C in a 14 h light: 10 h dark cycle. Fertilized zebrafish eggs were obtained from an AB/TL wild-type zebrafish.
2.5. Toxicity Assay for Ag NPs
An acute exposure regime of 120 h was used, from 24 h post fertilization (hpf) to 144 hpf, thus including exposure during all major stages of embryonic development. The background mortality at 24 hpf was less than 10% (data not shown). The first adjustment to the OECD guideline is by following the protocol of Hua et al. [
15], starting the exposure at 24 hpf. Thereafter, instead of transferring one embryo per well of a 24-well plate, 10 zebrafish embryos were distributed into each well of a 24-well plate in 2 mL of freshly prepared egg water containing a negative control, various concentrations of AgNO
3 or various concentrations of Ag NP suspensions. One well was used per concentration. The nominal concentration range for the spherical NPs was 5 to 100 mg/L; the dilution factors for plates and elongated rods ranged from three to 30,000 times; the nominal concentration range for AgNO
3 was 48 to 480 μg/L. Throughout the exposure, embryos and suspensions were kept at a temperature of 28 ± 0.8 °C. The exposure media were replaced with a freshly prepared suspension of NPs every day according to the OECD guideline 236 [
4], except for days 4 (96 hpf) and 5 (120 hpf). The renewal procedure was shown not to increase NP concentrations over time [
6]. Before each renewal, and at the end of the experiment, embryos were evaluated for morphological defects and death. All experiments were performed in triplicate. To verify the validity of our results obtained with the modified experimental protocol enabling to work with small amounts, we compared Cu NP data acquired with the modified test protocol to results obtained using existing methods as described by Hua et al. [
15], see
Supplementary Materials (Figure S1).
2.6. Toxicity Assay for TiO2 NP
TiO
2 NPs were tested at a nominal concentration range from 10 to 1000 mg/L, using the same exposure conditions as described above for Ag NPs. The experiments with TiO
2 NPs were performed under a commonly-used light-dark regime (14:10 h) and in addition using UV-light illumination using ultraviolet-a light (350 nm) with an intensity of approximately 1700 μW cm
−3 for 14 h [
16]. Temperature was maintained at 28 ± 0.8 °C during the experiments. All experiments were performed in triplicate.
2.7. Behavioral Analysis for TiO2 NPs
Before behavioral analysis, all living embryos (144 hpf) were evaluated in terms of normal development, morphological defects, and vitality using a stereo dissecting microscope. The behavioral analysis was performed by subjecting the embryos to the light–dark challenge test as modified according to Hua et al. [
10]. Zebrafish embryos have a low locomotor activity under light exposure (basal phase). Sudden transition to dark induces a sharp spike of fast swimming activity lasting less than 2 s (challenge phase [
10]). A total of 22 min of recording was used (
Supplementary Materials, Figure S3): 10 min acclimatization, 4 min basal phase, 4 min challenge phase, and 4 min recovery phase. The total distance moved of each zebrafish embryo was tracked using the Zebrabox (Viewpoint, Lyon, France) and analyzed using VideoTrack software (Version 12, Viewpoint, Lyon, France).
2.8. Modeling
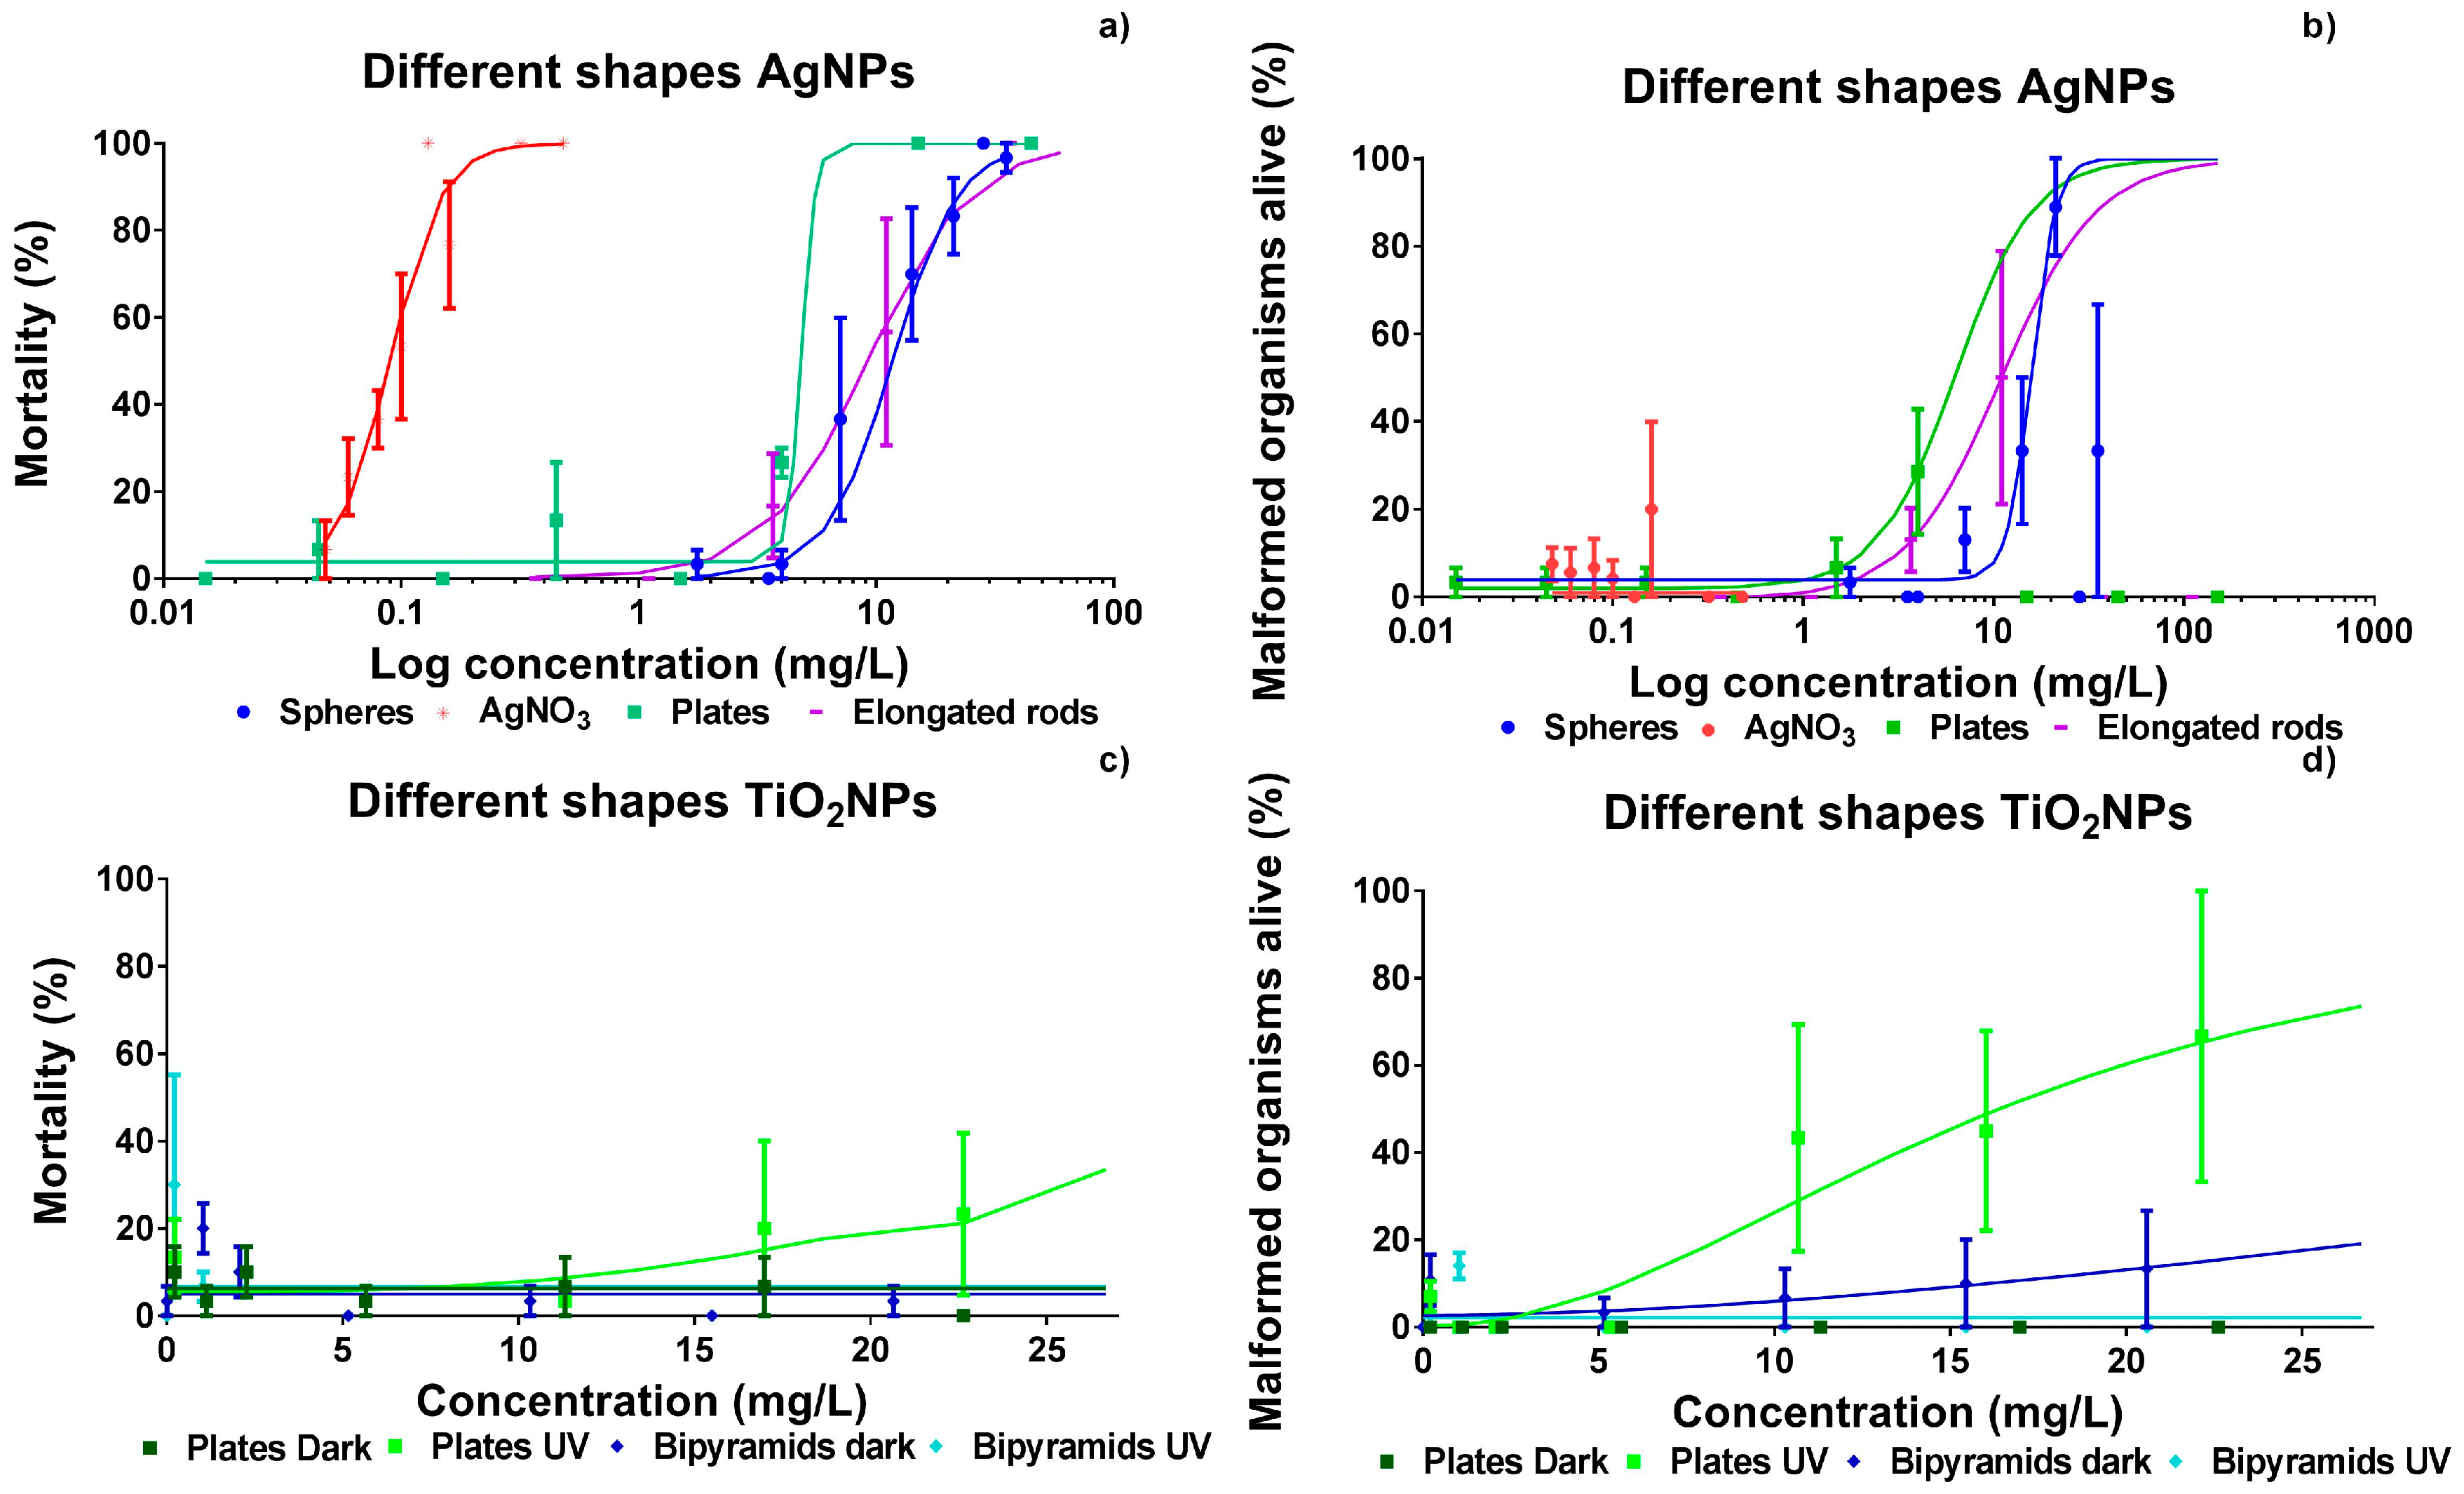
2.8.1. Dose-Response Curves
Observational data of the fish embryos as obtained at 144 hpf were used to determine dose-response relationships—using mortality data and the sub-lethal malformation endpoints. For calculating lethal and sub-lethal effect concentrations, a sigmoidal dose-response model was used, available from the SPSS 23 software package (IBM, Armonk, NY, USA).
2.8.2. Contribution to Toxicity of Ag Particles and Ions
An AgNO
3 solution was used to quantify the toxicity of Ag ions to zebrafish embryos. This allowed us to determine the effect of the dissolved ion fraction in the solution (AgNP
ion; as measured with AAS. The toxicity of the suspension (AgNP
total) to zebrafish embryos was determined as being the sum of the response of the suspended particles (AgNP
particle) and the response of the dissolved ions (AgNP
ion). We applied the concept of response addition [
17] as already used by Hua et al. [
15] to compute the joint toxicity of metal ions shed from particles and nanoparticles. The response addition model is used because Ag ions and Ag NPs are assumed to elicit a response through different mechanisms. The model can be depicted as:
where E
total, E
ion, and E
particle represent the mortality of zebrafish embryos caused by the exposure to AgNP
total, AgNP
ion, and AgNP
particle (scaled from 0 to 1), respectively.
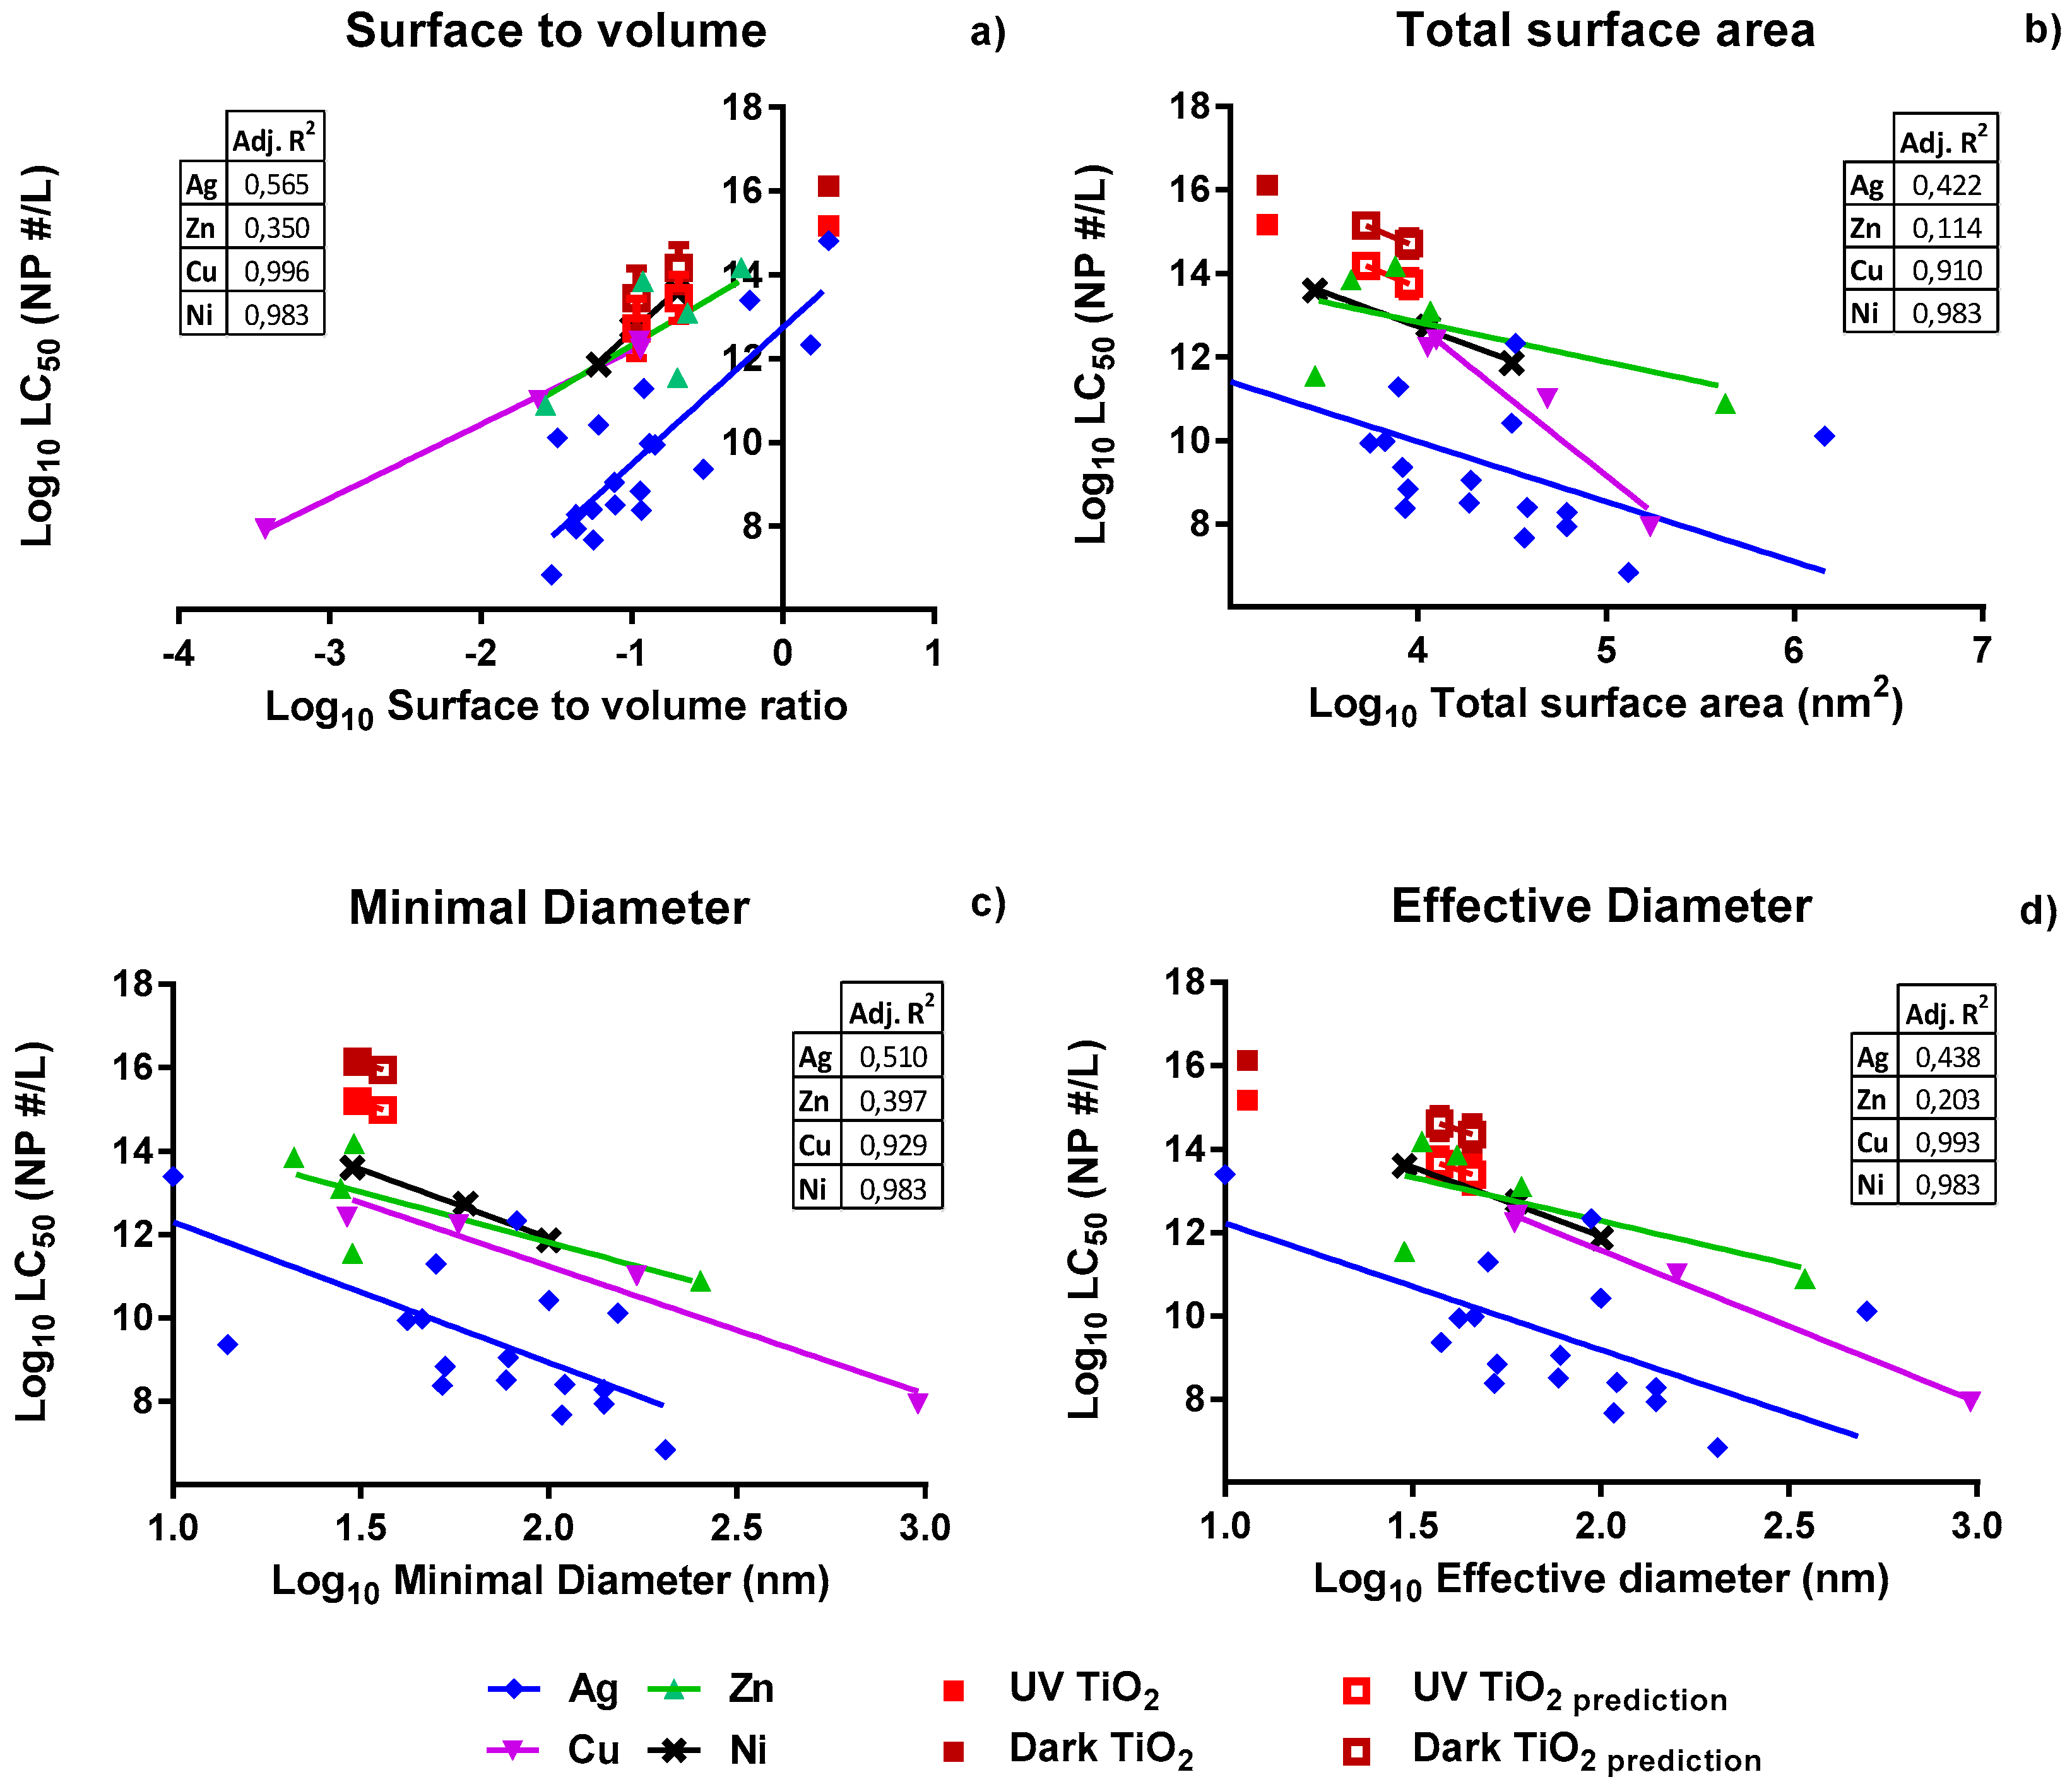
2.8.3. Dose Metric Descriptors for the Translational Models
Dose metrics to be used within the dose-response modelling were chosen to be: minimal diameter, surface area, effective diameter, and surface to volume ratio. In each case, actual size information (obtained via TEM images) of the metallic NPs was used. When agglomeration occurred, identifiable single NPs present as commonly present on the surface of the agglomerates were used for size measurements. Only pristine sizes as derived from the TEM images were used for modeling, as is common for i.e., nano-QSAR (Quantitative Structure–Activity Relationship; [
12]) and nano-QRA (quantitative read-across; [
8]). For each dose metric, the parameter values were calculated based upon the diameter (d), length (l), and width (w) of the particles. For each metallic NP, multiple particles (
n = 15 to 25) were measured and average values were used. The formulas used for calculating surface area and volume of differently shaped NPs can be found in the
supplementary material, Table S1.
In order to use dose metrics in the translational models, we tested the following hypotheses: (i) NP toxicity increases with increasing total surface area; (ii) toxicity of the NP decreases upon increasing the smallest diameter as explained below (minimal diameter); (iii) toxicity decreases with increasing NP diameter calculated on the basis of the volume of the particles, independent of shape (effective diameter); and (iv) toxicity of NPs increases with increasing surface to volume ratio of the particles.
2.8.4. Toxicity Prediction
Experimentally-obtained response data were plotted against the four dose metrics used. At first, the dose metric was expressed based on the total surface area of the particle [
18], as based on the hypothesis that a higher total surface area represents more reactive surface area.
Secondly, for spherical and non-spherical particles, the dose metric was expressed as the minimal diameter in any dimension of the particle. It is hypothesized that the ability to penetrate into cells increases with decreasing minimal diameter [
19,
20].
Thirdly, the dose metric of spherical and non-spherical particles was determined by using the volume of the particle to calculate a fictional spherical diameter [
21]. This effective diameter is reflected by the diameter of a spherical particle with the same volume. Here, too, it was assumed that NPs with small diameters have a higher ability to penetrate cells.
Fourthly, the dose metric was expressed as the surface to volume ratio of the NP. Both decreasing size and differences in particle shape modify the surface to volume ratio. Similar to total surface area, here an increasing ratio implies a larger reactive surface and, hence, increased toxicity [
13].
For each parameter, a linear regression model was developed for the Ag NPs used in this study. Similar to the AgNP
particle data, secondary data [
10,
15,
22,
23,
24] collected for AgNP
particle, CuNP
particle, NiNP
particle, and ZnONP
particle were plotted as a function of the different dose metrics. The obtained linear dose metric relations for the non-stable metals Ag NP, Cu NP, Ni NP, and ZnO NP were used to calculate an overall linear regression coefficient ± standard deviation. Each regression line as obtained for the individual metallic NPs was given equal weight. In addition, a
p-value was calculated indicating whether the initial slopes of the regression lines obtained for the Ag NPs, Cu NPs, Ni NPs and ZnO NPs differed significantly. Similarity of slope is assumed to reflect the appropriateness of a dose metric to predict toxicity across metallic NPs. Thereupon, the intercepts of the individual regression equations were calculated as these reflect the intrinsic reactivity of metallic NPs. Using the overall linear regression coefficients thus obtained, and based upon the limited availability of experimental data on TiO
2 toxicity, the intercept of the dose metric relation of TiO
2 NPs was calculated, after which LC
50-values of TiO
2 nanobipyramids and nanospheres were predicted.
2.8.5. Statistical Analysis
Significant differences between the newly-developed and already-existing testing protocols [
15] were tested using a two-tailed T-test. Data collected on the behavioral test were presented as mean ± standard error of the mean (SEM). The homogeneity of variance was checked using the SPSS 23 software package (Version 23, IBM, Amsterdam, The Netherlands). The significance level for all calculations was set at
p < 0.05. Significant differences between the different exposures within each phase were tested using a one-way analyses of variance (ANOVA) with Tukey’s multiple comparison post-test. Dose-metric linear regression modeling was performed using Prism (Version 7, GraphPad, La Jolla, CA, USA), followed by comparison of the aligning of the regressions developed for the different metallic NPs (comparable with an ANCOVA), using the same software. The limit of significance was set at
p < 0.01 to account for the low numbers of experimental data that were typically available for generating the regression lines.
4. Discussion
There are at least two challenges to overcome when modifying conventional ecotoxicity assays to comply with nano-specific needs. The first challenge that we identified is the observation that, in the case of newly-synthesized nanoparticles, often only small amounts of materials are available for toxicity testing and fate assessment. The other challenge is that the dose metric to express toxicity is still under debate, which hinders the development of predictive models.
4.1. Novel Experimental Setup
Dealing with small amounts of NPs for testing implies that the required test volume is a limiting factor in testing full dose-response relationships. In recent publications, adjustments to the OECD guideline 236 [
4] were proposed using a 96-well plate in order to limit the amounts of test chemicals to be used [
10,
11]. Our experimental test setup described here could even reduce the total amount from 720 mL, as required within the OECD standard test, to 8 mL of exposure medium for each concentration by lowering the total test volume, combined with the addition of a higher number of embryos in a single well, without losing accuracy. In our case, this reduced the total amount of compound needed for the whole experiment (in triplicate) from 1900 mg to 66 mg. Although the setup of Lin et al. [
11] achieved a similar reduction, their method was not suited for nanoparticles. Nanoparticles typically tend to sediment, and frequent renewal of the medium is required in order to maintain the experimental concentration as renewal reduces the particle loss due to sedimentation. Unfortunately, medium renewal is not included in the modification proposed by Lin et al. [
11]. The quantitative deviations between the outcomes of the regular and the novel testing strategy were found to not differ significantly (
p > 0.05;
Figure S1, Supplementary Materials).
However, within the concentration range tested, response levels could not be determined for some of the nanoparticles (TiO
2 nanospheres and nanobipyramids). In order to allow for testing of NPs with a low intrinsic toxicity, we used three differently-shaped TiO
2 NPs, since TiO
2 NPs are classified as being moderately harmful with LC
50 values found to range between 10 and 100 mg/L [
12]). The TiO
2 nanospheres (data not shown) and nanobipyramids showed no effects even at the highest concentration tested (
Figure 2). Additional UV-irradiation of the TiO
2 NPs [
5,
14] increased the effects induced by nanoplates of TiO
2, but this was not the case for the other two shapes. These two particles were not the only exception, since Faria et al. [
25] also report extremely low toxicity of TiO
2 particles in 8 dpf larvae which were exposed under a series of illumination intensities. Thereupon, these results are in line with the findings of Bar-Ilan et al. [
23] on acute toxicity, reporting 50% mortality after chronic exposure of zebrafish during 12 days to suspensions containing 0.1 mg/L nanospheres having a diameter of 21 nm. The observation of a lack of morphological effects at early life stages of TiO
2 NPs is supported by other authors [
26,
27] who report particle-dependent effects at the gene level only. This may eventually lead to reproductive effects [
28,
29].
In line with all previous studies on this topic [
23,
25,
26,
27,
28,
29], our results showed that actual concentrations were significantly lower for all tested NPs compared to nominal concentrations. Especially for TiO
2 NPs, it is noteworthy to mention that the actual concentration was only 2–3% of the nominal concentration, hence, the amount of bioavailable NPs is much lower than the nominal concentration. This observation can be attributed to the agglomeration and sedimentation processes that occurred extremely rapidly during the experimental course (
Table 1), as also reported by Bar-Ilan et al. [
23]. Sedimentation of TiO
2 NPs was reported to increase in suspensions of high ionic strength [
30], which is the case in the exposure medium that we used for zebrafish embryo testing (0.853 M). Overall, these observations imply that the fraction of TiO
2 NPs that is available for uptake via the water phase is extremely low. Subsequently assuming that zebrafish embryos are exposed via the water phase only, well explains the observed absence of toxicity.
4.2. Translational Modelling
The highest predictive power was obtained when using either the minimal or the effective diameter as a dose metric. Due to the shapes of the particles, the smallest diameter can be much smaller at a certain amount of particles per volume, compared to a spherical particle. Various studies [
18,
31] report that surface to volume ratio and total surface area [
16] are proper dose metrics for various nanomaterials. Our results did not confirm these general findings, as surface to volume ratio was found not to be the best predictor of toxicity across NPs and as use of the total surface area actually yielded the lowest predictive power. This lack of correlation between surface area and responses was also seen by Wittmaack [
32]. Instead, other dose metrics, including the number of particles and joint length (product of number of particles and mean size) were found to be more suited to this study [
32]. It should be noted that our study included a variety of differently shaped NPs and, thus, offers a larger variety of surface areas for analysis, while other studies [
18] covered spherical NPs only.
4.3. Toxicity Prediction
Our linear regression models were found to be good predictors for the toxicity of the metallic NPs Ag, Cu, Ni, and ZnO. Therefore, these models were used to calculate the effect levels for novel metallic NPs for which no adverse responses were observed even at the highest concentrations tested. In the suspensions used for toxicity testing of zebrafish embryos, no higher actual concentrations than 20.7 mg/L TiO2 NP for the nanobipyramids and 50.9 mg/L TiO2 NP for the nanospheres could be obtained. Based upon the model using the minimal particle diameter, all LC50 values for these TiO2 NPs are predicted to exceed 200.6 mg/L TiO2 NP, which is a concentration that is far above the maximum test concentration that we could achieve in the zebrafish medium employed in our study. Subsequently, these predictions nicely confirm the observed lack of effects.
The underlying reason as to why we were not able to observe any adverse effects in the case of testing of TiO
2 NPs could be related to the fact that the mechanism of toxicity of TiO
2 NPs, being stable metallic materials that do not release ions, differs from the mechanisms of toxicity of the labile metallic NPs tested in our study: Ag NPs, Cu NPs, Ni NPs, and ZnO NPs. The models developed for the labile metallic NPs are based on (acute) embryo mortality, whereas as stated previously, effects of TiO
2 NPs were reported only after long-term exposure only [
25,
29], and restricted to the effects on gene expression [
26,
27] and reproduction [
28,
29], rather than morphological and lethal effects. To determine sub-lethal responses, we performed a light-dark challenge test on top of the TiO
2 NP exposure + UV illumination. As discussed above, UV illumination generally enhances the reactivity of TiO
2, hence, enlarging the potential toxicity. Moreover, the light-dark challenge test allows determining sub-lethal stress on stress responses. In our experiment, these additional assessments did not induce the responses that were observed by other researchers [
25,
29].

 ,
, 


