The Interaction between Ambient PM10 and NO2 on Mortality in Guangzhou, China

 , ,
, ,
Abstract
:1. Introduction
2. Materials and Methods
2.1. Data Sources
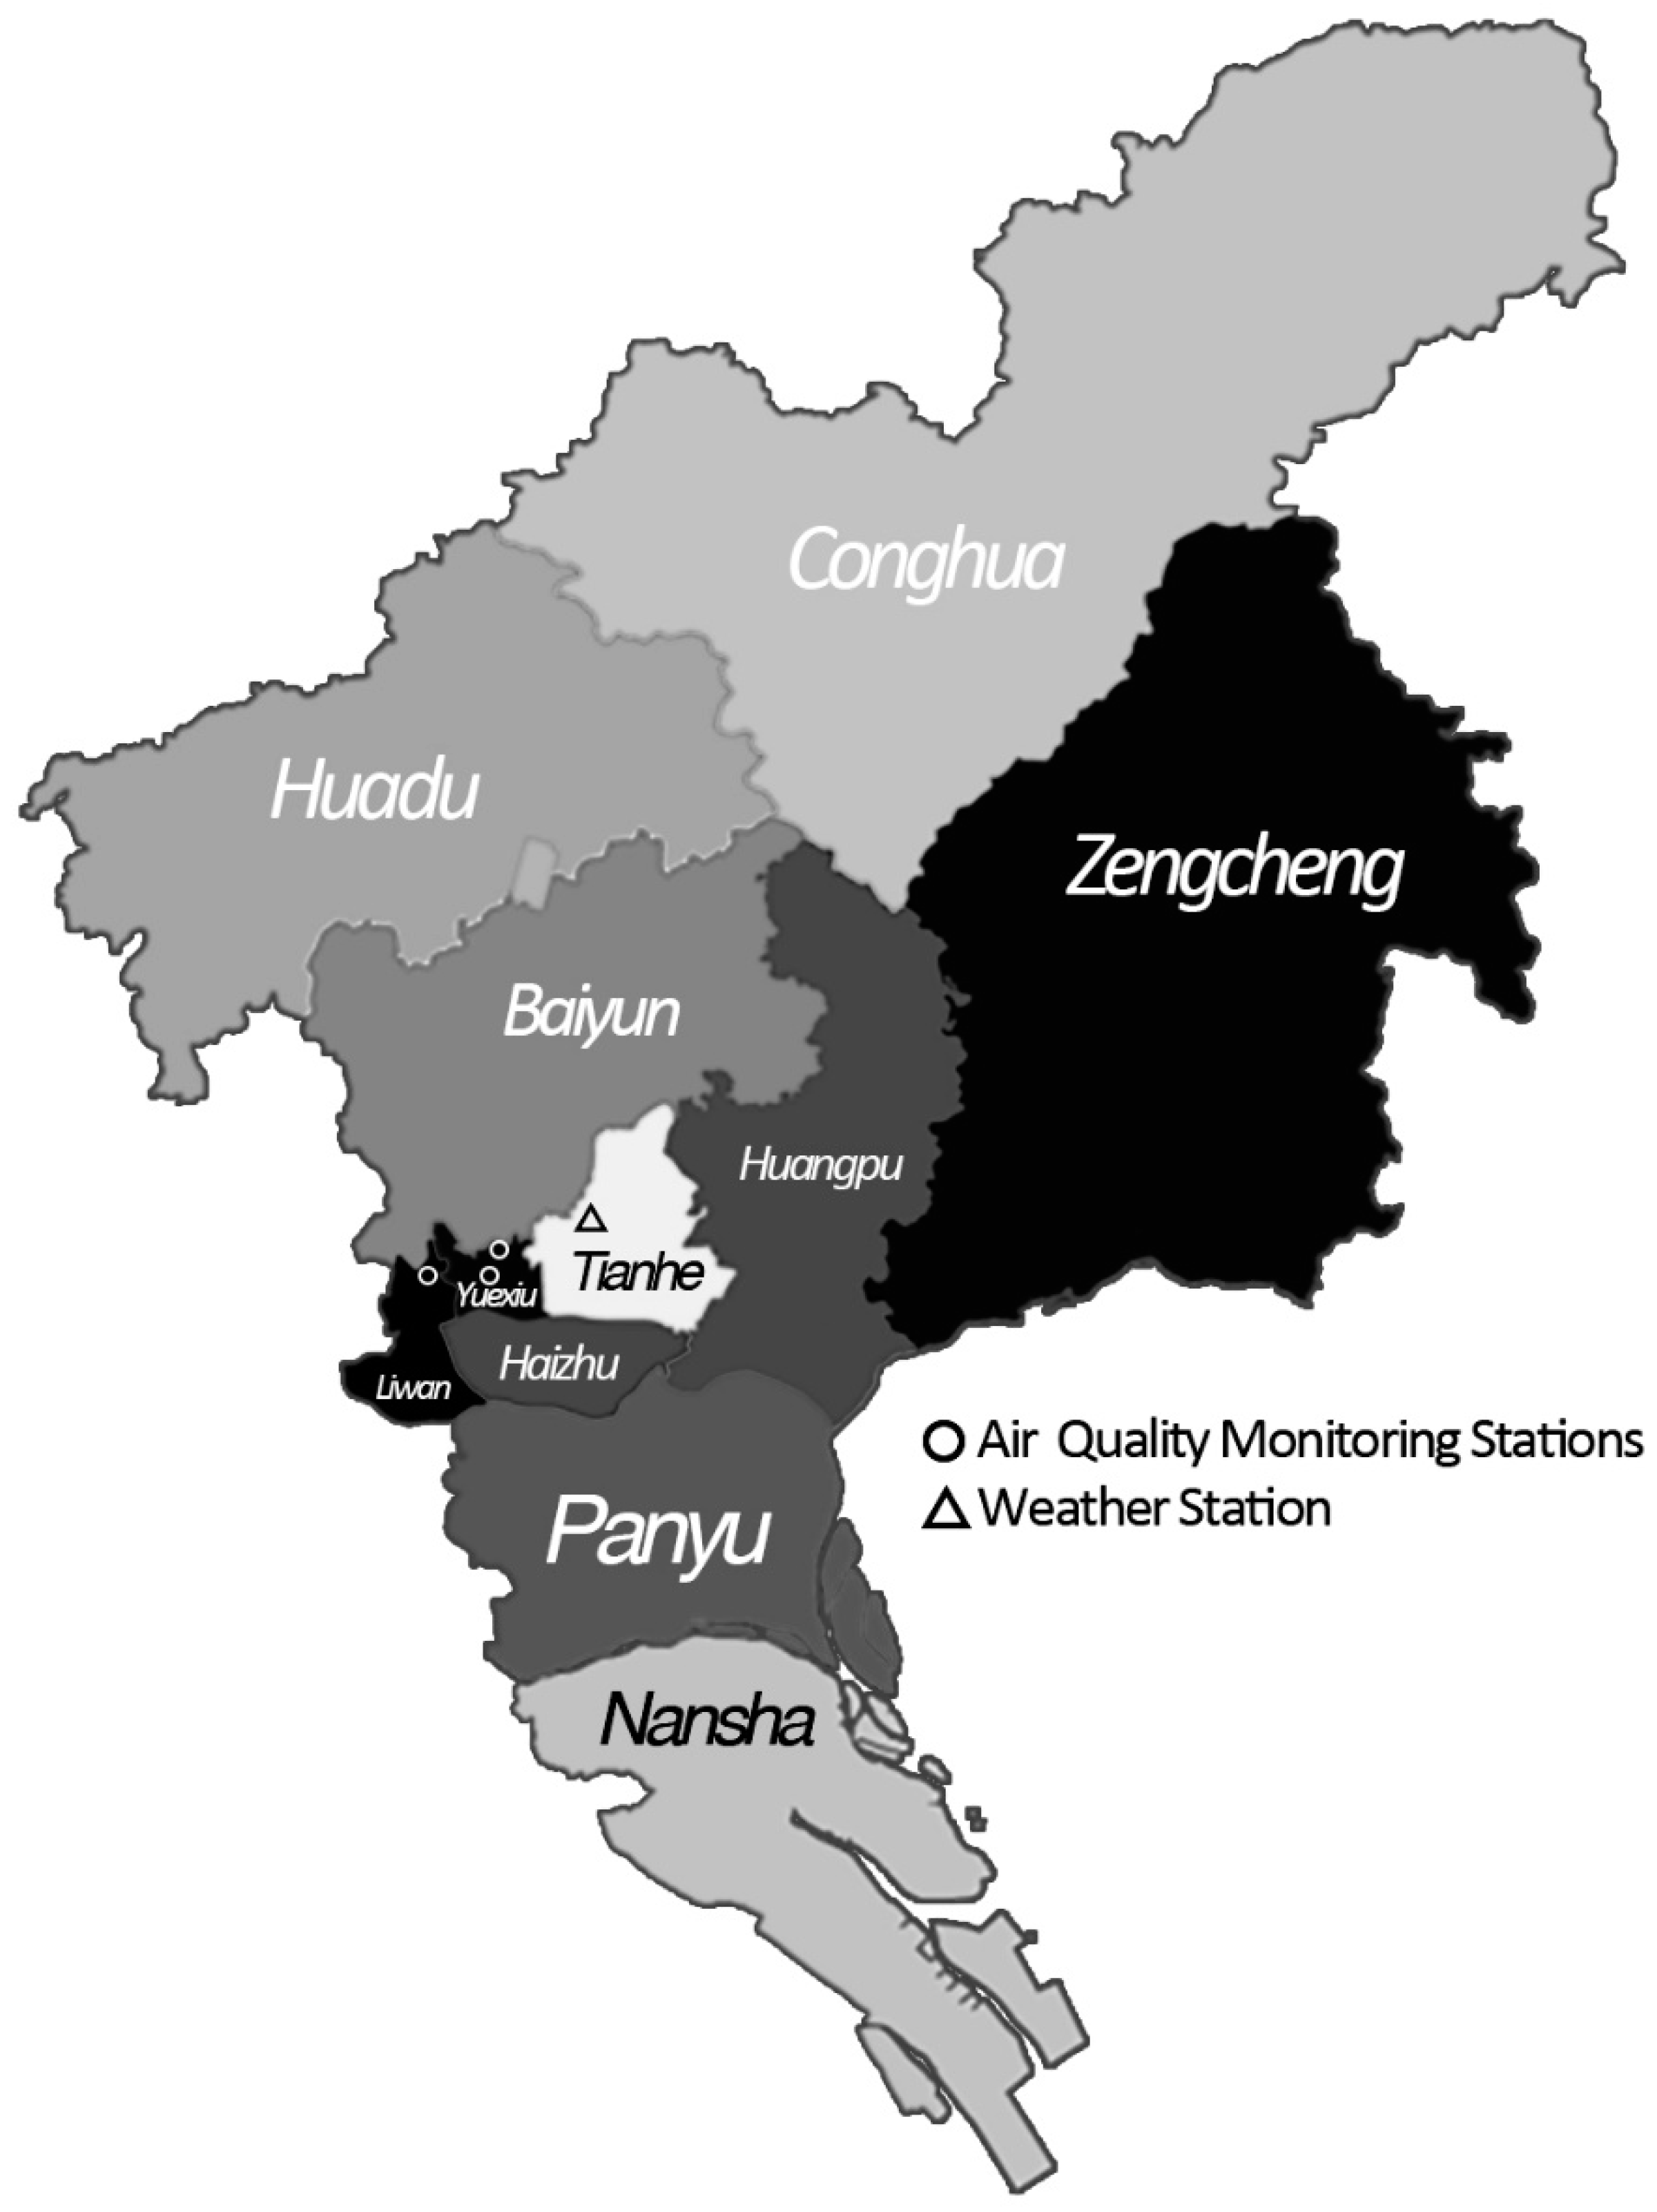
2.1.1. Setting
2.1.2. Mortality Data
2.1.3. Air Pollution and Meteorological Data
2.2. Statistical Analysis
2.2.1. Core Model Development
2.2.2. Single Pollutant Analysis
2.2.3. Interaction Analysis
2.2.4. Model Testing and Sensitivity Analysis
3. Results
4. Discussion
5. Conclusions
Supplementary Materials
Acknowledgments
Author Contributions
Conflicts of Interest
References
- Dockery, D.W.; Pope, C.A.; Xu, X.; Spengler, J.D.; Ware, J.H.; Fay, M.E.; Ferris, B.G.; Speizer, F.E. An association between air pollution and mortality in six US cities. N. Engl. J. Med. 1993, 329, 1753–1759. [Google Scholar] [CrossRef] [PubMed]
- Cao, J.; Yang, C.; Li, J.; Chen, R.; Chen, B.; Gu, D.; Kan, H. Association between long-term exposure to outdoor air pollution and mortality in China: A cohort study. J. Hazard. Mater. 2011, 186, 1594–1600. [Google Scholar] [CrossRef] [PubMed]
- Pope, C.A., III; Thun, M.J.; Namboodiri, M.M.; Dockery, D.W.; Evans, J.S.; Speizer, F.E.; Heath, C.W. Particulate air pollution as a predictor of mortality in a prospective study of US adults. Am. J. Respir. Crit. Care Med. 1995, 151, 669–674. [Google Scholar] [CrossRef] [PubMed]
- Mauderly, J.L.; Samet, J.M. Is there evidence for synergy among air pollutants in causing health effects? Environ. Health Perspect. 2009, 117, 1–6. [Google Scholar] [CrossRef] [PubMed]
- Samoli, E.; Peng, R.; Ramsay, T.; Pipikou, M.; Touloumi, G.; Dominici, F.; Burnett, R.; Cohen, A.; Krewski, D.; Samet, J. Acute effects of ambient particulate matter on mortality in Europe and North America: Results from the aphena study. Environ. Health Perspect. 2008, 116, 1480–1486. [Google Scholar] [CrossRef] [PubMed]
- Katsouyanni, K.; Touloumi, G.; Samoli, E.; Gryparis, A.; Le Tertre, A.; Monopolis, Y.; Rossi, G.; Zmirou, D.; Ballester, F.; Boumghar, A. Confounding and effect modification in the short-term effects of ambient particles on total mortality: Results from 29 European cities within the aphea2 project. Epidemiology 2001, 12, 521–531. [Google Scholar] [CrossRef] [PubMed]
- Pönkä, A.; Savela, M.; Virtanen, M. Mortality and air pollution in Helsinki. Arch. Environ. Health 1998, 53, 281–286. [Google Scholar] [CrossRef] [PubMed]
- Aga, E.; Samoli, E.; Touloumi, G.; Anderson, H.R.; Cadum, E.; Forsberg, B.; Goodman, P.; Goren, A.; Kotesovec, F.; Kriz, B. Short-term effects of ambient particles on mortality in the elderly: Results from 28 cities in the aphea2 project. Eur. Respir. J. 2003, 21, 28s–33s. [Google Scholar] [CrossRef]
- Wong, T.W.; Tam, W.S.; Yu, T.S.; Wong, A.H.S. Associations between daily mortalities from respiratory and cardiovascular diseases and air pollution in Hong Kong, China. J. Occup. Environ. Med. 2002, 59, 30–35. [Google Scholar] [CrossRef]
- Simpson, R.W.; Williams, G.; Petroeschevsky, A.; Morgan, G.; Rutherford, S. Associations between outdoor air pollution and daily mortality in Brisbane, Australia. Arch. Environ. Health 1997, 52, 442–454. [Google Scholar] [CrossRef] [PubMed]
- Sunyer, J.; Basagaña, X. Particles, and not gases, are associated with the risk of death in patients with chronic obstructive pulmonary disease. Int. J. Epidemiol. 2001, 30, 1138–1140. [Google Scholar] [CrossRef] [PubMed]
- Chen, G.H.; Song, G.X.; Jiang, L.L.; Zhang, Y.H.; Zhao, N.Q.; Chen, B.H.; Kan, H.D. Interaction between ambient particles and ozone and its effect on daily mortality. Biomed. Environ. Sci. 2007, 20, 502–505. [Google Scholar] [PubMed]
- Yu, I.T.-S.; Qiu, H.; Wang, X.; Tian, L.; Tse, L.A. Synergy between particles and nitrogen dioxide on emergency hospital admissions for cardiac diseases in Hong Kong. Int. J. Cardiol. 2013, 168, 2831–2836. [Google Scholar] [CrossRef] [PubMed]
- Population Census Office under the State Council of the People’s Republic of China, Department of Population and Employment Statistics National Bureau of the People’s Republic of China. Tabulation on the 2010 Population Census of the People’s Republic of China. Available online: http://www.stats.gov.cn/tjsj/pcsj/rkpc/6rp/indexch.htm (accessed on 23 July 2012).
- Liu, T.; Li, T.T.; Zhang, Y.H.; Xu, Y.J.; Lao, X.Q.; Rutherford, S.; Chu, C.; Luo, Y.; Zhu, Q.; Xu, X.J.; et al. The short-term effect of ambient ozone on mortality is modified by temperature in Guangzhou, China. Atmos. Environ. 2013, 76, 59–67. [Google Scholar] [CrossRef]
- Yu, I.T.S.; Zhang, Y.h.; Tam, W.W.S.; Yan, Q.H.; Xu, Y.J.; Xun, X.J.; Wu, W.; Ma, W.J.; Tian, L.W.; Tse, L.A.; et al. Effect of ambient air pollution on daily mortality rates in Guangzhou, China. Atmos. Environ. 2012, 46, 528–535. [Google Scholar] [CrossRef]
- Guangzhou Municipal Statistics Burea. Guangzhou Statistical Yearbook 2011. Available online: http://data.gzstats.gov.cn/gzStat1/chaxun/njsj.jsp (accessed on 20 April 2012).
- World Health Organization. International Classification of Diseases (ICD). Available online: http://www.who.int/classifications/icd/en/ (accessed on 1 January 1993).
- Hong, Y.; Lee, J.; Kim, H.; Ha, E.; Schwartz, J.; Christiani, D.C. Effects of air pollutants on acute stroke mortality. Environ. Health Perspect. 2002, 110, 187–191. [Google Scholar] [CrossRef] [PubMed]
- R 3.3.1. R Foundation. Viena, Austria. Available online: http://blog.revolutionanalytics.com/2016/06/r-331-now-available.html (accessed on 12 November 2017).
- Ministry of Environmental Protection of the People’s Republic of China. Air Quality Standards (gb 3095-2012). Available online: http://kjs.mep.gov.cn/hjbhbz/bzwb/dqhjbh/dqhjzlbz/201203/t20120302_224165.htm (accessed on 29 February 2012).
- Revich, B.; Shaposhnikov, D. The effects of particulate and ozone pollution on mortality in Moscow, Russia. Air Qual. Atmos. Health 2010, 3, 117–123. [Google Scholar] [CrossRef] [PubMed]
- Wong, T.W.; Lau, T.S.; Yu, T.S.; Neller, A.; Wong, S.L.; Tam, W.; Pang, S.W. Air pollution and hospital admissions for respiratory and cardiovascular diseases in Hong Kong. Occup. Environ. Med. 1999, 56, 679–683. [Google Scholar] [CrossRef] [PubMed]
- Williams, M.L.; Atkinson, R.W.; Anderson, H.R.; Kelly, F.J. Associations between daily mortality in London and combined oxidant capacity, ozone and nitrogen dioxide. Air Qual. Atmos. Health 2014, 7, 407–414. [Google Scholar] [CrossRef] [PubMed]
- Ren, C.; Williams, G.M.; Tong, S. Does particulate matter modify the association between temperature and cardiorespiratory diseases? Environ. Health Perspect. 2006, 114, 1690–1696. [Google Scholar] [CrossRef] [PubMed] [Green Version]
- Roberts, S. Interactions between particulate air pollution and temperature in air pollution mortality time series studies. Environ. Res. 2004, 96, 328–337. [Google Scholar] [CrossRef] [PubMed]
- Boren, H.G. Carbon as a carrier mechanism for irritant gases. Arch. Environ. Health 1964, 8, 119–124. [Google Scholar] [CrossRef] [PubMed]
- Schlesinger, R.B. Interaction of gaseous and particulate pollutants in the respiratory tract: Mechanisms and modulators. Toxicology 1995, 105, 315–325. [Google Scholar] [CrossRef]


| Variables | Mean | SD | Percentiles | ||||
|---|---|---|---|---|---|---|---|
| Min. | P25 | P50 | P75 | Max. | |||
| Daily death counts | |||||||
| Total non-accidental | 32.66 | 7.88 | 11.00 | 27.00 | 32.00 | 37.00 | 81.00 |
| Cardiovascular | 10.92 | 4.24 | 1.00 | 8.00 | 10.00 | 13.00 | 36.00 |
| Cerebrovascular | 3.92 | 2.16 | 0.00 | 2.00 | 4.00 | 5.00 | 13.00 |
| Air pollution concentrations (μg/m3) | |||||||
| PM10 | 71.79 | 40.17 | 8.33 | 43.58 | 63.00 | 91.33 | 307.50 |
| NO2 | 60.31 | 29.63 | 12.96 | 38.40 | 53.87 | 76.17 | 199.40 |
| Meteorological factors | |||||||
| Mean temperature (°C) | 22.89 | 6.19 | 5.40 | 18.60 | 24.40 | 27.80 | 33.50 |
| Relative humidity (%) | 71.14 | 13.04 | 25.00 | 64.00 | 72.00 | 81.00 | 99.00 |
| Variables | PM10 | NO2 | Mean Temperature | Relative Humidity |
|---|---|---|---|---|
| PM10 | 1.00 | 0.75 | −0.16 | −0.16 |
| NO2 | 1.00 | −0.15 | −0.07 | |
| Mean temperature | 1.00 | 0.17 | ||
| Relative humidity | 1.00 |
| Death Causes | ERR% (95% CI) of PM10 | ERR% (95% CI) of NO2 |
|---|---|---|
| Total non-accidental | ||
| Lag 0 | 0.31 (0.05, 0.57) * | 0.67 (0.30, 1.04) * |
| Lag 1 | 0.40 (0.14, 0.66) | 0.84 (0.46, 1.21) * |
| Lag 2 | 0.25 (0.01, 0.50) * | 0.43 (0.07, 0.80) * |
| Lag 3 | −0.03 (−0.28, 0.22) | −0.01 (−0.36, 0.35) |
| Lag 0–1 | 0.47 (0.18, 0.77) * | 0.95 (0.53, 1.37) * |
| Lag 0–2 | 0.52 (0.20, 0.84) * | 0.98 (0.53, 1.44) * |
| Lag 0–3 | 0.43 (0.08, 0.77) * | 0.83 (0.34, 1.32) * |
| Cardiovascular | ||
| Lag 0 | 0.27 (−0.16, 0.70) | 0.67 (0.06, 1.28) * |
| Lag 1 | 0.49 (0.06, 0.92) * | 0.93 (0.31, 1.56) * |
| Lag 2 | 0.54 (0.12, 0.96) * | 0.80 (0.19, 1.41) * |
| Lag 3 | 0.06 (−0.35, 0.47) | 0.06 (−0.53, 0.66) |
| Lag 0–1 | 0.51 (0.02, 1.00) * | 1.01 (0.32, 1.70) * |
| Lag 0–2 | 0.70 (0.17, 1.24) * | 1.21 (0.46, 1.97) * |
| Lag 0–3 | 0.64 (0.06, 1.21) * | 1.07 (0.27, 1.88) * |
| Cerebrovascular | ||
| Lag 0 | 0.24 (−0.42, 0.91) | 0.47 (−0.45, 1.40) |
| Lag 1 | 0.56 (−0.09, 1.22) | 0.94 (−0.01, 1.89) |
| Lag 2 | 1.14 (0.50, 1.77) * | 1.21 (0.29, 2.15) * |
| Lag 3 | 0.08 (−0.54, 0.71) | 0.02 (−0.88, 0.93) |
| Lag 0–1 | 0.54 (−0.20, 1.29) | 0.89 (−0.14, 1.93) |
| Lag 0–2 | 1.02 (0.22, 1.83) * | 1.28 (0.16, 2.41) * |
| Lag 0–3 | 0.89 (0.04, 1.75) * | 1.08 (−0.12, 2.28) |
| NO2 Level | Number of Days | ERR% (95% CI) of Lag 0−2 Days PM10 | ||
|---|---|---|---|---|
| Total Non-Accidental Death | Cardiovascular Death | Cerebrovascular Death | ||
| Low | 455 | −0.16 (−0.90, 0.58) | −0.32 (−1.56, 0.94) | 0.67 (−1.26, 2.63) |
| Medium | 911 | 0.02 (−0.43, 0.47) | 0.16 (−0.60, 0.92) | 0.75 (−0.40, 1.92) |
| High | 457 | 0.46 (0.13, 0.79) * | 0.61 (0.06, 1.16) * | 0.99 (0.17, 1.83) * |
| PM10 Level | Number of Days | ERR% (95% CI) of Lag 0–2 Days NO2 | ||
|---|---|---|---|---|
| Total Non-Accidental Death | Cardiovascular Death | Cerebrovascular Death | ||
| Low | 456 | 0.70 (−0.33, 1.74) | 1.20 (−0.52, 2.96) | 0.13 (−2.47, 2.80) |
| Medium | 910 | 0.87 (0.18, 1.57) * | 0.98 (−0.17, 2.15) | 0.38 (−1.34, 2.13) |
| High | 457 | 0.92 (0.42, 1.42) * | 1.20 (0.38, 2.03) * | 1.04 (−0.18, 2.28) |
© 2017 by the authors. Licensee MDPI, Basel, Switzerland. This article is an open access article distributed under the terms and conditions of the Creative Commons Attribution (CC BY) license (http://creativecommons.org/licenses/by/4.0/).
Share and Cite
Gu, Y.; Lin, H.; Liu, T.; Xiao, J.; Zeng, W.; Li, Z.; Lv, X.; Ma, W. The Interaction between Ambient PM10 and NO2 on Mortality in Guangzhou, China. Int. J. Environ. Res. Public Health 2017, 14, 1381. https://doi.org/10.3390/ijerph14111381
Gu Y, Lin H, Liu T, Xiao J, Zeng W, Li Z, Lv X, Ma W. The Interaction between Ambient PM10 and NO2 on Mortality in Guangzhou, China. International Journal of Environmental Research and Public Health. 2017; 14(11):1381. https://doi.org/10.3390/ijerph14111381
Chicago/Turabian StyleGu, Yuzhou, Hualiang Lin, Tao Liu, Jianpeng Xiao, Weilin Zeng, Zhihao Li, Xiaojuan Lv, and Wenjun Ma. 2017. "The Interaction between Ambient PM10 and NO2 on Mortality in Guangzhou, China" International Journal of Environmental Research and Public Health 14, no. 11: 1381. https://doi.org/10.3390/ijerph14111381