The Association between Environmental Lead Exposure and High School Educational Outcomes in Four Communities in New South Wales, Australia


Abstract
:1. Introduction
2. Materials and Methods
2.1. Study Design
2.2. Measures
2.2.1. Educational Outcomes
2.2.2. Soil Lead Levels
2.2.3. Classification of the Highest Lead Risk Areas
2.2.4. Classification of “Leaded” and “Comparison” Schools
2.2.5. Statistical Analysis
2.2.6. Ethics Approval
3. Results
4. Discussion
5. Conclusions
Supplementary Materials
Acknowledgments
Author Contributions
Conflicts of Interest
References
- Chiaradia, M.; Gulson, B.L.; James, M.; Jameson, C.W.; Johnson, D. Identification of secondary lead sources in the air of an urban environment. Atmos. Environ. 1997, 31, 3511–3521. [Google Scholar] [CrossRef]
- Tong, S.; von Schirnding, Y.E.; Prapamontol, T. Environmental lead exposure: A public health problem of global dimensions. Bull. World Health Org. 2000, 78, 1068–1077. [Google Scholar] [PubMed]
- Bellinger, D.C. Very low lead exposures and children’s neurodevelopment. Curr. Opin. Pediatr. 2008, 20, 172–177. [Google Scholar] [CrossRef] [PubMed]
- Lanphear, B.P.; Dietrich, K.; Auinger, P.; Cox, C. Cognitive deficits associated with blood lead concentrations <10 microg/dL in US children and adolescents. Public Health Rep. 2000, 115, 521–529. [Google Scholar] [PubMed]
- Lanphear, B.P.; Hornung, R.; Khoury, J.; Yolton, K.; Baghurst, P.; Bellinger, D.C.; Canfield, R.L.; Dietrich, K.N.; Bornschein, R.; Greene, T.; et al. Low-level environmental lead exposure and children’s intellectual function: An international pooled analysis. Environ. Health Perspect. 2005, 113, 894–899. [Google Scholar] [CrossRef] [PubMed] [Green Version]
- Jusko, T.A.; Henderson, C.R.; Lanphear, B.P.; Cory-Slechta, D.A.; Parsons, P.J.; Canfield, R.L. Blood lead concentrations < 10 microgg/dL and child intelligence at 6 years of age. Environ. Health Perspect. 2007, 116, 243–248. [Google Scholar]
- Miranda, M.L.; Kim, D.; Galeano, M.A.O.; Paul, C.J.; Hull, A.P.; Morgan, S.P. The relationship between early childhood blood lead levels and performance on end-of-grade tests. Environ. Health Perspect. 2007, 115, 1242–1247. [Google Scholar] [CrossRef] [PubMed]
- Amato, M.S.; Moore, C.F.; Magzamen, S.; Imm, P.; Havlena, J.A.; Anderson, H.A.; Kanarek, M.S. Lead exposure and educational proficiency: Moderate lead exposure and educational proficiency on end-of-grade examinations. Ann. Epidemiol. 2012, 22, 738–743. [Google Scholar] [CrossRef] [PubMed]
- Zhang, N.; Baker, H.W.; Tufts, M.; Raymond, R.E.; Salihu, H.; Elliott, M.R. Early childhood lead exposure and academic achievement: Evidence from Detroit public schools, 2008–2010. Am. J. Public Health 2013, 103, e72–e77. [Google Scholar] [CrossRef] [PubMed]
- Chen, A.; Dietrich, K.N.; Ware, J.H.; Radcliffe, J.; Rogan, W.J. IQ and blood lead from 2 to 7 years of age: Are the effects in older children the residual of high blood lead concentrations in 2-year-olds? Environ. Health Perspect. 2005, 113, 597–601. [Google Scholar] [CrossRef] [PubMed] [Green Version]
- United States Environmental Protection Agency. Final Report: Integrated Science Assessment for Lead. EPA/600/R-10/075F; U.S. Environmental Protection Agency: Washington, DC, USA, 2013. Available online: https://www.epa.gov/isa/integrated-science-assessment-isa-lead (accessed on 30 March 2017).
- Department of the Environment and Energy. Fuel Quality Standards. 2012. Available online: https://www.environment.gov.au/node/13512 (accessed on 9 February 2017).
- Department of the Environment and Energy. Lead Alert Facts: Lead in House Paint. 2013. Available online: http://www.environment.gov.au/protection/chemicals-management/lead/lead-in-house-paint (accessed on 9 February 2017).
- Attorney-General’s Department. National Environment Protection (Ambient Air Quality) Measure. 2016. Available online: https://www.legislation.gov.au/Details/F2016C00215 (accessed on 13 November 2015).
- National Health and Medical Research Council. NHMRC Information Paper: Evidence on the Effects of Lead on Human Health; National Health and Medical Research Council: Canberra, Australia, 2015.
- Attorney-General’s Department. National Environment Protection (Assessment of Site Contamination) Measure 1999. 2013. Available online: https://www.legislation.gov.au/Details/F2013C00288 (accessed on 13 November 2015).
- Filippelli, G.M.; Laidlaw, M.A.S. The elephant in the playground: Confronting lead-contaminated soils as an important source of lead burdens to urban populations. Perspect. Boil. Med. 2010, 53, 31–45. [Google Scholar] [CrossRef] [PubMed]
- Lanphear, B.P.; Dietrich, K.N.; Berger, O. Prevention of Lead Toxicity in US Children. Ambul. Pediatr. 2003, 3, 27–36. [Google Scholar] [CrossRef]
- Mielke, H.W.; Dugas, D.; Mielke, P.W.; Smith, K.S.; Gonzales, C.R. Associations between soil lead and childhood blood lead in urban New Orleans and rural Lafourche Parish of Louisiana. Environ. Health Perspect. 1997, 105, 950–954. [Google Scholar] [CrossRef] [PubMed]
- Johnson, D.L.; Bretsch, J.K. Soil lead and children’s blood lead levels in Syracuse, NY, USA. Environ. Geochem. Health 2002, 24, 375–385. [Google Scholar] [CrossRef]
- Zahran, S.; Mielke, H.W.; Weiler, S.; Gonzales, C.R. Nonlinear associations between blood lead in children, age of child, and quantity of soil lead in metropolitan New Orleans. Sci. Total Environ. 2011, 409, 1211–1218. [Google Scholar] [CrossRef] [PubMed]
- Baghurst, P.A.; McMichael, A.J.; Wigg, N.R.; Vimpani, G.V.; Robertson, E.F.; Roberts, R.J.; Tong, S.L. Environmental exposure to lead and children’s intelligence at the age of seven years. N. Engl. J. Med. 1992, 327, 1279–1284. [Google Scholar] [CrossRef] [PubMed]
- Dong, C.; Taylor, M.P.; Kristensen, L.J.; Zahran, S. Environmental contamination in an Australian mining community and potential influences on early childhood health and behavioural outcomes. Environ. Pollut. 2015, 207, 345–356. [Google Scholar] [CrossRef] [PubMed]
- Needleman, H.L.; Schell, A.; Bellinger, D.; Leviton, A.; Allred, E.N. The long-term effects of exposure to low doses of lead in childhood. N. Engl. J. Med. 1990, 322, 83–88. [Google Scholar] [CrossRef] [PubMed]
- Fergusson, D.M.; Horwood, L.J.; Lynskey, M.T. Early dentine lead levels and educational outcomes at 18 years. J. Child Psychol. Psychiatry 1997, 38, 471–478. [Google Scholar] [CrossRef] [PubMed]
- Reuben, A.; Caspi, A.; Belsky, D.W.; Broadbent, J.; Harrington, H.; Sugden, K.; Houts, R.M.; Ramrakha, S.; Poulton, R.; Moffitt, T.E. Association of childhood blood lead levels with cognitive function and socioeconomic status at age 38 years and with IQ change and socioeconomic mobility between childhood and adulthood. JAMA 2017, 317, 1244–1251. [Google Scholar] [CrossRef] [PubMed]
- NSW Department of Education. NSW School Certificate to be Abolished—NSW Department of Education. 2011. Available online: http://www.dec.nsw.gov.au/about-us/news-at-det/news/nsw-school-certificate-to-be-abolished (accessed on 19 October 2017).
- Board of Studies Teaching and Educational Standards NSW. Board of Studies Teaching and Educational Standards NSW. 2012. Available online: http://www.boardofstudies.nsw.edu.au (accessed on 17 August 2015).
- Lamb, S.; Queensland Department of Education and the Arts and National Fund for Educational Research (Australia). Staying on at School: Improving Student Retention in Australia; Queensland Department of Education and the Arts: Brisbane, Australia, 2004.
- Universities Admissions Centre Information Services. UAC Australian Tertiary Admission Rank (ATAR). 2016. Available online: http://www.uac.edu.au/atar/ (accessed on 17 August 2015).
- Laidlaw, M.A.; Taylor, M.P. Potential for childhood lead poisoning in the inner cities of Australia due to exposure to lead in soil dust. Environ. Pollut. 2011, 159, 1–9. [Google Scholar] [CrossRef] [PubMed]
- Gulson, B.; Howarthl, D.; Mizon, K.; Law, A.; Korsch, M.; Davis, J. Source of lead in humans from Broken Hill mining community. Environ. Geochem. Health 1994, 16, 19–25. [Google Scholar] [CrossRef] [PubMed]
- Gulson, B.L.; Mizon, K.J.; Davis, J.D.; Palmer, J.M.; Vimpani, G. Identification of sources of lead in children in a primary zinc-lead smelter environment. Environ. Health Perspect. 2004, 112, 52–60. [Google Scholar] [CrossRef] [PubMed]
- Boreland, F.; Lyle, D.; Wlodarczyk, J.; Balding, W.; Reddan, S. Lead dust in Broken Hill homes a potential hazard for young children? Aust. N. Z. J. Public Health 2002, 26, 203–207. [Google Scholar] [CrossRef] [PubMed]
- Boreland, F.; Lesjak, M.S.; Lyle, D.M. Managing environmental lead in Broken Hill: A public health success. NSW Public Health Bull. 2008, 19, 174–179. [Google Scholar] [CrossRef]
- Galvin, J.; Stephenson, J.; Wlodarczyk, J.; Loughran, R.; Waller, G. Living near a lead smelter: An environmental health risk assessment in Boolaroo and Argenton, New South Wales. Aust. J. Public Health 1993, 17, 373–378. [Google Scholar] [CrossRef] [PubMed]
- Kim, K.; Owens, G.; Naidu, R. Heavy metal distribution, bioaccessibility, and phytoavailability in long-term contaminated soils from Lake Macquarie, Australia. Aust. J. Soil Res. 2009, 47, 166–176. [Google Scholar] [CrossRef]
- Harvey, P.J.; Taylor, M.P.; Kristensen, L.J.; Grant-Vest, S.; Rouillon, M.; Wu, L.; Handley, H.K. Evaluation and assessment of the efficacy of an abatement strategy in a former lead smelter community, Boolaroo, Australia. Environ. Geochem. Health 2016, 38, 941–954. [Google Scholar] [CrossRef] [PubMed]
- Martley, E.; Gulson, B.; Pfeifer, H.R. Metal concentrations in soils around the copper smelter and surrounding industrial complex of Port Kembla, NSW, Australia. Sci. Total Environ. 2004, 325, 113–127. [Google Scholar] [CrossRef] [PubMed]
- Jafari, Y. Trace Metal Contamination of Soils and Sediments in the Port Kembla Area, New South Wales, Australia. Master’s Thesis, Faculty of Science, School of Earth & Environmental Sciences, University of Wollongong, Wollongong, NSW, Australia, 2009. [Google Scholar]
- Olszowy, H.; Torr, P.; Imray, P. Trace Element Concentrations in Soils from Rural and Urban Areas of Australia; Contaminated Sites Series No. 4. Department of Human Services and Health, Environmental Protection Agency, South Australian Health Commission: Adelaide, Australia, 1995.
- Rouillon, M.; Harvey, P.J.; Kristensen, L.J.; George, S.G.; Taylor, M.P. VegeSafe: A community science program measuring soil-metal contamination, evaluating risk and providing advice for safe gardening. Environ. Pollut. 2017, 222, 557–566. [Google Scholar] [CrossRef] [PubMed]
- Lake Macquarie City Council. Contaminated land in Lake Macquarie City. 2016. Available online: https://www.lakemac.com.au/environment/natural/contaminated-land (accessed on 15 June 2016).
- NSW Department of Education and Communities. Going to a Public School-Enrolment. 2016. Available online: http://www.schools.nsw.edu.au/gotoschool/enrolment/index.php (accessed on 16 June 2016).
- Australian Curriculum Assessment and Reporting Authority (ACARA). Guide to Understanding Index of Community Socio-Educational Advantage (ICSEA). 2016. Available online: http://www.acara.edu.au/docs/default-source/resources/guide-to-understanding-icsea.pdf (accessed on 19 October 2017).
- Bates, D.; Mächler, M.; Bolker, B.; Walker, S. Fitting linear mixed-effects models using lme4. J. Stat. Softw. 2015, 67, 1–48. [Google Scholar] [CrossRef]
- Rau, T.; Reyes, L.; Urzua, S. Early Lead Exposure and Its Effects on Academic Achievement and Earnings: Evidence: From an Environmental Negligence; P. Universidad Catolica de Chile: Santiago, Chile; Ministry of Finance of Chile: Santiago, Chile; University of Maryland: College Park, MD, USA, 2012. [Google Scholar]
- Freudenberg, N.; Ruglis, J. Reframing school dropout as a public health issue. Prev. Chronic Dis. 2007, 4, A107. [Google Scholar] [PubMed]
- Lansford, J.E.; Dodge, K.A.; Pettit, G.S.; Bates, J.E. A public health perspective on school dropout and adult outcomes: A prospective study of risk and protective factors from age 5 to 27 years. J. Adolesc. Health 2016, 58, 652–658. [Google Scholar] [CrossRef] [PubMed]
- Council on Environmental Health. Prevention of Childhood Lead Toxicity. Pediatrics 2016. [Google Scholar] [CrossRef]


| Region | Summary of Published Soil Lead Levels | Source | Lead Exposed Area | Highest Lead Risk Areas |
|---|---|---|---|---|
| Broken Hill | Mean soil lead measured in 1992 in the highest lead risk zone 2305 mg/kg | Boreland, 2002 [34] | Urban centre | Two highest of the five lead risk zones |
| Mean soil lead in highest lead risk zone 1967 mg/kg | Boreland, 2008 [35] | |||
| Highest mean soil lead in school catchment area 2865 mg/kg | Dong, 2015 [23] | |||
| North Lake Macquarie | 70% of samples in 3 closest suburbs above 300 mg/kg | Galvin, 1993 [36] | Up to 2 km from former smelter 4 km radius from former smelter | Suburbs of Boolaroo, Argenton and Speers Point |
| 66 percent of soils within 4 km of former stack had soil lead level above 300 mg/kg | Kim, 2009 [37] | |||
| Post-abatement, in 3 closest suburbs all residential sites except one above 300 mg/kg | Harvey, 2016 [38] | Up to 2 km from former smelter | ||
| Illawarra | highest within 1 km, significant to 4 km significant decrease after 9 km | Martley, 1999 [39] | Suburbs within 9 km of former stack | Suburbs within 4 km of former stack: Port Kembla, Warrawong, Lake Heights, Primbee |
| <1 km from site average soil lead 600 mg/kg, beyond 1 km average soil lead 506 mg/kg. Highest levels within 4 km | Jafari, 2009 [40] | |||
| Marrickville | 40% of samples in old areas near busy roads in Sydney exceed 300 mg/kg | Olzowy, 1995 [41] | old areas near busy roads | a |
| Mean soil lead in Marrickville Local Government Area (LGA) of 689 mg/kg | Rouillon, 2017 [42] | Marrickville and some surrounding LGAs |
| Region, School | Number of Enrolled Year 12 Students 2008–2014 a | Number of Students Who Obtained a HSC English Result 2008–2014 b | ||
|---|---|---|---|---|
| Mean (Range) | Percentage from HLRAs Mean (Range) | Mean (Range) | Percentage from HLRAs (Estimate) c | |
| Broken Hill | 185 (161–210) | |||
| Broken Hill High School | 75 (66–89) | n/a e | 61 (40–81) | 21.58% |
| Willyama High School | d | n/a e | 48 (26–71) | 21.58% |
| Illawarra | 1147 (1091–1204) | |||
| Warrawong High School | 44 (32–48) | 35.98% (27.1–44.7%) | 26 (14–39) | 24.47% |
| Illawarra Sports High School | 118 (89–136) | 5.47% (4–12%) | 102 (67–131) | 24.47% |
| North Lake Macquarie | 788 (731–844) | |||
| Lake Macquarie High School | 50 (36–59) | 14.5% (7.3–22.2%) | 36 (25–48) | 11.2% |
| Glendale Technology High School | 85 (76–94) | 5.69% (1.2–7.1%) | 63 (45–80) | 11.2% |
| Marrickville | 1167 (1029–1286) | |||
| Marrickville High School | 42 (33–47) | n/a f | 27 (13–34) | n/a f |
| Educational Outcome | School Type | Mean | Lower 95% Confidence Limits | Upper 95% Confidence Limits | p Value |
|---|---|---|---|---|---|
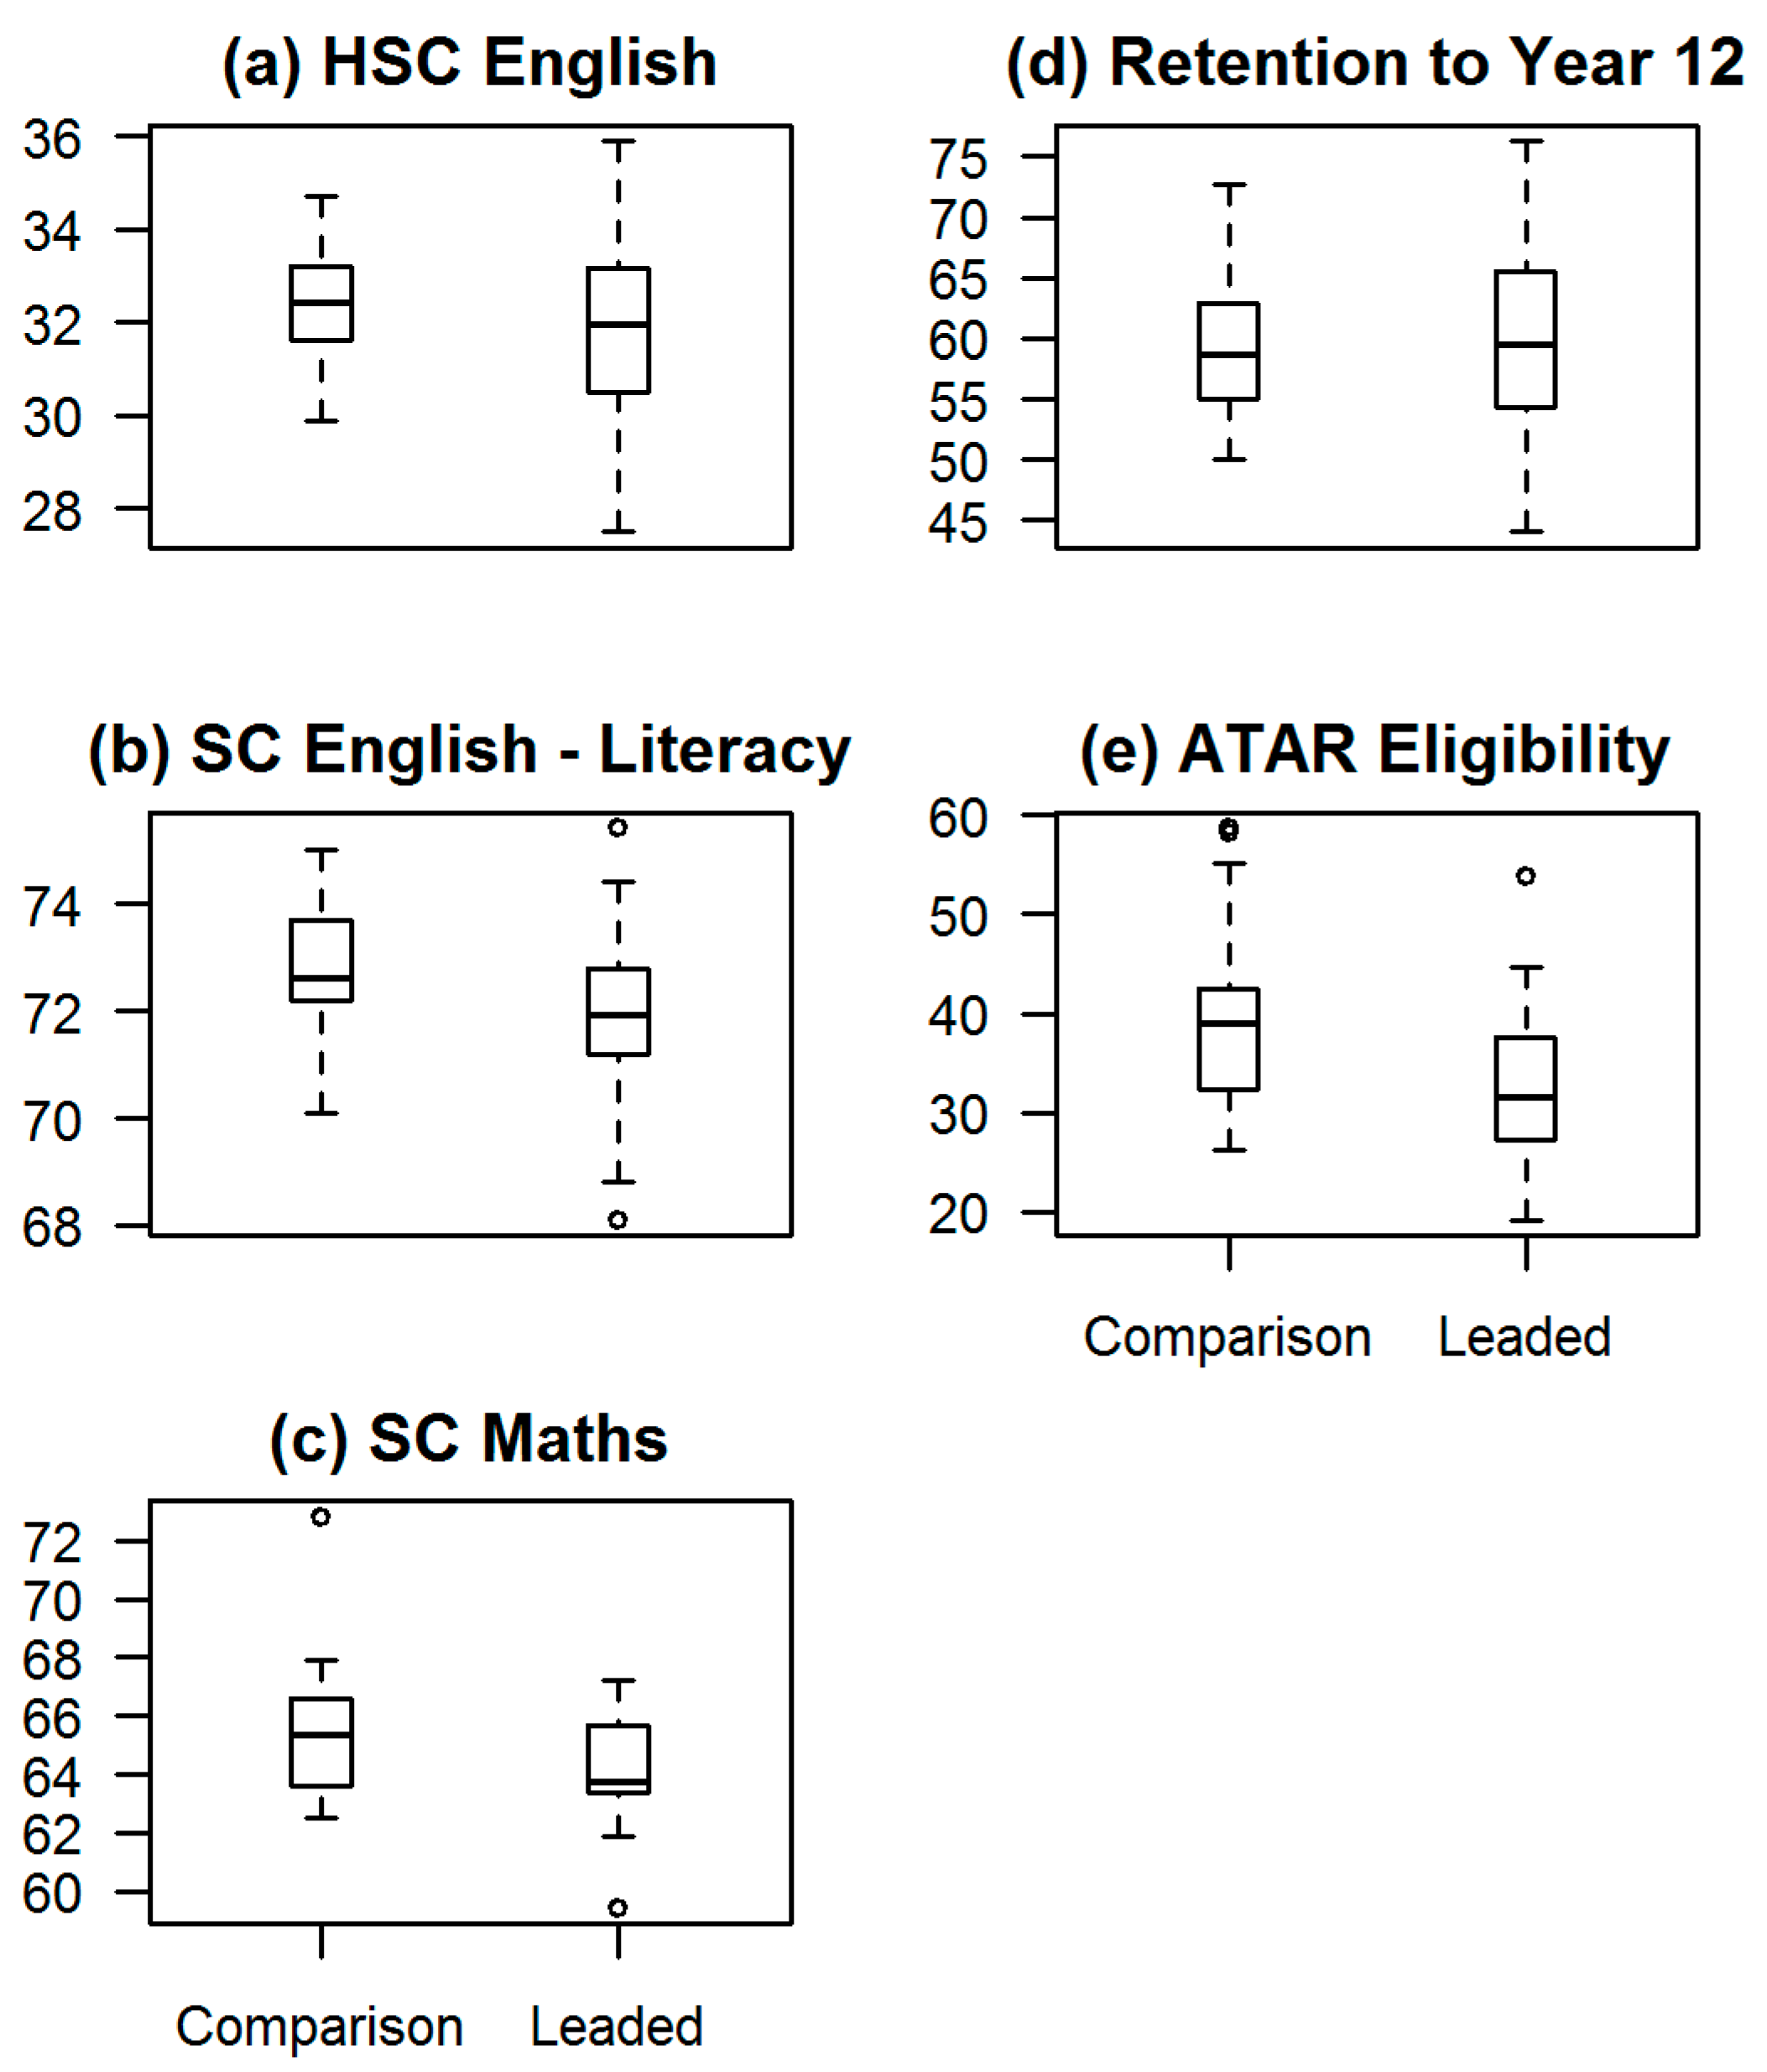
| HSC English | Leaded | 31.57 (0.272) | 30.99 | 32.14 | 0.002 |
| Comparison | 32.45 (0.167) | 32.12 | 32.78 | ||
| SC Literacy—English | Leaded | 72.21 (0.305) | 71.52 | 72.90 | 0.077 |
| Comparison | 72.77 (0.220) | 72.33 | 73.21 | ||
| SC Mathematics | Leaded | 64.46 (0.415) | 63.40 | 66.21 | 0.028 |
| Comparison | 65.43 (0.389) | 64.65 | 65.53 | ||
| Rate of retention to Year 12 | Leaded | 59.68 (1.711) | 56.30 | 63.07 | 0.826 |
| Comparison | 59.38 (0.758) | 57.98 | 60.79 | ||
| ATAR eligibility rate | Leaded | 32.65 (1.785) | 28.87 | 36.43 | 0.001 |
| Comparison | 38.95 (1.082) | 36.80 | 41.11 |
© 2017 by the authors. Licensee MDPI, Basel, Switzerland. This article is an open access article distributed under the terms and conditions of the Creative Commons Attribution (CC BY) license (http://creativecommons.org/licenses/by/4.0/).
Share and Cite
McCrindle, J.; Green, D.; Sullivan, M. The Association between Environmental Lead Exposure and High School Educational Outcomes in Four Communities in New South Wales, Australia. Int. J. Environ. Res. Public Health 2017, 14, 1395. https://doi.org/10.3390/ijerph14111395
McCrindle J, Green D, Sullivan M. The Association between Environmental Lead Exposure and High School Educational Outcomes in Four Communities in New South Wales, Australia. International Journal of Environmental Research and Public Health. 2017; 14(11):1395. https://doi.org/10.3390/ijerph14111395
Chicago/Turabian StyleMcCrindle, Jennifer, Donna Green, and Marianne Sullivan. 2017. "The Association between Environmental Lead Exposure and High School Educational Outcomes in Four Communities in New South Wales, Australia" International Journal of Environmental Research and Public Health 14, no. 11: 1395. https://doi.org/10.3390/ijerph14111395