Characterization and Computation of Yb/TiO2 and Its Photocatalytic Degradation with Benzohydroxamic Acid


Abstract
:1. Introduction
2. Materials and Methods
2.1. Materials
2.2. Synthesis of Yb/TiO2
2.3. Characterization
2.4. Photocatalytic Degradation Tests
2.5. Photocatalytic Degradation Tests
3. Results and Discussion
3.1. Characterization
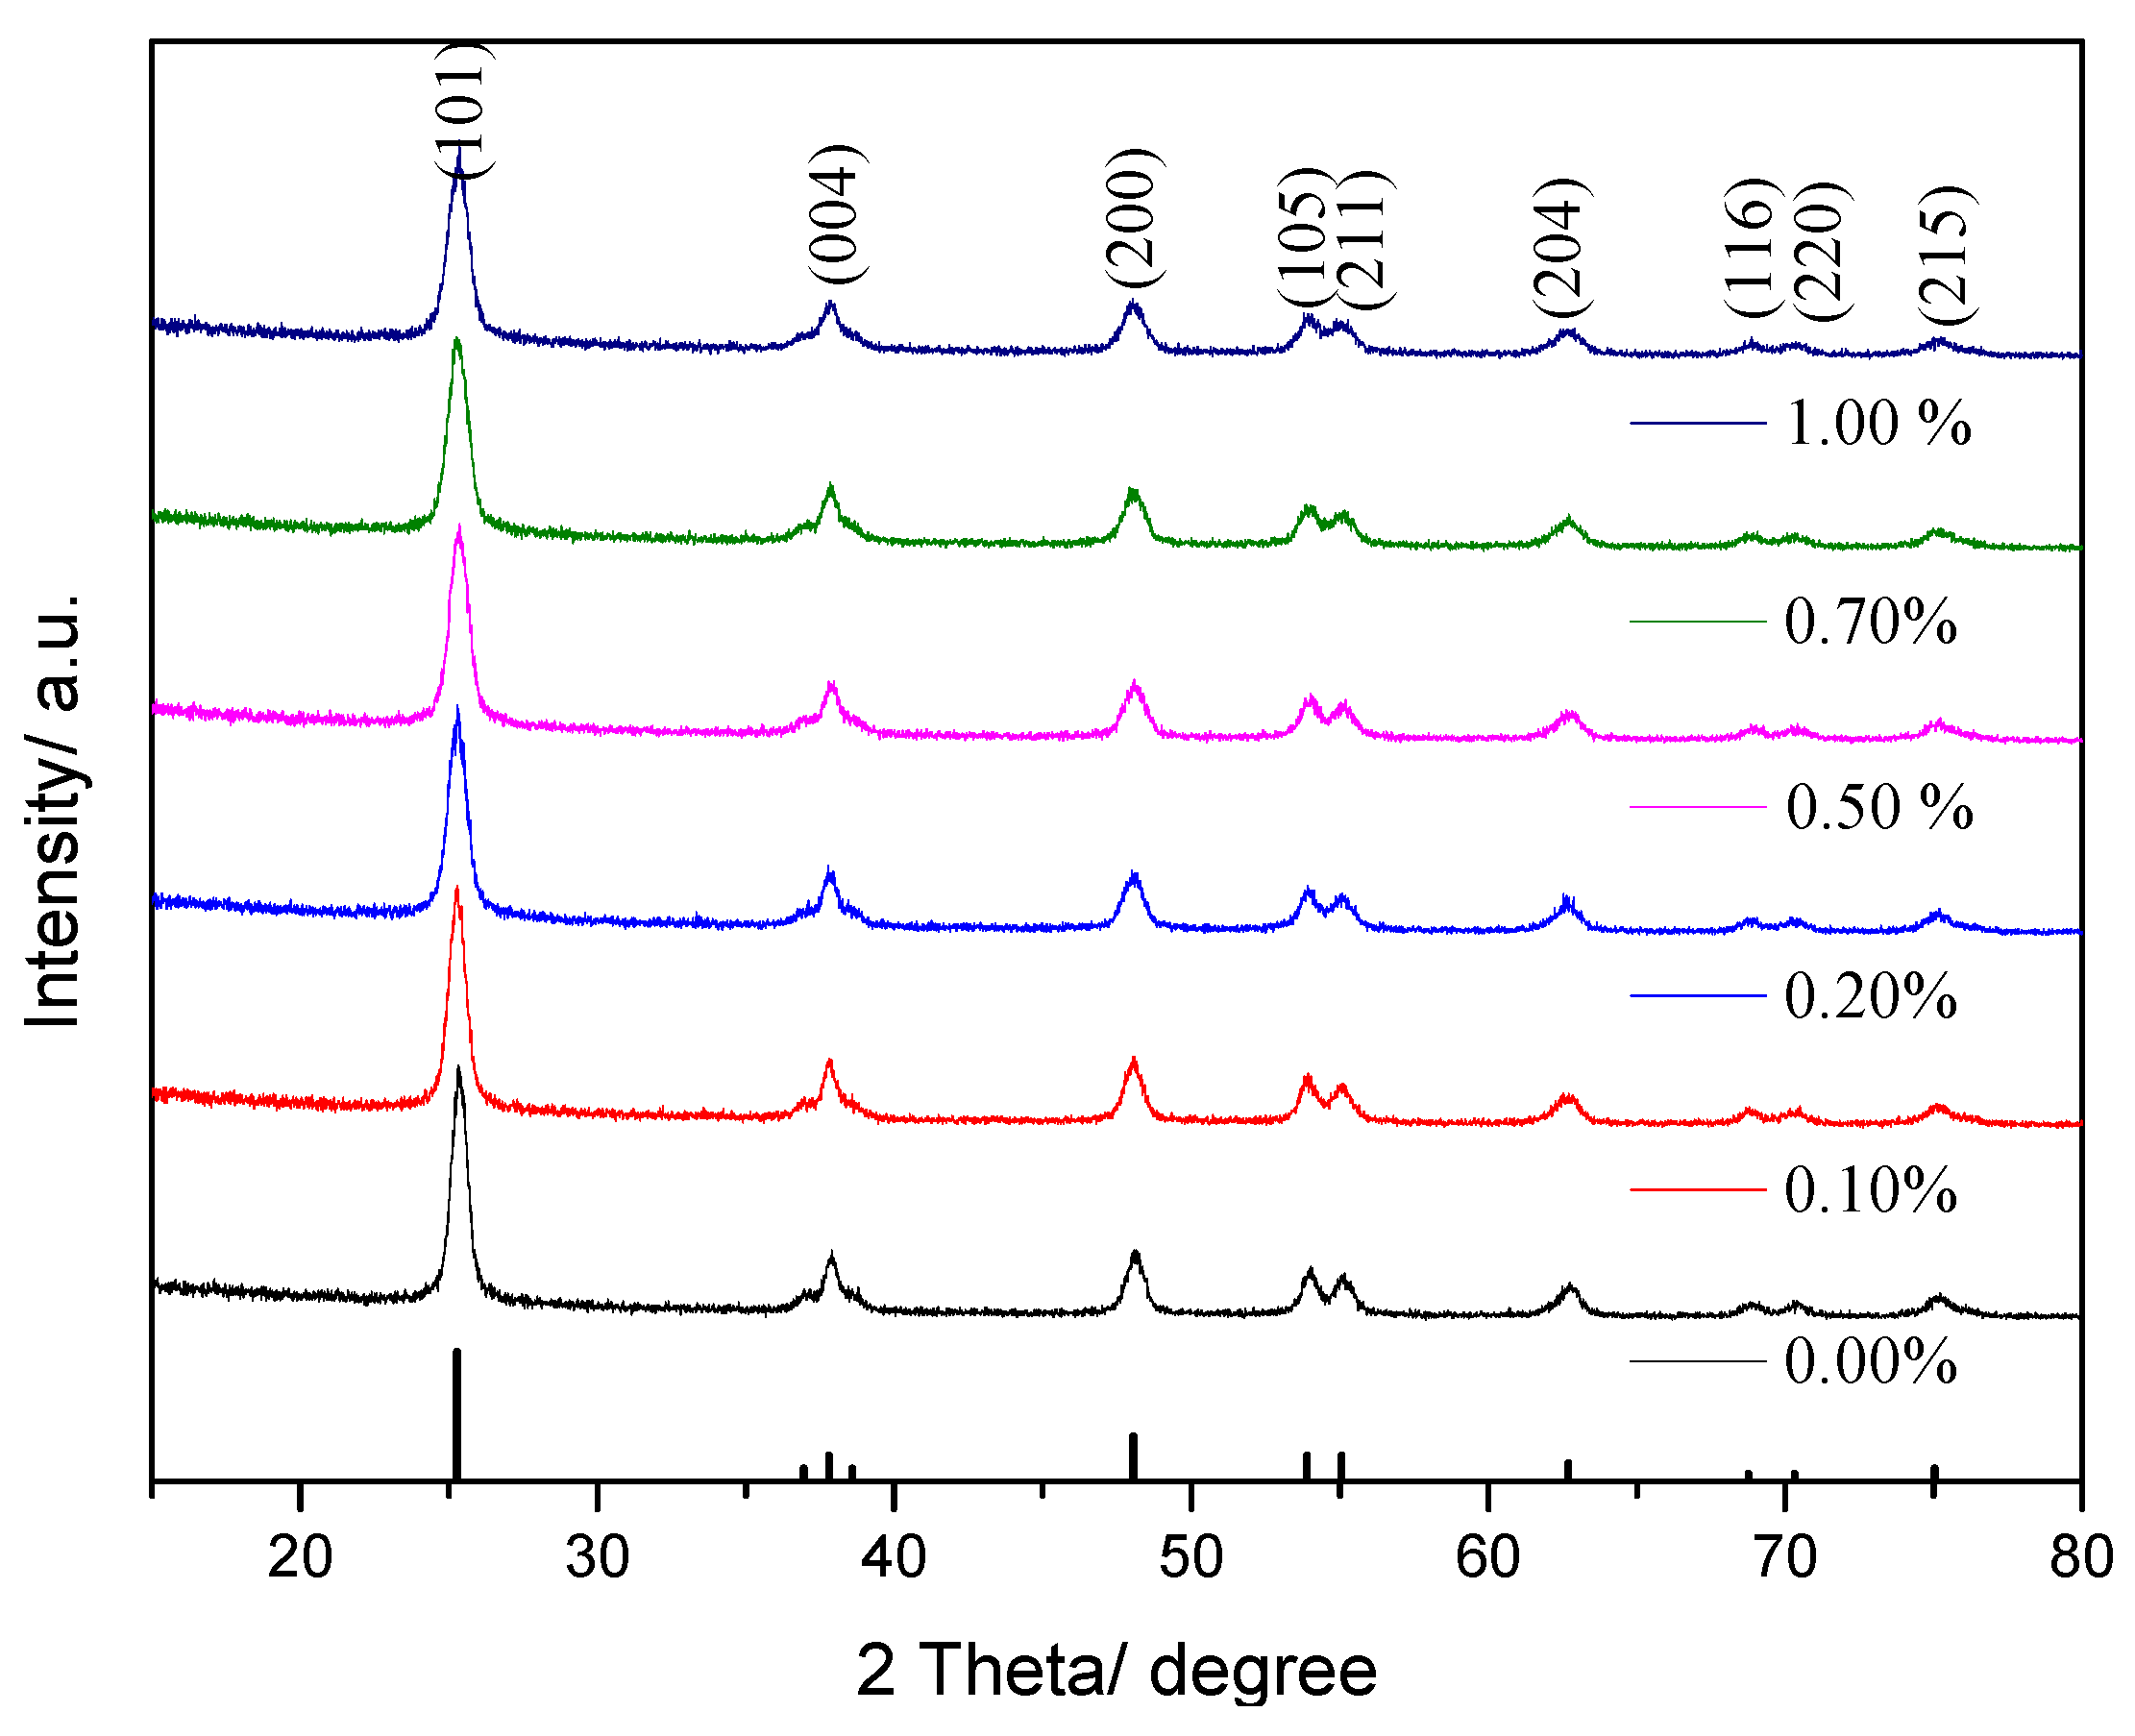
3.1.1. XRD
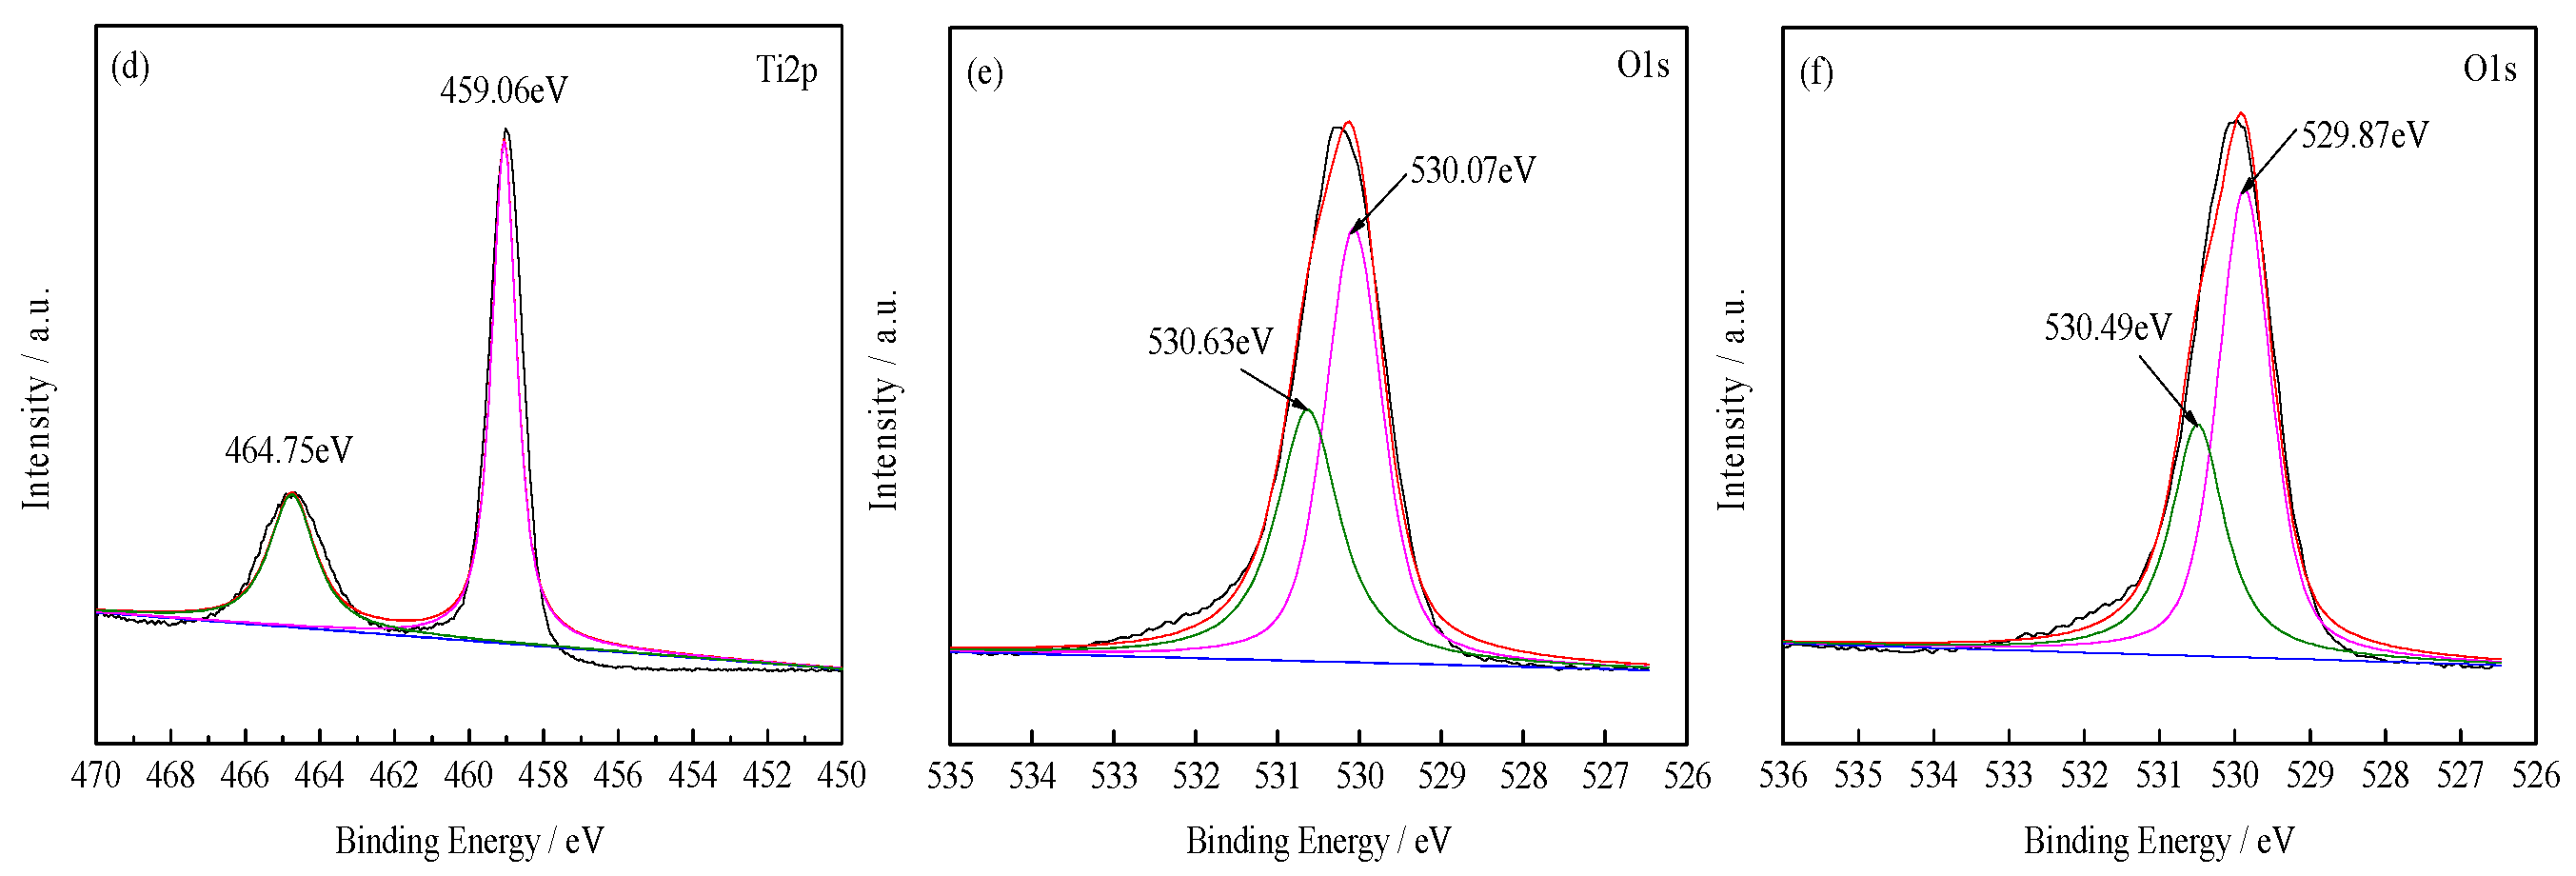
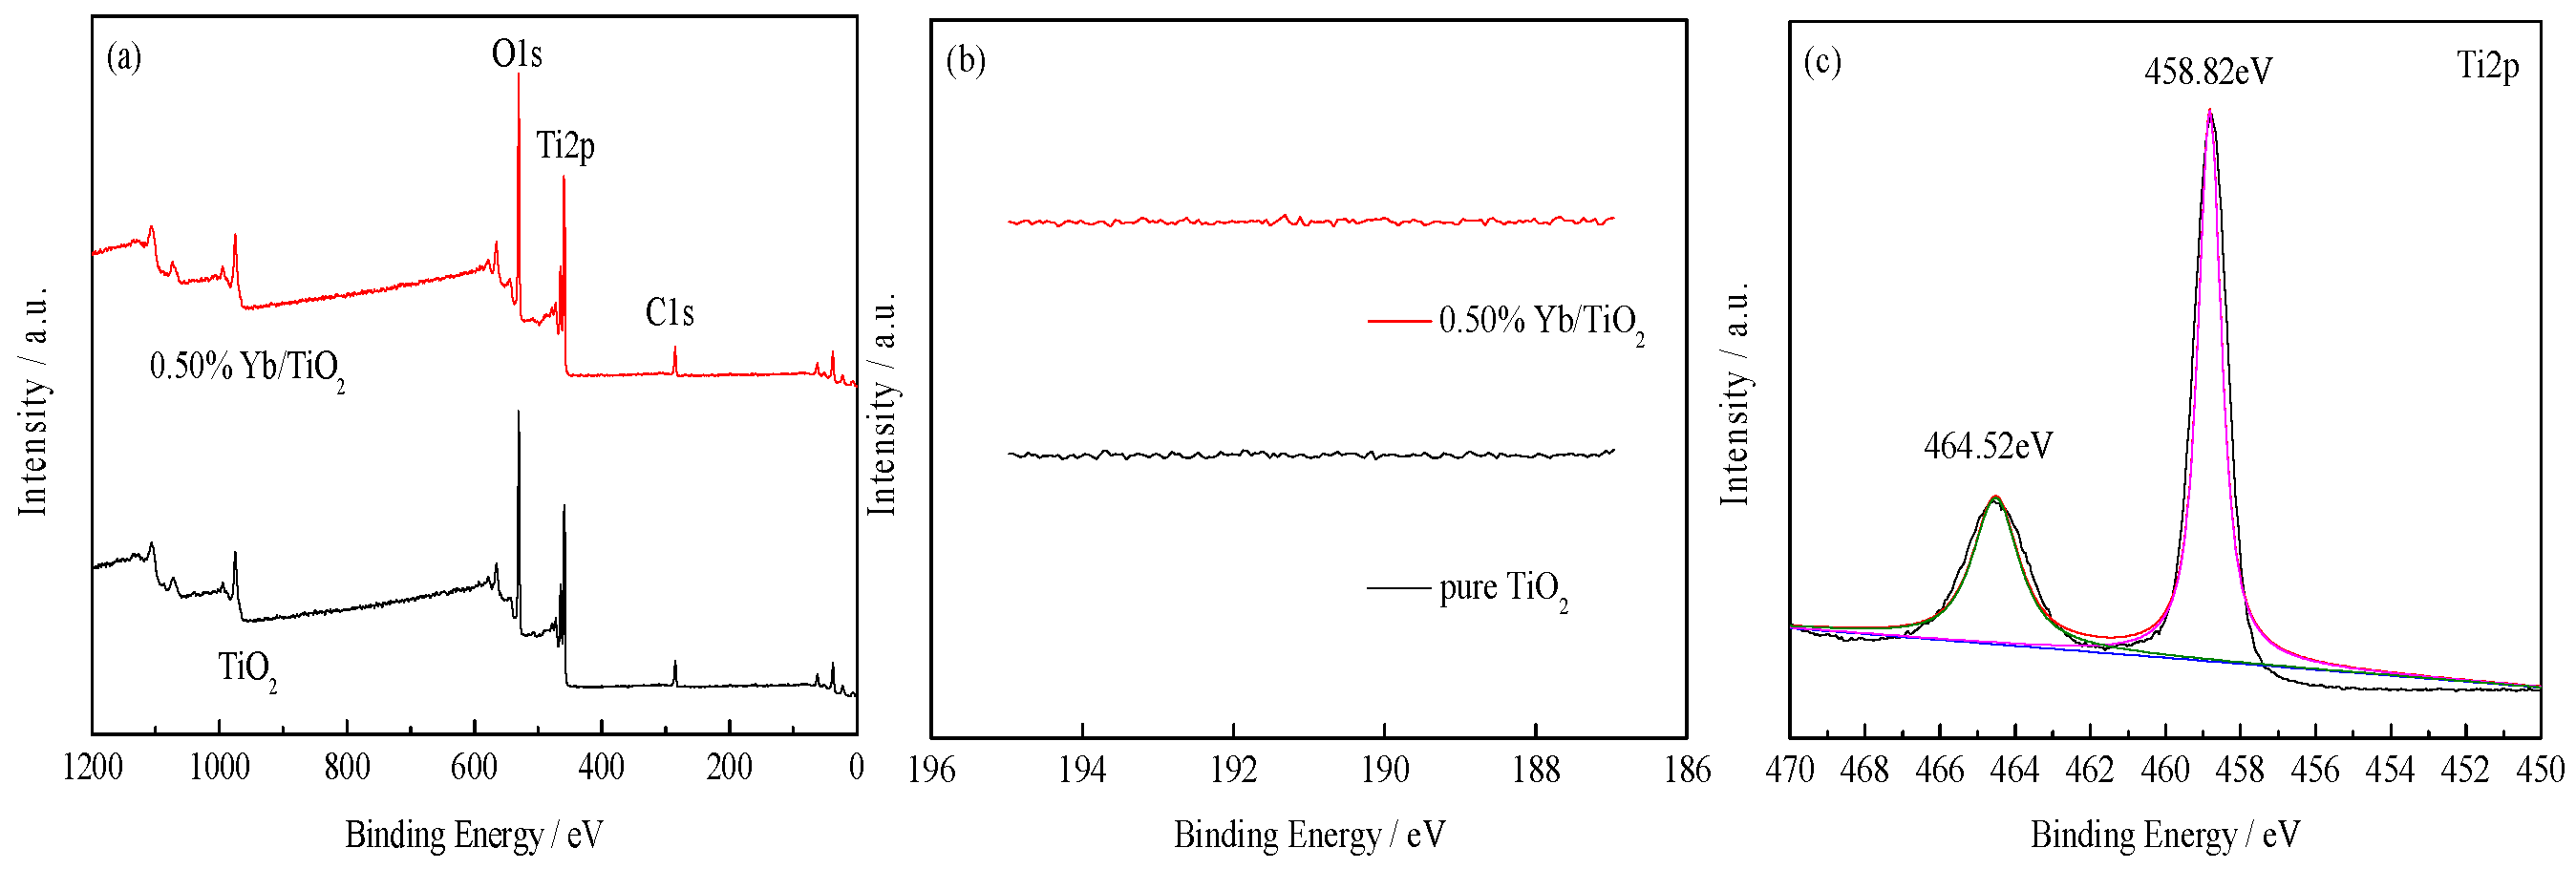
3.1.2. XPS
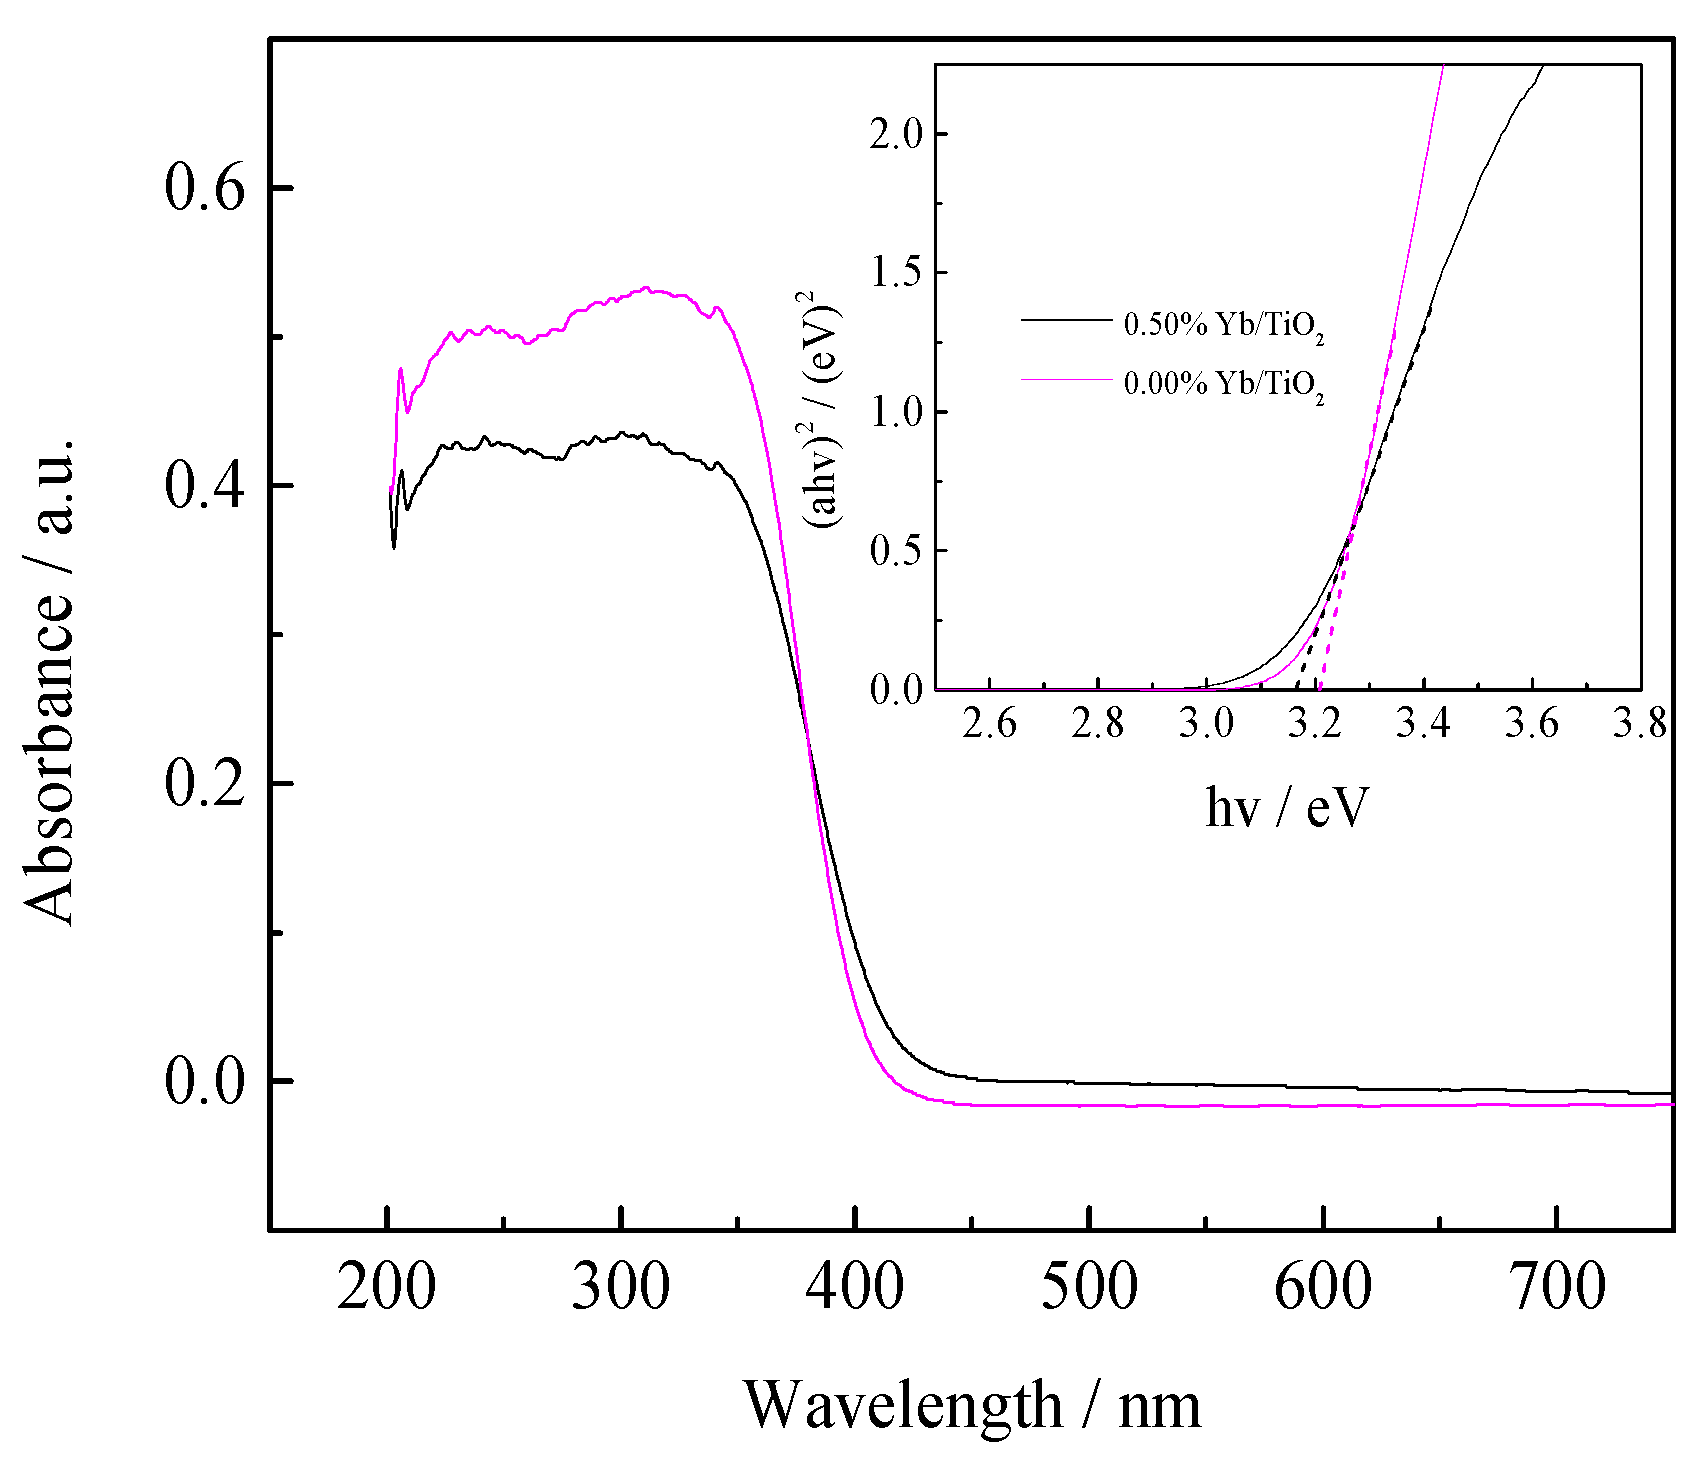
3.1.3. UV-Vis DRS
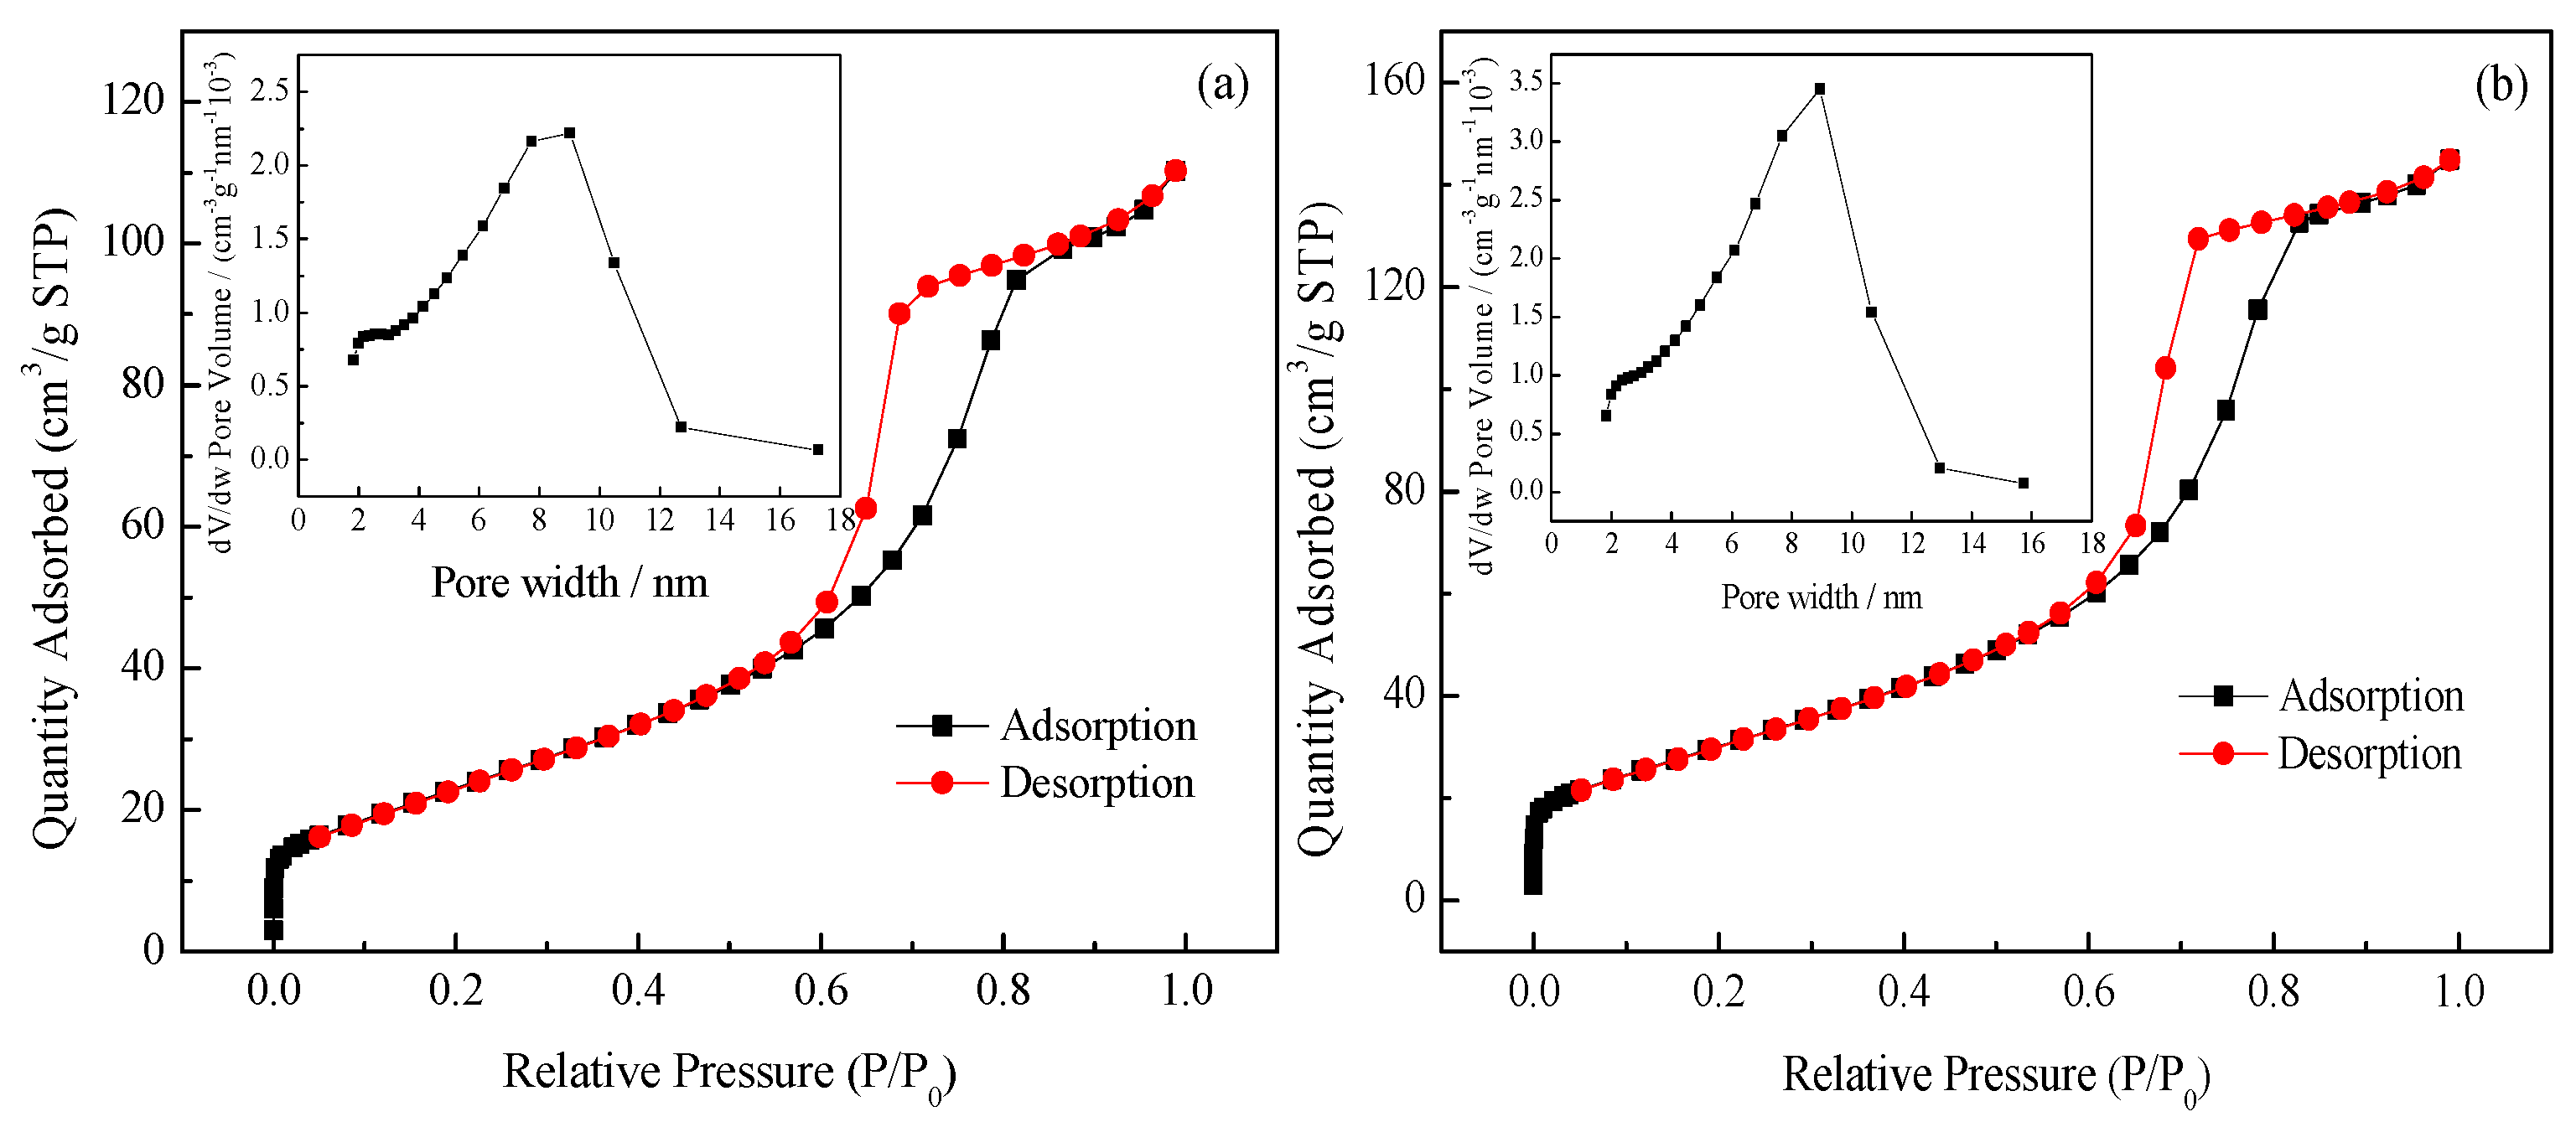
3.1.4. SBET and Porosity Analysis
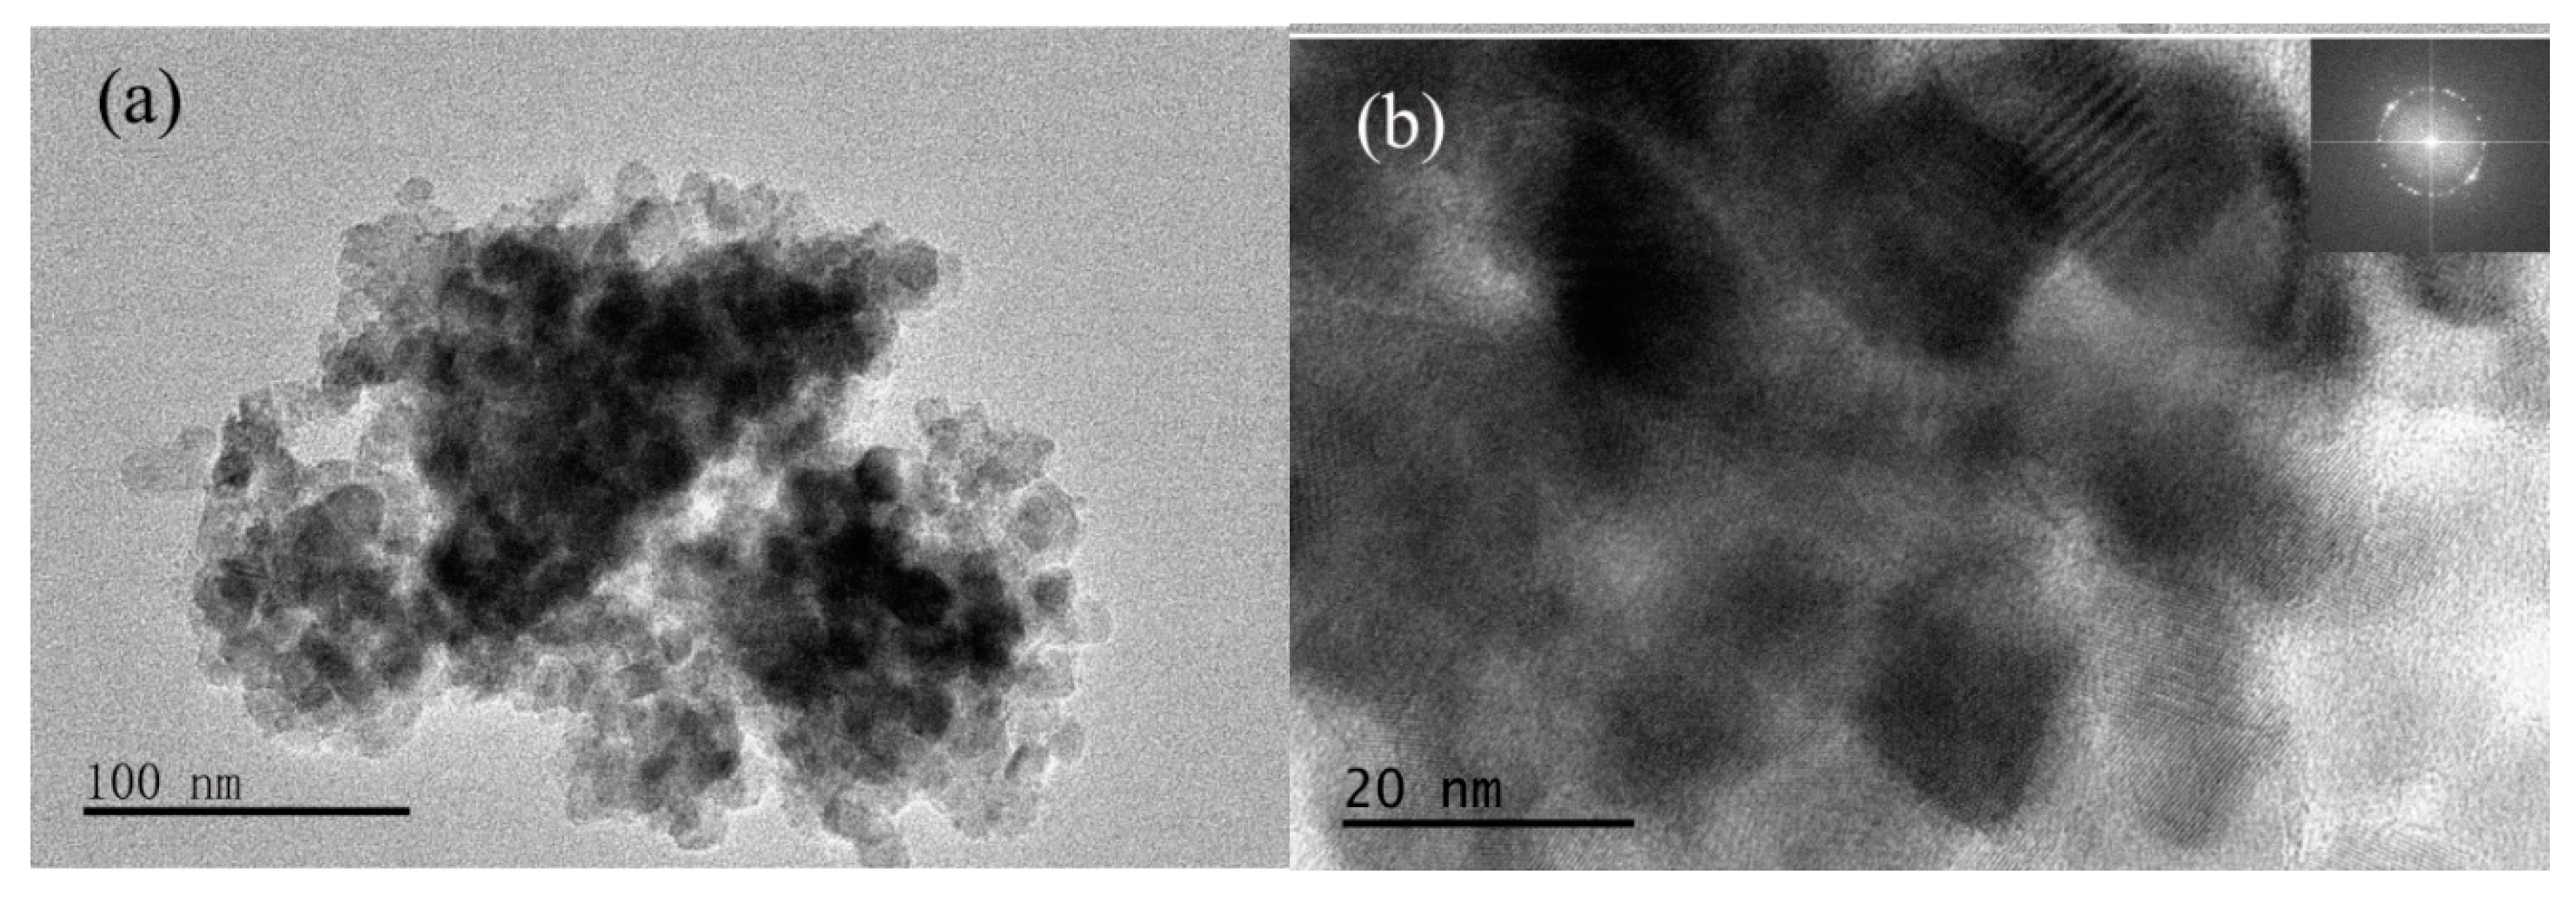
3.1.5. Microstructure Analysis
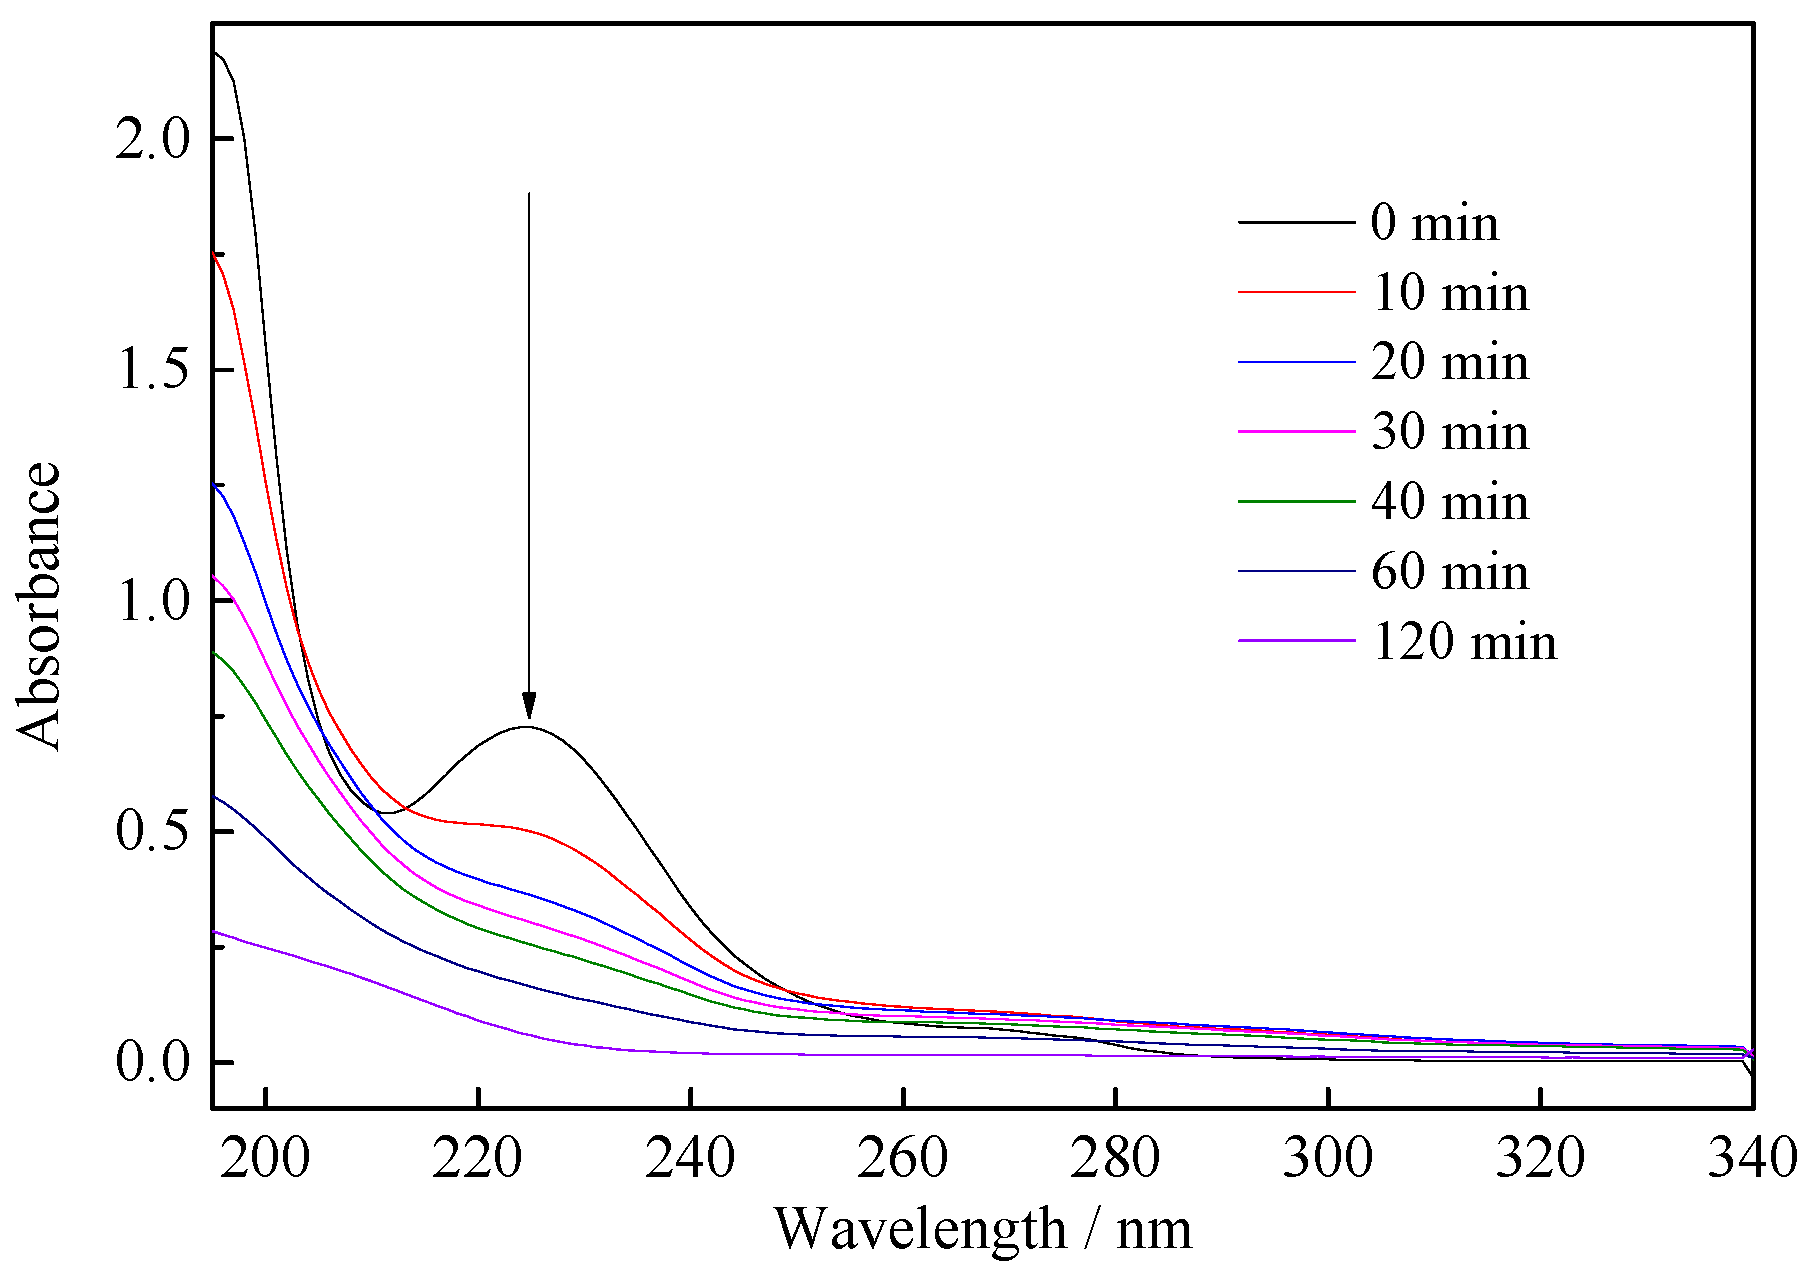
3.2. Photodegradation of Benzohydroxamic Acid
3.2.1. Effect of the Doped Amount
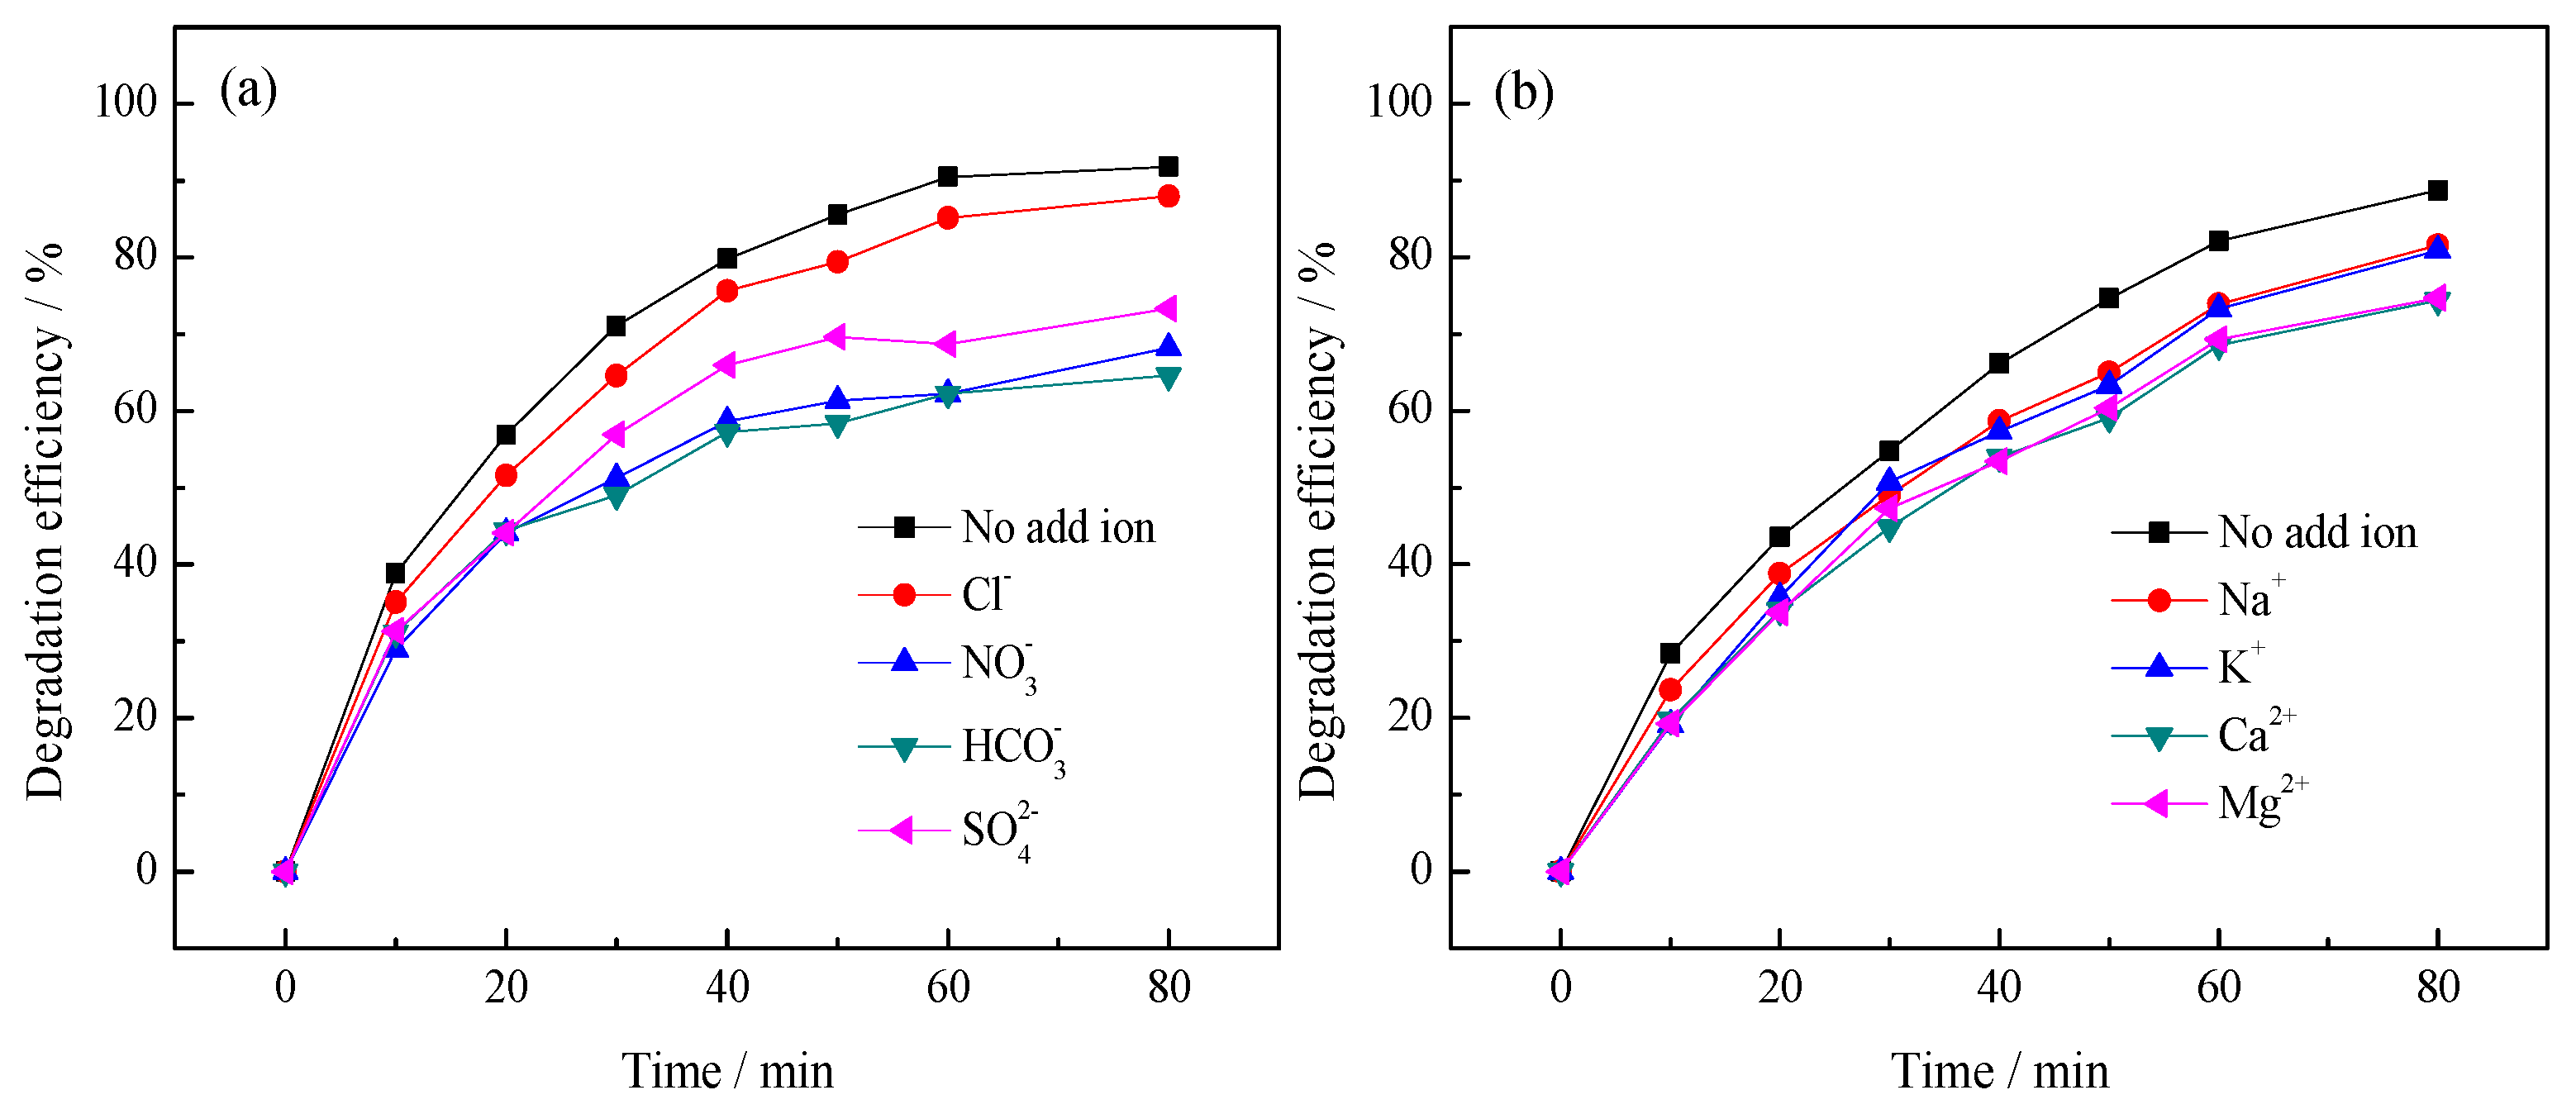
3.2.2. Effect of Inorganic Ions
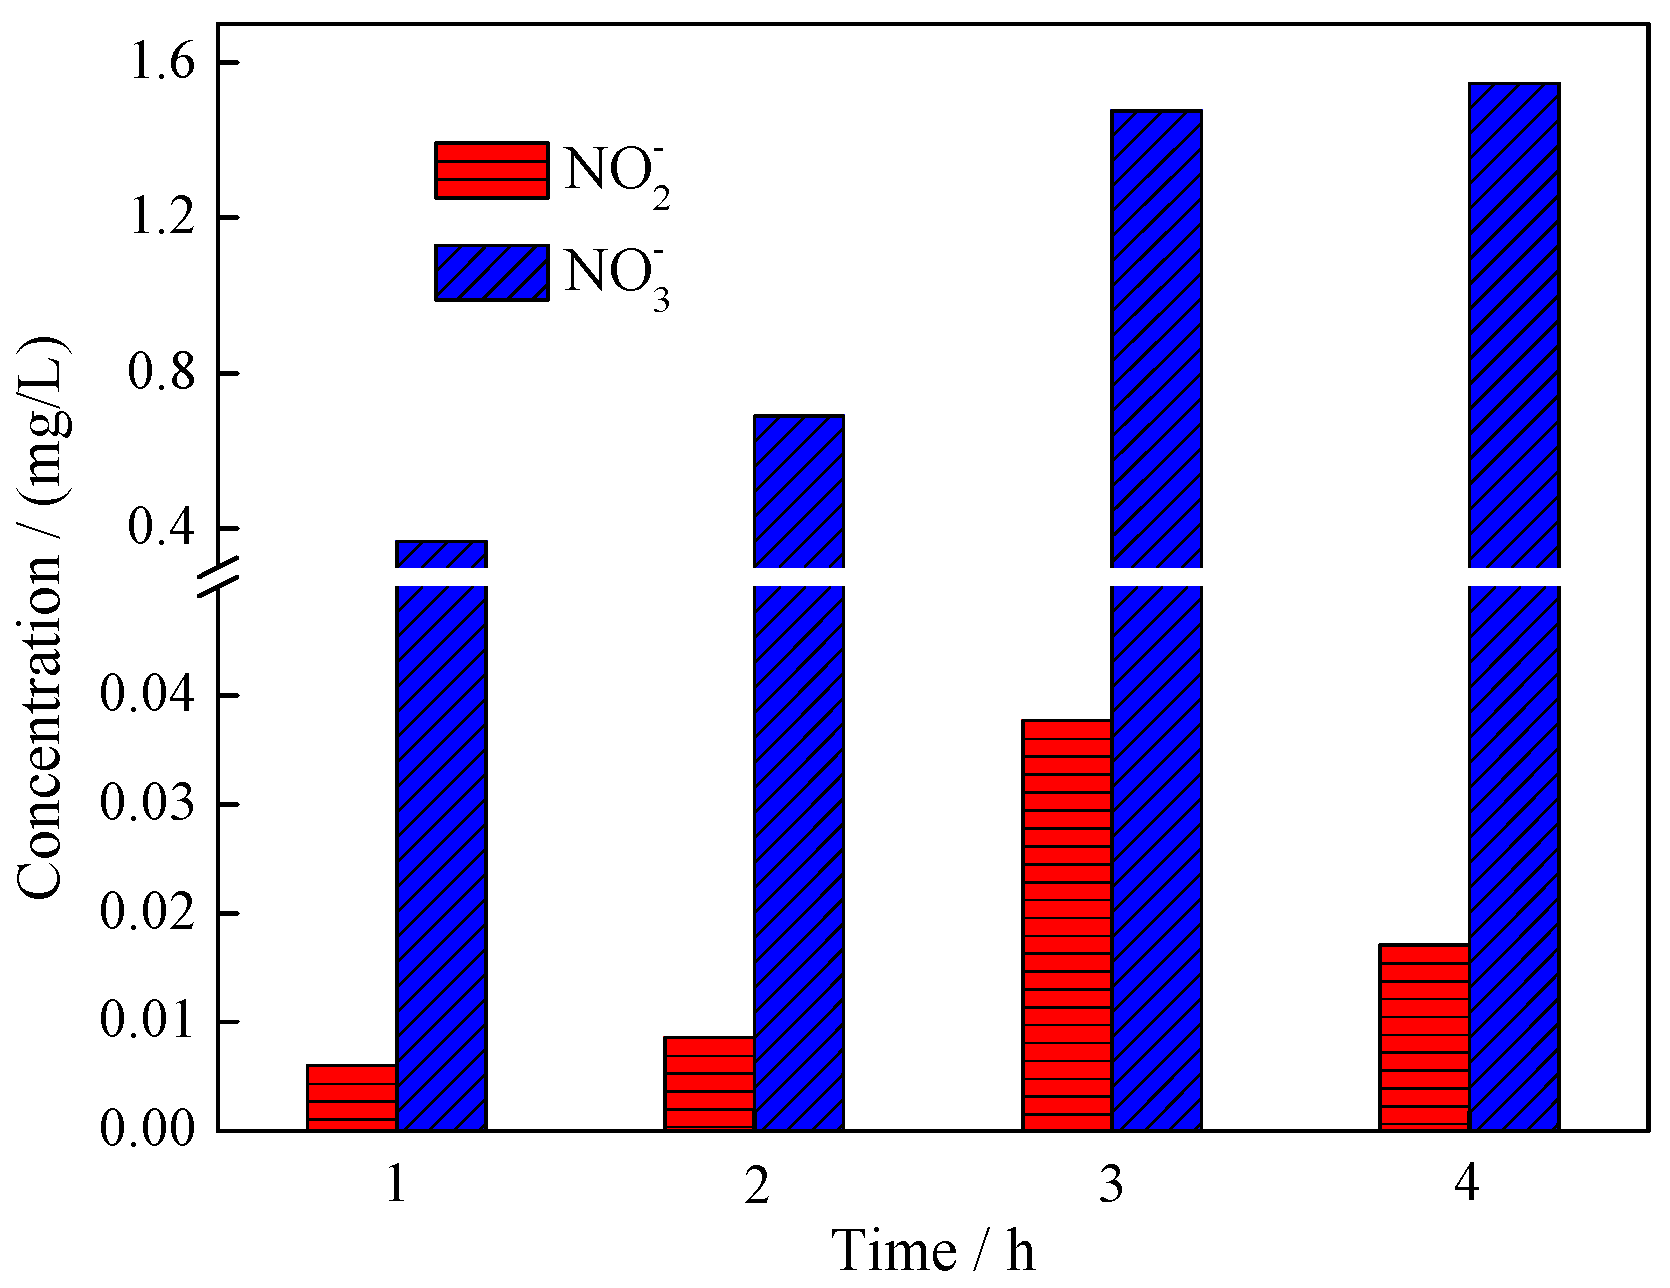
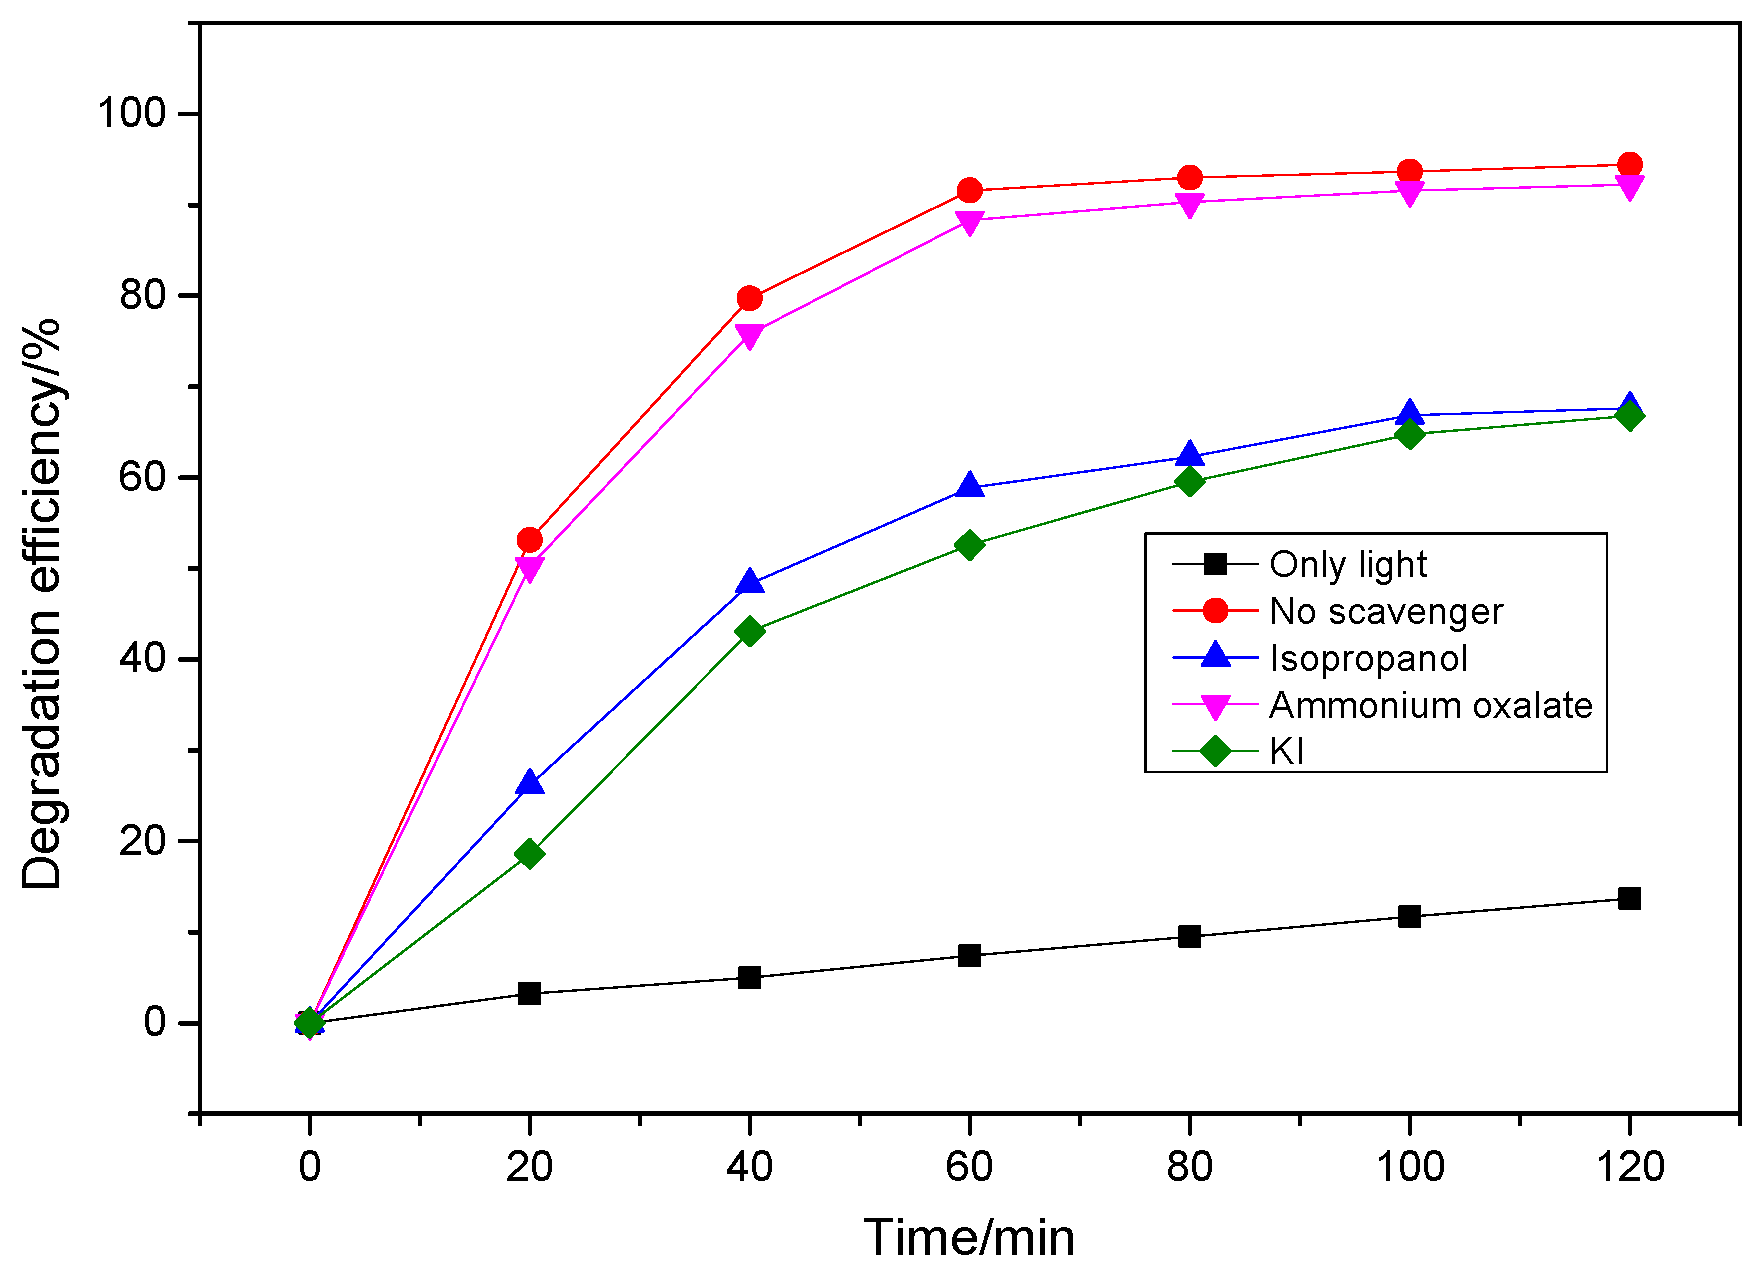
3.3. Mechanism Analysis
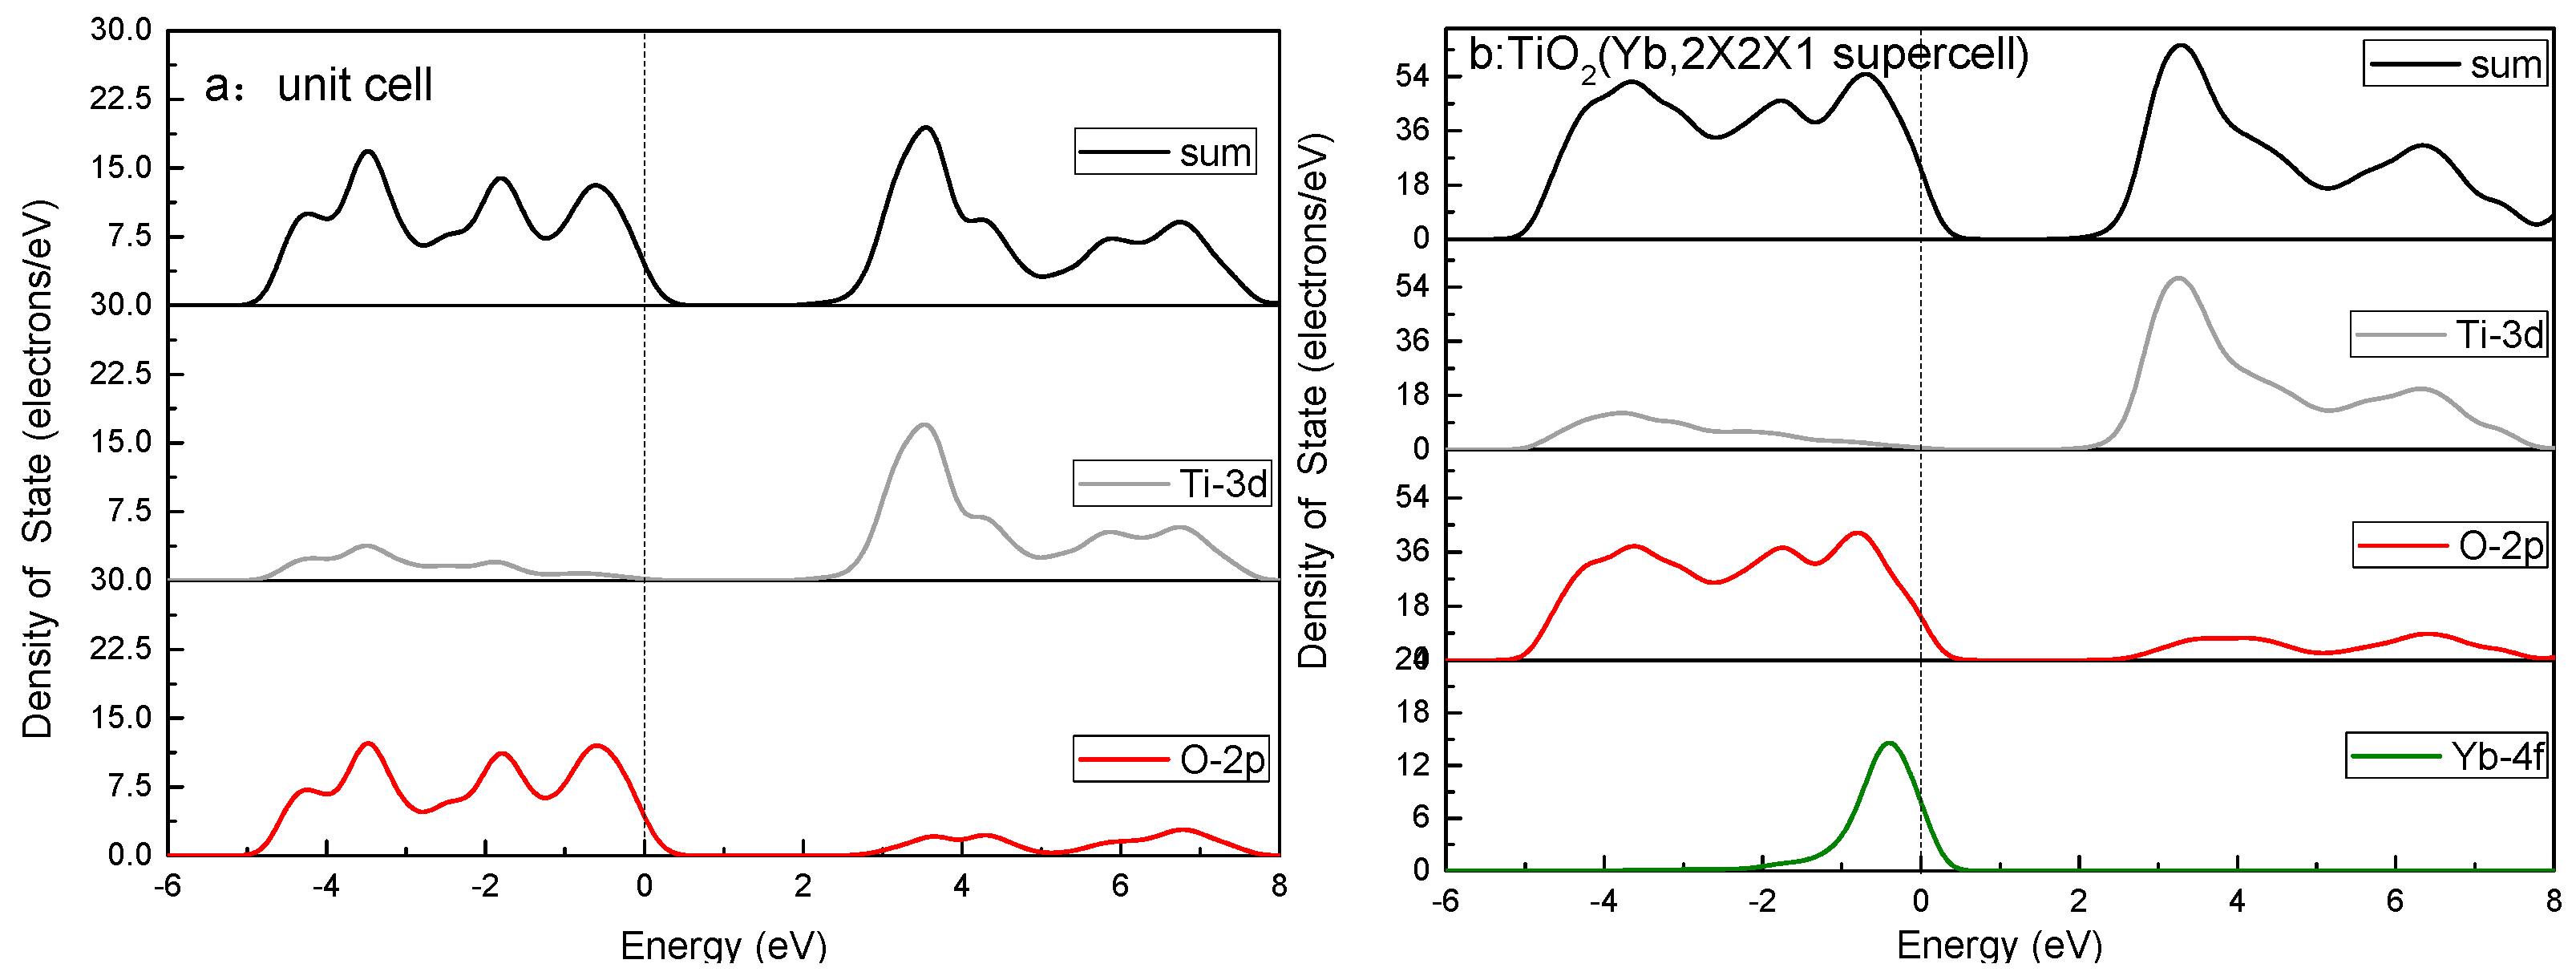
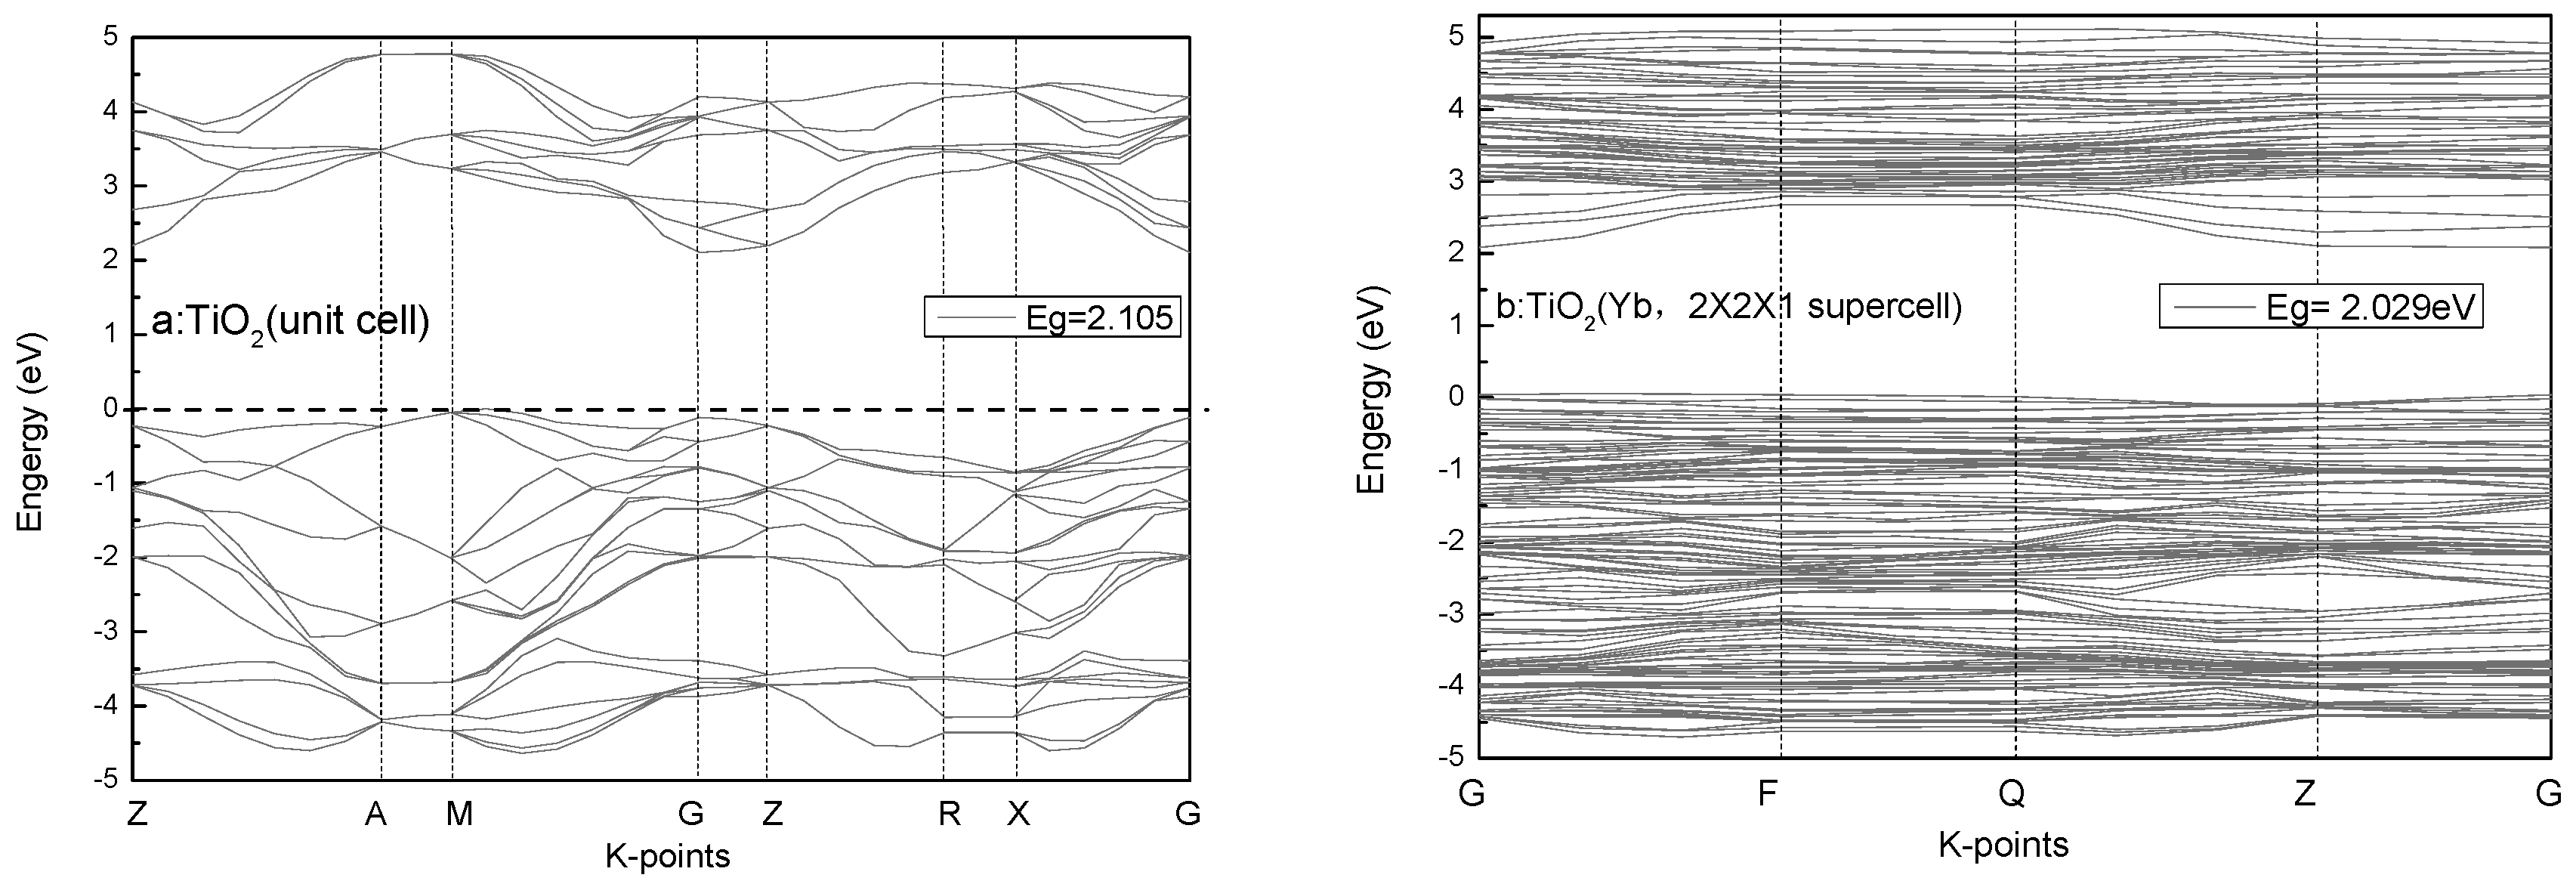
3.4. Calculations and Interfacial Charge Transfer Processes
4. Conclusions
Supplementary Materials
Acknowledgments
Author Contributions
Conflicts of Interest
References
- Lyu, J.; Gao, J.; Zhang, M.; Fu, Q.; Sun, L.; Hu, S.; Zhong, J.; Wang, S.; Li, J. Construction of homojunction-adsorption layer on anatase TiO2 to improve photocatalytic mineralization of volatile organic compounds. Appl. Catal. 2017, 202, 664–670. [Google Scholar] [CrossRef]
- Salasbañales, E.; Quirozsegoviano, R.I.; Díazalejo, L.A.; Rojasgonzález, F.; Estrellagonzález, A.; Campero, A.; Garcíasánchez, M.A. Comparative study of the optical and textural properties of tetrapyrrole macrocycles trapped Within ZrO2, TiO2, and SiO2 translucent xerogels. Molecules 2015, 20, 19463–19488. [Google Scholar] [CrossRef] [PubMed]
- He, D.; Huang, X.; Zhao, S.; Hu, D. Synthesis and catalytic performance of Yb3+, Er3+ doped titanium dioxide. Asian J. Chem. 2015, 27, 1477–1480. [Google Scholar] [CrossRef]
- Saqib, N.U.; Adnan, R.; Shah, I. A mini-review on rare earth metal-doped TiO2 for photocatalytic remediation of wastewater. Environ. Sci. Pollut. Res. 2016, 23, 15941. [Google Scholar] [CrossRef] [PubMed]
- Xu, W.-W.; Dai, S.-Y.; Hu, L.-H.; Liang, L.-Y.; Wang, K.-J. Influence of Yb-doped nanoporous TiO2 films on photovoltaic performance of dye-sensitized solar cells. Chin. Phys. Lett. 2006, 23, 2288–2291. [Google Scholar]
- Qu, X.; Yan, X.; Hou, Y.; Wang, P.; Song, H.; Du, F. Preparation of Gd-doped TiO2 hollow spheres with enhanced photocatalytic performance. J. Sol-Gel Sci. Technol. 2015, 76, 699–707. [Google Scholar] [CrossRef]
- Reszczyńska, J.; Grzyb, T.; Sobczak, J.W.; Lisowski, W.; Gazda, M.; Ohtani, B.; Zaleska, A. Visible light activity of rare earth metal doped (Er3+, Yb3+ or Er3+ /Yb3+) titania photocatalysts. Appl. Catal. 2015, 163, 40–49. [Google Scholar] [CrossRef]
- Devi, L.G.; Kumar, S.G. Exploring the critical dependence of adsorption of various dyes on the degradation rate using Ln3+-TiO2 surface under UV/solar light. Appl. Surf. Sci. 2012, 261, 137–146. [Google Scholar] [CrossRef]
- Samadi, M.; Zirak, M.; Naseri, A.; Khorashadizade, E.; Moshfegh, A.Z. Recent progress on doped ZnO nanostructures for visible-light photocatalysis. Thin Solid Films 2016, 605, 2–19. [Google Scholar] [CrossRef]
- Sun, L.; Hu, Y.-H.; Sun, W. Effect and mechanism of octanol in cassiterite flotation using benzohydroxamic acid as collector. Trans. Nonferrous Met. Soc. China 2016, 26, 3253–3257. [Google Scholar] [CrossRef]
- Hashimoto, S.; Nakamura, Y. Nuclease activity of a hydroxamic acid derivative in the presence of various metal ions. J. Chem. Soc. Chem. Commun. 1995, 14, 1413–1414. [Google Scholar] [CrossRef]
- Wenjun, Z. Study on the Biodegradability of Hydroxamic Acid Collectors. Ph.D. Thesis, Wuhan University of Technology, Wuhan, China, 2012. [Google Scholar]
- Luo, X.; Wang, J.; Wang, C.; Zhu, S.; Li, Z.; Tang, X.; Wu, M. Degradation and mineralization of benzohydroxamic acid by synthesized mesoporous La/TiO2. Int. J. Environ. Res. Public Health 2016, 13, 997. [Google Scholar] [CrossRef] [PubMed]
- Fidelus, J.D.; Barczak, M.; Michalak, K.; Fekner, Z.; Duzyńska, A.; Jusza, A.; Piramidowicz, R.; Monty, C.J.; Suchocki, A. Microstructural and optical characterization of TiO2 doped with ytterbium synthesized by sol-gel and solar physical vapor deposition process. J. Nanosci. Nanotechnol. 2012, 12, 3760–3765. [Google Scholar] [CrossRef] [PubMed]
- Calandra, P.; Lombardo, D.; Pistone, A.; Liveri, V.T.; Trusso, S. Structural and optical properties of novel surfactant-coated Yb@TiO2 nanoparticles. J. Nanopart. Res. 2011, 13, 5833–5839. [Google Scholar] [CrossRef]
- Clark Stewart, J.; Segall Matthew, D.; Pickard Chris, J.; Hasnip Phil, J.; Probert Matt, I.J.; Refson, K.; Payne Mike, C. First principles methods using CASTEP. J. Crystallogr. Cryst. Mater. 2005, 220, 567–570. [Google Scholar]
- Khalid, N.R.; Ahmed, E.; Rasheed, A.; Ahmad, M.; Ramzan, M.; Shakoor, A.; Elahi, A.; Abbas, S.M.; Hussain, R.; Niaz, N.A. Co-doping effect of carbon and yttrium on photocatalytic activity of TiO2 nanoparticles for methyl orange degradation. J. Ovonic Res. 2015, 11, 107–112. [Google Scholar]
- Fan, W.Q.; Bai, H.Y.; Zhang, G.H.; Yan, Y.S.; Liu, C.B.; Shi, W.D. Titanium dioxide macroporous materials doped with iron: Synthesis and photo-catalytic properties. Crystengcomm 2013, 16, 116–122. [Google Scholar] [CrossRef]
- Liu, H.; Yu, L.; Chen, W.; Li, Y. The progress of TiO2 nanocrystals doped with rare earth ions. J. Nanomater. 2012, 2012, 1–9. [Google Scholar]
- Wang, J.; Yang, G.; Wang, L.; Yan, W. Fabrication of a well-aligned TiO2 nanofibrous membrane by modified parallel electrode configuration with enhanced photocatalytic performance. RSC Adv. 2016, 6, 31476–31483. [Google Scholar] [CrossRef]
- Spadavecchia, F.; Cappelletti, G.; Ardizzone, S.; Bianchi, C.L.; Cappelli, S.; Oliva, C.; Scardi, P.; Leoni, M.; Fermo, P. Solar photoactivity of nano-N-TiO2 from tertiary amine: role of defects and paramagnetic species. Appl. Catal. 2010, 96, 314–322. [Google Scholar] [CrossRef]
- Liew, S.L.; Zhang, Z.; Goh, T.W.G.; Subramanian, G.S.; Seng, H.L.D.; Hor, T.S.A.; Luo, H.K.; Chi, D.Z. Yb-doped WO3 photocatalysts for water oxidation with visible light. Int. J. Hydrog. Energy 2014, 39, 4291–4298. [Google Scholar] [CrossRef]
- Huang, F.; Guo, Y.; Wang, S.; Zhang, S.; Cui, M. Solgel-hydrothermal synthesis of Tb/Tourmaline/TiO2 nano tubes and enhanced photocatalytic activity. Solid State Sci. 2017, 64, 62–68. [Google Scholar] [CrossRef]
- Wu, X.; Fang, S.; Zheng, Y.; Sun, J.; Lv, K. Thiourea-modified TiO2 nanorods with enhanced photocatalytic activity. Molecules 2016, 21, 181. [Google Scholar] [CrossRef] [PubMed]
- Das, S.K.; Bhunia, M.K.; Sinha, A.K.; Bhaumik, A. Synthesis, characterization, and biofuel application of mesoporous zirconium oxophosphates. ACS Catal. 2011, 1, 493–501. [Google Scholar] [CrossRef]
- Li, X.; Lin, H.; Chen, X.; Niu, H.; Zhang, T.; Liu, J.; Qu, F. Fabrication of TiO2/porous carbon nanofibers with superior visible photocatalytic activity. New J. Chem. 2015, 39, 7863–7872. [Google Scholar] [CrossRef]
- Reszczynska, J.; Grzyb, T.; Wei, Z.; Klein, M.; Kowalska, E.; Ohtani, B.; Zaleska-Medynska, A. Photocatalytic activity and luminescence properties of RE3+-TiO2 nanocrystals prepared by sol-gel and hydrothermal methods. Appl. Catal. 2016, 181, 825–837. [Google Scholar] [CrossRef]
- Trujillo-Navarrete, B.; María del Pilar, H.-V.; Rosa María, F.-N.; Francisco, P.-D.; Henry, A.-H.; Sergio, P.-S.; Edgar Alonso, R.-S. Effect of Nd3+ doping on structure, microstructure, lattice distortion and electronic properties of TiO2 nanoparticles. J. Rare Earths 2017, 35, 259–270. [Google Scholar] [CrossRef]
- Hu, C.; Yu, J.C.; Hao, Z.; Wong, P.K. Effects of acidity and inorganic ions on the photocatalytic degradation of different azo dyes. Appl. Catal. 2003, 46, 35–47. [Google Scholar] [CrossRef]
- Sörensen, M.; Frimmel, F.H. Photochemical degradation of hydrophilic xenobiotics in the ja:math process: Influence of nitrate on the degradation rate of EDTA, 2-amino-1-naphthalenesulfonate, diphenyl-4-sulfonate and 4,4′-diaminostilbene-2,2′-disulfonate. Acta Hydroch. Hydrob. 1997, 31, 2885–2891. [Google Scholar]
- Dong, H.K.; Anderson, M.A. Solution factors affecting the photocatalytic and photoelectrocatalytic degradation of formic acid using supported TiO2 thin films. J. Photochem. Photobiol. A 1996, 94, 221–229. [Google Scholar]
- Wang, C.; Zhu, L.; Wei, M.; Chen, P.; Shan, G. Photolytic reaction mechanism and impacts of coexisting substances on photodegradation of bisphenol A by Bi2WO6 in water. Water Res. 2012, 46, 845–853. [Google Scholar] [CrossRef] [PubMed]
- Giraldo, A.L.; Penuela, G.A.; Torres-Palma, R.A.; Pino, N.J.; Palominos, R.A.; Mansilla, H.D. Degradation of the antibiotic oxolinic acid by photocatalysis with TiO2 in suspension. Water Res. 2010, 44, 5158–5167. [Google Scholar] [CrossRef] [PubMed]
- Liu, S.Q.; Yang, M.Q.; Zhang, N.; Xu, Y.J. Nanocomposites of graphene-CdS as photoactive and reusable catalysts for visible-light-induced selective reduction process. J. Energy Chem. 2014, 23, 145–155. [Google Scholar] [CrossRef]
- Wei, Z.-N.; Jia, C.-L. First-principle calculations of the electronic and optical properties of Tm-doped anatase titanium dioxide. Opt. Eng. 2015. [Google Scholar] [CrossRef]


| Doped Ratio | R2 | k (min−1) |
|---|---|---|
| 0% | 0.9994 | 0.0339 |
| 0.1% | 0.9979 | 0.0375 |
| 0.3% | 0.9981 | 0.0372 |
| 0.5% | 0.9967 | 0.0392 |
| 0.7% | 0.9910 | 0.0335 |
| 1% | 0.9990 | 0.0327 |
© 2017 by the authors. Licensee MDPI, Basel, Switzerland. This article is an open access article distributed under the terms and conditions of the Creative Commons Attribution (CC BY) license (http://creativecommons.org/licenses/by/4.0/).
Share and Cite
Luo, X.; Zhu, S.; Wang, J.; Wang, C.; Wu, M. Characterization and Computation of Yb/TiO2 and Its Photocatalytic Degradation with Benzohydroxamic Acid. Int. J. Environ. Res. Public Health 2017, 14, 1471. https://doi.org/10.3390/ijerph14121471
Luo X, Zhu S, Wang J, Wang C, Wu M. Characterization and Computation of Yb/TiO2 and Its Photocatalytic Degradation with Benzohydroxamic Acid. International Journal of Environmental Research and Public Health. 2017; 14(12):1471. https://doi.org/10.3390/ijerph14121471
Chicago/Turabian StyleLuo, Xianping, Sipin Zhu, Junyu Wang, Chunying Wang, and Min Wu. 2017. "Characterization and Computation of Yb/TiO2 and Its Photocatalytic Degradation with Benzohydroxamic Acid" International Journal of Environmental Research and Public Health 14, no. 12: 1471. https://doi.org/10.3390/ijerph14121471