Article

Risk Assessment and Source Identification of 17 Metals and Metalloids on Soils from the Half-Century Old Tungsten Mining Areas in Lianhuashan, Southern China

1
School of Environmental Studies, China University of Geosciences, Wuhan 430074, China
2
The Center of Environmental Engineering and Assessment, No. 203 Research Institute of Nuclear Industry, Xianyang 712000, China
3
School of Earth Sciences, University of Melbourne, Parkville, VIC 3010, Australia
*
Author to whom correspondence should be addressed.
Int. J. Environ. Res. Public Health 2017, 14(12), 1475; https://doi.org/10.3390/ijerph14121475
Submission received: 11 October 2017 / Revised: 22 November 2017 / Accepted: 27 November 2017 / Published: 29 November 2017
(This article belongs to the Special Issue Soil Pollution and Public Health)

Abstract

:
Background: Mining activities always emit metal(loid)s into the surrounding environment, where their accumulation in the soil may pose risks and hazards to humans and ecosystems. Objective: This paper aims to determine of the type, source, chemical form, fate and transport, and accurate risk assessment of 17 metal(loid) contaminants including As, Cd, Cu, Ni, Pb, Zn, Cr, Ag, B, Bi, Co, Mo, Sb, Ti, V, W and Sn in the soils collected from an abandoned tungsten mining area, and to guide the implementing of appropriate remediation strategies. Methods: Contamination factors (CFs) and integrated pollution indexes (IPIs) and enrichment factors (EFs) were used to assess their ecological risk and the sources were identified by using multivariate statistics analysis, spatial distribution investigation and correlation matrix. Results: The IPI and EF values indicated the soils in the mine site and the closest downstream one were extremely disturbed by metal(loid)s such as As, Bi, W, B, Cu, Pb and Sn, which were emitted from the mining wastes and acid drainages and delivered by the runoff and human activities. Arsenic contamination was detected in nine sites with the highest CF values at 24.70 next to the mining site. The Cd contamination scattered in the paddy soils around the resident areas with higher fraction of bioavailable forms, primarily associated with intense application of phosphorus fertilizer. The lithogenic elements V, Ti, Ag, Ni, Sb, Mo exhibit low contamination in all sampling points and their distribution were depended on the soil texture and pedogenesis process. Conclusions: The long term historical mining activities have caused severe As contamination and higher enrichment of the other elements of orebody in the local soils. The appropriate remediation treatment approach should be proposed to reduce the bioavailability of Cd in the paddy soils and to immobilize As to reclaim the soils around the mining site. Furthermore, alternative fertilizing way and irrigating water sources are urgencies to reduce the input of Cd and As into the local soils effectively.

1. Introduction

Like many other developing countries, such as Congo, Morocco, and Chile, China has been suffering from serious soil pollution caused by metals and metalloids [1,2,3,4]. Metals and metalloids in soils naturally derive from lithogenic sources, but intense industrialization and urbanization in these countries has accelerated the release of these toxic elements into soils from traffic, fuel components, industrial waste dumping, and other non-specific sources [5,6]. Additionally, agricultural activities, mining, and smelting operations represent other important sources of metal(loid)s in local soils [7,8,9,10,11]. Special attention has been paid to the soil contamination produced by ancient mining activities, due to its marked adverse effect on the health of the local population, and potential for remediation and reclamation [12,13,14,15,16].
Determining the contamination source, basic chemistry, and risk assessment of the metals and metalloids in soils is critical for any remediation decision or reclamation strategy proposal [17]. This study focused on an abandoned tungsten mine, which flourished during the years from 1958 to 1999. While a previous study reported severe arsenic contamination in the local water resource, food, and agricultural soils due to the flooding of the acid mining drainages produced by the ancient mining activities [18], there are no published reports describing other common metal pollutants in mining affected soils, such as Pb, Cu, Zn, Cd and Cr, which were also identified as priority control elements in tungsten mine areas [19]. The distribution of the elements, existing in the orebody, is characterized by a high level of heterogeneity in the mine soils [16]. Thus, it is easy to identify whether a metal or metalloid is related with the mining activities or not by using Principal Component Analysis (PCA) to analyze the underlying patterns between contaminants and the orebody elements. Thus, this paper chose 17 elements, which not only include the usual soil pollutants, but also include the elements composing the mineral and other lithospheric elements. The objectives of this study are: (1) to assess the environmental risk on the basis of the vertical and superficial distributions of the 17 metal(loid)s in the soils around the studied abandoned mining area; (2) to establish a general method to identify the metal(loid) sources and pathways in similar ancient mining areas and (3) to determine the potential bioaccumulation ability and natural attenuation mechanism of the common soil pollutants in soils, including Cr, Ni, Cu, Zn, Cd, Pb and As, by sequential extraction tests.

2. Materials and Method

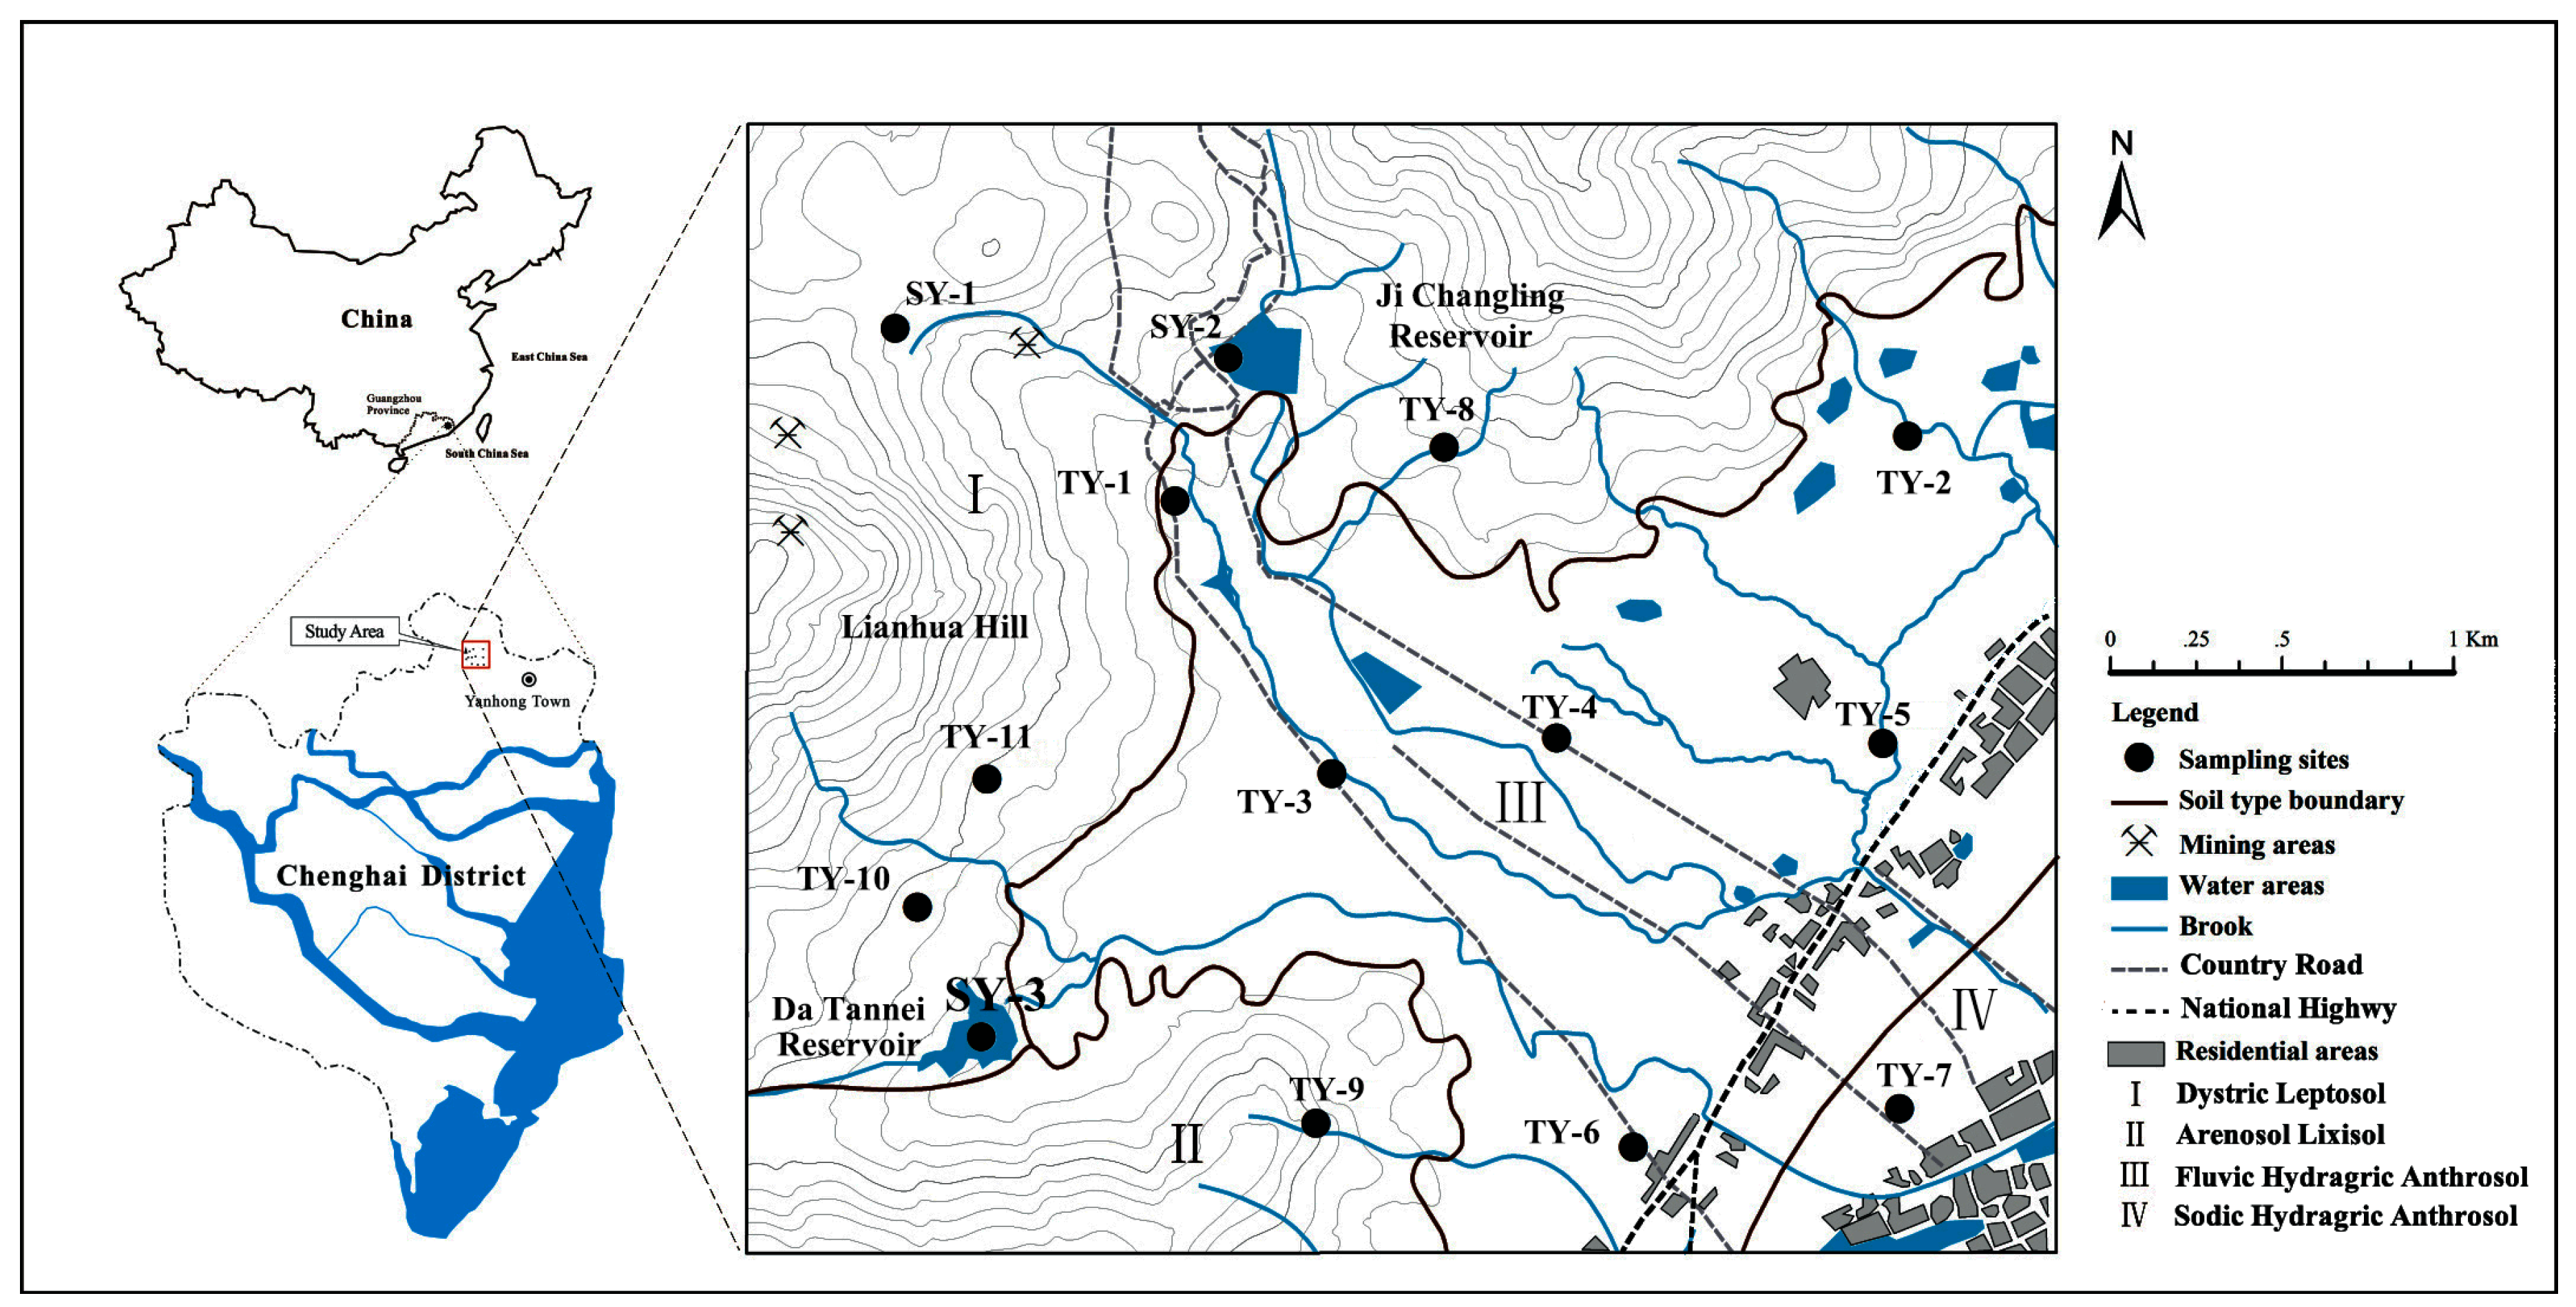
2.1. Study Area and Soil Sampling Site

The study area is located in the northeast of Chenghai district, in the center of the Hanjiang delta economic zone of Guangdong Province, China (Figure 1). The area has a characteristic subtropical monsoon climate, with an annual average rainfall of 1444 mm, and temperature of 21 °C, and an east prevailing wind direction. The flourishing ancient mining activities caused extensive damage to the local vegetation and left open pits, mainly distributed in the northern and west sides of the Lianhuashan hills. This study focused on the residential neighborhoods and urban areas, with landforms consisting of alluvial fans along the mountain fronts and the paralic deposited plains. The urban area has been traditionally associated with agricultural activities favoring mainly the production of paddy rice, sugarcane, and guava trees. At places, vegetables like potatoes and tomatoes and fruits like longans and bananas are cultivated. The industry is little developed in the residential neighborhoods, with some small metal processing plants scattered along the national highway.
In order to ensure even sampling, the study area was firstly divided into a grid composed of 12 rectangular cells (1 km × 1 km) and then eleven soil sites (abbreviated by “TY”) were selected within this grid with a cell located in the hilly peak excluded. Sites TY-8–11 were located on the hillside and represented underdeveloped mountain soils. Six sites, including of TY-1, and TY-3–6, were located in the alluvial fans along the mountain fronts, and TY-1 was suspected to be mainly affected by the ancient mining activities. Site TY-7 represents a coastal soil developed from alluvial deposits, with two small metal processing plants on the north side (at approximately 100 m distance). Site TY-2, located in the northwest of the study area and far away from the mining zone, is considered as a relatively less contaminated area. Figure 1 specifies the location and Table 1 lists the geology and soil type details of these sampling sites.

2.2. Sample Collection and Analysis

The sampling was carried out in the autumn. At the sites of area one, on the hillside, four topsoil samples were collected at an interval of 10–20 cm below the surface. Seven soil profiles were sampled at the sites located in the urban and residential areas. Three bulk soil samples were collected from each soil layer. Samples were collected at an interval of 10–50 cm (A horizon) for the topsoil layer, 50–100 cm (B horizon) for the subsoil layer, and 100–150 cm (C horizon) for the regolith layer, respectively. These samples were thoroughly mixed into an approximately 5 kg composite sample and then packed in self-locking polyethylene bags. After air-drying at room temperature and passage through a 2 mm nylon sieve, 0.5 g of each soil sample were digested with a mixture of 40% HF-70% HClO4-70% HNO3 on a hot plate. The digested solution was cooled, filtered and finally diluted to 50 mL. The concentrations of Cu, Ni, Pb, Zn, Cr, Co, Ti, V, As and P were determined by ICP-OES (OPTIMA 8300, PerkinElmer, Waltham, MA, USA), while the contents of trace elements such as Cd, Bi, Mo, Sb, W Ag, Sn and B were detected by ICP-MS (NexION 350, PerkinElmer, Waltham, MA, USA). The 7-step sequential extraction method recommended by the China Geological Survey [21] was used. An initial soil to solution ratio of 1:10 was used and details on each step of the protocol are given in Table S1 of the Supplementary Materials. The choice of extraction of exchangeable, carbonate-bound, Fe and Mn oxide-bound, refractory organic matter-bound, and residual fractions of metal(loid)s in the soils was according to Tessier [22]. The extraction of humic acid-bound fraction was according to Boruvka [23]. The pH was measured in a 1:2.5 soil: water suspension after shaking for 2 h, using a calibrated PB-21 pH meter (Sartorius AG, Goettingen, Germany). The organic matter (OM) concentration was determined by the Walkley-Black method. The cation exchange capacity (CEC) was determined by the sodium acetate saturation method [24].

2.3. Contamination Factor (CF) and Integrated Pollution Index (IPI)

The contamination factor (CF) was calculated by dividing the metal and metalloid concentration in the soil by their background values, determining the contaminating level from the single one [25]. This study used the background values for the soils of Guangdong Province [26]. The four categories are generally classified by their intensities as suggested by Hakanson [27] and Darwish et al. [28]: low contamination (CF < 1), moderate contamination (1 ≤ CF < 3), considerable contamination (3 ≤ CF < 6), very high contamination (CF ≥ 6). The overall pollution status of the metal and metalloid in soils could be assessed by an integrated pollution index (IPI) [29], which was defined as:
IPI = (CF1 × CF2 × CF3 × ······ × CFn) 1/n
where n is the number of samples. Like CF, the pollution levels of contaminants were mainly classified into four categories with IPI: no pollution (IPI < 1), moderate pollution (1 < IPI < 2), heavy pollution (2 < IPI < 3), and extremely heavy pollution (3 < IPI).

2.4. Enrichment Factors (EFs)

Enrichment factors were refined as a means of identifying and quantifying human interference with global element cycles and were widely used in environmental sciences to speculate the origin of elements [30,31]. The enrichment factor (EF) of each element can be expressed by the following equation [32,33]:
E F = C i / C r B i / B r
where Ci and Cr are the concentrations of the target metal and the reference metal in in soils, while Bi and Br are their corresponding background concentrations [26]. This study also chose Ti as a reference element due to the fact its concentration is practically exclusively influenced by crustal sources in the sample medium [30,34]. Based on EF values, five enrichment categories are recognized: depletion to minimal enrichment (<2), moderate enrichment (2–5), significant enrichment (5–20), very high enrichment (20–40), extremely high enrichment (>40) [31]. In addition, a mobilization or depletion might occur to the metals if EF less than 1.0, whereas the elements with EF values more than 1.0 might originate from anthropogenic activities [35].

2.5. Statistical and Spatial Distribution Analysis

The multivariate statistics analysis and correlation matrix was carried out using SPSS 13.0 (SPSS Inc., Chicago, IL, USA) on the basis of the concentrations of trace elements and phosphorus in surface soils. The ordinary kriging (OK) method provided in ArcGIS 9.3 (ESRI, RedLands, CA, USA) was adopted to determine their spatial distribution [36,37]. Using the kriging equations, OK weights were deduced by a semivariance function, and equal half of the average squared difference between paired data values [38,39]. Among the models, a spherical semivariance model is more applicable to this study due to its minimum prediction errors when used for spatial interpolations:
γ ( h ) = 1 2 N ( h ) i = 1 N ( h ) [ z ( x i ) z ( x i + h ) ] 2 ,
where γ(h) represents the semivariance value, N(h) is the total number of sample pairs within the distance interval h, z(xi + h) and z(xi) are sample values at two points separated by the distance interval h, and x is the position of soil sample sites.

3. Results

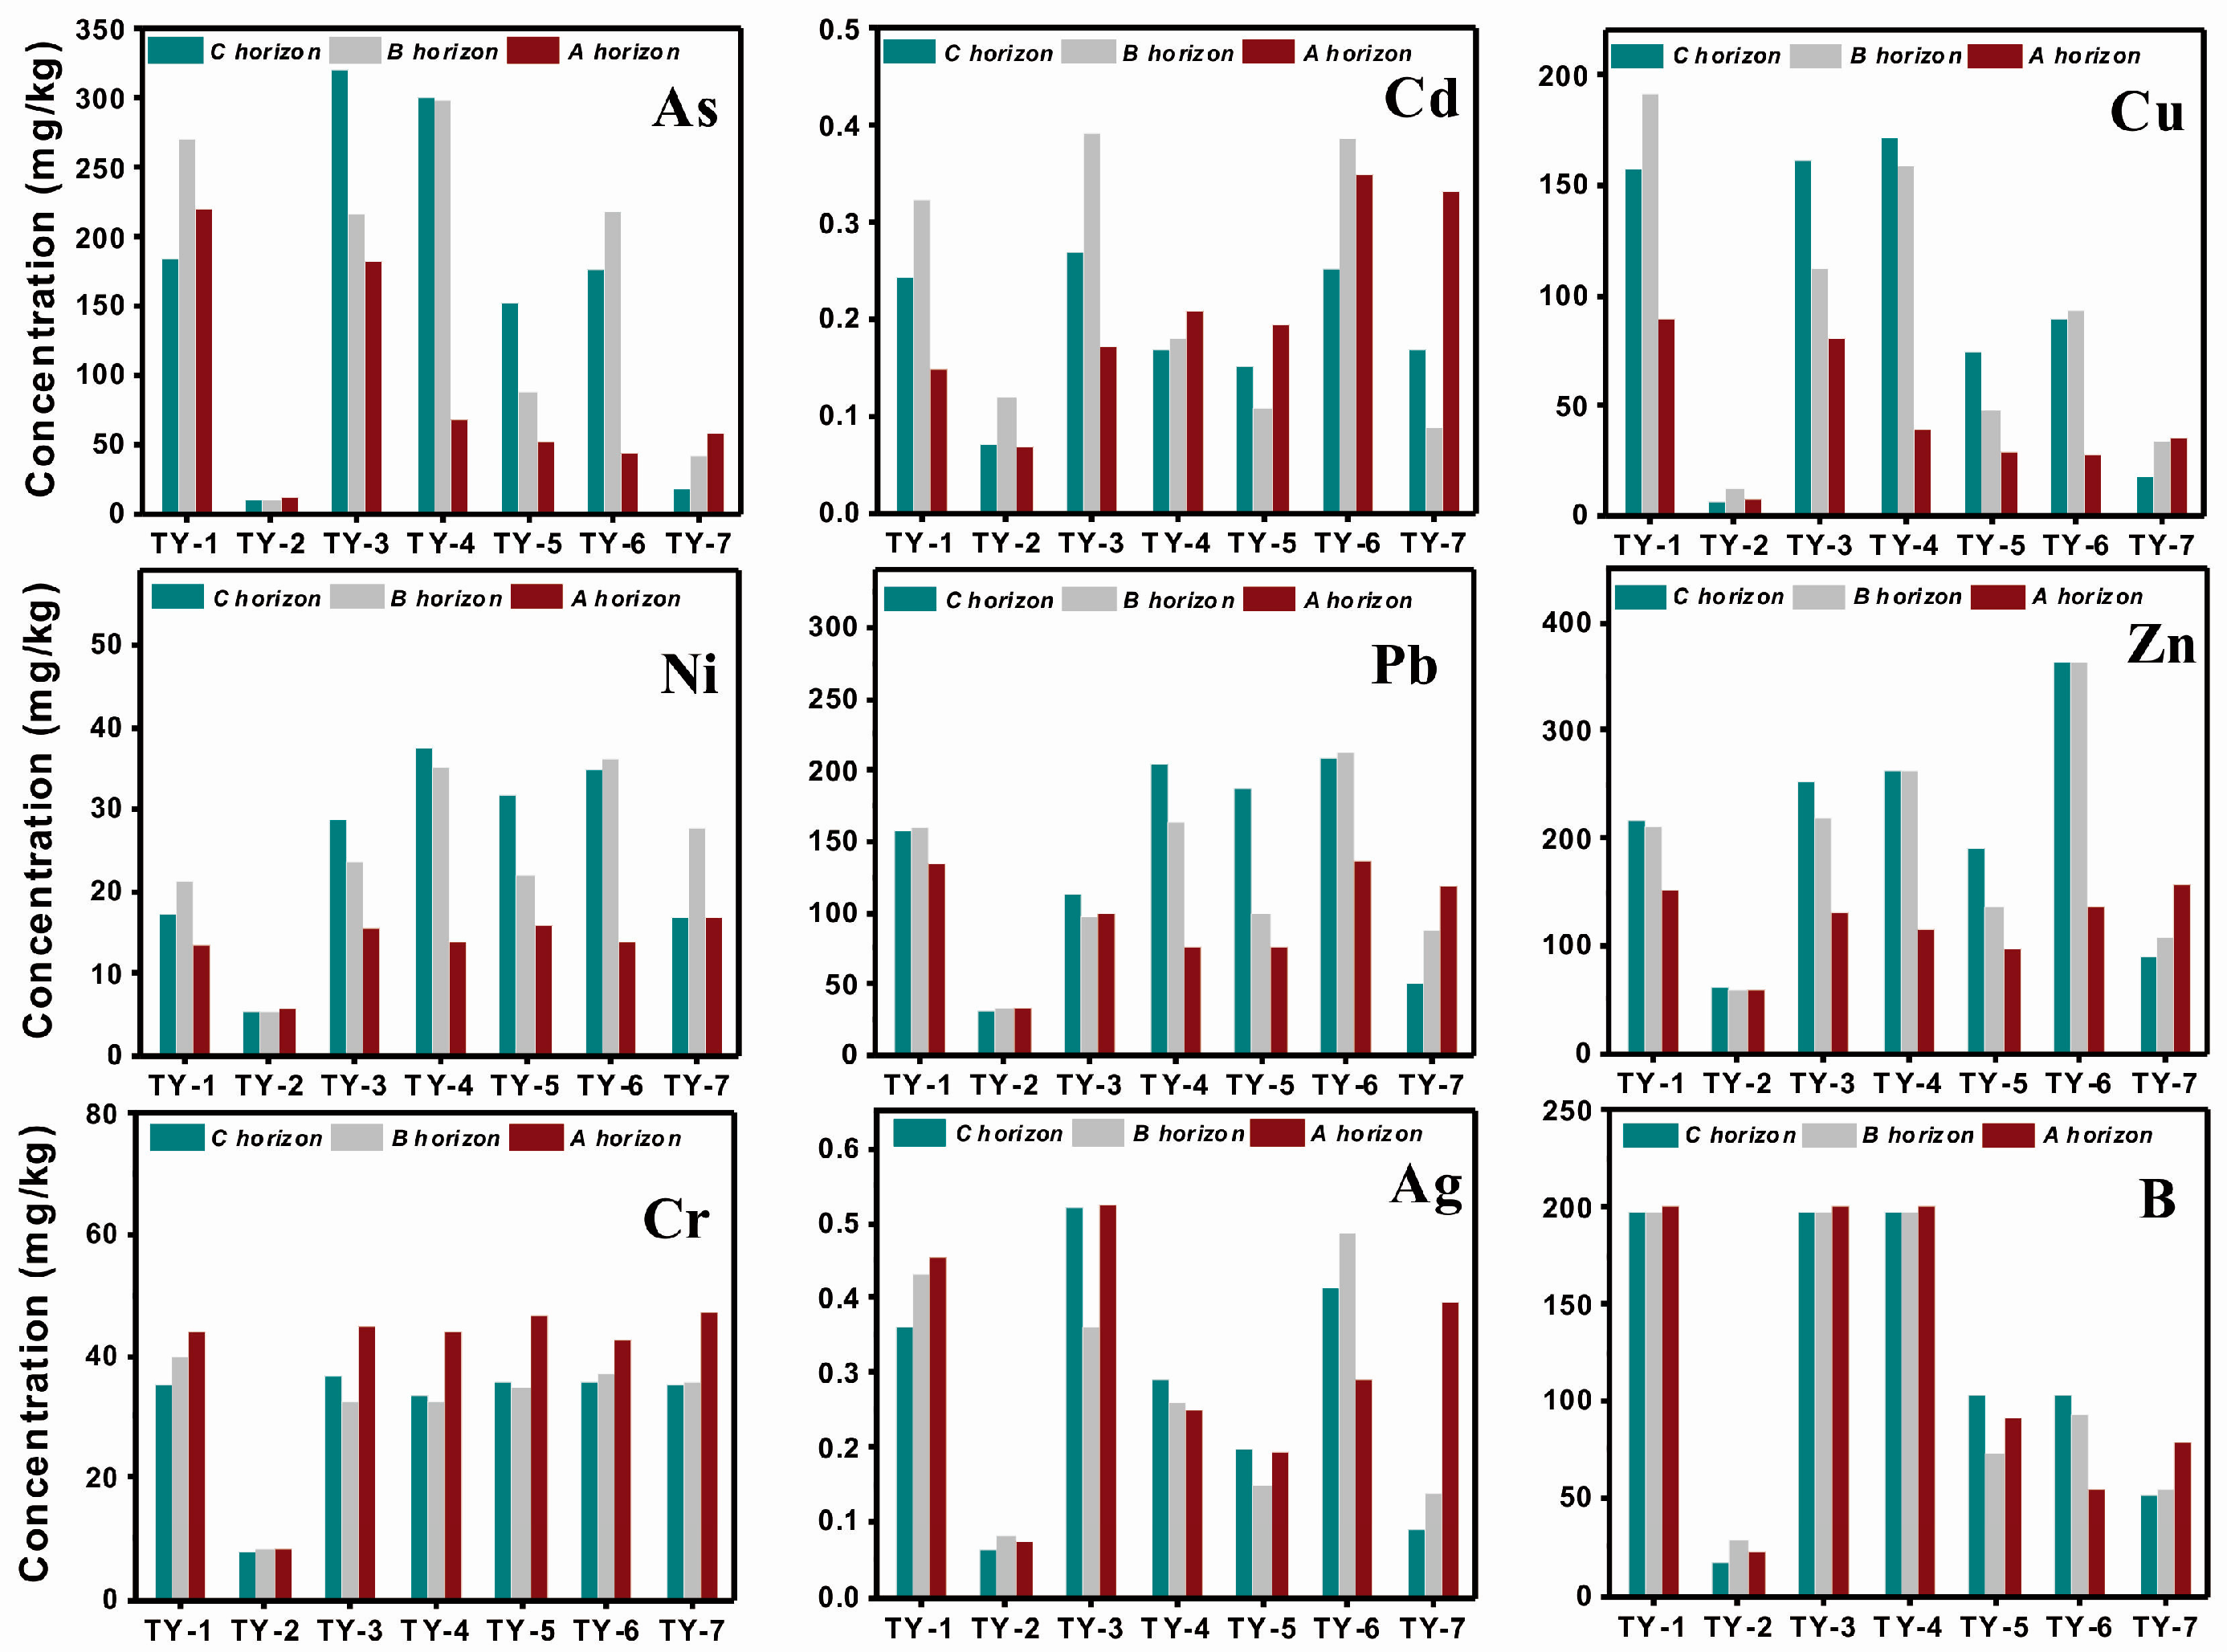
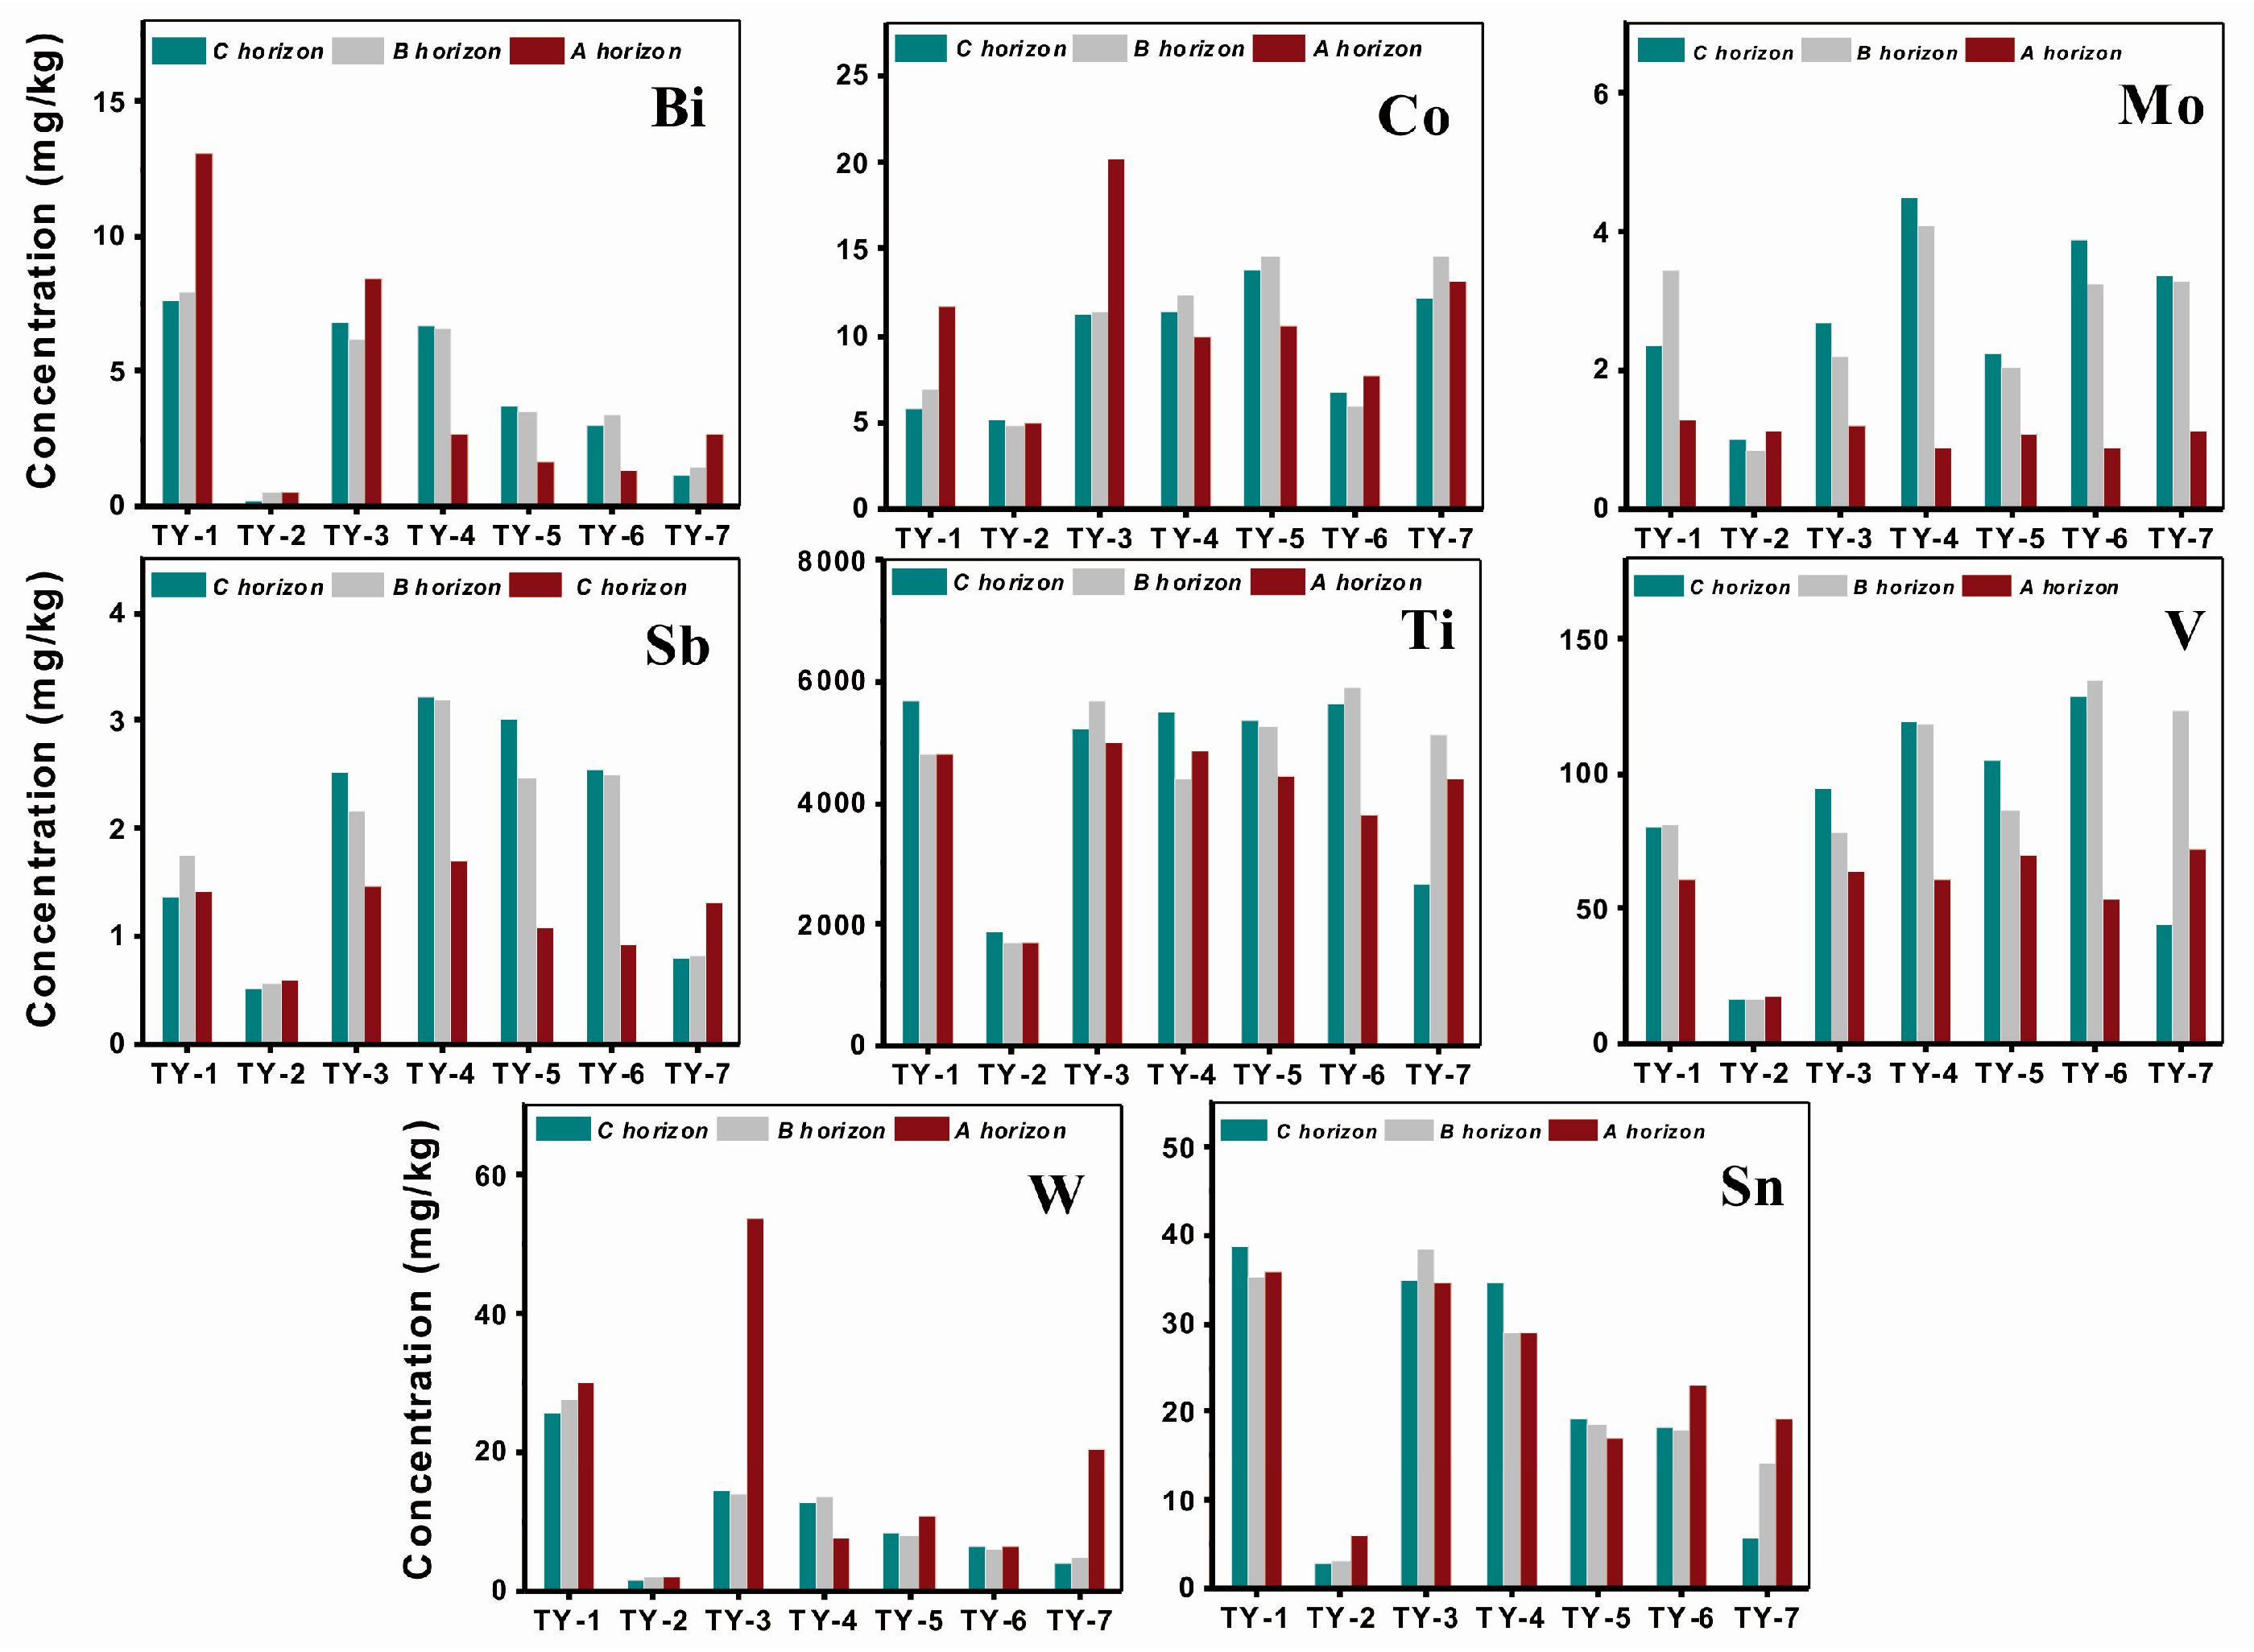
3.1. Metal Concentrations in Three Different Horizon Soils

Soil properties analyzed in this area are shown in Table 1. The total concentrations of As, Cd, Cu, Ni, Pb, Zn, and the ones of other investigated elements in the top soils are given in Table 2 and Table S2, respectively.
Figure 2 contrasts the total concentrations of the 17 elements in three different horizon soils from the plain field (including sample sites from TY-1 to TY-7, the total concentrations are shown in Table S4). Among these sites, TY-2, located far away from the mine zone, showed the lowest element concentrations in all the soils at every layer. The elements of W, Co, Bi, Pb, Ag, and Sn exhibited higher contents in the top soils than the two deeper layers of the sites adjoined to the mine zone, except for As, which was prone to enrichment in the deeper soils. However, the fresh inputs of As by the local small metal processing plants elevated the contents in the top soil at site TY-7. In the residential area, the concentrations of Cd decreased with the depth deeper, indicating its human input [41]. Similarly, elevated contents of Zn and Pb detected in surface soil in the residential area may were attributed to human activities. Cu in top soils surrounding the mine zone exhibited higher contents than the levels in other area. Relying on lithogenic sources, elements of B, Cu, Ni, Mo, Sb, Ti and V were mainly enriched in the deeper soils.

3.2. Risk Assessment of Metals and Metalloids on Top Soils

3.2.1. CFs and IPIs of Metals and Metalloids in Top Soils

Table 3 summarizes the single contamination factors (CFs) and integrated pollution indices (IPIs) of the target elements in top soils. The soils collected in the vicinity of the mining area showed very high contamination of As, B, Bi, W and Sn, considerable contamination of Cu, Pb, Zn and Ag, moderate contamination of Cd, Co, Sb and Ti. As and W gave the highest values (24.70 and 41.27, respectively). The above ten elements also exhibited higher contamination in the top soils of the residential area, with considerable contamination of As, Cd, Pb, B, Bi, W and Sn and moderate contamination of Cu, Co, Sb and Ti. Meanwhile, Ag caused various degrees of contamination in the top soils ranging from moderate to considerable contamination. Other elements Ni, V, Cr, Mo exhibit low contamination in all sampling points, indicating their lithogenic sources. The integrated pollution indices (IPIs) analysis showed four different classes of all the sites. Sites TY-1 and TY-3 near the mining area had the highest IPI (>3). Site TY-11 also had relatively high IPI. Soils taken from the residential area (TY-7) and along the downstream near the mine (TY-4) were both heavily polluted. The rest sites (TY-5 and TY-6) in the residential area and the other samples (TY-8 and TY-10) collected from low hilly area all showed moderate pollution of metals and metalloids.

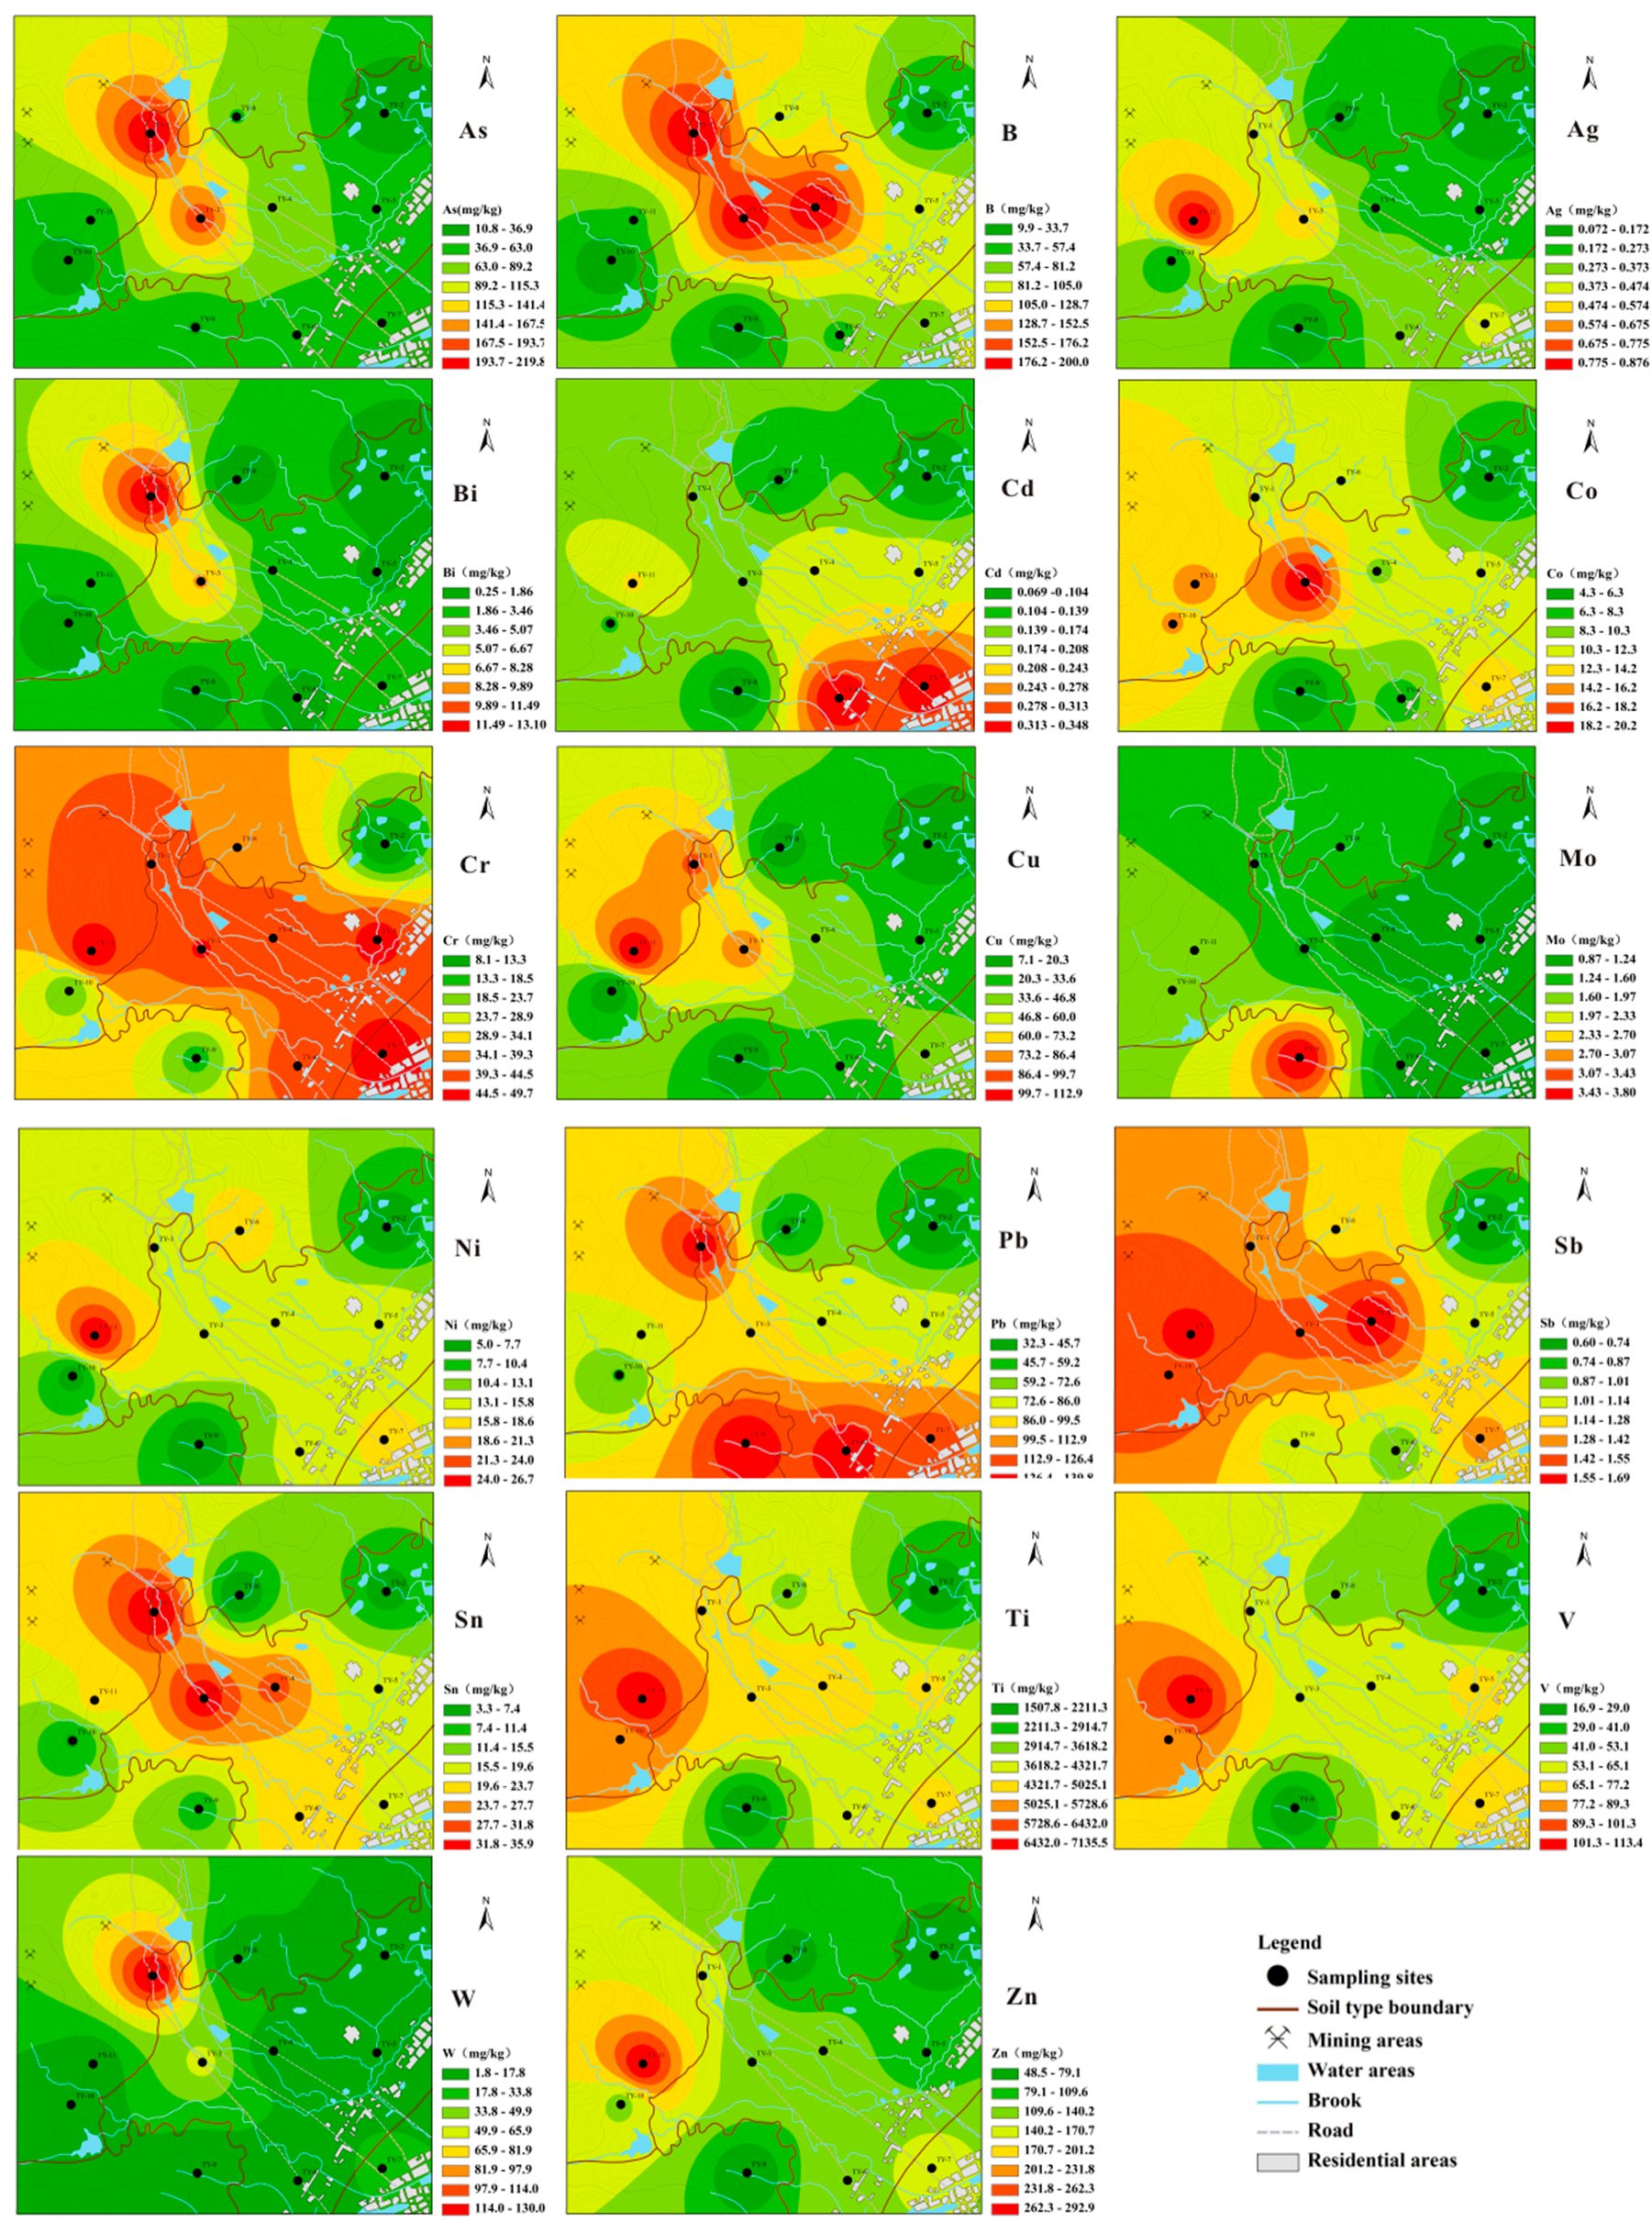
3.2.2. EF Values and Spatial Distribution of Metals and Metalloids in Top Soils

Table 1 shows the EF values of the metals and metalloids in the top soils. Figure 3 displays their spatial distribution maps, where red colors represent higher concentrations and green colors indicate lower concentrations. According to the metal enrichment factors, the top soils in this area showed significant enrichment of As and W, and moderate enrichment of Bi, B, Sn, Cd and Pb, with a descending order of As > W > Bi > B > Sn > Cd > Pb. Notably, the EF values of these metals differed with sample sites, indicating multiple sources. However, As, Bi, W, B, Cu, Pb and Sn showed a very similar spatial pattern (Figure 3), with the higher concentrations found in the mining area and decreasing along the river watershed, representing their release from the mining activities and migration in surface waters. For Pb, another concentration hotspot was also found in the residential area with a uniform concentration pattern along the major roads. The metal Cd was also prone to be concentrated in the residential area.
The metals Ni, Cr, Mo and V exhibited depletion to minimal enrichment over all the studied area, suggesting their lithogenic sources, such as soil texture and pedogenesis in the study area. The metal Mo, produced by a unique source, also showed a unique spatial pattern in the soils with the highest concentration located in the west-north areas, which were characterized geomorphologically as alluvial deposits at the lowest altitudes in the study area.

3.3. Source Identification by Multivariate Statistical Analysis

3.3.1. Principle Component Analysis

Table 4 shows the Principle Component Analysis (PCA) results determined on the basis of the total concentration of the investigated elements in the top soils. The first four principle components (PCs) account for 88.6% of the total variance in the data and were retained for further analysis. Principle component 1 (PC1), explaining 34.2% of the variance, dominated by V, Ti, Zn, Ag, Ni, Sb, Cu and Co, which were identified as lithogenic sources. Principle component 2 (PC2), which has highly positive loading of As, Bi, W, B, Sn and moderate positive loading of Cu and Pb accounts for 27.7% of the variance, which were similarly attributed to mining activities. Copper indicated a mixed source from both lithogenic and anthropogenic input, with moderately correlation to PC1. Principle component 3 (PC3) has highly positive loading of Cd, P, Pb and Cr and accounts for 17.2% of the variance, represented as agricultural sources. Mo is isolated in the fourth component (9.4% of the variance) and highly negatively loaded on PC4.

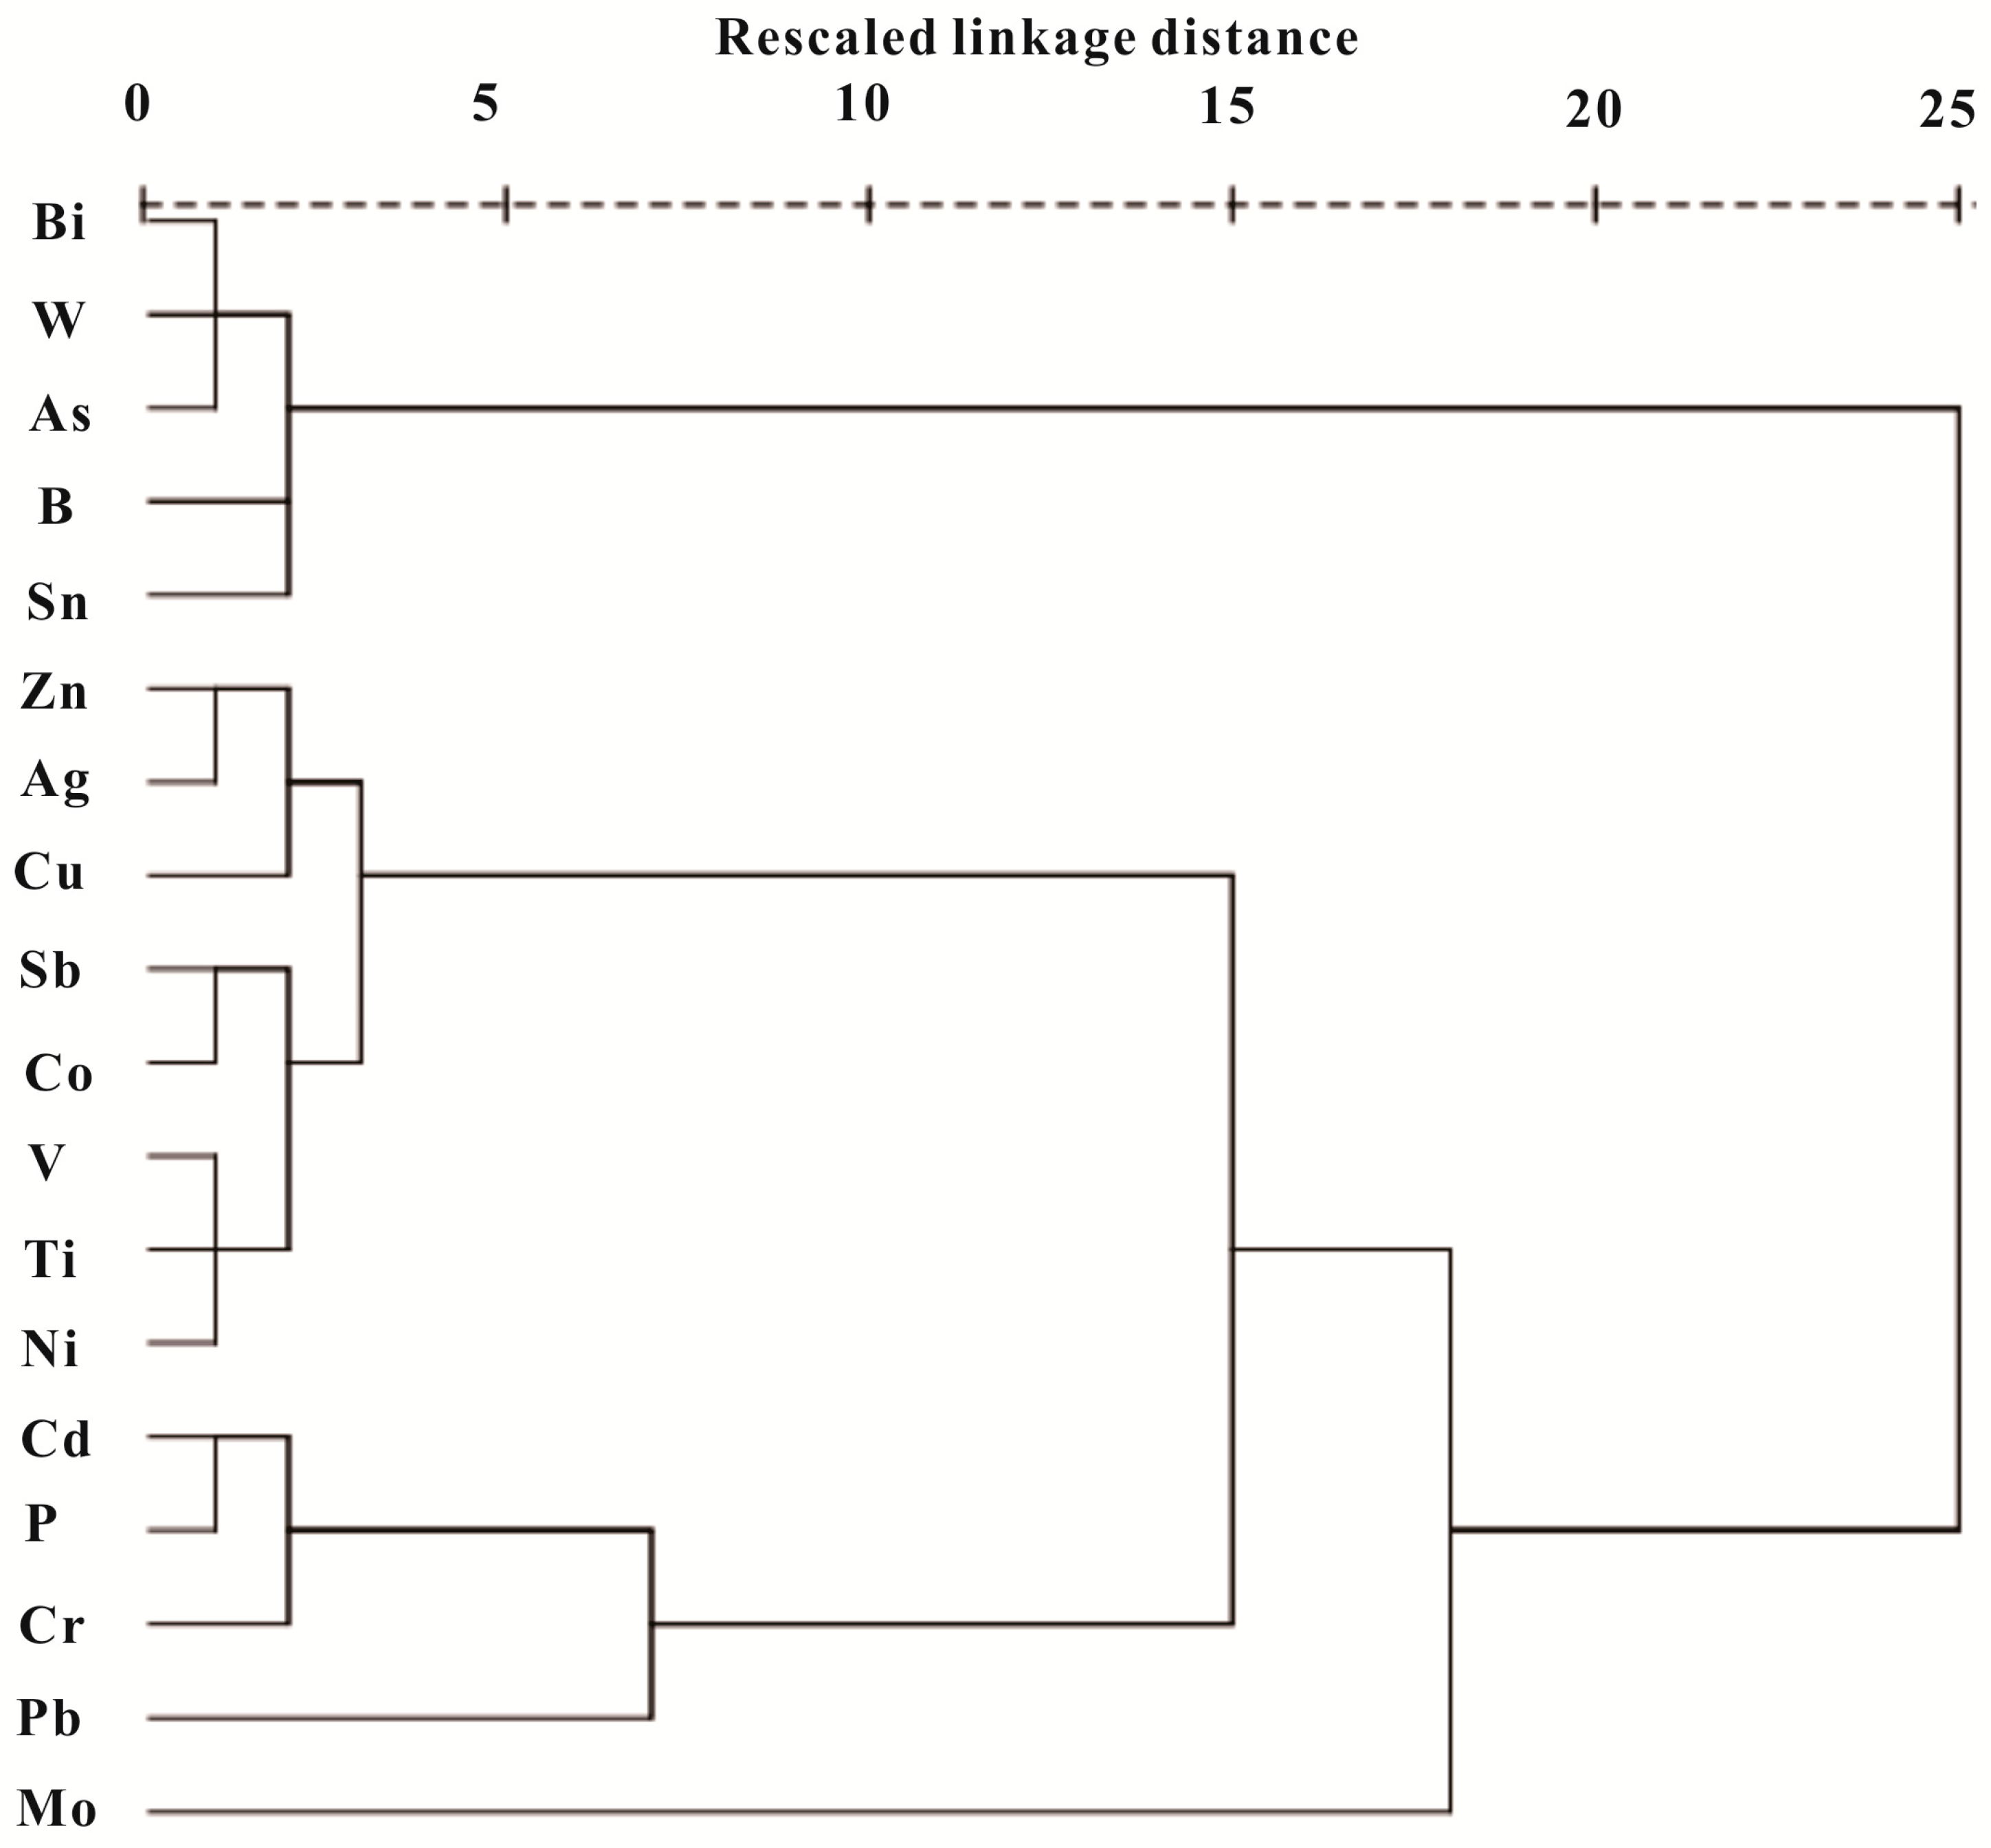
3.3.2. Cluster Analysis Results

Cluster analysis was also performed using the Ward method to identify similarities in concentrations between the 17 metals and the element P. These elements can be grouped into four main clusters in the dendrogram shown in Figure 4. Cluster 1 included the elements Bi, W, As, B, and Sn that had previously been interpreted as anthropogenic elements ascribed to former uncontrolled mining activities in this region. Cluster 2 contained Zn, Ag, Cu, Sb, Co, V, Ti and Ni, which were also identified as lithogenic sources in the above section. The elements in Cluster 3 including Cd, P, Cr and Pb were mainly related with the intense anthropogenic activities in this area. There was only Mo contained in Cluster 4, implying a different nature source with the ones in Cluster 2, indicated its unique source.

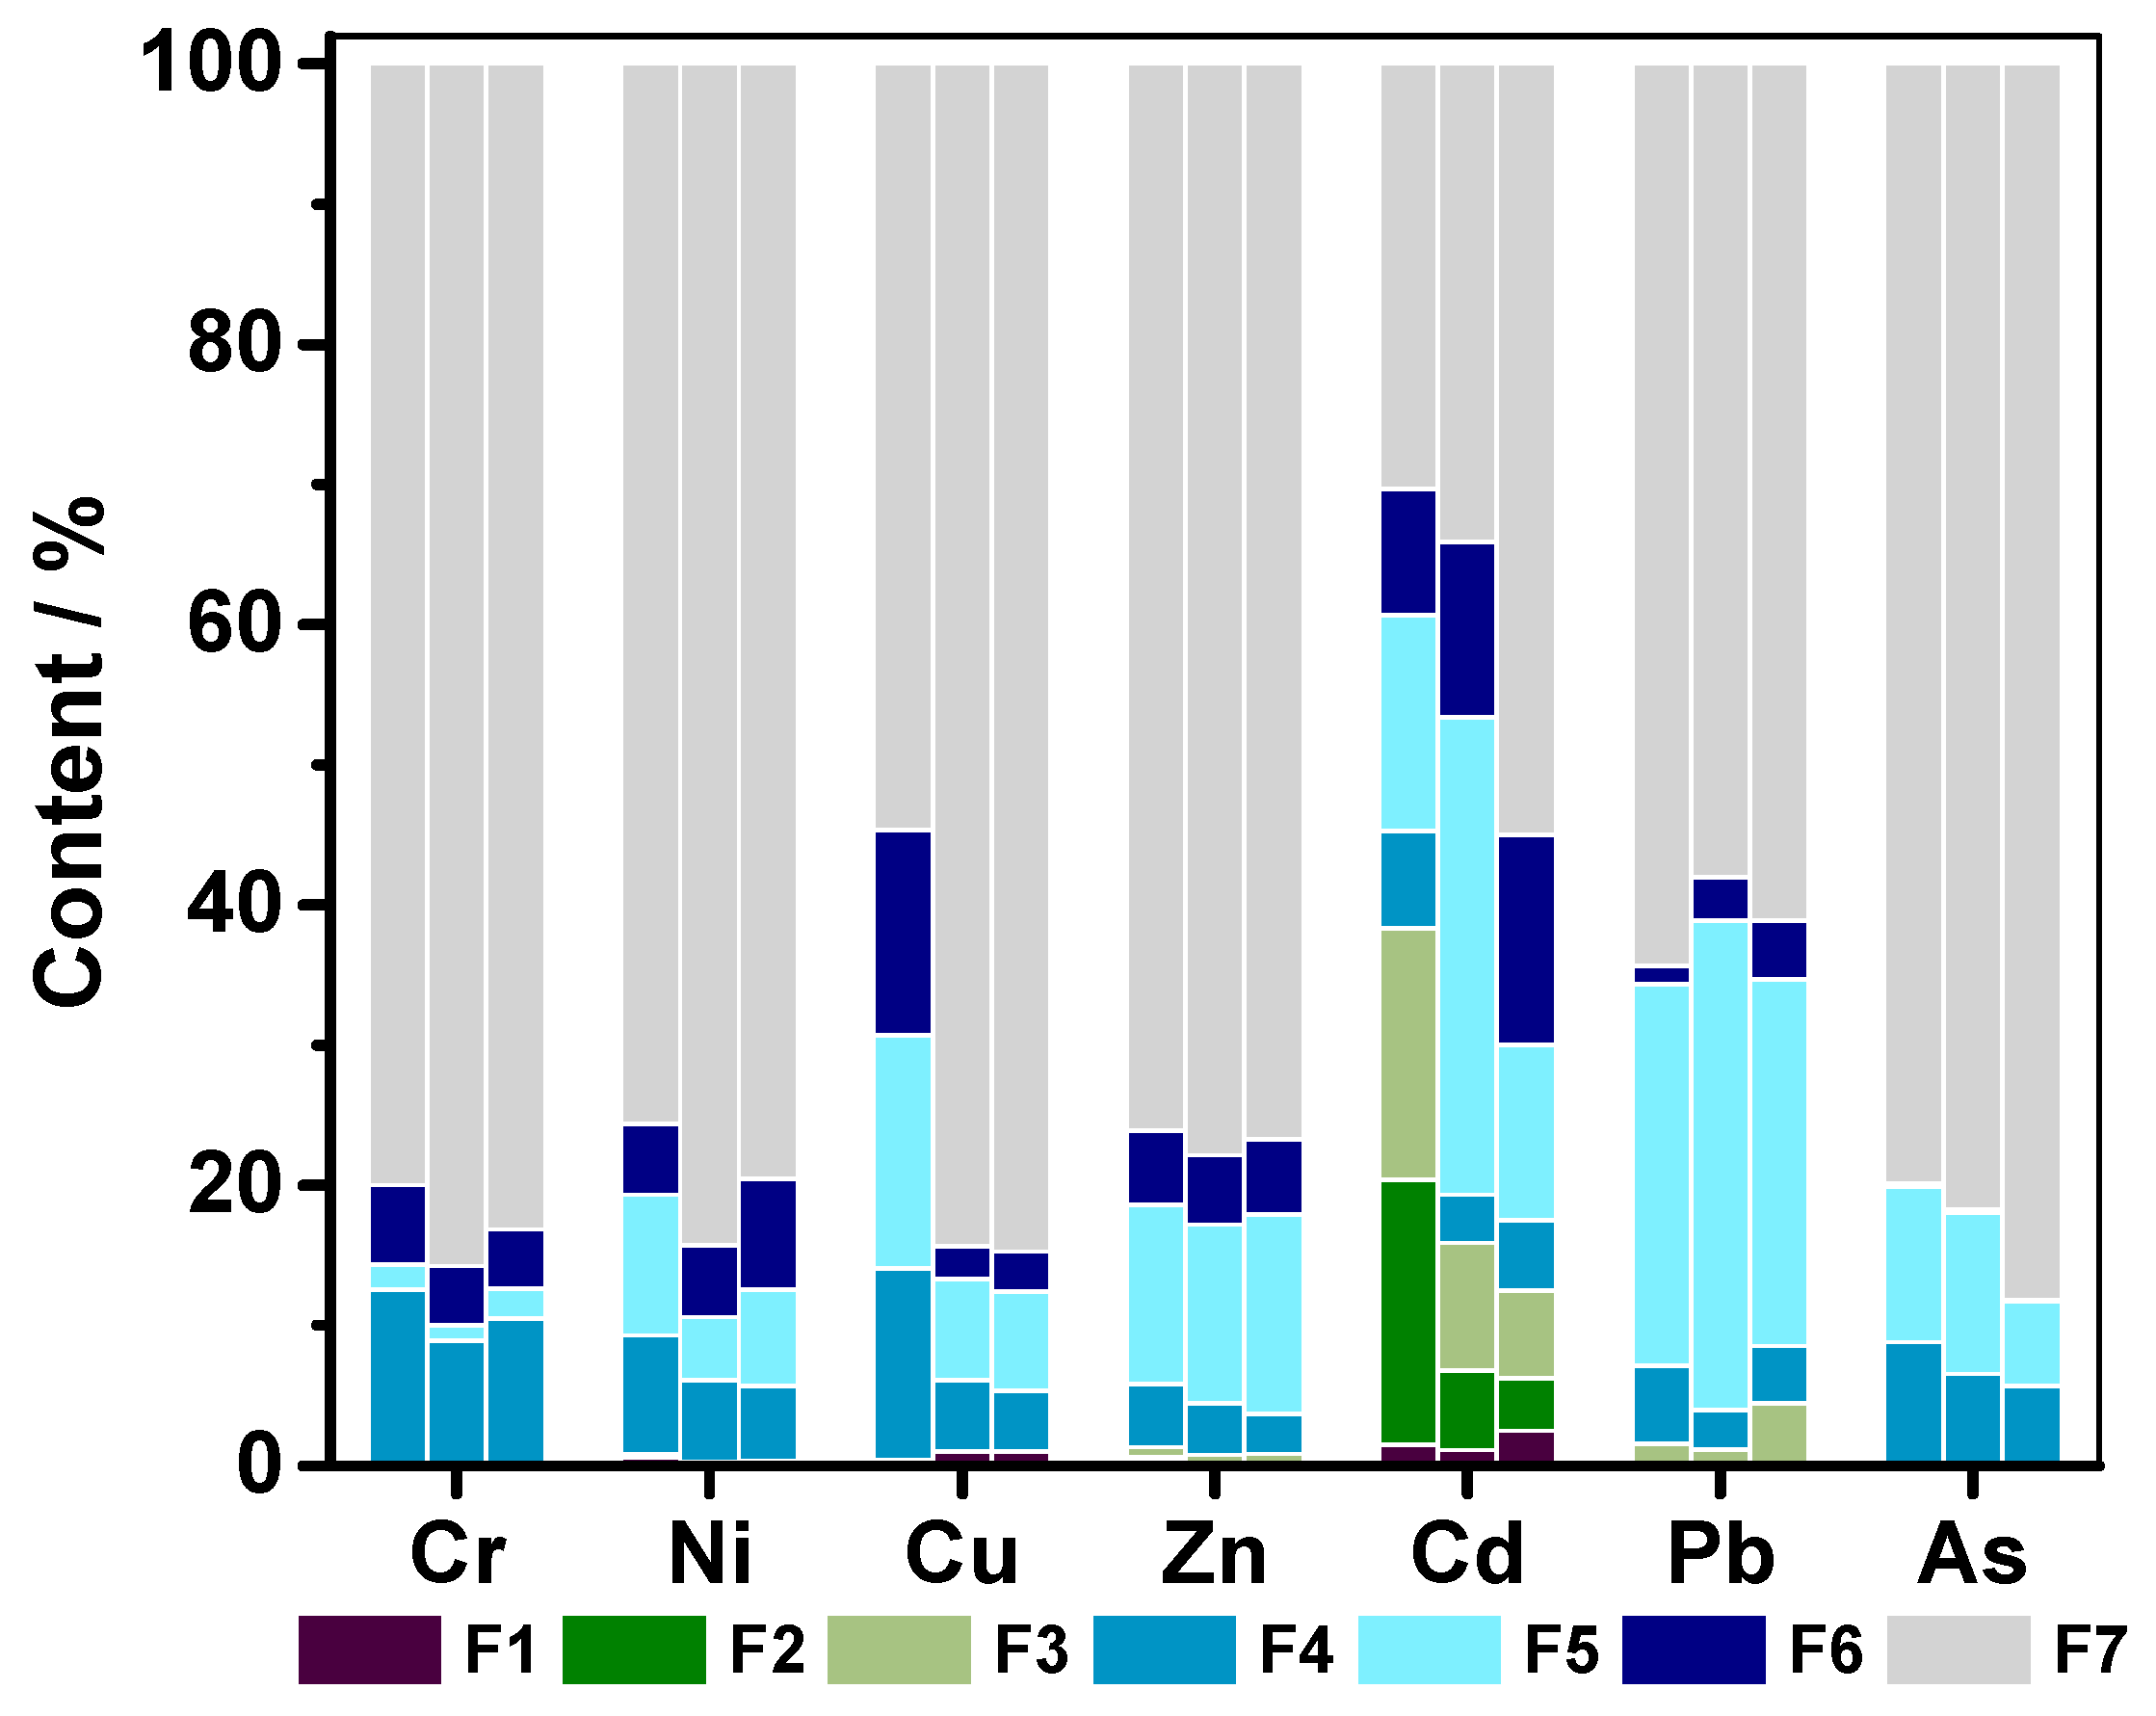
3.4. Chemical Fractionations of Toxic Elements in Three Different Layer Soils

This study investigated the chemical fractionation of the soil pollutant including Cr, Ni, Cu, Zn, Cd, Pb and As, which were found relatively highly enriched in the soils from the studied area. The results are depicted in Figure 5 and each fraction was indicated as a percentage of the sum of all the fractions.
The majority of Cr, Ni, Zn and As was present in the residual fraction (70–88% of the total concentration) in the three different layer of soils. Besides, appreciable amounts of Cu were determined by residual fraction both in the soils of B and C horizon. In top soils, the concentration of Cu in residual fraction accounted for 51.17%, reduced 34.28% compared with the percentage in subsoils. In contrast, the humic acid-bound, Fe and Mn oxide-bound concentration and refractory organic matter-bound of this metal increased from 5.18%, 7.30%, 2.36% in subsoils to 12.78%, 15.58% and 13.7% in top soils, respectively, indicating the strong sorption of Cu to Fe and Mn oxide and organic matter in an oxidizing environment [42]. Pb were mainly presented in the residual fraction (57.89–62.39%) and followed by Fe-Mn oxide-bound fraction (26.04–35.95%) in the soils at every layer. A higher residual fraction concentration of Cd was only found in the deepest soils and decreased with depth. Notably, the concentration of Cd in the first four fractions reach up to 40.62% in top soils, which were considered as mobile and bioavailable ones [43,44]. It can be concluded that this metal has strongly with anthropogenic source in this study area and was prone to transfer from soils to crops and underground water.

4. Discussion

4.1. Soil Contaminant Risks and Sources

The principal contaminants in the mining area were all in agreement with the mineralogy of the site, and a review reported that the elements of As, Cd, Cr, Cu, Ni, Pb and Zn were prone to enrichment in the soils from the tungsten mining area [19]. Similarly, the contents of the above elements were all elevated in the soils of the studied abandoned tungsten mining area. The situations of As, Cu, Pb, and Cd were more worse in this mining area, due to tact most of their concentrations were above the maximum permitted levels for agricultural soils in China [39]. Dudka and Miller [45] highlighted the arsenic exposure risk to organisms when its concentration exceeds 40 mg/kg. However, the results from this study showed that approximately 73% of the soils were higher than the above permitted level. The lead levels in this area could be considered safe since the highest concentration in sites was below the safe level of 300 ppm [46]. The Cd levels in the residential area were above the permitted levels, with a large amount of mobile and bioavailable forms.
Mining activities have been extensively reported as a major source for metals and arsenic in local soils [43,47,48,49]. In the soils of this studied area, the hotspots of the elements As, Bi, W, B, Sn, Pb and Cu were found to correlate well with the spread of mining and processing activities. Furthermore, the cluster analysis results only confirmed the common source of first five elements but not for the last two ones, although the moderate positive loading of Pb and Cu in PC2 and the moderate correlations with W could also show their sources from the mining activities. Another group of anthropogenic elements, including Cd, P, Pb and Cr, should be attributed to intense anthropogenic activities, with concentration hotspots in the residential area. Table S3 showed the higher contents of Pb, Cd, Cr, and P in one of the phosphorus fertilizer collected from the local market. Thus, the above elements were primarily associated with intense application of phosphorus fertilizer, proved in previous works [28,41,50,51,52,53,54]. The abusing of fertilizers and manure elevated the content of Cr in the surface soils of residential areas [55]. The enrichment of Pb in this region was also highly related with traffic emissions, with higher enrichment in the top soils along the national highway, and a marked deposit in the hilly area down the wind.
The natural source elements were also grouped into two categories by the integrated methods. The first one including the elements of V, Ti, Zn, Ag, Ni, Sb, Cu and Co, were highly influenced by soil texture and pedogenesis in the study area. Granite weathering profiles characterized by a high content of oxide Al and Fe clay minerals are widespread in Southern China [56]. Due to the high affinity and adsorption capacity of the above metals, clay minerals in the soils are mainly responsible for their distribution [57]. For instance, Ti always exists as ultrafine particles of TiO2 that are associated with the clay fraction or co-precipitate with iron oxy (hydro) oxides in soils [28,58]. As well-known siderophile elements, Co, Ni, Ti, V, Ag and Zn were prone to retention or enrichment in soils by adsorbing or incorporating in stable Fe oxides [59,60,61,62,63] and re more likely to be found in granite latosolic red soils which hold more micronutrients and water than sandy soils [41]. In addition, samples collected in TY-11 where the soil was lying directly on the in-situ weathered or decomposed rock exhibited the highest enrichment for V, Ti, Zn, Ag, Ni, Cu and Co and the second higher content for Sb compared with other sites, again confirmed their lithogenic origin. The other category only contained the metal of Mo with a content hotspot existing in the alluvial areas, indicating it derived from alluvial deposits.

4.2. Fate and Transport of the Metals and Metalloids

The fate and transport of metals and metalloids in the soils in this area were mainly dependent on their chemical forms and human activities. During a series of mining processes, the metals and metalloids co-existing with the target minerals, including As, Bi, W, B, Sn, Pb and Cu, always transfer into the atmospheric particulate matters, mining wastes and acid mine drainages. Naturally, these emitted atmospheric particulate matters were hardly delivered for a long distance and easily settled down near to the mining centers [64]. However, during the rainy season, the metals and metalloids in the wastes and settled particles along with the acid mine drainages could easily enter into the main drainage ditches. In this area, the Ji Changling Reservoir is still polluted by arsenic and showed higher Zn, Cu, Pb concentrations in the surface water than the other reservoir (seen in Figure S1 of the Supplementary Materials). Due to the long term irrigation, these metals and metalloids have caused higher accumulations in the downstream soils. Compared with others, arsenic is predominantly in anionic forms in the aquatic system, thus it produced a wider and higher pollution degree in the downstream region [65]. The abuse of application of phosphorus fertilizer, manure and pesticides has introduced Cd, Cr and Pb into the paddy soils. Furthermore, the crude recycling processes should be responsible for the distribution of Pb and As in the soils from residential area.
Once entered into the soils, these metals and metalloids are always fixed by iron (Fe) oxyhydroxides, carbonates and soil organic matters, and then transferred into different chemical forms with varying bioavailability, mobility and toxicity [17]. According to the sequential extraction results, the binding with humic acids, Fe and Mn oxides and refractory organic matters are the main processes for Cr, Ni, Cu, Zn retained in the studied soils. Carbonates also play an important role to fix Cd and Pb, except for the above three main bonding processes. Among them, the concentrations of the water soluble and exchangeable species of Cd were detected in all three layers of soils, which are easily transported and absorbed by organisms and thereby pose a high hazard potential to the environment [66]. Arsenic could be easily adsorbed by humic acids and Fe and Mn oxides due to its acid ion forms. However, the fixation process became weaker with the deeper of the soil layers, attributed to the weaker affiliation of reduced As species on these active surfaces which is the predominant forms in the reducing conditions.

4.3. Remediation and Reclaim Implementations

The contaminants of Cd, As and Pb should be taken into consideration as the target elements for the regulatory authorities to implement remediation strategies, based on the assessment of the type and level of contamination in the studied soils. Source control and containment remedies are the two main technologies to remediate or to reclaim the contaminated soils [67]. The intense anthropogenic activities are still active sources for Pb and Cd into the soils, thus, the fertilizer should be properly used. Furthermore, the regulatory authorities should enhance the monitoring for the local metal recycling factories to eliminate fresh emissions of Pb and As. Furthermore, the appropriate remediation treatment approach should be proposed to reduce the bioavailability of Cd. Effective amendments of lime or fly ashes from thermal power plants for the immobilization of Cd could be suitable for the contaminated paddy soils [68] and hyperaccumulating plants, such as Thlaspi caerulescens and Arabidopsis halleri with higher accumulation for Cd, could be used to reclaim the wasteland [69]. Soil aging (natural attenuation) effectively transferred most bioavailable fractions of As into the residual ones, due to its historical and discontinuous origin [70]. Thus, a remediation approach is not an urgent need in the paddy soils, but should be implemented at the mining site due to the severe contamination caused by arsenic. The irrigation with the local surface water should be forbidden until the quality of the water body reaches the permitted level.

5. Conclusions

The distributions, sources, and pathways of 17 metal(loid)s in soils surrounding an abandoned tungsten mine were investigated. The Integrated Pollution Index (IPI) analysis showed four different classes of the sample sites in the study area: no pollution sites (TY-2 and TY-9), moderate pollution sites (TY-5, TY-6, TY-8 and TY-10), heavy pollution sites (TY-4, TY-7, and TY-11), and the extremely heavy pollution sites TY-1 and TY-3, with higher enrichment of W, significant enrichment of As, Bi, B, moderate enrichment of Cd, Cu, Pb, Zn, Ag. These elements were mainly originated from mineral paragenesis and ancient mining activities. The long term irrigation using polluted surface waters (Ji Changling Reservoir), have caused higher accumulation of these elements in the downstream agricultural soils. Compared with others, arsenic is more mobile, thus, it produced a wider and higher pollution in the downstream soils. The intense anthropogenic activities were responsible for the enrichment of Cd, Pb and Cr in the residential soils. Among them, Cd displayed higher mobility and was easily released into local soil and underground water which deserve more attention by the government when implementing remediation programs. The local small metal processing plants still emitted As into the surroundings and should be supervised. Heavy traffic and prevailing wind determined the deposition of Pb in top soils at TY-6, TY-7, and TY-9. Effective treatment should be used to immobilize As before reclaiming the soils around the mining site. Furthermore, alternative fertilizing methods and irrigation water sources are urgent needs to effectively reduce the input of Cd and As into the local soils.

Supplementary Materials

The following are available online at www.mdpi.com/1660-4601/14/12/1475/s1, Figure S1: The contents of metal(loid)s and in three surface waters and their maximum allowable concentrations (MAC) used for agricultural irrigation, Table S1. Sequential extraction methods for metal(loid)s in different depth soils from the study area, Table S2. Concentrations and enrichment factors (EFs) of metal(loid)s in top soils from the study area, Table S3. Major constituents (mg/kg) of the common chemical fertilizers and pesticides from the study area, Table S4. Total concentrations of trace elements in three different soil layers. Table S1 details the steps and conditions of the sequential extraction used to analyze the fractions of various metals in soils. The concentrations of the investigated elements including Cr, Ag, B, Bi, Co, Mo, Sb, Ti, V, W, and Sn in top soils are shown in Table S2. Table S3 shows the contents of Pb, Cd, Cr, and P in the phosphorus fertilizer and pesticides collected from the local market. Figure S1 shows the contents of metal(loid)s in three surface waters and their maximum allowable concentrations (MAC) in water used for agricultural irrigation.

Acknowledgments

The authors are grateful to the courtesy support provided by School of Environmental Studies, China University of Geosciences and the financial support provided by the National Natural Science Foundation of China (No. 41072023).

Author Contributions

Shenggao Cheng, Li Guo and Weituo Zhao designed the study and the original idea; Li Guo, Weituo Zhao, Xiaowen Gu, Xinyun Zhao and Juan Chen collected data; Li Gu, Shenggao Cheng, Xinyun Zhao wrote the manuscript; Li Guo, Weituo Zhao, Xiaowen Gu interpret the data; Shenggao Cheng, Li Guo, Weituo Zhao, Xiaowen Gu, Xinyun Zhao and Juan Chen approve final version.

Conflicts of Interest

The authors declare no conflict of interest.

References

  1. Chen, R.; Sherbinin, A.D. China’s Soil Pollution: Farms on the Frontline. Science 2014, 344, 691. [Google Scholar] [CrossRef] [PubMed]
  2. Pourret, O.; Lange, B.; Bonhoure, J.; Colinet, G.; Decrée, S.; Mahy, G.; Séleck, M.; Shutcha, M.; Faucon, M.P. Assessment of soil metal distribution and environmental impact of mining in Katanga (Democratic republic of Congo). Appl. Geochem. 2016, 64, 43–55. [Google Scholar] [CrossRef]
  3. Kouchou, A.; Rais, N.; Elsass, F.; Duplay, J.; Fahli, N.; Ghachtouli, N.E.L. Effects of long-term heavy metals contamination on soil microbial characteristics in calcareous agricultural lands (Saiss plain, North Morocco). J. Mater. Environ. Sci. 2017, 8, 691–695. [Google Scholar]
  4. Tume, P.; González, E.; King, R.W.; Cuitiño, L.; Roca, N.; Bech, J. Distinguishing between natural and anthropogenic sources for potentially toxic elements in urban soils of talcahuano, Chile. J. Soils Sediments 2017, 1–15. [Google Scholar] [CrossRef]
  5. Zhou, J.; Feng, K.; Pei, Z.; Meng, F.; Sun, J. Multivariate analysis combined with GIS to source identification of heavy metals in soils around an abandoned industrial area, eastern China. Ecotoxicology 2016, 25, 380–388. [Google Scholar] [CrossRef] [PubMed]
  6. Wiseman, C.L.; Zereini, F.; Puttmann, W. Metal and metalloid accumulation in cultivated urban soils: A medium-term study of trends in Toronto, Canada. Sci. Total Environ. 2015, 538, 564–572. [Google Scholar] [CrossRef] [PubMed]
  7. Rosolen, V.; De-Campos, A.B.; Govone, J.S.; Rocha, C. Contamination of wetland soils and floodplain sediments from agricultural activities in the cerrado biome (state of Minas Gerais, Brazil). Catena 2015, 128, 203–210. [Google Scholar] [CrossRef]
  8. Monterroso, C.; Rodríguez, F.; Chaves, R.; Diez, J.; Becerra-Castro, C.; Kidd, P.S.; Macías, F. Heavy metal distribution in mine-soils and plants growing in a Pb/Zn-mining area in NW Spain. Appl. Geochem. 2014, 44, 3–11. [Google Scholar] [CrossRef]
  9. Liu, G.; Tao, L.; Liu, X.; Hou, J.; Wang, A.; Li, R. Heavy metal speciation and pollution of agricultural soils along Jishui river in non-ferrous metal mine area in Jiangxi province, China. J. Geochem. Explor. 2013, 132, 156–163. [Google Scholar] [CrossRef]
  10. Ettler, V. Soil contamination near non-ferrous metal smelters: A review. Appl. Geochem. 2016, 64, 56–74. [Google Scholar] [CrossRef]
  11. Marrugo, N.J.; Pinedo, H.J.; Diez, S. Assessment of heavy metal pollution, spatial distribution and origin in agricultural soils along the Sinu River Basin, Colombia. Environ. Res. 2017, 154, 380–388. [Google Scholar] [CrossRef] [PubMed]
  12. Miler, M.; Gosar, M. Characteristics and potential environmental influences of mine waste in the area of the closed mežica Pb-Zn mine (Slovenia). J. Geochem. Explor. 2012, 112, 152–160. [Google Scholar] [CrossRef]
  13. Acosta, J.A.; Faz, A.; Martínez-Martínez, S.; Zornoza, R.; Carmona, D.M.; Kabas, S. Multivariate statistical and GIS-based approach to evaluate heavy metals behavior in mine sites for future reclamation. J. Geochem. Explor. 2011, 109, 8–17. [Google Scholar] [CrossRef]
  14. Zhou, J.M.; Dang, Z.; Cai, M.F.; Liu, C.Q. Soil heavy metal pollution around the Dabaoshan mine, Guangdong province, China. Pedosphere 2007, 17, 588–594. [Google Scholar] [CrossRef]
  15. Courtin, N.A.; Waltzing, T.; Evrard, C.; Soubrand, M.; Lenain, J.-F.; Ducloux, E.; Ghorbel, S.; Grosbois, C.; Bril, H. Arsenic and lead mobility: From tailing materials to the aqueous compartment. Appl. Geochem. 2016, 64, 10–21. [Google Scholar] [CrossRef]
  16. Ji, K.; Kim, J.; Lee, M.; Park, S.; Kwon, H.J.; Cheong, H.K.; Jang, J.Y.; Kim, D.S.; Yu, S.; Kim, Y.W.; et al. Assessment of exposure to heavy metals and health risks among residents near abandoned metal mines in Goseong, Korea. Environ. Pollut. 2013, 178, 322–328. [Google Scholar] [CrossRef] [PubMed]
  17. Wuana, R.A.; Okieimen, F.E. Heavy metals in contaminated soils: A review of sources, chemistry, risks and best available strategies for remediation. ISRN Ecol. 2011, 2011, 402647. [Google Scholar] [CrossRef]
  18. Liu, C.P.; Luo, C.L.; Gao, Y.; Li, F.B.; Lin, L.W.; Wu, C.A.; Li, X.D. Arsenic contamination and potential health risk implications at an abandoned tungsten mine, southern China. Environ. Pollut. 2010, 158, 820–826. [Google Scholar] [CrossRef] [PubMed]
  19. Li, Z.; Ma, Z.; van der Kuijp, T.J.; Yuan, Z.; Huang, L. A review of soil heavy metal pollution from mines in China: Pollution and health risk assessment. Sci. Total Environ. 2014, 468–469, 843–853. [Google Scholar] [CrossRef] [PubMed]
  20. IUSS Working Group WRB. World Reference Base for Soil Resources 2014; World Soil Resources Reports 106; Food and Agriculture Organization: Rome, Italy, 2015; pp. 1–203. [Google Scholar]
  21. China Geological Survey (CGS). Technical Requirements for the Sample Analysis Used for Eco-Geochemical Assessment; DD2005-03, Appendix A; CGS: Beijing, China, 2005; pp. 24–32.
  22. Tessier, A.; Campbell, P.G.C.; Bisson, M. Sequential extraction procedure for the speciation of particulate trace metals. Anal. Chem. 1979, 51, 844–851. [Google Scholar] [CrossRef]
  23. Boruvka, L.; Kozak, J.; Kristoufkova, S.; Huan, W.C. Speciation of cadmium, lead and zinc in heavy polluted soils. Rostlinna Vyroba 1997, 43, 187–192. [Google Scholar]
  24. Mico, C.; Recatala, L.; Peris, M.; Sanchez, J. Assessing heavy metal sources in agricultural soils of an european mediterranean area by multivariate analysis. Chemosphere 2006, 65, 863–872. [Google Scholar] [CrossRef] [PubMed]
  25. Liu, G.; Yu, Y.; Hou, J.; Xue, W.; Liu, X.; Liu, Y.; Wang, W.; Alsaedi, A.; Hayat, T.; Liu, Z. An ecological risk assessment of heavy metal pollution of the agricultural ecosystem near a lead-acid battery factory. Ecol. Indic. 2014, 47, 210–218. [Google Scholar] [CrossRef]
  26. China National Environmental Monitoring Centre (CNEMC). The Background Values of Chinese Soils; Environmental Science Press of China: Beijing, China, 1990. [Google Scholar]
  27. Hakanson, L. An ecological risk index for aquatic pollution control. A sedimentological approach. Water Res. 1980, 14, 975–1001. [Google Scholar] [CrossRef]
  28. Darwish, M.A.G.; Pöllmann, H. Trace element assessment in agricultural and desert soils of Aswan area, south Egypt: Geochemical characteristics and environmental impacts. J. Afr. Earth Sci. 2015, 112, 358–373. [Google Scholar] [CrossRef]
  29. Suresh, G.; Sutharsan, P.; Ramasamy, V.; Venkatachalapathy, R. Assessment of spatial distribution and potential ecological risk of the heavy metals in relation to granulometric contents of Veeranam lake sediments, India. Ecotoxicol. Environ. Saf. 2012, 84, 117–124. [Google Scholar] [CrossRef] [PubMed]
  30. Reimann, C.; Caritat, P.D. Intrinsic flaws of element enrichment factors (EFs) in environmental geochemistry. Environ. Sci. Technol. 2000, 34, 5084–5091. [Google Scholar] [CrossRef]
  31. Rashed, M.N. Monitoring of contaminated toxic and heavy metals, from mine tailings through age accumulation, in soil and some wild plants at southeast Egypt. J. Hazard. Mater. 2010, 178, 739–746. [Google Scholar] [CrossRef] [PubMed]
  32. Hu, Y.; Liu, X.; Bai, J.; Shih, K.; Zeng, E.Y.; Cheng, H. Assessing heavy metal pollution in the surface soils of a region that had undergone three decades of intense industrialization and urbanization. Environ. Sci. Pollut. Res. 2013, 20, 6150–6159. [Google Scholar] [CrossRef] [PubMed]
  33. Cai, L.; Xu, Z.; Bao, P.; He, M.; Dou, L.; Chen, L.; Zhou, Y.; Zhu, Y.G. Multivariate and geostatistical analyses of the spatial distribution and source of arsenic and heavy metals in the agricultural soils in Shunde, southeast China. J. Geochem. Explor. 2015, 148, 189–195. [Google Scholar] [CrossRef]
  34. Lantzy, R.J.; Mackenzie, F.T. Atmospheric trace metals: Global cycles and assessment of man’s impact. Geochim. Cosmochim. Acta 1979, 43, 511–525. [Google Scholar] [CrossRef]
  35. Blaser, P.; Zimmermann, S.; Luster, J.; Shotyk, W. Critical examination of trace element enrichments and depletions in soils: As, Cr, Cu, Ni, Pb, and Zn in Swiss forest soils. Sci. Total Environ. 2000, 249, 257–280. [Google Scholar] [CrossRef]
  36. Xie, Y.; Chen, T.B.; Lei, M.; Yang, J.; Guo, Q.J.; Song, B.; Zhou, X.Y. Spatial distribution of soil heavy metal pollution estimated by different interpolation methods: Accuracy and uncertainty analysis. Chemosphere 2011, 82, 468–476. [Google Scholar] [CrossRef] [PubMed]
  37. Ha, H.; Olson, J.R.; Bian, L.; Rogerson, P.A. Analysis of heavy metal sources in soil using Kriging interpolation on principal components. Environ. Sci. Technol. 2014, 48, 4999–5007. [Google Scholar] [CrossRef] [PubMed]
  38. Webster, R.; Oliver, M.A. Geostatistics for Environmental Scientists Statistics in Practice; Wiley: Chichester, UK, 2001; p. 271. [Google Scholar]
  39. Li, W.; Xu, B.; Song, Q.; Liu, X.; Xu, J.; Brookes, P.C. The identification of ‘hotspots’ of heavy metal pollution in soil-rice systems at a regional scale in eastern China. Sci. Total Environ. 2014, 472, 407–420. [Google Scholar] [CrossRef] [PubMed]
  40. Chinese Environmental Protection Administration (CEPA). Environmental Quality Standard for Soils; GB15618-2008, revised edition; CEPA: Beijing, China, 2008.
  41. Guo, X.; Wang, K.; He, M.; Liu, Z.; Yang, H.; Li, S. Antimony smelting process generating solid wastes and dust: Characterization and leaching behaviors. J. Environ. Sci. 2014, 26, 1549–1556. [Google Scholar] [CrossRef] [PubMed]
  42. Kidd, P.S.; Domínguez-Rodríguez, M.J.; Díez, J.; Monterroso, C. Bioavailability and plant accumulation of heavy metals and phosphorus in agricultural soils amended by long-term application of sewage sludge. Chemosphere 2007, 66, 1458–1467. [Google Scholar] [CrossRef] [PubMed]
  43. Chai, Y.; Guo, J.; Chai, S.; Cai, J.; Xue, L.; Zhang, Q. Source identification of eight heavy metals in grassland soils by multivariate analysis from the Baicheng-Songyuan area, Jilin province, northeast China. Chemosphere 2015, 134, 67–75. [Google Scholar] [CrossRef] [PubMed]
  44. Chen, T.; Liu, X.; Zhu, M.; Zhao, K.; Wu, J.; Xu, J.; Huang, P. Identification of trace element sources and associated risk assessment in vegetable soils of the urban-rural transitional area of Hangzhou, China. Environ. Pollut. 2008, 151, 67–78. [Google Scholar] [CrossRef] [PubMed]
  45. Dudka, S.; Miller, W.P. Permissible concentrations of arsenic and lead in soils based on risk assessment. Water Air Soil Pollut. 1999, 113, 127–132. [Google Scholar] [CrossRef]
  46. Rosen, C.J. Lead in the Home Garden and Urban Soil Environment, Communication and Educational Technology Services; University of Minnesota Extension: St. Paul, MN, USA, 2002. [Google Scholar]
  47. Šajn, R.; Gosar, M. Multivariate statistical approach to identify metal sources in Litija area (Slovenia). J. Geochem. Explor. 2014, 138, 8–21. [Google Scholar] [CrossRef]
  48. Kelepertzis, E. Accumulation of heavy metals in agricultural soils of Mediterranean: Insights from Argolida basin, Peloponnese, Greece. Geoderma 2014, 221–222, 82–90. [Google Scholar] [CrossRef]
  49. Chandrasekaran, A.; Ravisankar, R. Spatial distribution of physico-chemical properties and function of heavy metals in soils of Yelagiri hills, Tamilnadu by energy dispersive X-ray florescence spectroscopy (EDXRF) with statistical approach. Spectrochim. Acta Part A 2015, 150, 586–601. [Google Scholar] [CrossRef] [PubMed]
  50. Ağca, N.; Özdel, E. Assessment of spatial distribution and possible sources of heavy metals in the soils of Sariseki-Dörtyol District in Hatay Province (Turkey). Environ. Earth Sci. 2014, 71, 1033–1047. [Google Scholar] [CrossRef]
  51. Cai, L.; Xu, Z.; Ren, M.; Guo, Q.; Hu, X.; Hu, G.; Wan, H.; Peng, P. Source identification of eight hazardous heavy metals in agricultural soils of Huizhou, Guangdong province, China. Ecotoxicol. Environ. Saf. 2012, 78, 2–8. [Google Scholar] [CrossRef] [PubMed]
  52. Nicholson, F.A.; Smith, S.R.; Alloway, B.J.; Carlton, S.C.; Chambers, B.J. An inventory of heavy metals inputs to agricultural soils in England and Wales. Sci. Total Environ. 2003, 311, 205–219. [Google Scholar] [CrossRef]
  53. Bourennane, H.; Douay, F.; Sterckeman, T.; Villanneau, E.; Ciesielski, H.; King, D.; Baize, D. Mapping of anthropogenic trace elements inputs in agricultural topsoil from northern france using enrichment factors. Geoderma 2010, 157, 165–174. [Google Scholar] [CrossRef]
  54. Cheraghi, M.; Lorestani, B.; Merrikhpour, H. Investigation of the effects of phosphate fertilizer application on the heavy metal content in agricultural soils with different cultivation patterns. Biol. Trace Elem. Res. 2012, 145, 87–92. [Google Scholar] [CrossRef] [PubMed]
  55. Wang, H.; Dong, Y.; Yang, Y.; Toor, G.S.; Zhang, X. Changes in heavy metal contents in animal feeds and manures in an intensive animal production region of China. J. Environ. Sci. 2013, 25, 2435–2442. [Google Scholar] [CrossRef]
  56. Lan, H.X.; Hu, R.L.; Yue, Z.Q.; Lee, C.F.; Wang, S.J. Engineering and geological characteristics of granite weathering profiles in south China. J. Asian Earth Sci. 2003, 21, 353–364. [Google Scholar] [CrossRef]
  57. Carvalho Filho, A.D.; Inda, A.V.; Fink, J.R.; Curi, N. Iron oxides in soils of different lithological origins in Ferriferous Quadrilateral (Minas Gerais, Brazil). Appl. Clay Sci. 2015, 118, 1–7. [Google Scholar] [CrossRef]
  58. Bech, J.; Reverter, F.; Tume, P.; Sanchez, P.; Longan, L.; Bech, J.; Oliver, T. Pedogeochemical mapping of Al, Ba, Pb, Ti and V in surface soils of Barcelona province (Catalonia, NE Spain): Relationships with soil physicochemical properties. J. Geochem. Explor. 2011, 109, 26–37. [Google Scholar] [CrossRef]
  59. Tume, P.; Bech, J.; Longan, L.; Tume, L.; Reverter, F.; Sepulveda, B. Trace elements in natural surface soils in Sant Climent (Catalonia, Spain). Ecol. Eng. 2006, 27, 145–152. [Google Scholar] [CrossRef]
  60. Dankoub, Z.; Ayoubi, S.; Khademi, H.; Lu, S.G. Spatial distribution of magnetic properties and selected heavy metals in calcareous soils as affected by land use in the Isfahan region, central Iran. Pedosphere 2012, 22, 33–47. [Google Scholar] [CrossRef]
  61. McQueen, K.G.; Scott, K.M. Rock weathering and structure of regolith. Regolith Sci. 2008, 1, 105–126. [Google Scholar]
  62. Taylor, G.; Eggleton, R.A. Regolith Geology and Geomorphology; Wiley: Chichester, UK, 2001. [Google Scholar]
  63. Rath, P.; Panda, U.C.; Bhatta, D.; Sahu, K.C. Use of sequential leaching, mineralogy, morphology and multivariate statistical technique for quantifying metal pollution in highly polluted aquatic sediments—A case study: Brahmani and Nandira Rivers, India. J. Hazard. Mater. 2009, 163, 632–644. [Google Scholar] [CrossRef] [PubMed]
  64. De la Campa, A.M.S.; Sánchez-Rodas, D.; Castanedo, Y.G.; Jesús, D. Geochemical anomalies of toxic elements and arsenic speciation in airborne particles from cu mining and smelting activities: Influence on air quality. J. Hazard. Mater. 2015, 291, 18–27. [Google Scholar] [CrossRef] [PubMed]
  65. Cullen, W.R.; Reimer, K.J. Arsenic speciation in the environment. Chem. Rev. 1989, 89, 713–764. [Google Scholar] [CrossRef]
  66. Wang, S.; Wang, Y.; Zhang, R.; Wang, W.; Xu, D.; Guo, J.; Li, P.; Yu, K. Historical levels of heavy metals reconstructed from sedimentary record in the Hejiang River, located in a typical mining region of southern China. Sci. Total Environ. 2015, 532, 645–654. [Google Scholar] [CrossRef] [PubMed]
  67. United States Environmental Protection Agency (EPA). Treatment Technologies for Site Cleanup: Annual Status Report, 12th ed.; EPA: Washington, DC, USA, 2007; p. 5203.
  68. Guo, G.; Zhou, Q.; Ma, L.Q. Availability and assessment of fixing additives for the in situ remediation of heavy metal contaminated soils: A review. Environ. Monit. Assess. 2006, 116, 513–528. [Google Scholar] [CrossRef] [PubMed]
  69. Scragg, A.H. Environmental Biotechnology; Longman Essex: Colchester, UK, 1999; p. 249. [Google Scholar]
  70. Juhasz, A.L.; Smith, E.; Weber, J.; Naidu, R.; Rees, M.; Rofe, A.; Kuchel, T.; Sansom, L. Effect of soil ageing on in vivo arsenic bioavailability in two dissimilar soils. Chemosphere 2008, 71, 2180–2186. [Google Scholar] [CrossRef] [PubMed]
Figure 1. Location map of the study area and sampling sites.
Ijerph 14 01475 g001
Figure 2. The metal(loid) concentrations in the soils of three different layers.
Ijerph 14 01475 g002aIjerph 14 01475 g002b
Figure 3. Spatial distribution of metals in the surface soils of the studied area.
Ijerph 14 01475 g003
Figure 4. Dendgram of target metals and phosphorus using hierarchical clustering analysis for parameters.
Ijerph 14 01475 g004
Figure 5. Chemical fractionations of Cr, Ni, Cu, Zn, Cd, Pb and As in surface (see in the left column), middle (see in the middle column) and deep soils (see in the right column) of the study area (F1, F2, F3, F4, F5, F6 and F7 represent water soluble, exchangeable, carbonate-bound, humic acid-bound, Fe and Mn oxide-bound, refractory organic matter-bound, and residual fractions, respectively).
Ijerph 14 01475 g005
Table 1. The site geology and physicochemical properties of top soils in the studied area.
SiteGeologySoil Classification aLand UsepHCEC (meq/100 g)OM (%)
TY-1Alluvial clay and gravel ( Q 4 3 apl )Fluvic Hydragric AnthrosolWild grass3.916.321.23
TY-2Alluvial clay and gravel ( Q 4 3 apl )Fluvic Hydragric AnthrosolPaddy4.217.103.67
TY-3Alluvial clay and gravel ( Q 4 3 apl )Fluvic Hydragric AnthrosolVegetable field4.516.523.86
TY-4Alluvial clay and gravel ( Q 4 3 apl )Fluvic Hydragric AnthrosolVegetable field4.917.263.72
TY-5Alluvial clay and gravel ( Q 4 3 apl )Fluvic Hydragric AnthrosolPaddy6.217.323.62
TY-6Alluvial clay and gravel ( Q 4 3 apl )Fluvic Hydragric AnthrosolPaddy5.716.283.58
TY-7Paralic deposits ( Q 4 3 m c )Sodic Hydragric AnthrosolPaddy6.818.963.46
TY-8Late Jurassic monzonitic granites (J3ηγ)Arenosol LixisolForest field5.817.612.96
TY-9Triassic sandy shales and sandy conglomerate (K1ηo)Dystric LeptosolForest field4.716.482.67
TY-10Early Cretaceous Epoch quartzdiorites (T3G)Arenosol LixisolForest field5.116.522.98
TY-11Early Cretaceous Epoch quartzdiorites (T3G)Arenosol LixisolForest field4.916.213.00
a According to the World Reference Base for Soils [20]; CEC: Cation Exchange Capacity; OM: Organic Matter.
Table 2. Concentrations and enrichment factors (EFs) of metal(loid)s in top soils from the study area.
SampleAsCdCuNiPbZn
Concentration (mg/kg)EFConcentration (mg/kg)EFConcentration (mg/kg)EFConcentration (mg/kg)EFConcentration (mg/kg)EFConcentration (mg/kg)EF
TY-1219.8 ± 0.719.640.149 ± 0.0032.1288.7 ± 1.24.1513.6 ± 0.30.75133.5 ± 1.22.95150.7 ± 1.42.53
TY-210.8 ± 0.22.060.069 ± 0.0022.097.4 ± 0.10.745.6 ± 0.40.6632.3 ± 0.71.5259.6 ± 0.82.14
TY-3181.8 ± 0.411.900.171 ± 0.0021.7880.9 ± 0.92.7715.5 ± 0.20.6399.0 ± 0.61.60131.2 ± 0.61.62
TY-468.5 ± 0.84.600.209 ± 0.0092.2339.3 ± 0.51.3813.8 ± 0.30.5775.8 ± 1.61.26116.4 ± 0.81.47
TY-552.4 ± 0.73.860.193 ± 0.0022.2628.8 ± 0.41.1115.8 ± 0.10.7276.2 ± 1.31.3997.1 ± 0.91.35
TY-643.8 ± 0.23.780.348 ± 0.0014.7727.7 ± 0.31.2513.7 ± 0.50.73136.8 ± 0.72.92137.3 ± 0.82.23
TY-757.8 ± 0.84.280.333 ± 0.0043.9234.6 ± 0.61.3416.8 ± 0.20.77118.1 ± 0.92.16156.4 ± 0.92.18
TY-861.6 ± 0.35.770.099 ± 0.0011.4711.4 ± 0.30.5617.4 ± 0.41.0142.4 ± 0.30.9861.8 ± 0.61.09
TY-935.9 ± 0.27.760.072 ± 0.0012.479.2 ± 0.61.045.0 ± 0.10.67139.8 ± 1.17.4748.5 ± 0.41.97
TY-1018.1 ± 0.41.070.136 ± 0.0021.287.1 ± 0.30.226.3 ± 0.10.2358.2 ± 0.60.85130.3 ± 0.81.45
TY-1149.2 ± 0.32.250.213 ± 0.0031.55112.9 ± 1.22.7026.7 ± 0.20.7585.3 ± 0.80.96292.9 ± 1.52.52
Max219.819.640.3484.77112.94.1526.71.01139.87.47292.92.53
Min10.81.070.0691.287.10.225.00.2332.30.8548.51.09
Mean72.76.090.1812.3640.71.5713.60.6890.72.19125.61.87
SD66.235.410.0931.0736.81.176.30.1938.01.9067.10.50
BV a8.9 0.056 17.0 14.4 36 47.3
MAC b25 0.30 100 50 300 250
BV: background value; MAC: maximum allowable concentration. a background values of elements in the soils of Guangdong Province (CNEMC, China National Environmental Monitoring Center, 1990 [27]); b The maximum allowable concentrations of contaminants in Chinese soils (EPAC, Environmental protection Administration of China, 2008 [40]).
Table 3. Metal contamination factors (CFs) and pollution load indexes (IPIs) for metals in top soils from the study area.
SampleContamination Factors (CFs)IPIs
AsCdCuNiPbZnCrAgBBiCoMoSbTiVWSn
TY-124.702.665.210.943.713.190.864.209.1724.261.670.162.611.650.9241.276.193.36
TY-21.211.230.430.390.891.260.160.671.010.980.710.151.110.590.260.571.000.62
TY-320.433.054.761.072.752.770.894.849.1715.682.880.162.701.720.9817.075.963.16
TY-47.693.732.310.962.112.460.872.319.174.931.430.113.131.670.922.444.982.10
TY-55.893.441.691.092.122.050.921.794.203.111.500.142.01.521.073.392.911.81
TY-64.926.211.630.953.802.900.842.692.472.461.100.111.691.300.812.03.981.74
TY-76.495.952.031.173.283.310.933.653.634.931.890.142.431.521.116.483.312.30
TY-86.931.770.671.211.181.310.741.394.100.461.640.192.241.200.720.770.571.13
TY-94.031.290.540.353.881.020.330.880.532.070.610.491.930.520.290.831.670.90
TY-102.032.430.420.441.622.750.371.500.450.872.040.252.851.901.300.651.191.05
TY-115.533.806.641.852.376.190.988.112.494.832.070.252.982.461.742.553.572.70
Table 4. Principal component loading (varimax normalization) for metals of top soils in the study area.
ParameterPC1PC2PC3PC4
V0.937−0.0520.1880.098
Ti0.9370.1240.1290.172
Zn0.8640.0440.384−0.122
Ag0.8240.2820.358−0.136
Sb0.7830.286−0.1040.037
Ni0.7530.0510.3770.219
Co0.7420.331−0.0490.265
Cu0.7090.5560.246−0.114
As0.1650.9690.0390.061
Bi0.1750.9660.070−0.044
W0.0770.9340.039−0.057
B0.1840.8190.0370.435
Sn0.2800.7890.4310.137
Cd0.236−0.0770.8850.294
P0.4380.1690.8410.120
Pb−0.1040.4330.694−0.499
Cr0.5530.3320.5600.349
Mo−0.091−0.154−0.254−0.900
Eigenvalues6.1644.9983.0891.704
% of variance34.24427.76717.1639.464
Cumulative %34.24462.01279.17588.639
The bold indicate: the significance of a parameter in a specific principle component. Significant at p < 0.05.

