
Family Environment and Childhood Obesity: A New Framework with Structural Equation Modeling


Abstract
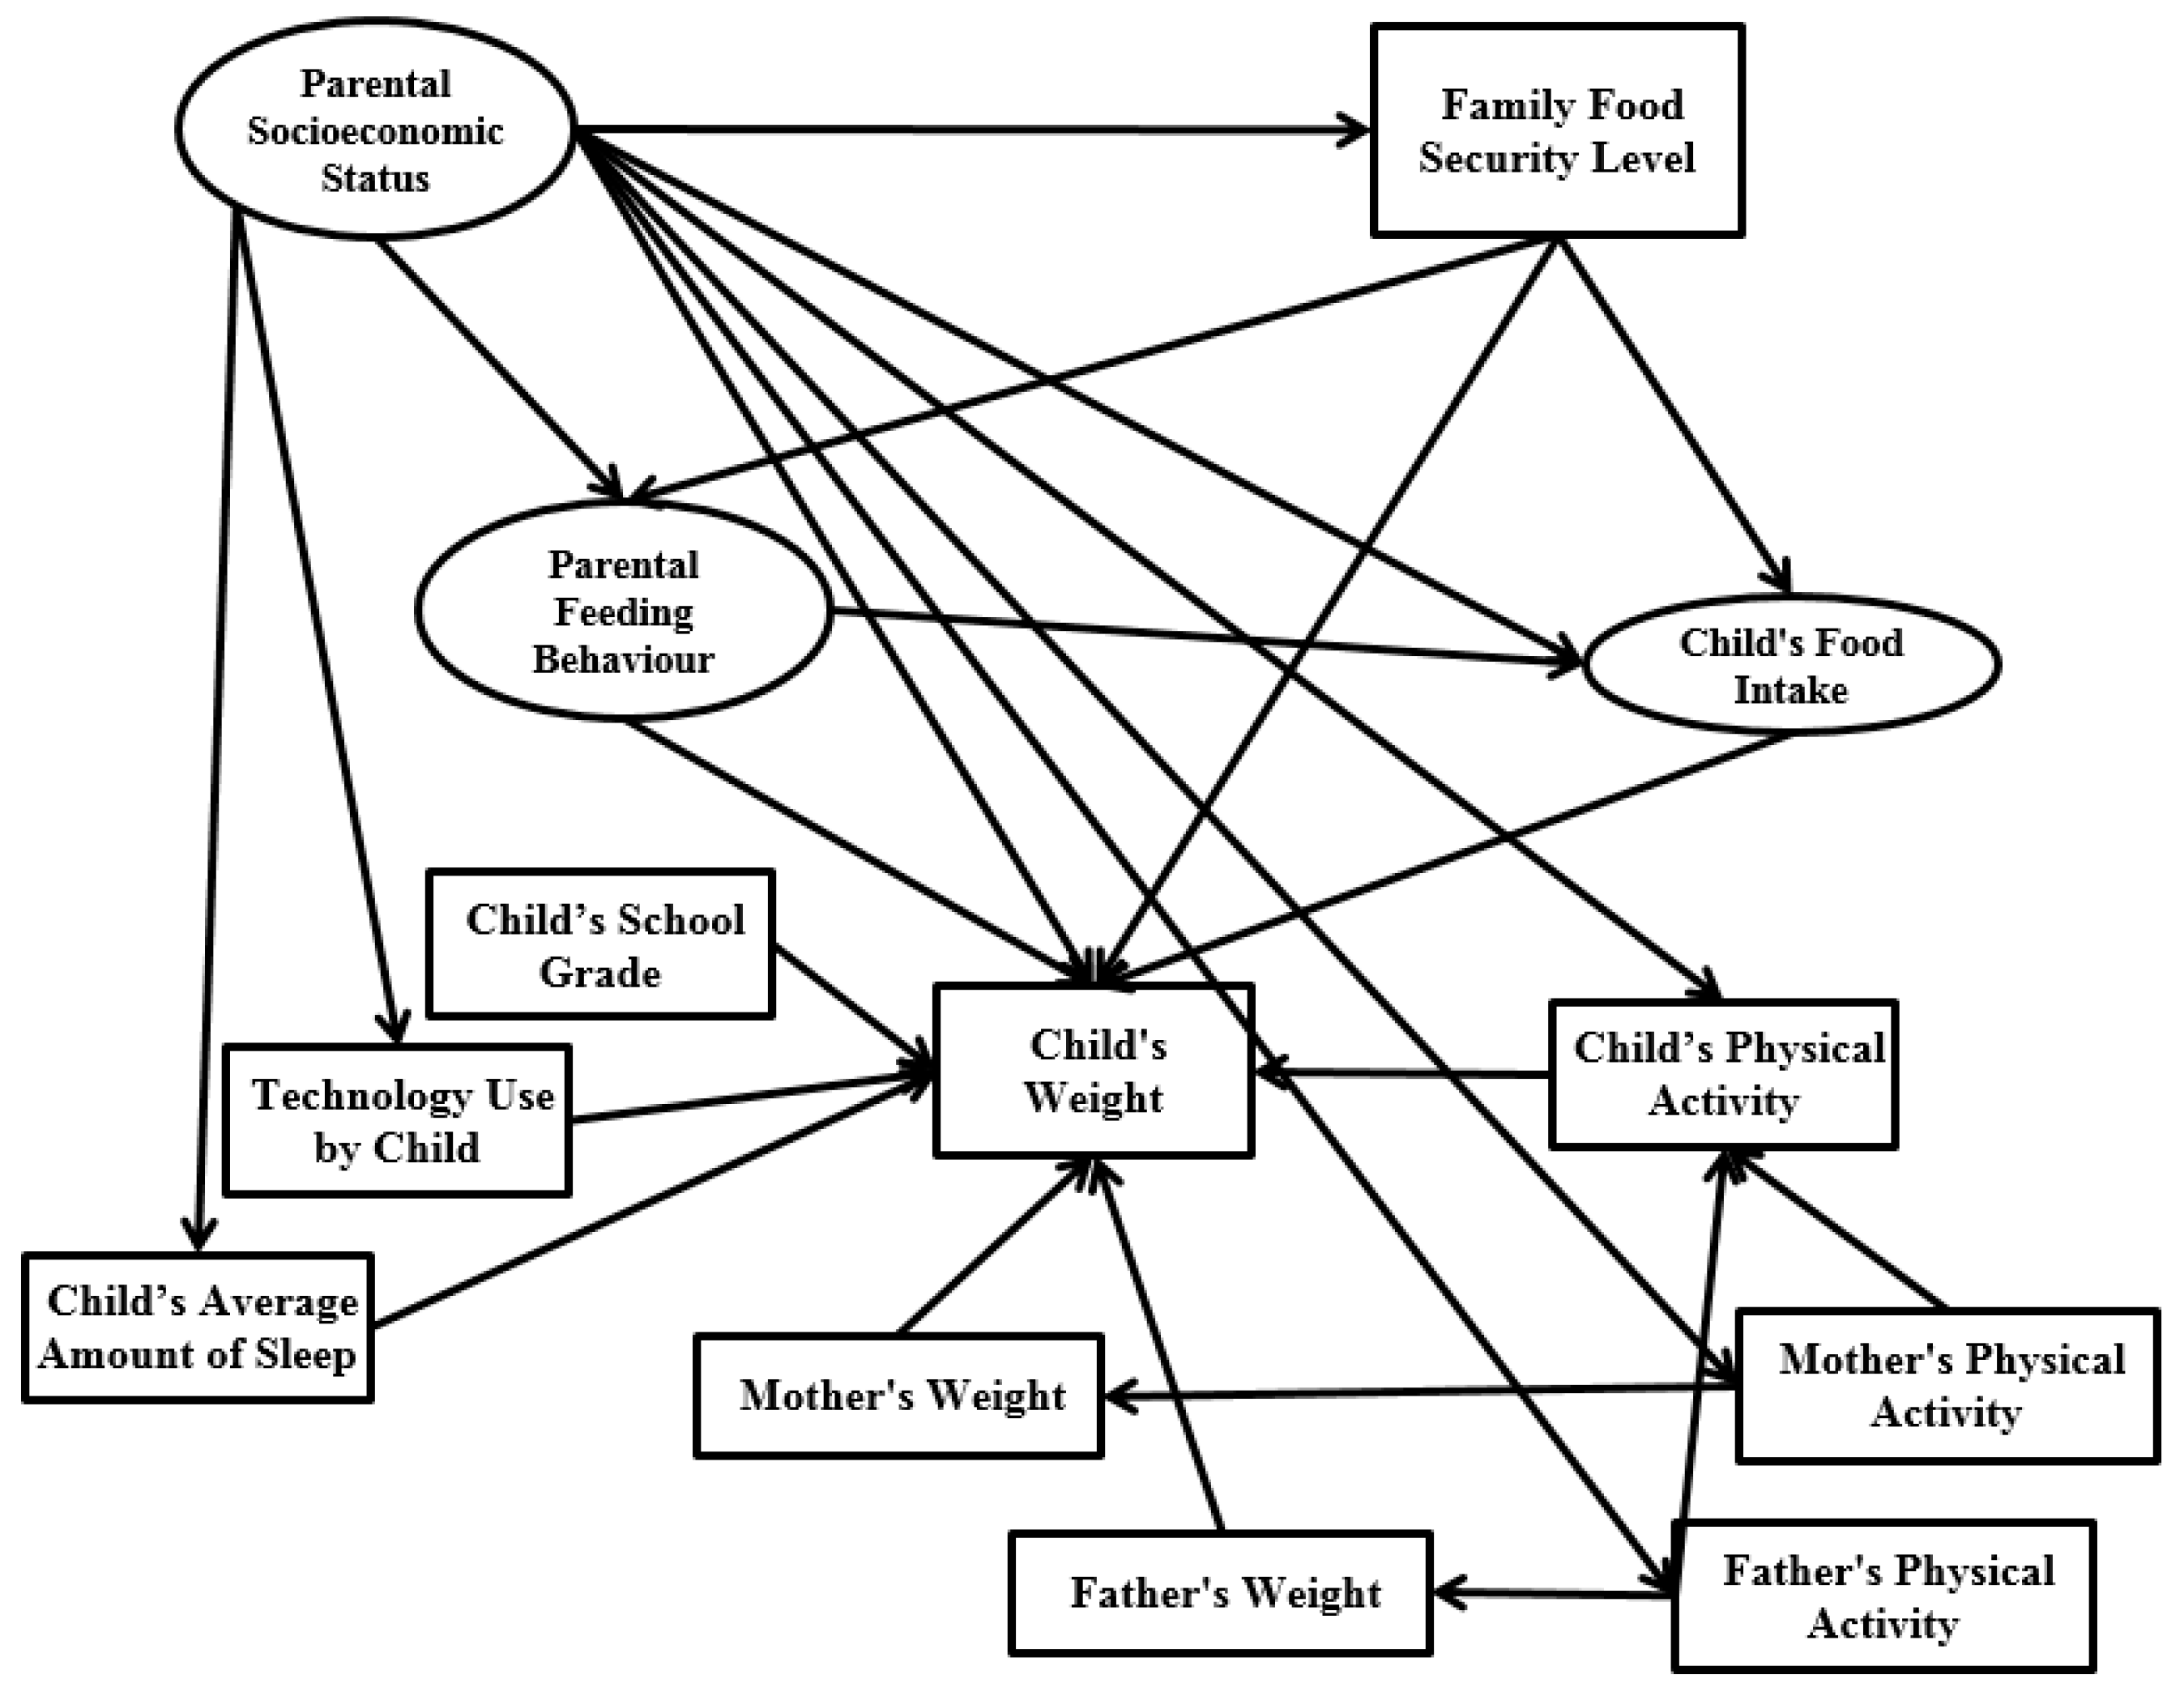
:1. Introduction
2. Materials and Methods
2.1. Measurements
2.1.1. Parental Socioeconomic Status
2.1.2. Family Food Security Level
2.1.3. Parental Feeding Behaviour
2.1.4. Child’s Food Intake
2.1.5. BMI
2.1.6. Control Variables
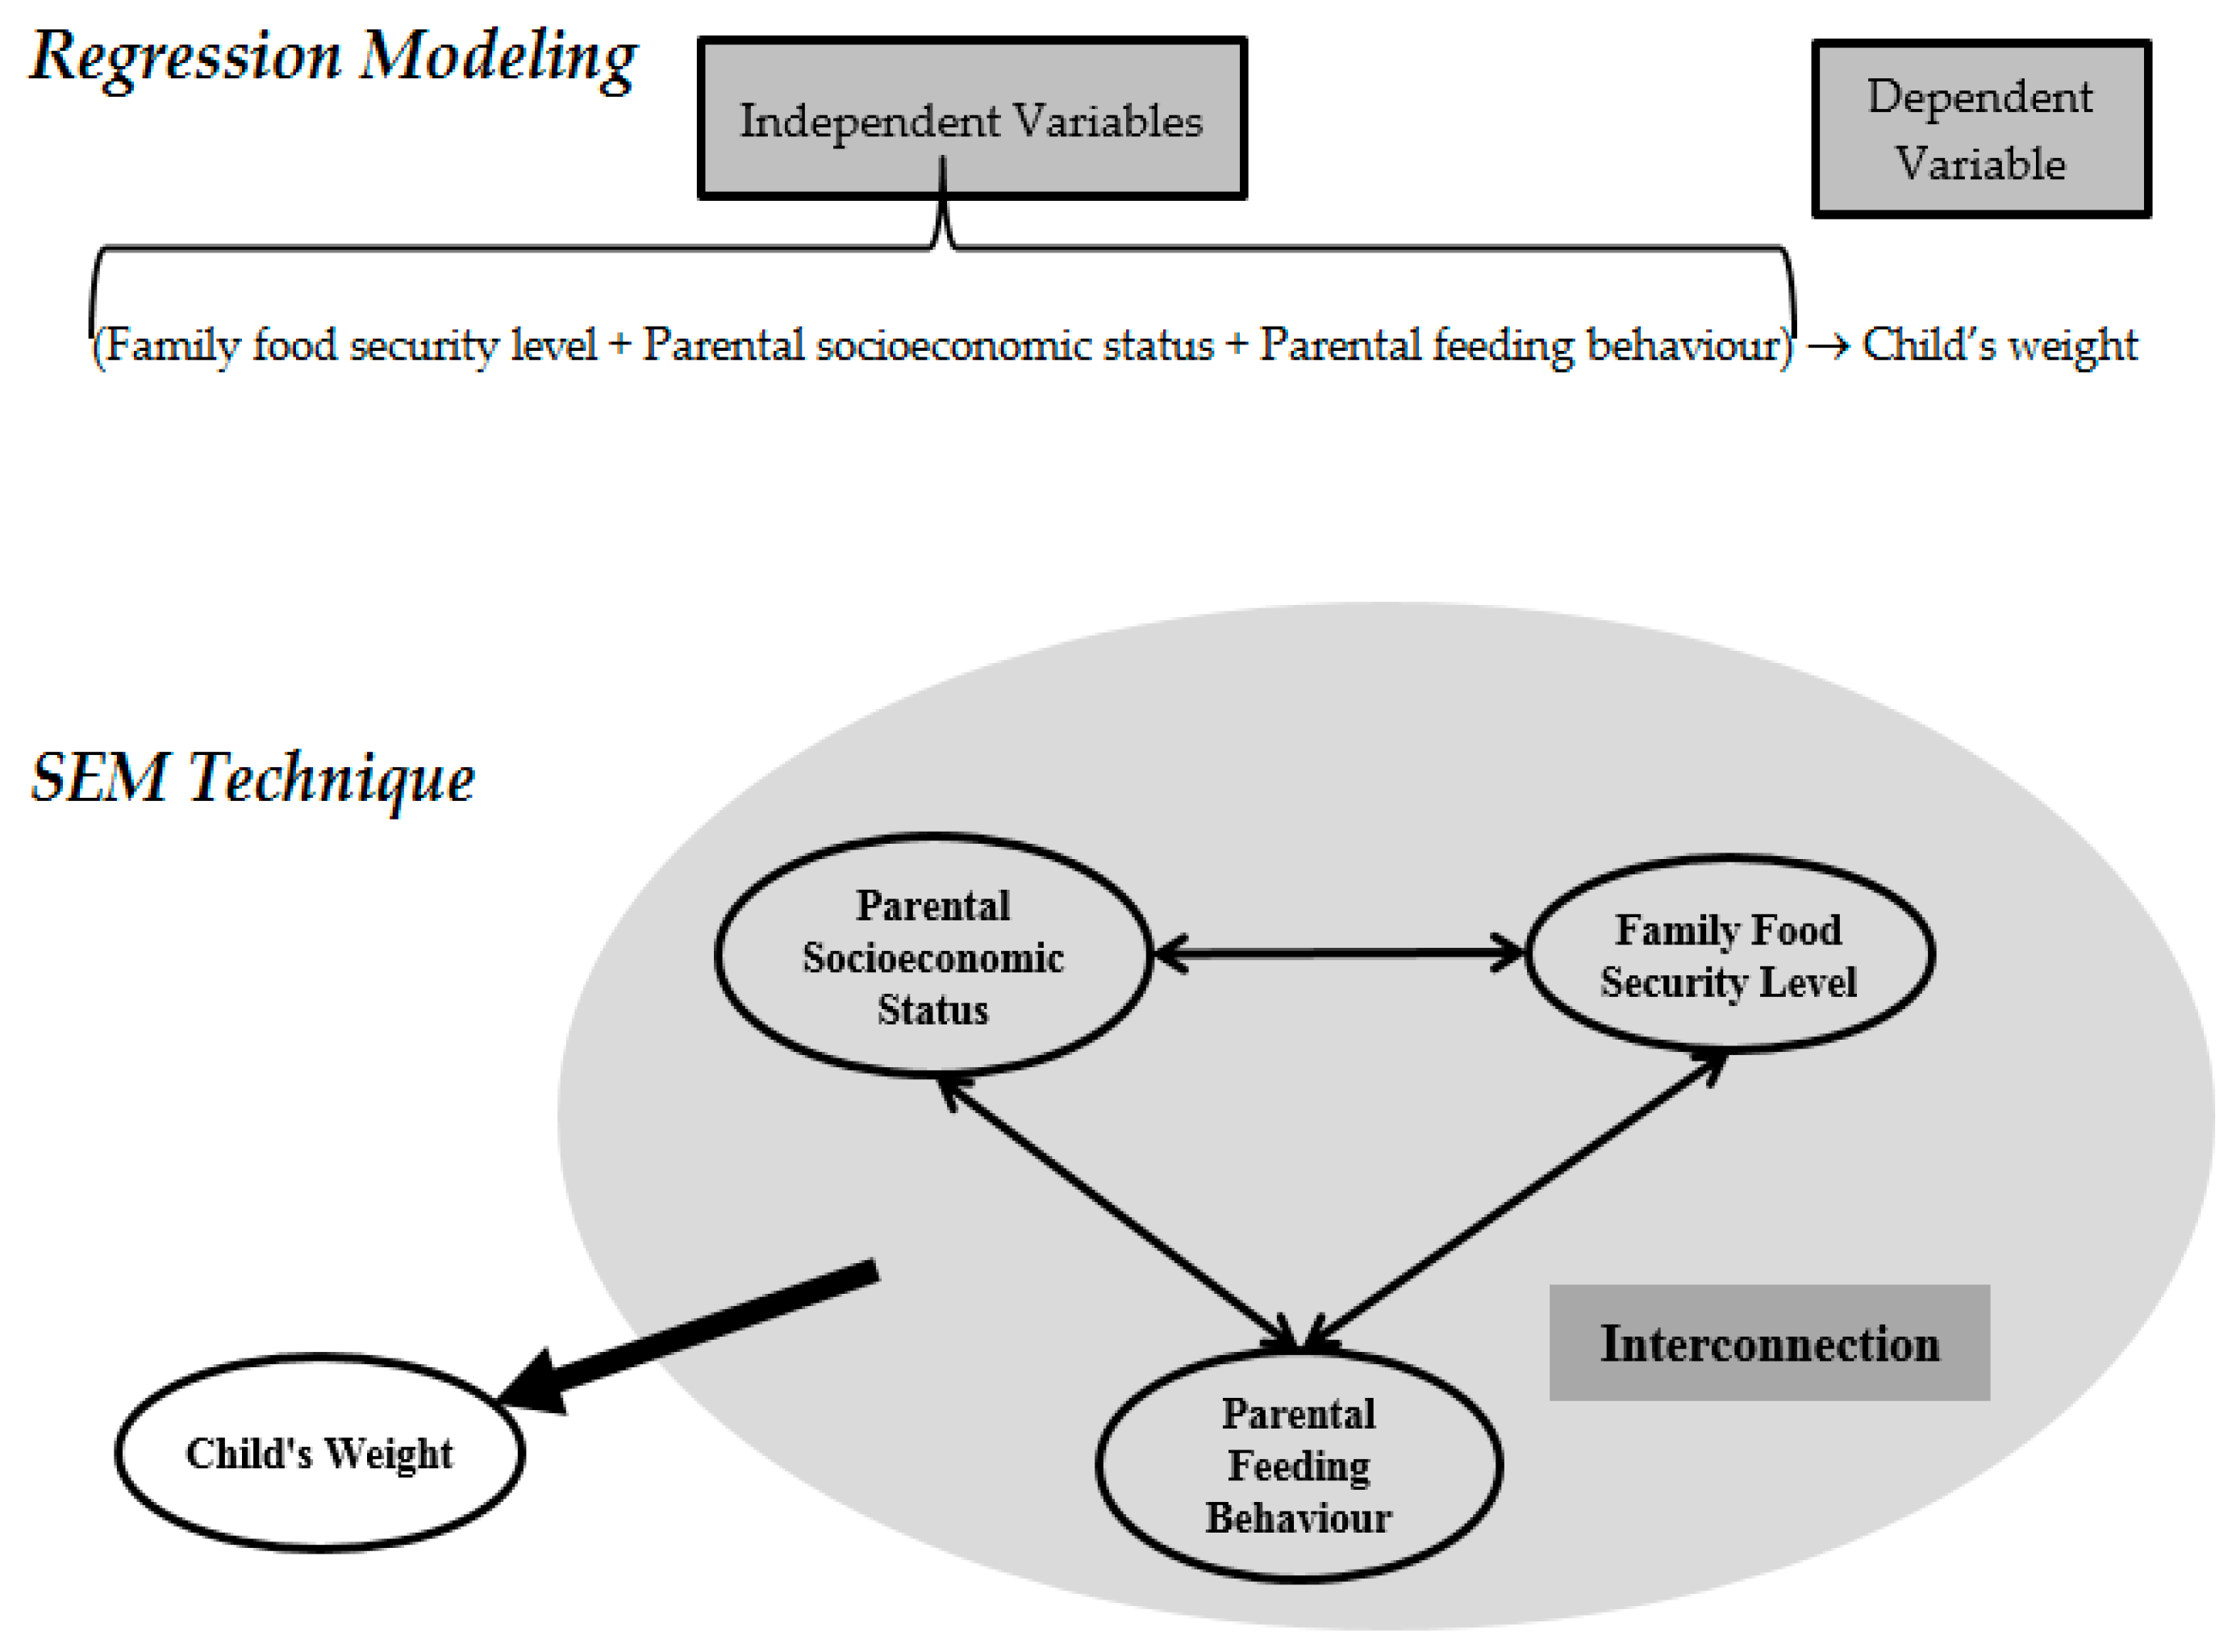
2.2. Why Using SEM?
2.2.1. The Ability to Use Latent Variables
2.2.2. The Ability to Estimate Direct and Indirect Effects
2.2.3. The Ability to Perform Simultaneous Estimation
2.3. Sampling
3. Results
3.1. Descriptive Analysis
3.2. Study Reliability and Validity
- (a)
- Validity: Cronbach’s alpha of every latent variable must be equal to or higher than 0.7
- (b)
- Reliability:
- The average variance extracted (AVE) for every latent variable must be equal to or higher than 0.50
- The factor loading of every indicator must be higher than 0.70 in the construct
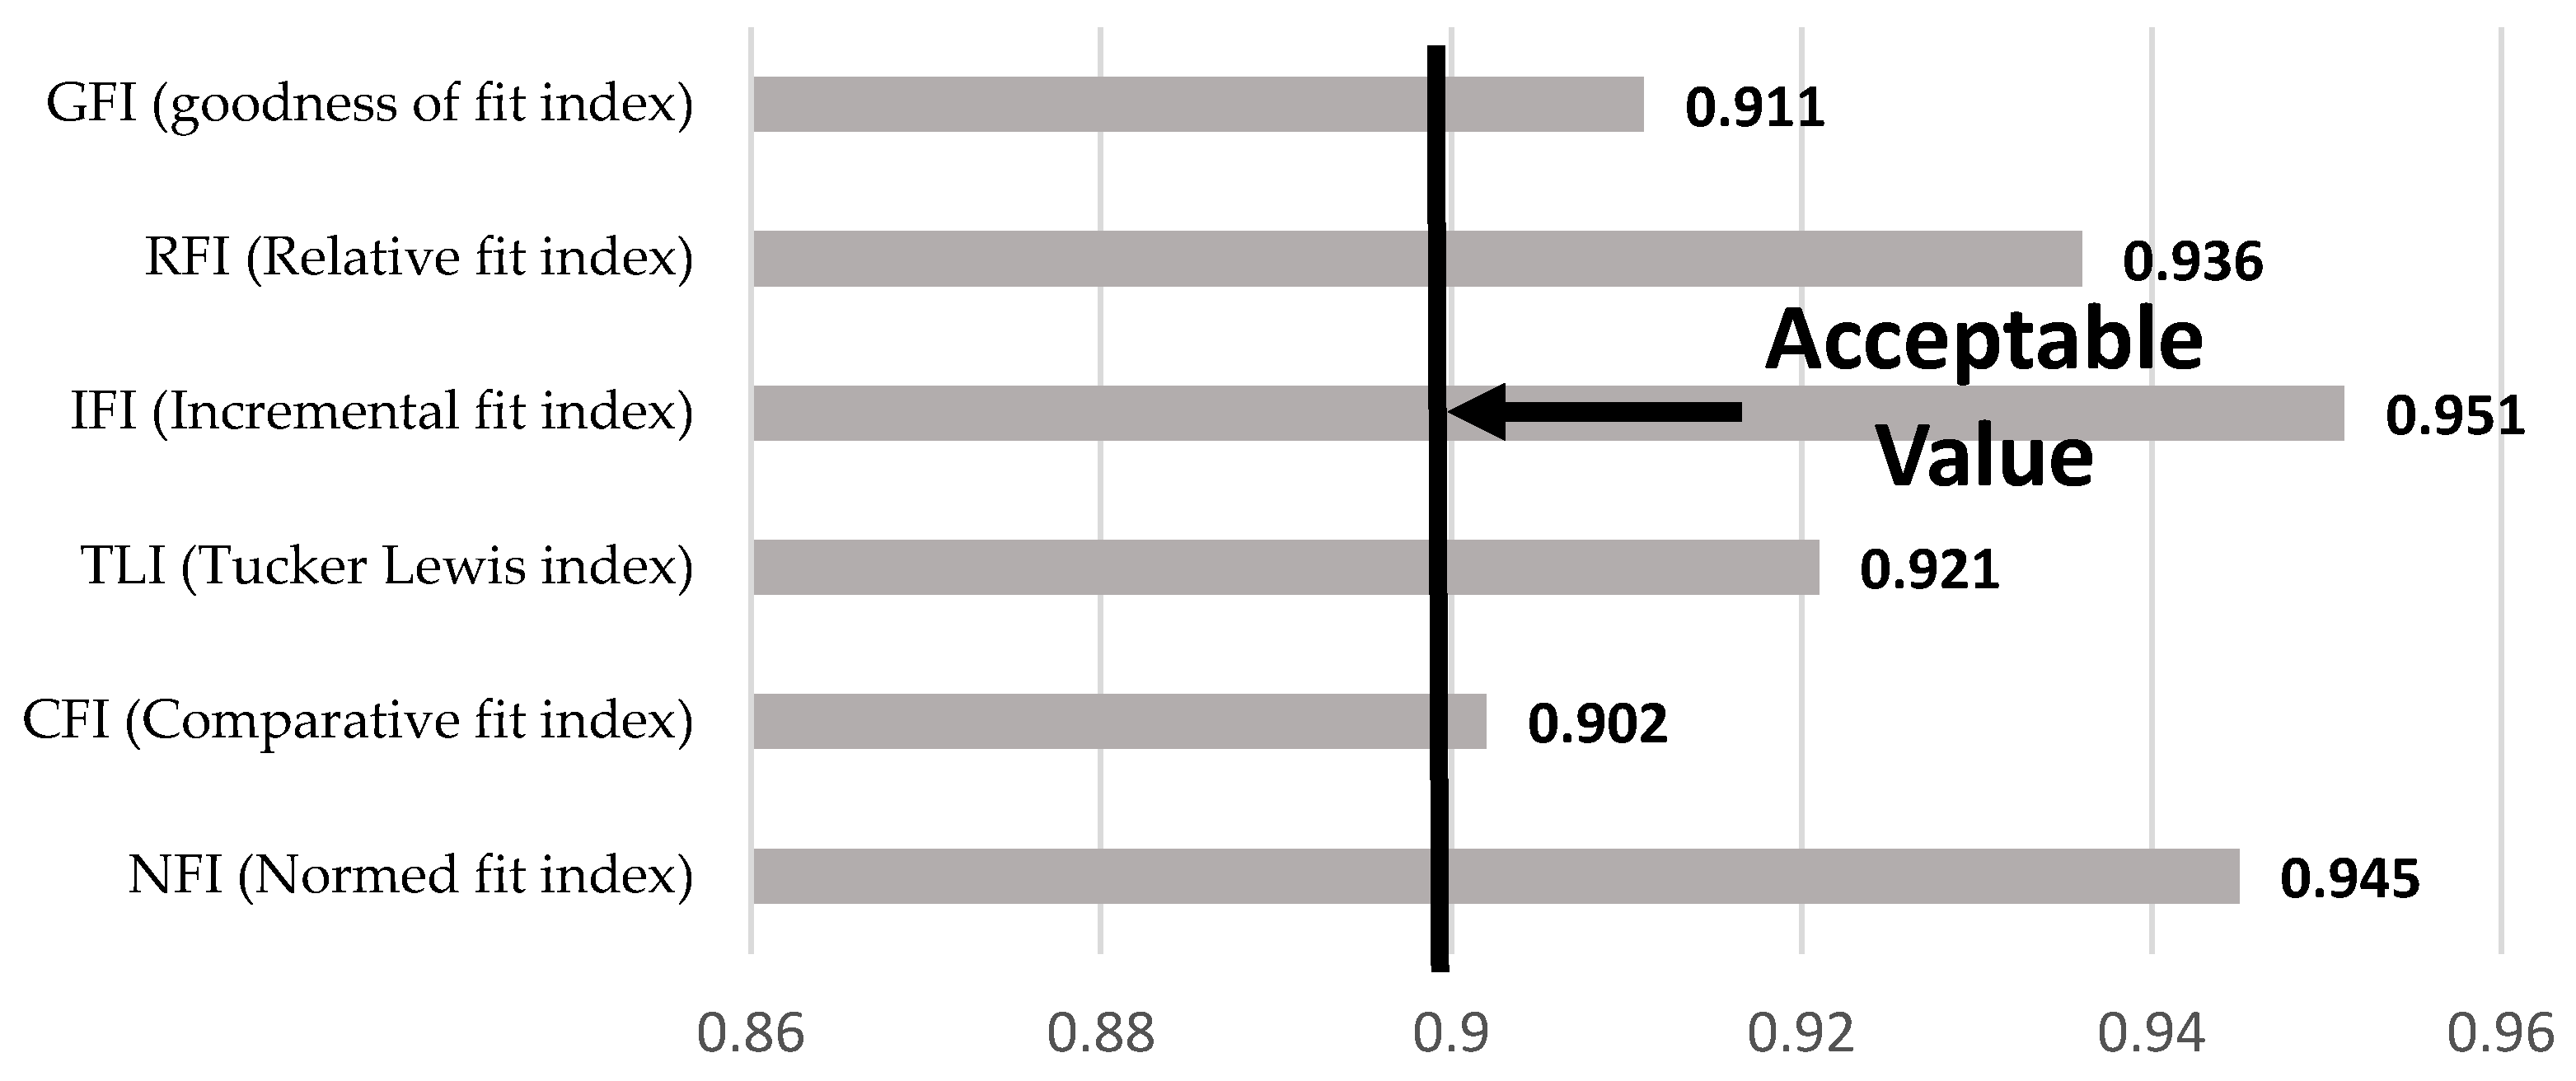
3.3. Analysis of Model Fit
3.4. Normality Testing
3.5. Multicollinearity Analysis
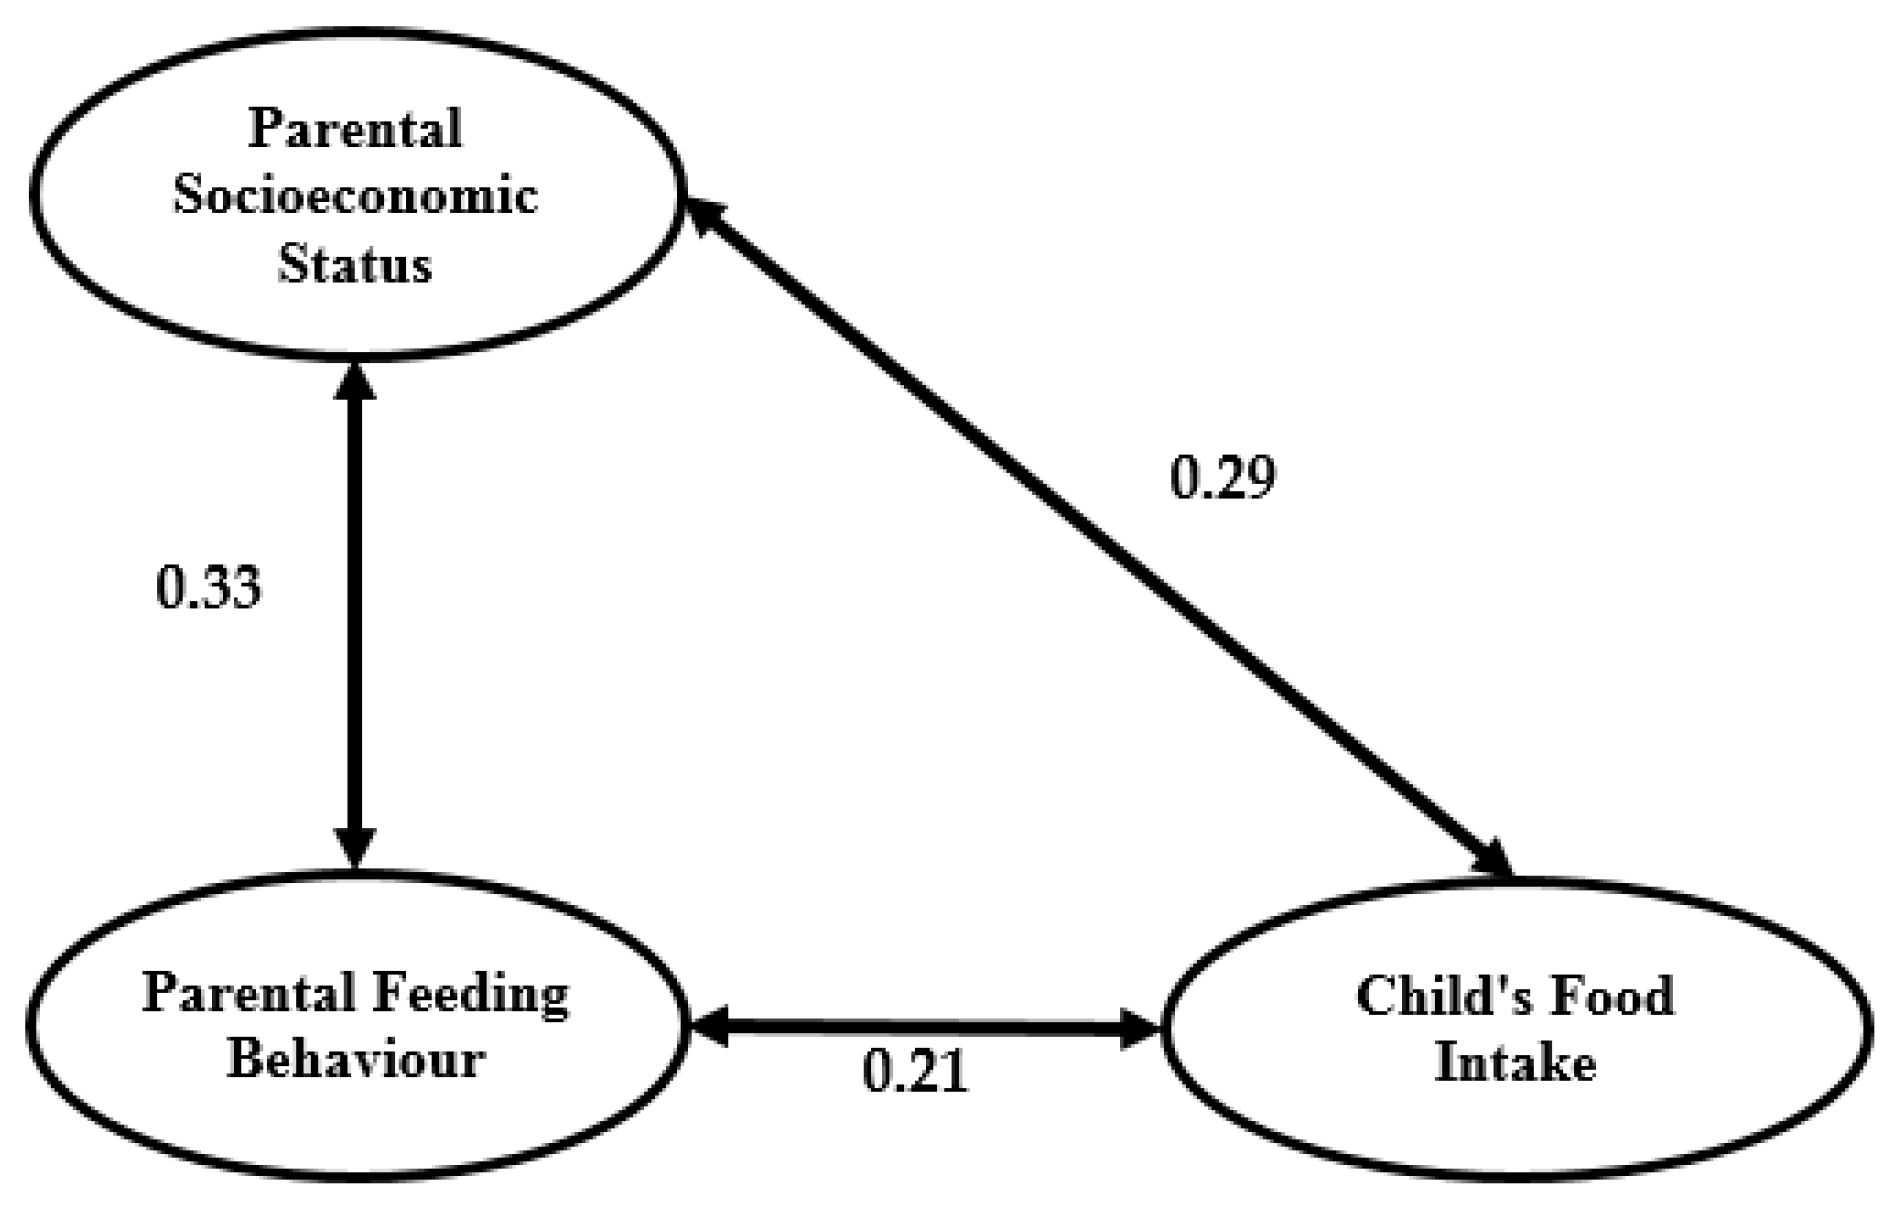
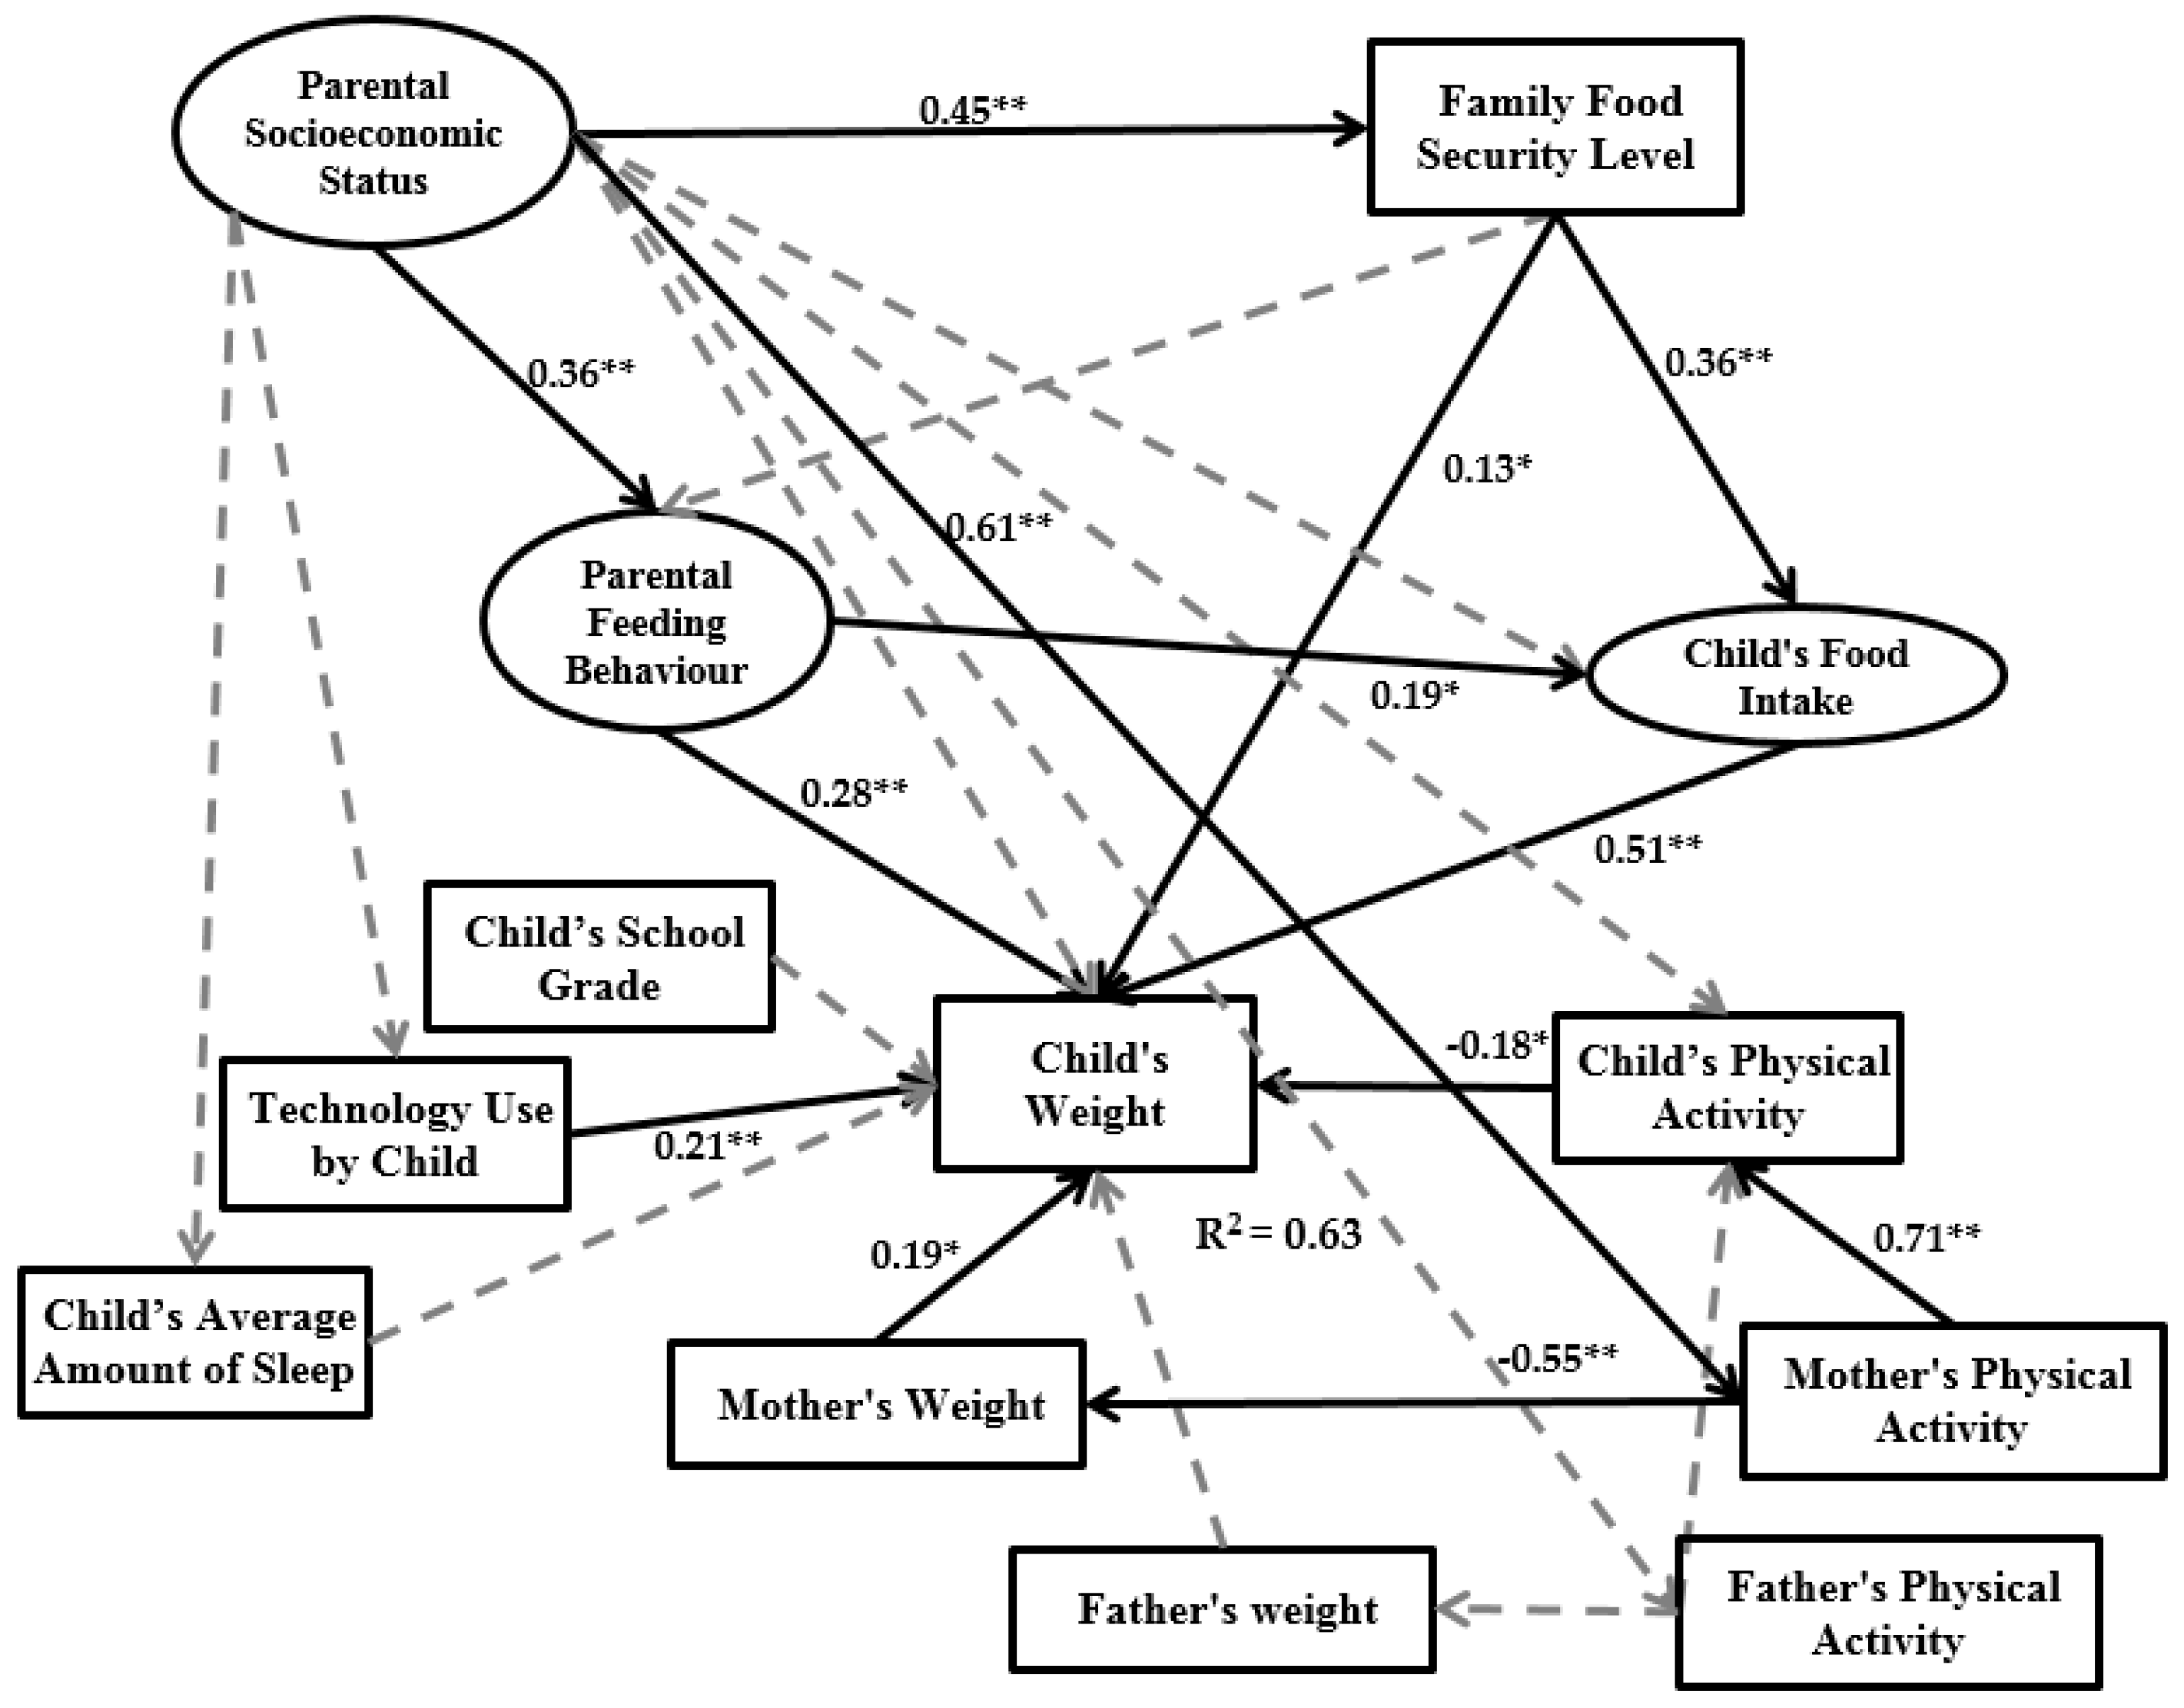
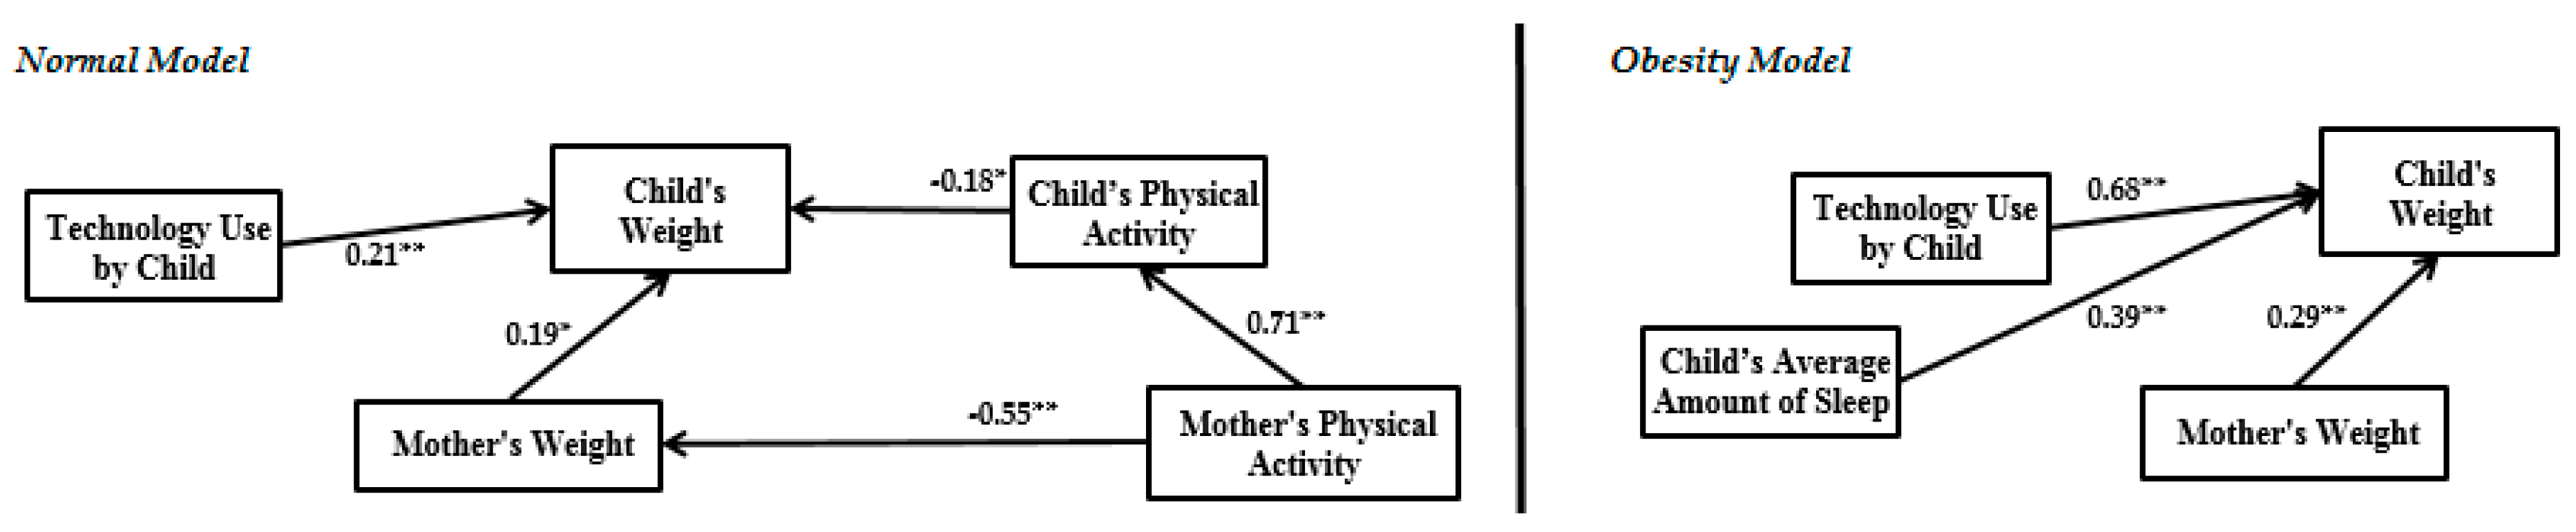
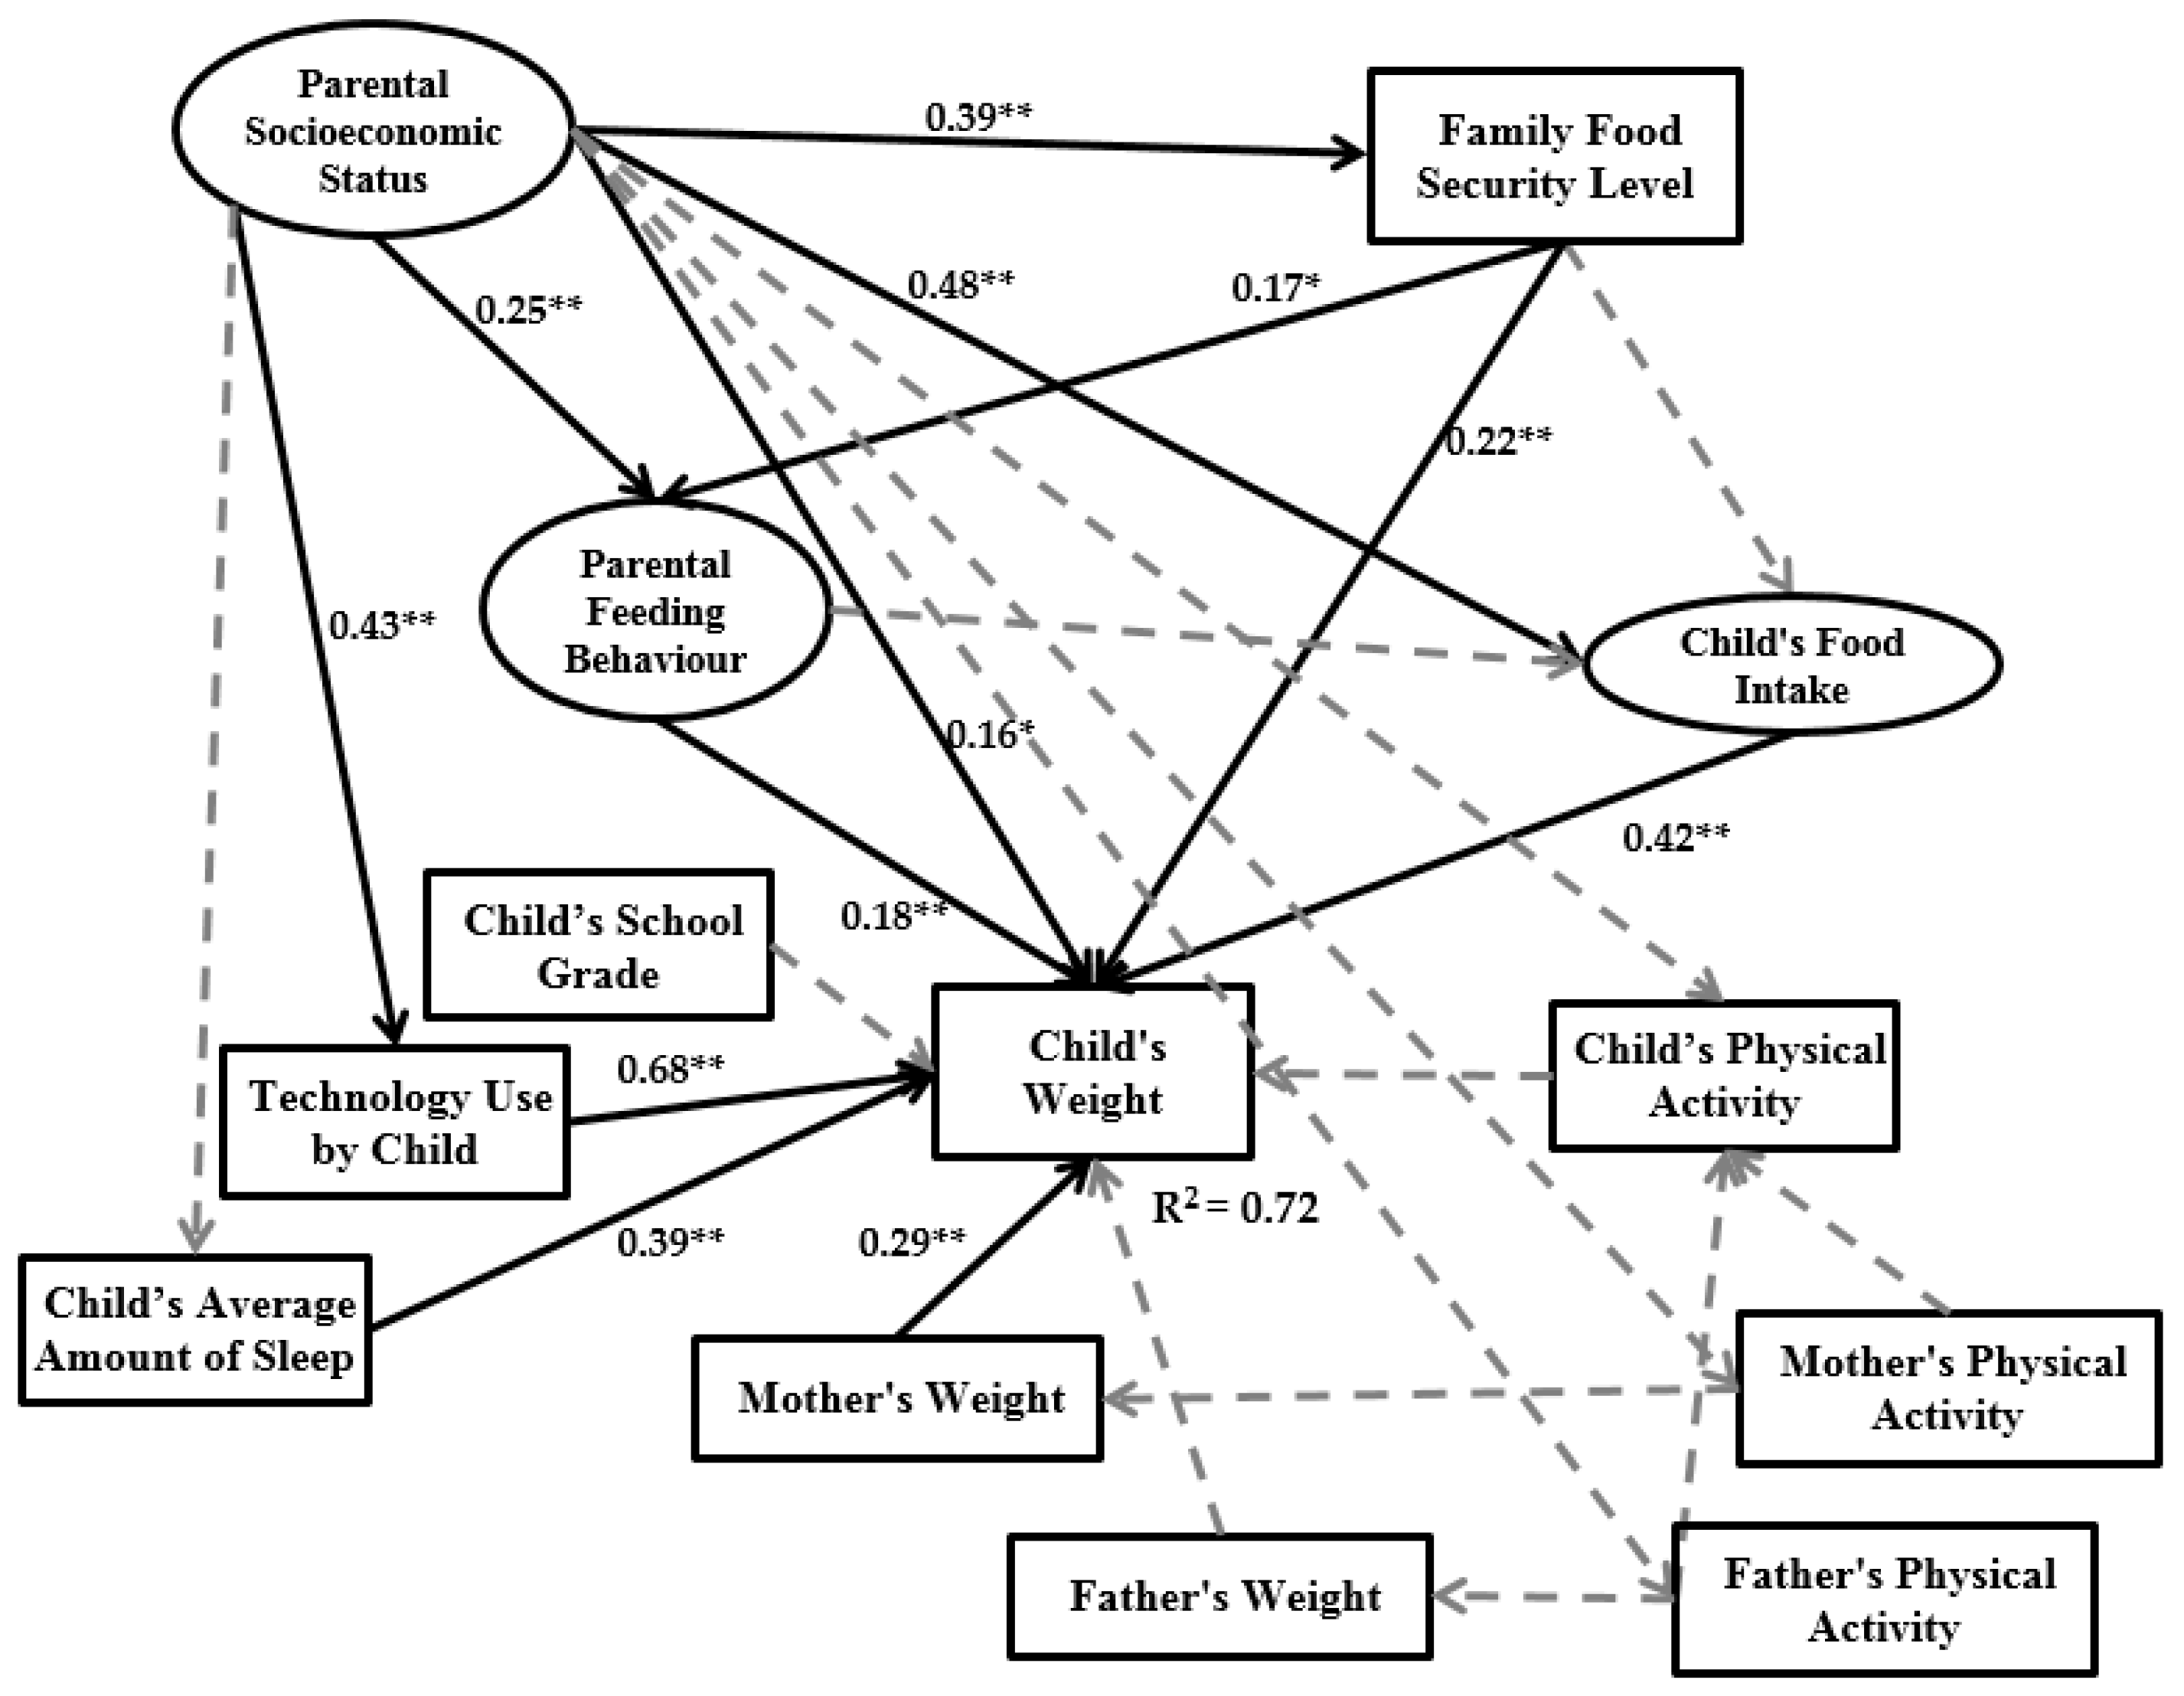
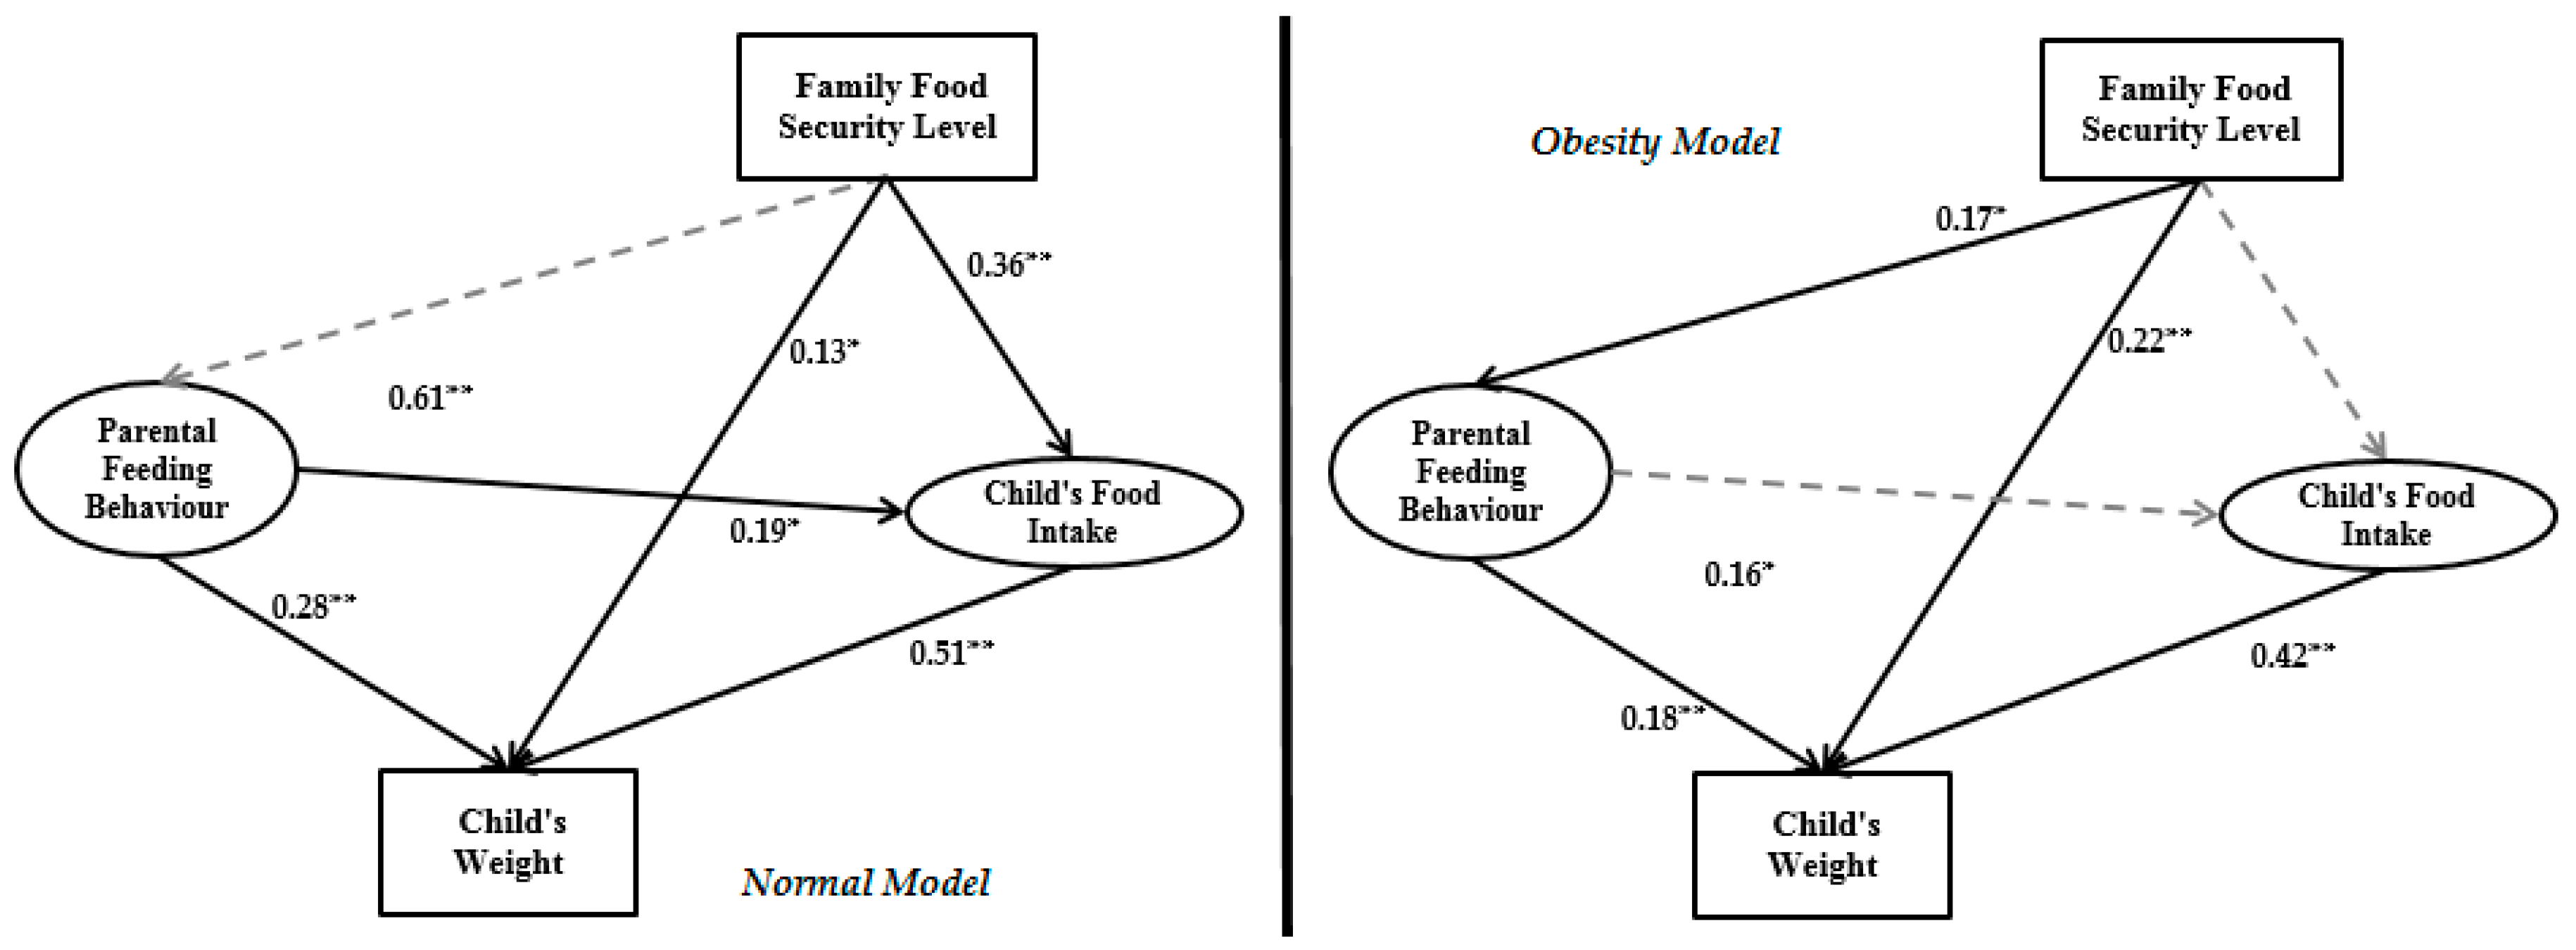
3.6. Structural Model
4. Discussion
5. Conclusions
- (1)
- Improved previous studies relate parental socioeconomic status, parental feeding behaviour, child’s food intake and child’s weight by considering family food security level and some child environmental indicators like technology use by child and the child’s average amount of sleep.
- (2)
- (1)
- This study was limited by the cross-sectional nature, which does not allow determining temporal relationships. We suggest doing this study with longitudinal data, which would provide researchers with more confidence in data analysis accuracy.
- (2)
- In previous studies the child’s calorie intake [61] and genetics are deemed remarkable factors in causing obesity [62] and should be included in the model. We had limitations with collecting this type of data, so it is recommended to study them in future investigations on account of their significance.
- (3)
- There are some indicators that can logically affect family environment and childhood obesity. These variables are economic, political and cultural determinants that cannot be measured based on the current research framework. However, they directly and indirectly have some impact on parental socioeconomic status, family food security level and parental feeding behaviour that lead to child weight. The data structure employed in this study is cross sectional and data were collected from Urumqi City, China. Therefore, there is one economic policy that controls the research model. This research model can thus be applied in other provinces of China and other countries, or comparison studies can be carried out among provinces or countries. In a comparison study, a moderating variable can be considered as an index of economic situation, which impacts all relationships among the research model variables.
- (4)
- The research framework was designed based on children 7–12 years old and it is not suitable for children below primary school age. For future studies (obesity modeling for below 7 years old), some indicators like the child’s physical activity, child’s average amount of sleep, technology use by child, and child’s school grade should be excluded from the research variables in obesity modeling.
- (1)
- To measure and estimate a child’s weight in terms of obesity, it is better for practitioners to extract obesity data from the whole dataset.
- (2)
- Family food security level should be addressed in future studies.
- (3)
- The general knowledge of society should be increased regarding the high effect of child technology use and child’s average amount of sleep on children’s weight by presenting childhood obesity topics on TV shows, social media, and in primary school parental meetings.
Acknowledgments
Author Contributions
Conflicts of Interest
Appendix A

| 1 | “We worried whether our food would run out before we got money to buy more.” Was that often, sometimes, or never true for you in the last 12 months? |  |
| 2 | “The food that we bought just didn’t last and we didn’t have money to get more.” Was that often, sometimes, or never true for you in the last 12 months? |  |
| 3 | “We couldn’t afford to eat balanced meals.” Was that often, sometimes, or never true for you in the last 12 months? |  |
| 4 | In the last 12 months, did you or other adults in the household ever cut the size of your meals or skip meals because there wasn’t enough money for food? (Yes/No) | 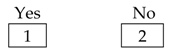 |
| 5 | (If yes to Question 4) How often did this happen almost every month, some months but not every month, or in only 1 or 2 months? | 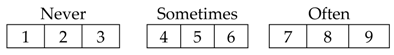 |
| 6 | In the last 12 months, did you ever eat less than you felt you should because there wasn’t enough money for food? (Yes/No) |  |
| 7 | In the last 12 months, were you ever hungry, but didn’t eat, because there wasn’t enough money for food? (Yes/No) |  |
| 8 | In the last 12 months, did you lose weight because there wasn’t enough money for food? (Yes/No) |  |
| 9 | In the last 12 months did you or other adults in your household ever not eat for a whole day because there wasn’t enough money for food? (Yes/No) | 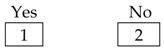 |
| 10 | (If yes to Question 9) How often did this happen almost every month, some months but not every month, or in only 1 or 2 months? | 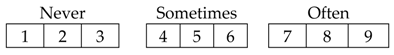 |
| 11 | “We relied on only a few kinds of low-cost food to feed our children because we were running out of money to buy food.” Was that often, sometimes, or never true for you in the last 12 months? | 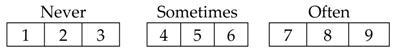 |
| 12 | “We couldn’t feed our children a balanced meal, because we couldn’t afford that.” Was that often, sometimes, or never true for you in the last 12 months? | 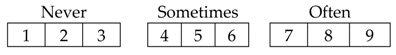 |
| 13 | “The children were not eating enough because we just couldn’t afford enough food.” Was that often, sometimes, or never true for you in the last 12 months? | 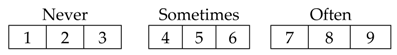 |
| 14 | In the last 12 months, did you ever cut the size of any of the children’s meals because there wasn’t enough money for food? (Yes/No) |  |
| 15 | In the last 12 months, were the children ever hungry but you just couldn’t afford more food? (Yes/No) |  |
| 16 | In the last 12 months, did any of the children ever skip a meal because there wasn’t enough money for food? (Yes/No) |  |
| 17 | (If yes to Question 16) How often did this happen almost every month, some months but not every month, or in only 1 or 2 months? | 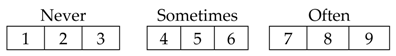 |
| 18 | In the last 12 months, did any of the children ever not eat for a whole day because there wasn’t enough money for food? (Yes/No) | 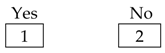 |
References
- Sun, H.; Ma, Y.; Han, D.; Pan, C.W.; Xu, Y. Prevalence and trends in obesity among china’s children and adolescents, 1985–2010. PLoS ONE 2014, 9, e105469. [Google Scholar] [CrossRef] [PubMed]
- Martinson, M.L.; Chang, Y.L.; Han, W.J.; Wen, J. Social determinants of childhood obesity in Shanghai, China: A cross-sectional child cohort survey. Lancet 2015, 386, S50. [Google Scholar] [CrossRef]
- Zhang, Y.X.; Wang, S.R. Changes in nutritional status of children and adolescents in Shandong, China from 1995 to 2005. Ann. Hum. Biol. 2011, 38, 485–491. [Google Scholar] [CrossRef] [PubMed]
- Zou, Y.; Zhang, R.H.; Xia, S.C.; Huang, L.C.; Fang, Y.Q.; Meng, J.; Chen, J.; Zhang, H.-X.; Zhou, B.; Ding, G.Q. The Rural-Urban Difference in BMI and Anemia among Children and Adolescents. Int. J. Environ. Res. Public Health 2016, 13, 1020. [Google Scholar] [CrossRef] [PubMed]
- Commission on Ending Childhood Obesity. Report of the Commission on Ending Childhood Obesity; World Health Organization: Geneva, Switzerland, 2016. [Google Scholar]
- Vinturache, A.E.; McDonald, S.; Slater, D.; Tough, S. Perinatal outcomes of maternal overweight and obesity in term infants: A population-based cohort study in Canada. Sci. Rep. 2015, 5, 9334. [Google Scholar] [CrossRef] [PubMed]
- Baek, S.H.; Chung, H.J.; Lee, H.K.; D’Souza, R.; Jeon, Y.; Kim, H.J.; Kweon, S.J.; Hong, S.T. Treatment of obesity with the resveratrol-enriched rice DJ-526. Sci. Rep. 2014, 4, 3879. [Google Scholar] [CrossRef] [PubMed]
- Kaur, J.; Lamb, M.M.; Ogden, C.L. The association between food insecurity and obesity in children—The National Health and Nutrition Examination Survey. J. Acad. Nutr. Diet. 2015, 115, 751–758. [Google Scholar] [CrossRef] [PubMed]
- Mosli, R.H.; Miller, A.L.; Peterson, K.E.; Kaciroti, N.; Rosenblum, K.; Baylin, A.; Lumeng, J.C. Birth order and sibship composition as predictors of overweight or obesity among low-income 4- to 8-year-old children. Pediatr. Obes. 2016, 11, 40–46. [Google Scholar] [CrossRef] [PubMed]
- Doub, A.E.; Small, M.; Birch, L.L. A call for research exploring social media influences on mothers’ child feeding practices and childhood obesity risk. Appetite 2016, 99, 298–305. [Google Scholar] [CrossRef] [PubMed]
- Raynor, H.A.; Van Walleghen, E.L.; Osterholt, K.M.; Hart, C.N.; Jelalian, E.; Wing, R.R.; Goldfield, G.S. The relationship between child and parent food hedonics and parent and child food group intake in children with overweight/obesity. J. Am. Diet. Assoc. 2011, 111, 425–430. [Google Scholar] [CrossRef] [PubMed]
- Mandal, B.; Powell, L.M. Child care choices, food intake, and children’s obesity status in the United States. Econ. Hum. Biol. 2014, 14, 50–61. [Google Scholar] [CrossRef] [PubMed]
- Andrews, K.R.; Silk, K.S.; Eneli, I.U. Parents as health promoters: A theory of planned behavior perspective on the prevention of childhood obesity. J. Health Commun. 2010, 15, 95–107. [Google Scholar] [CrossRef] [PubMed]
- Ball, K.; Mishra, G.; Crawford, D. Which aspects of socioeconomic status are related to obesity among men and women? Int. J. Obes. 2002, 26, 559–565. [Google Scholar] [CrossRef]
- Nau, C.; Schwartz, B.S.; Bandeen-Roche, K.; Liu, A.; Pollak, J.; Hirsch, A.; Lisa, B.D.; Glass, T.A. Community socioeconomic deprivation and obesity trajectories in children using electronic health records. Obesity 2015, 23, 207–212. [Google Scholar] [CrossRef] [PubMed]
- Sobal, J.; Stunkard, A.J. Socioeconomic status and obesity: A review of the literature. Psychol. Bull. 1989, 105, 260–275. [Google Scholar] [CrossRef] [PubMed]
- Nichols, M.S.; de Silva-Sanigorski, A.M.; Cleary, J.E.; Goldfeld, S.R.; Colahan, A.; Swinburn, B.A. Decreasing trends in overweight and obesity among an Australian population of preschool children. Int. J. Obes. 2011, 35, 916–924. [Google Scholar] [CrossRef] [PubMed]
- Patrick, H.; Nicklas, T.A.; Hughes, S.O.; Morales, M. The benefits of authoritative feeding style: Caregiver feeding styles and children’s food consumption patterns. Appetite 2005, 44, 243–249. [Google Scholar] [CrossRef] [PubMed]
- Clark, H.R.; Goyder, E.; Bissell, P.; Blank, L.; Peters, J. How do parents’ child-feeding behaviours influence child weight? Implications for childhood obesity policy. J. Public Health 2007, 29, 132–141. [Google Scholar] [CrossRef] [PubMed]
- Faith, M.S.; Scanlon, K.S.; Birch, L.L.; Francis, L.A.; Sherry, B. Parent-child feeding strategies and their relationships to child eating and weight status. Obesity 2004, 12, 1711–1722. [Google Scholar] [CrossRef] [PubMed]
- Hendrie, G.A.; Coveney, J.; Cox, D.N. Defining the complexity of childhood obesity and related behaviours within the family environment using structural equation modelling. Public Health Nutr. 2012, 15, 48–57. [Google Scholar] [CrossRef] [PubMed]
- Boles, R.E.; Halbower, A.C.; Daniels, S.; Gunnarsdottir, T.; Whitesell, N.; Johnson, S.L. Family Chaos and Child Functioning in Relation to Sleep Problems Among Children at Risk for Obesity. Behav. Sleep Med. 2016. [Google Scholar] [CrossRef] [PubMed]
- Shochat, T.; Cohen-Zion, M.; Tzischinsky, O. Functional consequences of inadequate sleep in adolescents: A systematic review. Sleep Med. Rev. 2014, 18, 75–87. [Google Scholar] [CrossRef] [PubMed]
- Chen, X.; Beydoun, M.A.; Wang, Y. Is sleep duration associated with childhood obesity? A systematic review and meta-analysis. Obesity 2008, 16, 265–274. [Google Scholar] [CrossRef] [PubMed]
- Wethington, H.; Pan, L.; Sherry, B. The Association of Screen Time, Television in the Bedroom, and Obesity Among School-Aged Youth: 2007 National Survey of Children’s Health. J. Sch. Health 2013, 83, 573–581. [Google Scholar] [CrossRef] [PubMed]
- Jiang, M.H.; Yang, Y.; Guo, X.F.; Sun, Y.X. Association between child and adolescent obesity and parental weight status: A cross-sectional study from rural north China. J. Int. Med. Res. 2013, 41, 1326–1332. [Google Scholar] [CrossRef] [PubMed]
- Soos, K.J. Assessing the Impact of a Parental Modeling Physical Acitivity Intervention on Child Physical Activity and Obesity Levels. Available online: http://thescholarship.ecu.edu/bitstream/handle/10342/5612/SOOS-HONORSTHESIS-2016.pdf?sequence=1&isAllowed=y (accessed on 1 July 2016).
- Finucane, M.M.; Stevens, G.A.; Cowan, M.J.; Danaei, G.; Lin, J.K.; Paciorek, C.J.; Singh, G.M.; Gutierrez, H.R.; Lu, Y.; Farzadfar, F.; et al. National, regional, and global trends in body-mass index since 1980: Systematic analysis of health examination surveys and epidemiological studies with 960 country-years and 9.1 million participants. Lancet 2011, 377, 557–567. [Google Scholar] [CrossRef]
- Maddah, M.; Nikooyeh, B. Factors associated with overweight in children in Rasht, Iran: Gender, maternal education, skipping breakfast and parental obesity. Public Health Nutr. 2010, 13, 196–200. [Google Scholar] [CrossRef] [PubMed]
- Ogden, C.L.; Carroll, M.D.; Kit, B.K.; Flegal, K.M. Prevalence of obesity and trends in body mass index among US children and adolescents, 1999–2010. JAMA 2012, 307, 483–490. [Google Scholar] [CrossRef] [PubMed]
- Bickel, G.; Nord, M.; Price, C.; Hamilton, W.; Cook, J. Guide to Measuring Household Food Security in the United States; USDA, Food and Nutrition Services: Alexandria, VA, USA, 2000.
- Birch, L.L.; Fisher, J.O.; Grimm-Thomas, K.; Markey, C.N.; Sawyer, R.; Johnson, S.L. Confirmatory factor analysis of the Child Feeding Questionnaire: A measure of parental attitudes, beliefs and practices about child feeding and obesity proneness. Appetite 2001, 36, 201–210. [Google Scholar] [CrossRef] [PubMed]
- Kröller, K.; Warschburger, P. Maternal feeding strategies and child’s food intake: Considering weight and demographic influences using structural equation modeling. Int. J. Behav. Nutr. Phys. Act. 2009, 6, 1–9. [Google Scholar] [CrossRef] [PubMed]
- Song, P.; Li, X.; Gasevic, D.; Flores, A.B.; Yu, Z. BMI, Waist Circumference Reference Values for Chinese School-Aged Children and Adolescents. Int. J. Environ. Res. Public Health 2016, 13, 589. [Google Scholar] [CrossRef] [PubMed]
- CDCP (Centers for Disease Control and Prevention). About BMI for Children and Teens. Available online: https://www.cdc.gov/healthyweight/assessing/bmi/childrens_bmi/about_childrens_bmi.html (accessed on 23 January 2015).
- Sarmugam, R.; Worsley, A. Dietary behaviours, impulsivity and food involvement: Identification of three consumer segments. Nutrients 2015, 7, 8036–8057. [Google Scholar] [CrossRef] [PubMed]
- Tanja, T.T.; Outi, N.; Sakari, S.; Jarmo, L.; Kaisa, P.; Leila, K. Preliminary finnish measures of eating competence suggest association with health-promoting eating patterns and related psychobehavioral factors in 10–17 year old adolescents. Nutrients 2015, 7, 3828–3846. [Google Scholar] [CrossRef] [PubMed]
- Wan Mohamed Radzi, C.W.J.B.; Hui, H.; Salarzadeh Jenatabadi, H. Comparing Bayesian and Maximum Likelihood Predictors in Structural Equation Modeling of Children’s Lifestyle Index. Symmetry 2016, 8, 141. [Google Scholar] [CrossRef]
- Bollen, K.A. Latent variables in psychology and the social sciences. Annu. Rev. Psychol 2002, 53, 605–634. [Google Scholar] [CrossRef] [PubMed]
- Gefen, D.; Straub, D.; Boudreau, M.C. Structural equation modeling and regression: Guidelines for research practice. Commun. Assoc. Inf. Syst. 2000, 4, 1–77. [Google Scholar]
- Jeon, J. The Strengths and Limitations of the Statistical Modeling of Complex Social Phenomenon: Focusing on SEM, Path Analysis, or Multiple Regression Models. Int. J. Soc. Behav. Educ. Econ. Bus. Ind. Eng. 2015, 9, 1559–1567. [Google Scholar]
- Hair, J.F.; Black, W.C.; Babin, B.J.; Anderson, R.E.; Tatham, R.L. Multivariate Data Analysis, 7th ed.; Pearson/Prentice Hall: Upper Saddle River, NJ, USA, 2010; p. 637. [Google Scholar]
- Lee, S.Y. Structural Equation Modeling: A Bayesian Approach, 1st ed.; John Wiley & Sons: West Sussex, UK, 2007; pp. 24–25. [Google Scholar]
- Fornell, C.; Larcker, D.F. Evaluating structural equation models with unobservable variables and measurement error. J. Mark. Res. 1981, 18, 39–50. [Google Scholar] [CrossRef]
- Wan Mohamed Radzi, C.W.J.B.; Salarzadeh Jenatabadi, H.; Hasbullah, M.B. Firm Sustainability Performance Index Modeling. Sustainability 2015, 7, 16196–16212. [Google Scholar] [CrossRef]
- Kline, T.J.; Klammer, J.D. Path model analyzed with ordinary least squares multiple regression versus LISREL. J. Psychol. Interdiscip. Appl. 2001, 135, 213–225. [Google Scholar] [CrossRef] [PubMed]
- Crouch, P.; O’dea, J.A.; Battisti, R. Child feeding practices and perceptions of childhood overweight and childhood obesity risk among mothers of preschool children. Nutr. Diet. 2007, 64, 151–158. [Google Scholar] [CrossRef]
- Keane, E.; Layte, R.; Harrington, J.; Kearney, P.M.; Perry, I.J. Measured parental weight status and familial socio-economic status correlates with childhood overweight and obesity at age 9. PLoS ONE 2012, 7, e43503. [Google Scholar]
- Walsh, B.; Cullinan, J. Decomposing socioeconomic inequalities in childhood obesity: Evidence from Ireland. Econ. Hum. Biol. 2015, 16, 60–72. [Google Scholar] [CrossRef] [PubMed]
- Chi, D.L.; Dinh, M.A.; da Fonseca, M.A.; Scott, J.M.; Carle, A.C. Dietary Research to Reduce Children’s Oral Health Disparities: An Exploratory Cross-Sectional Analysis of Socioeconomic Status, Food Insecurity, and Fast-Food Consumption. J. Acad. Nutr. Diet. 2015, 115, 1599–1604. [Google Scholar] [CrossRef] [PubMed]
- Barroso, C.S.; Roncancio, A.; Moramarco, M.W.; Hinojosa, M.B.; Davila, Y.R.; Mendias, E.; Reifsnider, E. Food security, maternal feeding practices and child weight-for-length. Appl. Nurs. Res. 2016, 29, 31–36. [Google Scholar] [CrossRef]
- Solorio, C.M.G. Maternal Food Insecurity, Child Feeding Practices, Weight Perceptions and BMI in a Rural, Mexican-Origin Population. Ph.D. Thesis, University of California, Davis, CA, USA, 2013. [Google Scholar]
- Miller, A.L.; Lumeng, J.C.; LeBourgeois, M.K. Sleep patterns and obesity in childhood. Curr. Opin. Endocrinol. Diabetes Obes. 2015, 22, 41–47. [Google Scholar] [CrossRef] [PubMed]
- Zhang, J.; Jin, X.; Yan, C.; Jiang, F.; Shen, X.; Li, S. Short sleep duration as a risk factor for childhood overweight/obesity: A large multicentric epidemiologic study in China. Sleep Health 2015, 1, 184–190. [Google Scholar] [CrossRef]
- Boin, A.C.; Nozoe, K.T.; Polesel, D.N.; Andersen, M.L.; Tufik, S. The possible influence of sleep in childhood obesity. Eur. J. Clin. Nutr. 2014, 68, 281. [Google Scholar] [CrossRef]
- Nemet, D. Childhood Obesity, Physical Activity, and Exercise. Pediatr. Exerc. Sci. 2016, 28, 48–51. [Google Scholar] [CrossRef]
- Braden, A.; Strong, D.; Crow, S.; Boutelle, K. Parent changes in diet, physical activity, and behavior in family-based treatment for childhood obesity. Clin. Pediatr. 2015, 54, 494–497. [Google Scholar] [CrossRef] [PubMed]
- Walton, K.; Simpson, J.R.; Darlington, G.; Haines, J. Parenting stress: A cross-sectional analysis of associations with childhood obesity, physical activity, and TV viewing. BMC Pediatr. 2014, 14, 244–258. [Google Scholar] [CrossRef] [PubMed]
- Arora, T.; Hosseini-Araghi, M.; Bishop, J.; Yao, G.L.; Thomas, G.N.; Taheri, S. The complexity of obesity in UK adolescents: Relationships with quantity and type of technology, sleep duration and quality, academic performance and aspiration. Pediatr. Obes. 2013, 8, 358–366. [Google Scholar] [CrossRef] [PubMed]
- Silverstone, S.; Teatum, J. Technology: The problem or the solution to childhood obesity. Am. J. Bus. Educ. 2011, 4, 37–60. [Google Scholar] [CrossRef]
- Sinaga, H.T.; Doloksaribu, B.; Tobing, H.M.; Nurhayati, I. Using scores in interpreting growth status effectively improved infant feeding practices and calorie intake of child aged 0–12 months. Int. J. Med. Sci. Public Health 2016, 5, 1014–1020. [Google Scholar] [CrossRef]
- Wardle, J.; Carnell, S.; Haworth, C.M.; Plomin, R. Evidence for a strong genetic influence on childhood adiposity despite the force of the obesogenic environment. Am. J. Clin. Nutr. 2008, 87, 398–404. [Google Scholar] [PubMed]


| Category | BMI Range (kg/m2) |
|---|---|
| Underweight | <18.5 |
| Normal Range | 18.5–22.9 |
| Overweight—At Risk | 23.0–24.9 |
| Overweight—Moderately Obese | 25.0–29.9 |
| Overweight—Severely Obese | ≥30.0 |
| Model Characteristics (Number of Latent Constructs and Items) | Minimum Sample Required |
|---|---|
| 1. Five or less latent constructs. Each latent construct has more than three measurement items. | 100 samples |
| 2. Seven or less latent constructs. Each construct has more than three items. | 150 samples |
| 3. Seven or less latent constructs. Some constructs have less than three items (the identified model) | 300 samples |
| 4. More than seven latent constructs. Some constructs have less than three items (the identified model) | 500 samples |
| Mother’s Age | Number | Percentage | Father’s Work Experience | Number | Percentage |
| 30 years old or younger | 102 | 16.19% | Less than 5 years | 61 | 9.68% |
| 31 to 40 years old | 254 | 40.32% | 5–10 years | 76 | 12.06% |
| 41 to 50 years old | 219 | 34.76% | 10–15 years | 196 | 31.11% |
| Over 50 years old | 55 | 8.73% | 15–20 years | 228 | 36.19% |
| Father’s Age | Number | Percentage | More than 20 years | 69 | 10.95% |
| 30 years old or younger | 74 | 11.75% | Mother’s Education | Number | Percentage |
| 31 to 40 years old | 186 | 29.52% | Less than High School | 29 | 4.60% |
| 41 to 50 years old | 259 | 41.11% | High School | 76 | 12.06% |
| Over 50 years old | 111 | 17.62% | Diploma | 212 | 33.65% |
| Mother’s Income | Number | Percentage | Bachelor | 244 | 38.73% |
| Less than RMB2000 | 109 | 17.30% | Master or Ph.D. | 69 | 10.95% |
| RMB2001–RMB3000 | 166 | 26.35% | Father’s Education | Number | Percentage |
| RMB3001–RMB4000 | 198 | 31.43% | Less than High School | 39 | 6.19% |
| RMB4001–RMB5000 | 75 | 11.90% | High School | 154 | 24.44% |
| More than RMB5000 | 26 | 4.13% | Diploma | 269 | 42.70% |
| Father’s Income | Number | Percentage | Bachelor | 102 | 16.19% |
| Less than RMB2000 | 88 | 13.97% | Master or Ph.D. | 66 | 10.48% |
| RMB2001–RMB3000 | 206 | 32.70% | Parents’ Marital Length | Number | Percentage |
| RMB3001–RMB4000 | 195 | 30.95% | Less than 2 years | 89 | 14.13% |
| RMB4001–RMB5000 | 66 | 10.48% | 2–4 years | 237 | 37.62% |
| More than RMB5000 | 75 | 11.90% | 5–7 years | 206 | 32.70% |
| Mother’s Work Experience | Number | Percentage | 8–10 years | 63 | 10.00% |
| Less than 5 years | 66 | 10.48% | More than 10 years | 35 | 5.56% |
| 5–10 years | 89 | 14.13% | |||
| 10–15 years | 169 | 26.83% | |||
| 15–20 years | 132 | 20.95% | |||
| More than 20 years | 133 | 21.11% |
| Gender | Number | Percentage | Technology Use by Child | Number | Percentage |
| Boy | 286 | 45.39% | Less than one hour per day | 86 | 13.65% |
| Girl | 344 | 54.61% | 1 to 2 h per day | 186 | 29.52% |
| Child’s School Grade | Number | Percentage | 3 to 4 h per day | 208 | 33.02% |
| First (Seven years old) | 105 | 16.67% | More than 4 h per day | 150 | 23.81% |
| Second (Eight years old) | 105 | 16.67% | Child’s Average Sleep Duration | Number | Percentage |
| Third (Nine years old) | 105 | 16.67% | |||
| Fourth (Ten years old) | 105 | 16.67% | Less than 7 h per day | 158 | 25.08% |
| Fifth (Eleven years old) | 105 | 16.67% | 7 to 8 h per day | 296 | 46.98% |
| Sixth (Twelve years old) | 105 | 16.67% | 8 to 9 h per day | 102 | 16.19% |
| Mothers’ Physical Activity | Number | Percentage | More than 9 h per day | 74 | 11.75% |
| None | 134 | 21.27% | Fathers’ Physical Activity | Number | Percentage |
| 1 or 2 times per week | 135 | 21.43% | None | 298 | 47.30% |
| 3 or 4 times per week | 172 | 27.30% | 1 or 2 times per week | 186 | 29.52% |
| More than 4 times per week | 189 | 30.00% | 3 or 4 times per week | 82 | 13.02% |
| Child’s Physical Activity | Number | Percentage | More than 4 times per week | 64 | 10.16% |
| None | 205 | 32.54% | |||
| 1 or 2 times per week | 189 | 30.00% | |||
| 3 or 4 times per week | 137 | 21.75% | |||
| More than 4 times per week | 99 | 15.71% |
| Category | Number (Percentage) |
|---|---|
| Underweight | 81 (12.86%) |
| Normal Range | 402 (63.81%) |
| Overweight—At Risk | 82 (13.02%) |
| Overweight—Moderately Obese | 41 (6.51%) |
| Overweight—Severely Obese | 24 (3.81%) |
| Construct | AVE | Cronbach’s Alpha |
|---|---|---|
| Parental Socioeconomic Status | 0.57 | 0.77 |
| Parental Feeding Behaviour | 0.61 | 0.71 |
| Child’s Food Intake | 0.61 | 0.81 |
| Family Food Security Level | Not Applicable | 0.78 |
| Group of control variables | Not Applicable | 0.76 |
| Parameter Description | Factor Loading |
|---|---|
| Parental Socioeconomic Status | |
| Mother’s education | 0.86 |
| Father’s education | 0.44 |
| Mother’s income | 0.48 |
| Father’s income | 0.73 |
| Mother’s work experience | 0.21 |
| Father’s work experience | 0.33 |
| Parents’ marriage length | 0.92 |
| Parental Feeding Behaviour | |
| Rewarding | 0.48 |
| Restricting | 0.72 |
| Pressuring | 0.81 |
| Modeling | 0.47 |
| Controlling | 0.77 |
| Monitoring | 0.36 |
| Child’s Food Intake | |
| Sweets | 0.89 |
| Chips | 0.92 |
| Soft Drinks | 0.96 |
| Fruits | 0.57 |
| Vegetables | 0.56 |
| Fast Food | 0.66 |
| Whole Grains | 0.41 |
| Indicators | Skew | Kurtosis |
|---|---|---|
| Mother’s education | 1.018 | 0.581 |
| Father’s income | 0.658 | −0.324 |
| Parents’ marriage length | −0.578 | −0.207 |
| Household food security level | 1.971 | 6.325 |
| Child technology use | 1.598 | 2.059 |
| Child’s average amount of sleep | 0.982 | 1.297 |
| Child’s weight | 0.624 | 2.125 |
| Child’s physical activity | −0.259 | −0.657 |
| Mother’s physical activity | −0.597 | −0.957 |
| Father’s physical activity | −1.287 | −4.268 |
| Mother’s weight | 0.951 | 2.687 |
| Father’s weight | 1.058 | 3.059 |
| Restricting | 0.663 | −0.411 |
| Pressuring | 0.288 | −1.014 |
| Controlling | 1.698 | 0.586 |
| Sweets | 0.886 | −1.185 |
| Chips | 0.444 | 0.742 |
| Soft drinks | 1.051 | −1.004 |
| Fast food | 0.222 | 1.196 |
| Vegetables | 0.875 | 0.201 |
| Formula | SEM (Obese) | SEM (Normal) | OLS (Obese) | OLS (Normal) |
|---|---|---|---|---|
| 0.987 | 1.485 | 3.688 | 2.598 | |
| 1.157 | 2.014 | 3.894 | 3.996 | |
| 1.269 | 2.229 | 4.597 | 7.071 | |
| 0.72 | 0.63 | 0.61 | 0.55 |
© 2017 by the authors. Licensee MDPI, Basel, Switzerland. This article is an open access article distributed under the terms and conditions of the Creative Commons Attribution (CC BY) license ( http://creativecommons.org/licenses/by/4.0/).
Share and Cite
Huang, H.; Wan Mohamed Radzi, C.W.J.b.; Salarzadeh Jenatabadi, H. Family Environment and Childhood Obesity: A New Framework with Structural Equation Modeling. Int. J. Environ. Res. Public Health 2017, 14, 181. https://doi.org/10.3390/ijerph14020181
Huang H, Wan Mohamed Radzi CWJb, Salarzadeh Jenatabadi H. Family Environment and Childhood Obesity: A New Framework with Structural Equation Modeling. International Journal of Environmental Research and Public Health. 2017; 14(2):181. https://doi.org/10.3390/ijerph14020181
Chicago/Turabian StyleHuang, Hui, Che Wan Jasimah bt Wan Mohamed Radzi, and Hashem Salarzadeh Jenatabadi. 2017. "Family Environment and Childhood Obesity: A New Framework with Structural Equation Modeling" International Journal of Environmental Research and Public Health 14, no. 2: 181. https://doi.org/10.3390/ijerph14020181