
Geospatial Analysis of Inflammatory Breast Cancer and Associated Community Characteristics in the United States


Abstract
:1. Introduction
2. Materials and Methods
2.1. Data Source
2.2. Statistical Analysis
3. Results
3.1. Descriptive Statistics
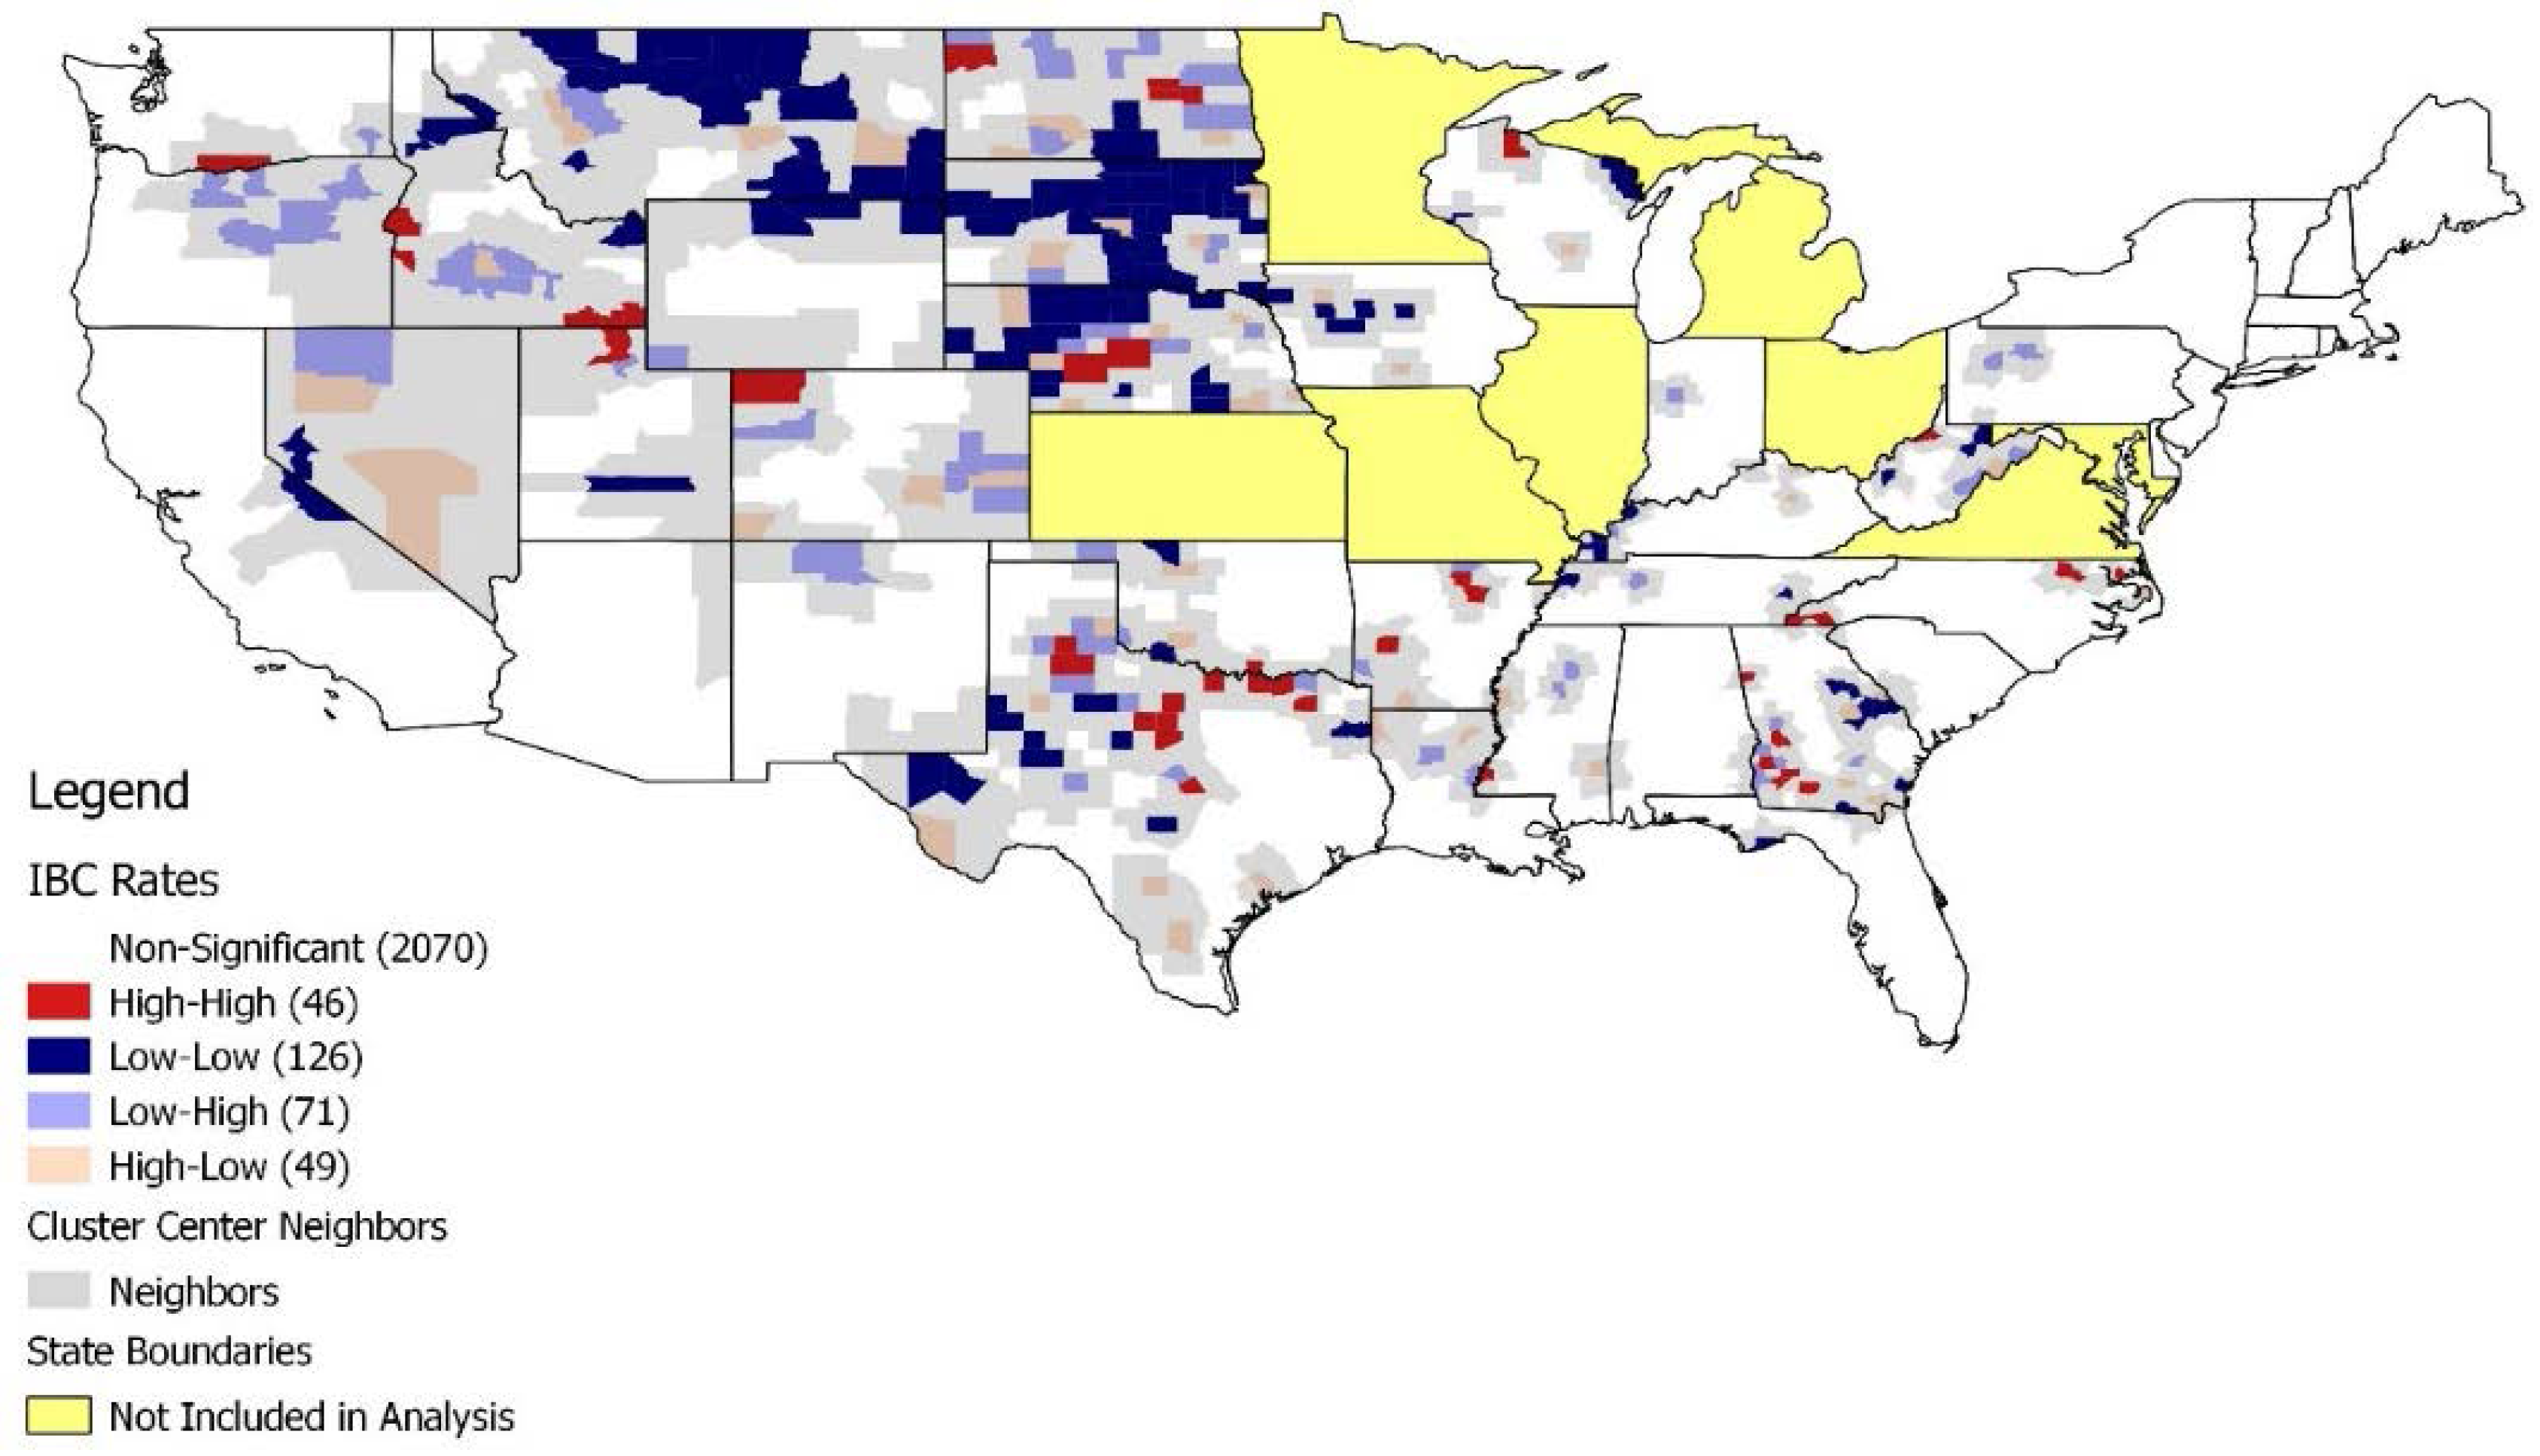
3.2. LISA Test Results
3.3. Comparison of High and Low Cluster Centers
4. Discussion
5. Conclusions
Acknowledgments
Author Contributions
Conflicts of Interest
References
- Hance, K.W.; Anderson, W.F.; Devesa, S.S.; Young, H.A.; Levine, P.H. Trends in inflammatory breast carcinoma incidence and survival: The surveillance, epidemiology, and end results program at the national cancer institute. J. Natl. Cancer Inst. 2005, 97, 966–975. [Google Scholar] [CrossRef] [PubMed]
- Robertson, F.M.; Bondy, M.; Yang, W.; Yamauchi, H.; Wiggins, S.; Kamrudin, S.; Krishnamurthy, S.; Le-Petross, H.; Bidaut, L.; Player, A.N.; et al. Inflammatory breast cancer: The disease, the biology, the treatment. CA Cancer J. Clin. 2010, 60, 351–375. [Google Scholar] [CrossRef] [PubMed]
- Dirix, L.Y.; Dam, P.V.; Prové, A.; Vermeulen, P.B. Inflammatory breast cancer: Current understanding. Curr. Opin. Oncol. 2006, 18, 563–571. [Google Scholar] [CrossRef] [PubMed]
- Anderson, W.F.; Schairer, C.; Chen, B.E.; Hance, K.W.; Levine, P.H. Epidemiology of inflammatory breast cancer (IBC) 1. Breast Dis. 2005, 22, 9–23. [Google Scholar] [CrossRef] [PubMed]
- Levine, P.H.; Veneroso, C. The epidemiology of inflammatory breast cancer. Semin. Oncol. 2008, 35, 11–16. [Google Scholar] [CrossRef] [PubMed]
- Schlichting, J.A.; Soliman, A.S.; Schairer, C.; Schottenfeld, D.; Merajver, S.D. Inflammatory and non-inflammatory breast cancer survival by socioeconomic position in the surveillance, epidemiology, and end results database, 1990–2008. Breast Cancer Res. Treat. 2012, 134, 1257–1268. [Google Scholar] [CrossRef] [PubMed]
- Heck, K.; Wagener, D.; Schatzkin, A.; Devesa, S.; Breen, N. Socioeconomic status and breast cancer mortality, 1989 through 1993: An analysis of education data from death certificates. Am. J. Public Health 1997, 87, 1218–1222. [Google Scholar] [CrossRef] [PubMed]
- Schlichting, J.A.; Soliman, A.S.; Schairer, C.; Banerjee, M.; Rozek, L.S.; Schottenfeld, D.; Harford, J.B.; Merajver, S.D. Association of inflammatory and non-inflammatory breast cancer with socioeconomic characteristics in the surveillance, epidemiology, and end results database, 2000–2007. Cancer Epidemiol. Biomark. Prev. 2012, 21, 155–165. [Google Scholar] [CrossRef] [PubMed]
- Monroe, A.C.; Ricketts, T.C.; Savitz, L.A. Cancer in rural versus urban populations: A review. J. Rural Health 1992, 8, 212–220. [Google Scholar] [CrossRef] [PubMed]
- Richardson, L.C.; Henley, S.J.; Miller, J.W.; Massetti, G.; Thomas, C.C. Patterns and trends in age-specific black-white differences in breast cancer incidence and mortality—United States, 1999–2014. MMWR. Morb. Mortal. Wkly. Rep. 2016, 65, 1093–1098. [Google Scholar] [CrossRef] [PubMed]
- Collaborative Stage Work Group of the American Joint Committee on Cancer. Collaborative Stage Data Collection System User Documentation and Coding Instructions; Version 02.05; American Joint Committee on Cancer: Chicago, IL, USA, 2015. [Google Scholar]
- SAS 9.4. SAS Institute, Inc.: Cary, NC, USA. Available online: https://www.sas.com/ (accessed on 6 September 2016).
- Anselin, L.; Syabri, I.; Kho, Y. GeoDa: An introduction to spatial data analysis. Geogr. Anal. 2006, 38, 5–22. [Google Scholar] [CrossRef]
- Anselin, L.; Bera, A.K.; Florax, R.; Yoon, M.J. Simple diagnostic tests for spatial dependence. Reg. Sci. Urban Econ. 1996, 26, 77–104. [Google Scholar] [CrossRef]
- QGIS Development Team: QGIS Geographic Information System. Open Source Geospatial Foundation Project. 2016. Available online: http://qgis.org/ (accessed on 9 September 2016).
- Mobley, L.R.; Finkelstein, E.A.; Khavjou, O.A.; Will, J.C. Spatial analysis of body mass index and smoking behavior among WISEWOMAN participants. J. Womens Health 2004, 13, 519–528. [Google Scholar] [CrossRef]
- Schieb, L.J.; Mobley, L.R.; George, M.; Casper, M. Tracking stroke hospitalization clusters over time and associations with county-level socioeconomic and healthcare characteristics. Stroke 2013, 44, 146–152. [Google Scholar] [CrossRef] [PubMed]
- Mourali, N.; Muenz, L.R.; Tabbane, F.; Belhassen, S.; Bahi, J.; Levine, P.H. Epidemiologic features of rapidly progressing breast cancer in Tunisia. Cancer 1980, 46, 2741–2746. [Google Scholar] [CrossRef]
- Hirko, K.A.; Soliman, A.S.; Banerjee, M.; Ruterbusch, J.; Harford, J.B.; Merajver, S.D.; Schwartz, K. A comparison of criteria to identify inflammatory breast cancer cases from medical records and the surveillance, epidemiology and end results data base, 2007–2009. Breast J. 2014, 20, 185–191. [Google Scholar] [CrossRef] [PubMed]
- Il’yasova, D.; Siamakpour-Reihani, S.; Akushevich, I.; Akushevich, L.; Spector, N.; Schildkraut, J. What can we learn from the age- and race/ethnicity- specific rates of inflammatory breast carcinoma? Breast Cancer Res. Treat. 2011, 130, 691–697. [Google Scholar] [CrossRef] [PubMed]
- Lund, M.J.; Butler, E.N.; Hair, B.Y.; Ward, K.C.; Andrews, J.H.; Oprea-Ilies, G.; Bayakly, A.R.; O‘Regan, R.M.; Vertino, P.M.; Eley, J.W. Age/race differences in HER2 testing and in incidence rates for breast cancer triple subtypes. Cancer 2010, 116, 2549–2559. [Google Scholar] [CrossRef] [PubMed]
- Gretchen, G.L.; Burke, A.; Anderson, W.F. Epidemiology of triple negative breast cancers. Breast Dis. 2010, 32, 5–24. [Google Scholar]
- Bauer, K.R.; Brown, M.; Cress, R.D.; Parise, C.A.; Caggiano, V. Descriptive analysis of estrogen receptor (ER)-negative, progesterone receptor (PR)-negative, and HER2-negative invasive breast cancer, the so-called triple-negative phenotype: A population-based study from the California cancer registry. Cancer 2007, 109, 1721–1728. [Google Scholar] [CrossRef] [PubMed]
- Parise, C.A.; Bauer, K.R.; Caggiano, V. Variation in breast cancer subtypes with age and race/ethnicity. Crit. Rev. Oncol. Hematol. 2010, 76, 44–52. [Google Scholar] [CrossRef] [PubMed]
- United States Cancer Statistics. Centers for Disease Control and Prevention. Available online: https://www.cdc.gov/rdc/b1datatype/dt131.htm (accessed on 16 August 2016).


| Variables | IBC Cases, n (%) |
|---|---|
| Age (years) | |
| <40 | 1752 (8.59%) |
| 40–49 | 3956 (19.40%) |
| 50–64 | 8434 (41.37%) |
| 65–74 | 3337 (16.37%) |
| 75+ | 2909 (14.27%) |
| Race | |
| White | 14,267 (69.98%) |
| Black | 3504 (17.19%) |
| Hispanic | 1966 (9.64%) |
| Other | 651 (3.19%) |
| Variable | All Counties (n = 2362), Mean (SD) | High-Rate Cluster Centers (n = 46), Mean (SD) | Low-Rate Cluster Centers (n = 126), Mean (SD) | p Value a |
|---|---|---|---|---|
| IBC Rate b | 28.64 (28.56) | 62.71 (38.97) | 5.17 (9.61) | <0.0001 |
| Study population | ||||
| Race (proportion) | ||||
| White | 0.84 (0.18) | 0.86 (0.16) | 0.89 (0.18) | 0.034 |
| Black | 0.08 (0.14) | 0.09 (0.17) | 0.03 (0.11) | 0.000 |
| Age (years) | ||||
| <40 | 0.04 (0.02) | 0.04 (0.03) | 0.03 (0.03) | 0.146 |
| 40–49 | 0.16 (0.05) | 0.13 (0.05) | 0.14 (0.09) | 0.569 |
| 50–64 | 0.38 (0.07) | 0.36 (0.06) | 0.36 (0.13) | 0.716 |
| 65–74 | 0.23 (0.07) | 0.26 (0.08) | 0.23 (0.09) | 0.050 |
| 75+ | 0.19 (0.06) | 0.21 (0.08) | 0.23 (0.11) | 0.217 |
| County area contextual variables | ||||
| percent unemployed | 5.41 (1.80) | 5.00 (1.48) | 4.51 (1.84) | 0.007 |
| percent uninsured | 19.07 (6.23) | 21.15 (6.57) | 21.25 (6.82) | 0.898 |
| percent in poverty | 16.12 (6.74) | 16.9 (5.16) | 15.69 (6.72) | 0.048 |
| proportion rural | 0.60 (0.31) | 0.65 (0.28) | 0.77 (0.28) | 0.012 |
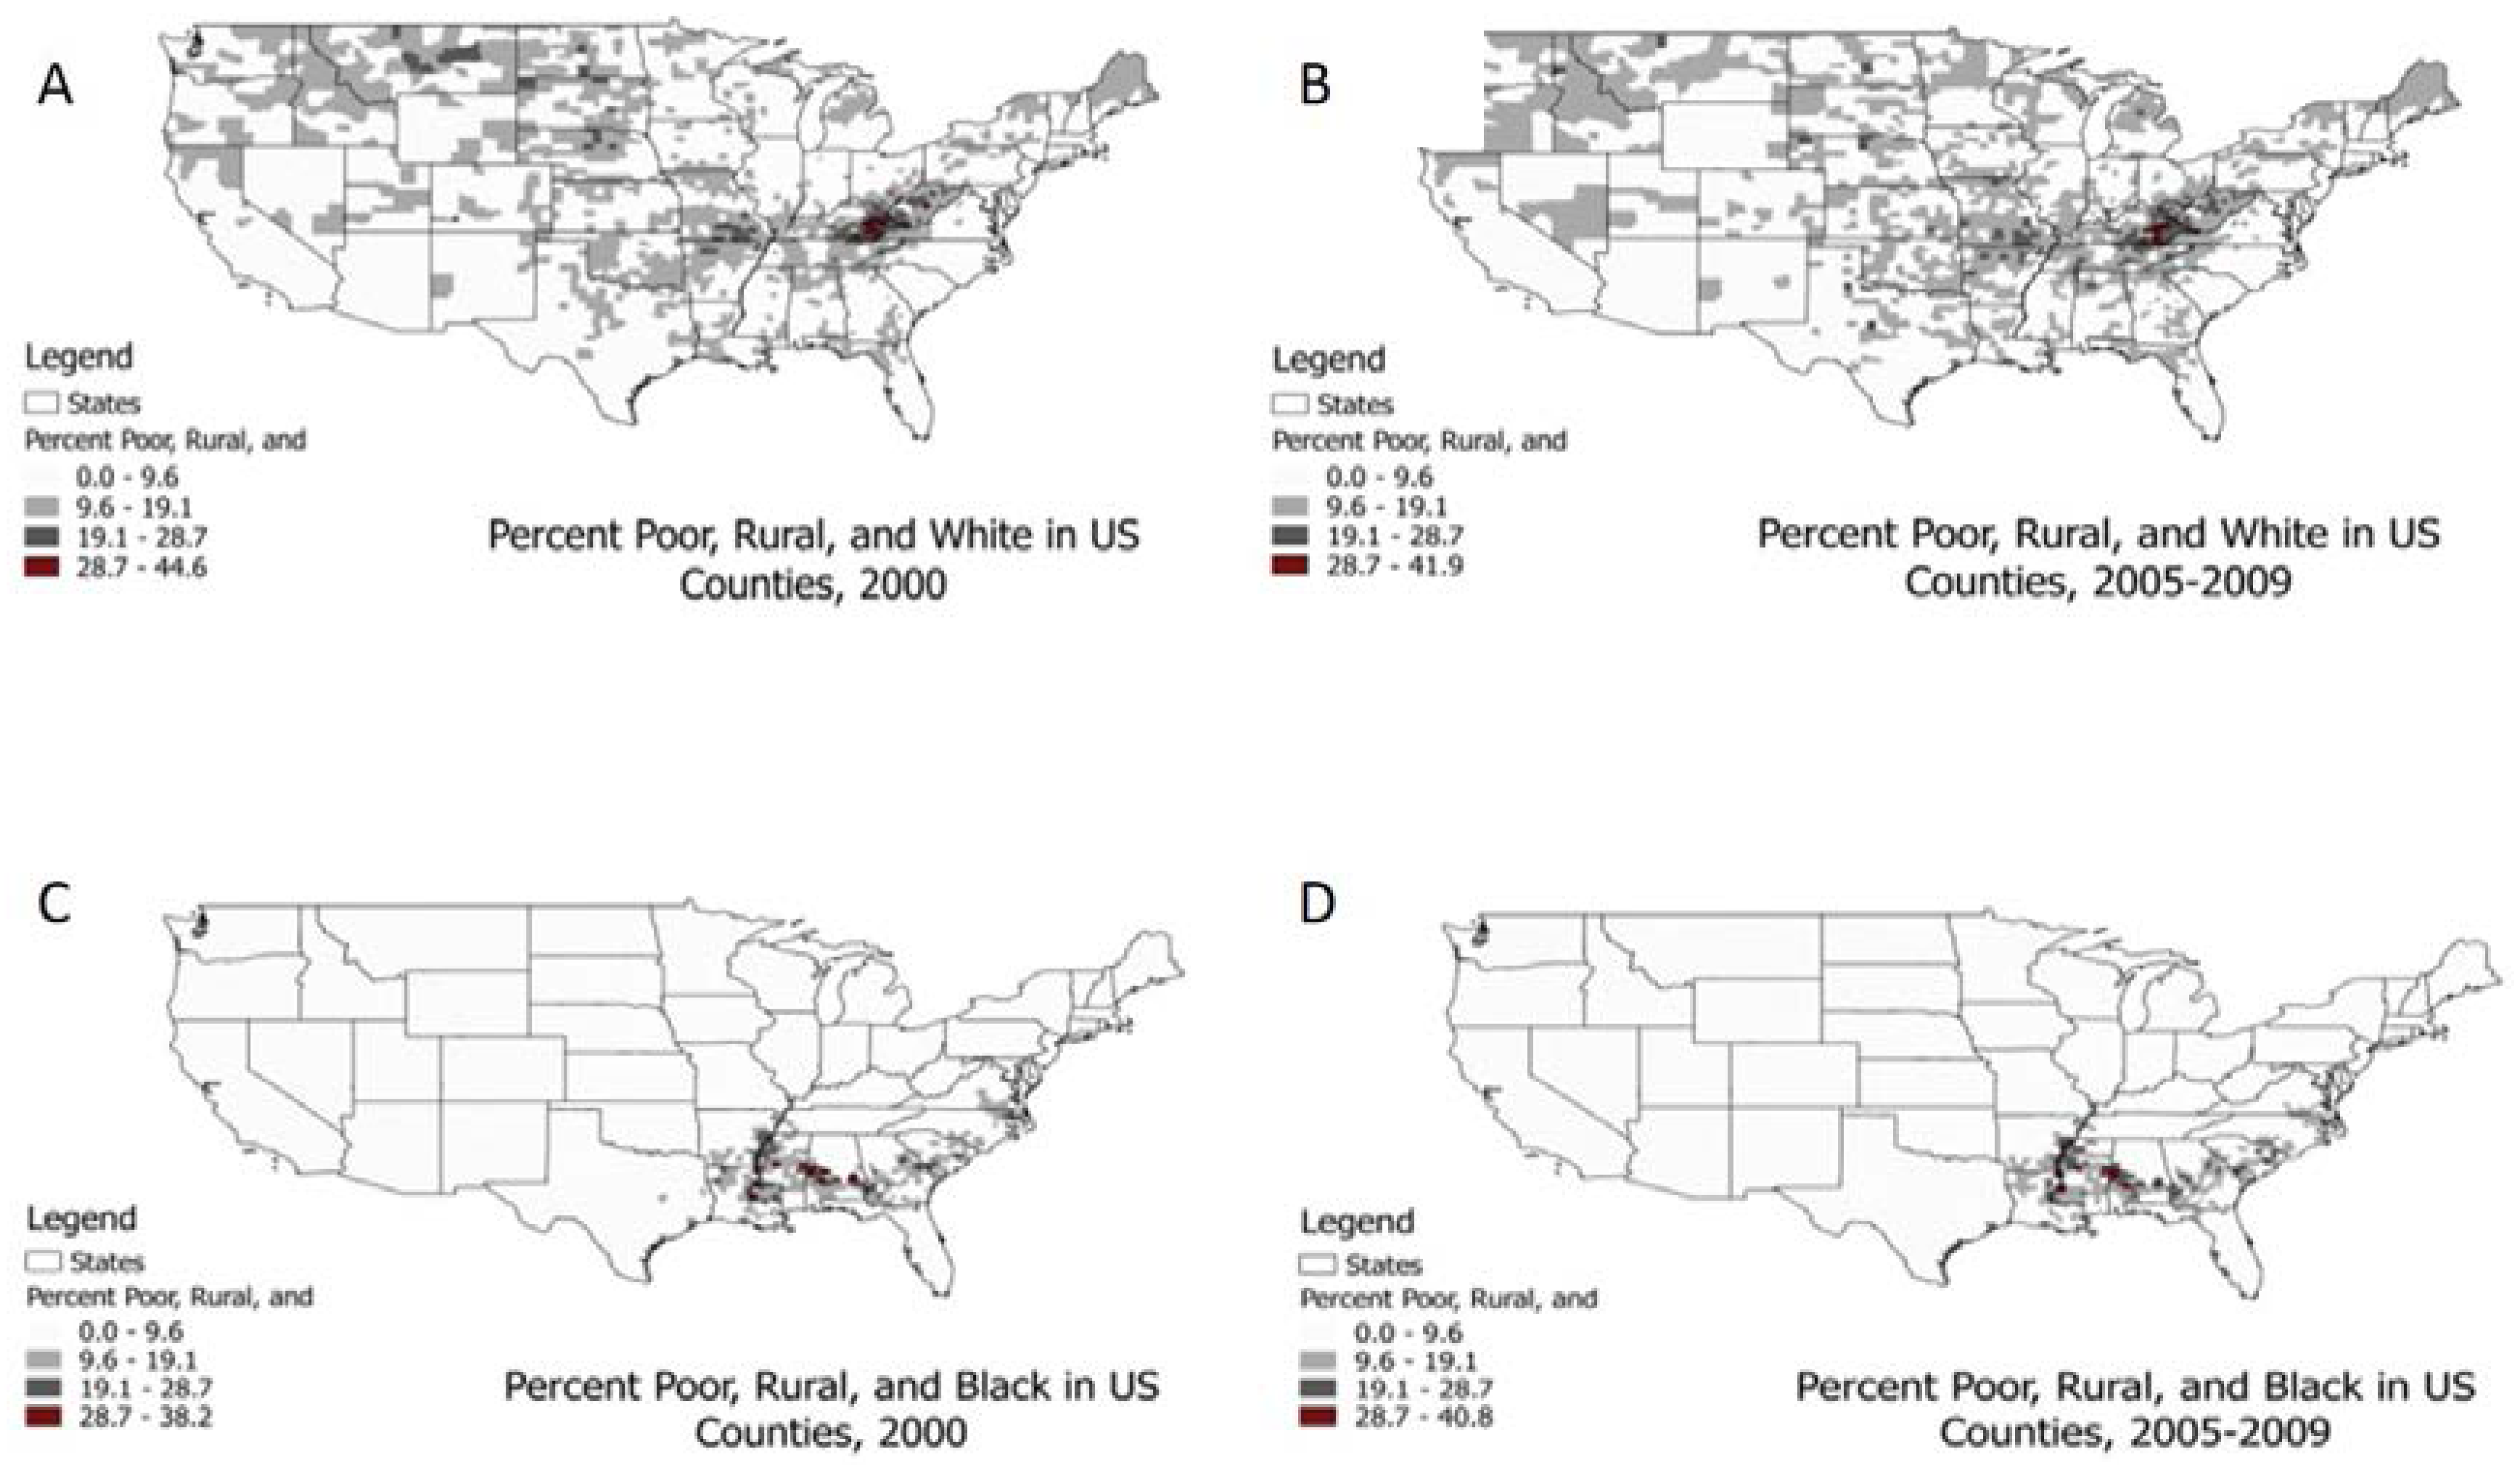
| percent poor-black-rural | 2.42 (5.13) | 2.91 (5.7) | 1.28 (4.30) | 0.000 |
| percent poor-black-urban | 0.65 (1.97) | 0.69 (2.65) | 0.11 (0.58) | 0.014 |
| percent poor-white-rural | 8.37 (5.57) | 9.22 (4.98) | 9.29 (4.74) | 0.988 |
| percent poor-white-urban | 1.32 (2.27) | 1.07 (2.03) | 0.57 (1.74) | 0.018 |
© 2017 by the authors. Licensee MDPI, Basel, Switzerland. This article is an open access article distributed under the terms and conditions of the Creative Commons Attribution (CC BY) license (http://creativecommons.org/licenses/by/4.0/).
Share and Cite
Scott, L.; Mobley, L.R.; Il’yasova, D. Geospatial Analysis of Inflammatory Breast Cancer and Associated Community Characteristics in the United States. Int. J. Environ. Res. Public Health 2017, 14, 404. https://doi.org/10.3390/ijerph14040404
Scott L, Mobley LR, Il’yasova D. Geospatial Analysis of Inflammatory Breast Cancer and Associated Community Characteristics in the United States. International Journal of Environmental Research and Public Health. 2017; 14(4):404. https://doi.org/10.3390/ijerph14040404
Chicago/Turabian StyleScott, Lia, Lee R. Mobley, and Dora Il’yasova. 2017. "Geospatial Analysis of Inflammatory Breast Cancer and Associated Community Characteristics in the United States" International Journal of Environmental Research and Public Health 14, no. 4: 404. https://doi.org/10.3390/ijerph14040404