
Assessing Diabetes and Factors Associated with Foregoing Medical Care among Persons with Diabetes: Disparities Facing American Indian/Alaska Native, Black, Hispanic, Low Income, and Southern Adults in the U.S. (2011–2015)

 ,
,
Abstract
:1. Introduction
1.1. Geospatial and Social Determinants of Health
1.2. Objective
2. Materials and Methods
2.1. Data
2.2. Dependent Variables
2.2.1. Dependent Variable 1
2.2.2. Dependent Variable 2
2.3. Independent Variables
2.4. Statistical Analyses
2.5. Ethics
3. Results
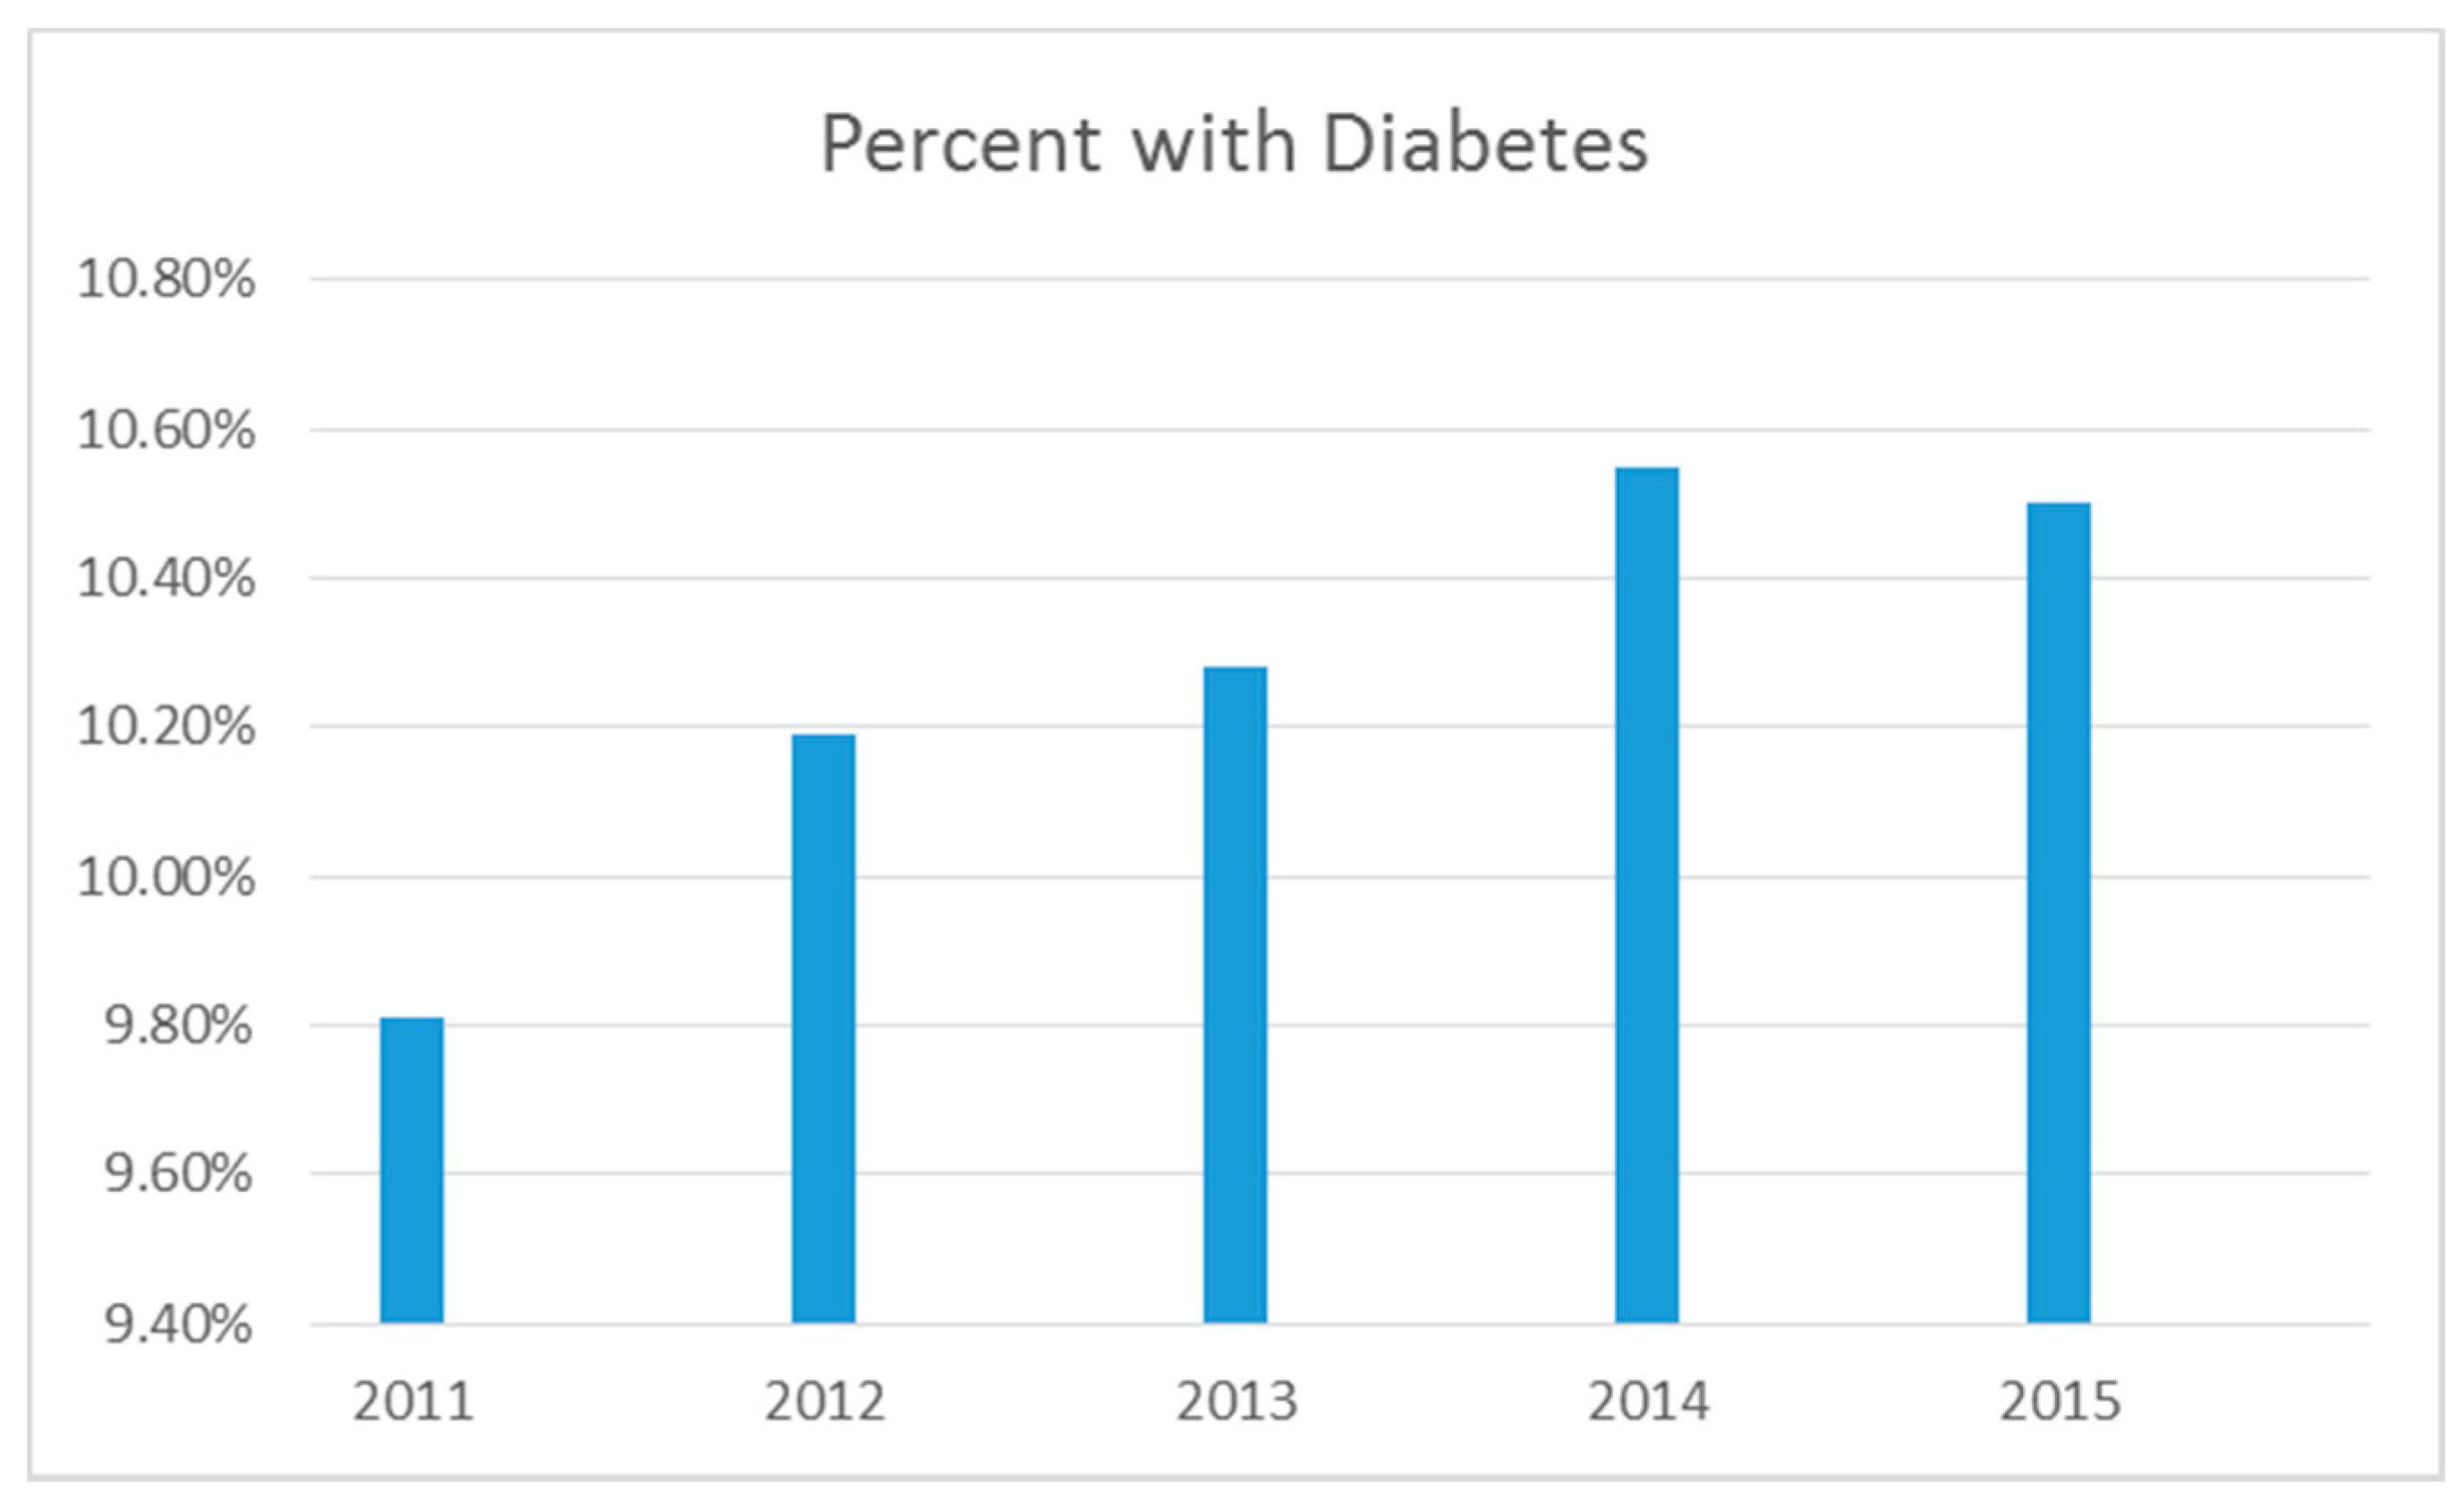
3.1. Diagnosed with Diabetes
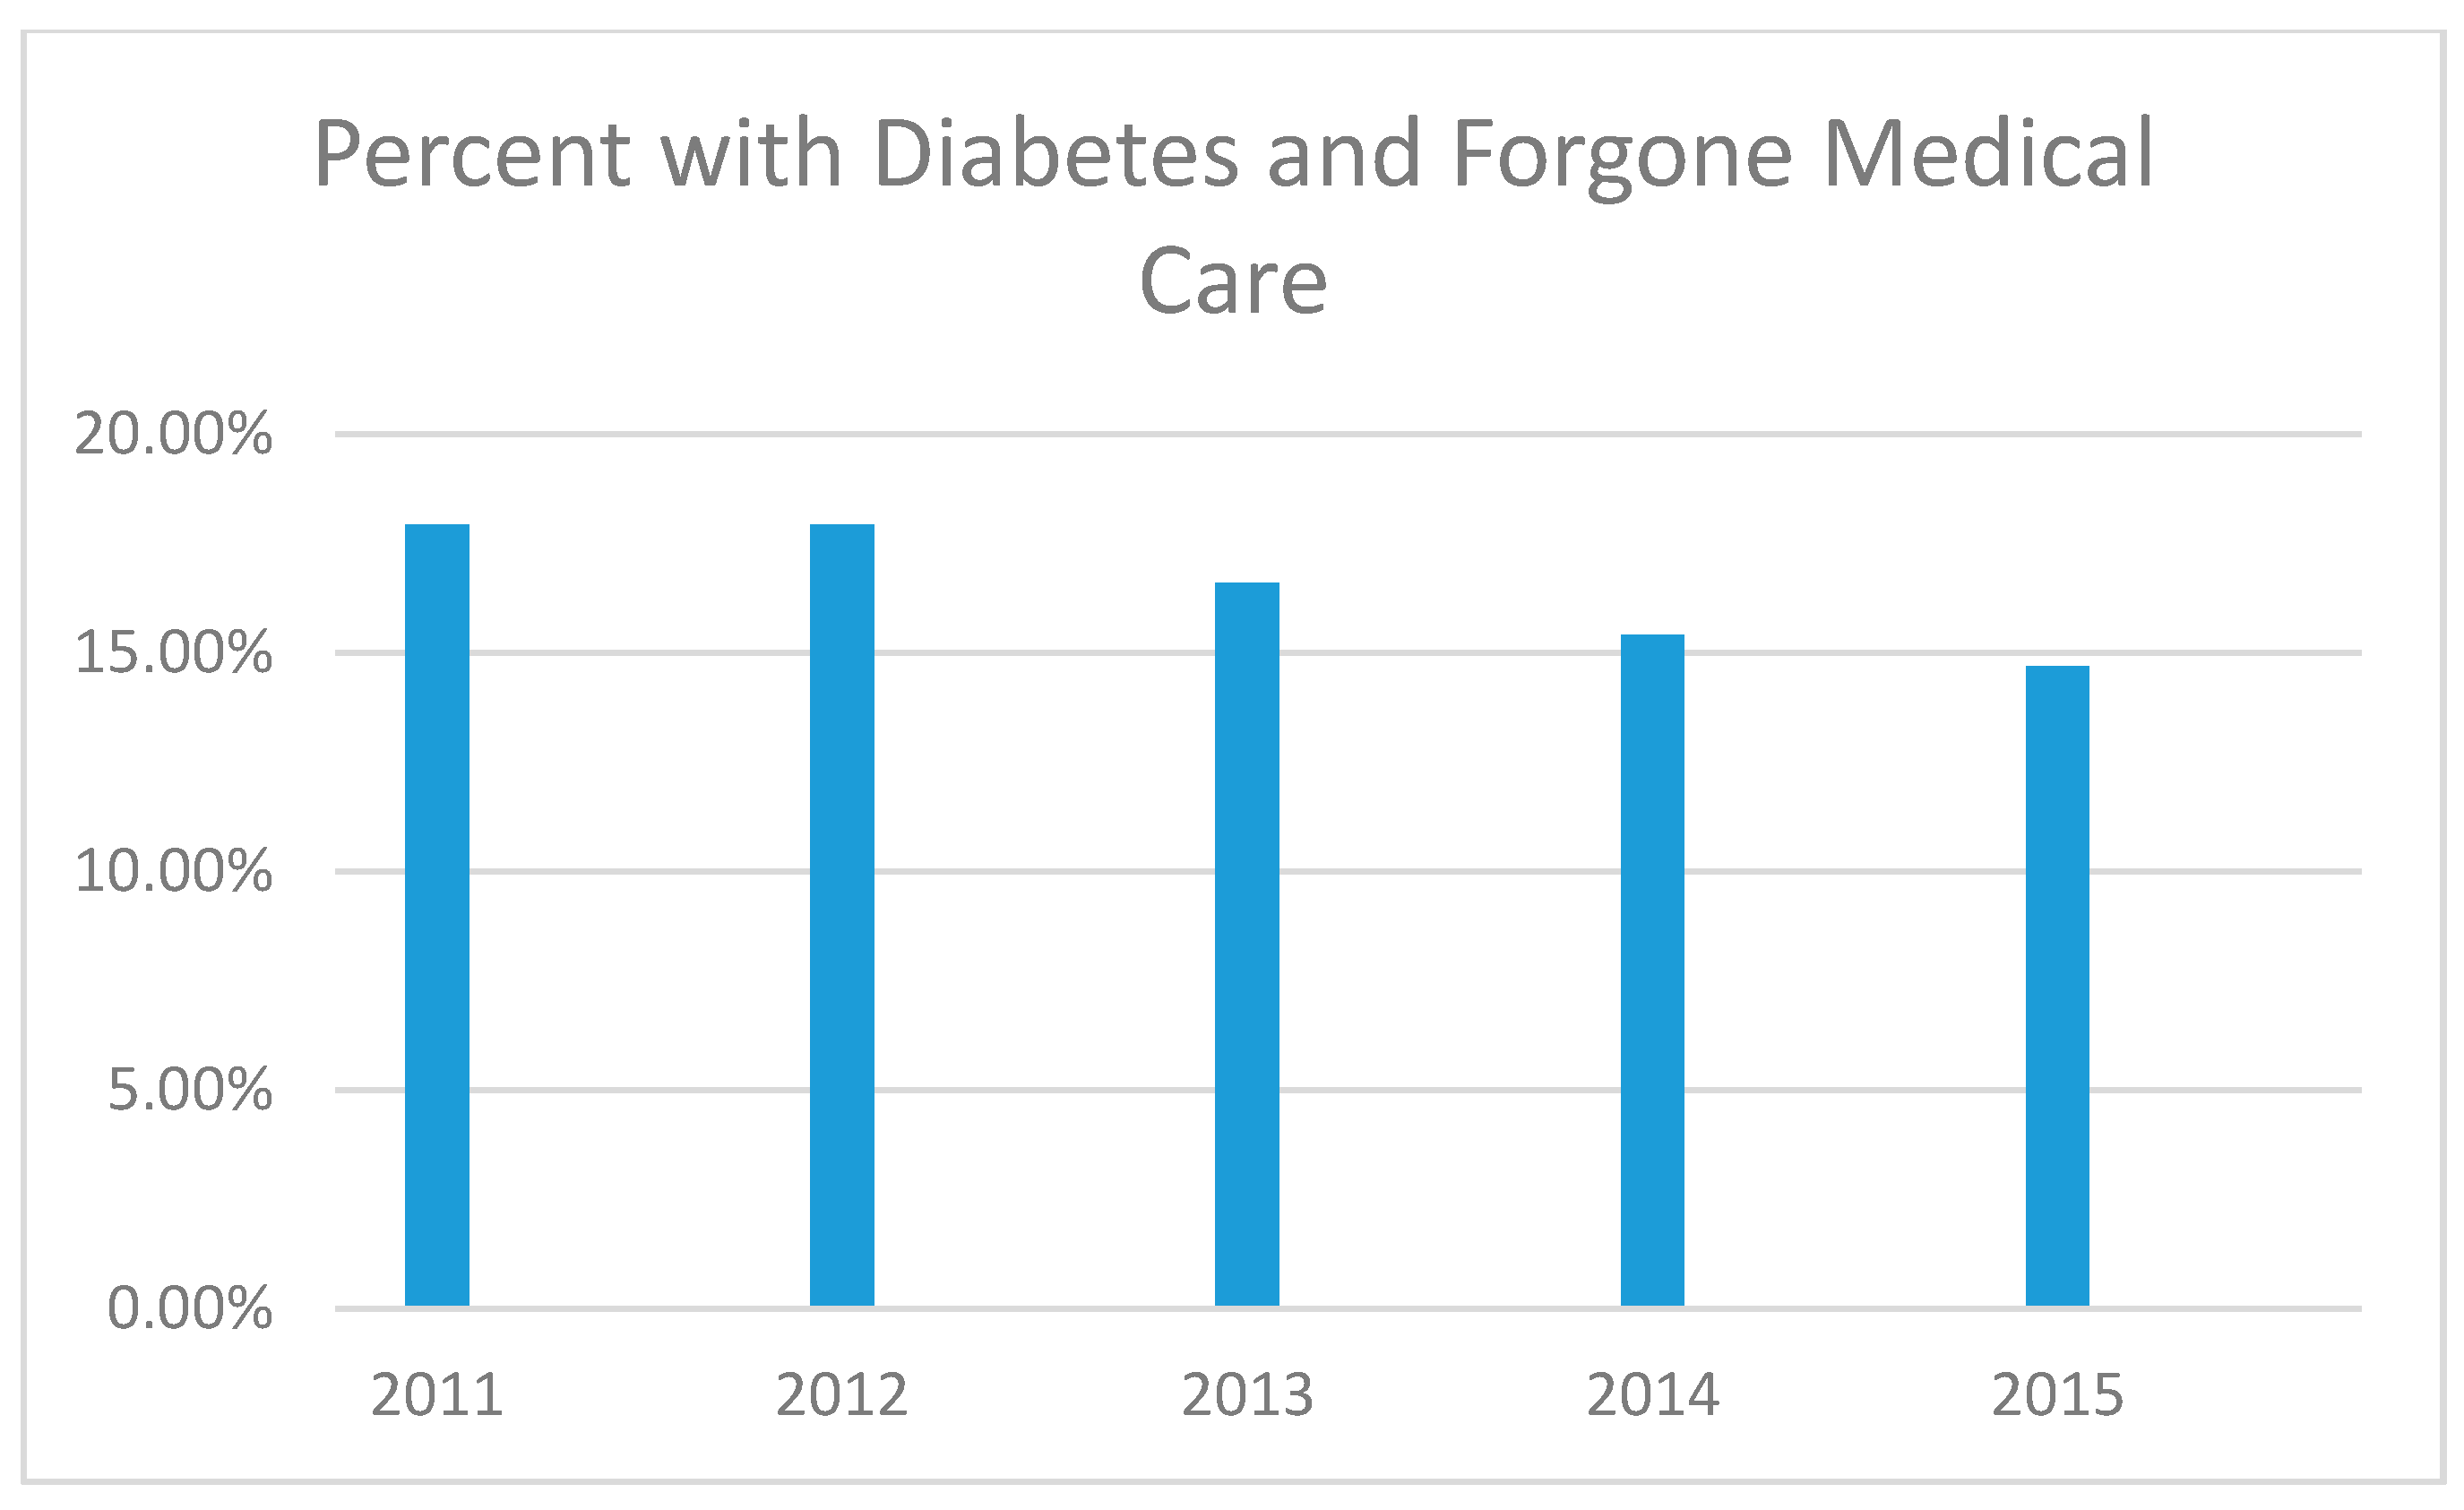
3.2. Forgone Medical Care among Those Diangnosed with Diabetes
3.3. Bivariate Logistic Regression for Those Diagnosed with Diabetes
3.4. Multivariable Logistic Regression for Those Diagnosed with Diabetes
3.5. Bivariate Logistic Regression for Forgone Medical Care among Those Diagnosed with Diabetes
3.6. Multivariable Logistic Regression for Forgone Medical Care among Those Diagnosed with Diabetes
4. Discussion
5. Limitations
Practice and Policy Implications
6. Conclusions
Acknowledgments
Author Contributions
Conflicts of Interest
References
- Centers for Disease Control and Prevention. National Diabetes Fact Sheet: National Estimates and General Information on Diabetes and Prediabetes in the United States, 2011; U.S. Department of Health and Human Services, Centers for Disease Control and Prevention: Atlanta, GA, USA, 2011; Volume 201.
- Centers for Disease Control and Prevention. National Diabetes Statistics Report: Estimates of Diabetes and Its Burden in the United States, 2014; U.S. Department of Health and Human Services: Atlanta, GA, USA, 2014.
- NIH: National Institute of Diabetes and Digestive and Kidney Diseases. Prediabetes. Available online: https://medlineplus.gov/prediabetes.html (accessed on 1 January 2017).
- Centers for Disease Control and Prevention. United States Diabetes Surveillance System. Diagnosed Diabetes. Available online: https://gis.cdc.gov/grasp/diabetes/diabetesatlas.html# (accessed on 1 January 2017).
- Huang, E.S.; Laiteerapong, N.; Liu, J.Y.; John, P.M.; Moffet, H.H.; Karter, A.J. Rates of complications and mortality in older patients with diabetes mellitus: The diabetes and aging study. JAMA Intern. Med. 2014, 174, 251–258. [Google Scholar] [CrossRef] [PubMed]
- McEwen, L.N.; Kim, C.; Karter, A.J.; Haan, M.N.; Ghosh, D.; Lantz, P.M.; Mangione, C.M.; Thompson, T.J.; Herman, W.H. Risk factors for mortality among patients with diabetes. Diabetes Care 2007, 30, 1736–1741. [Google Scholar] [CrossRef] [PubMed]
- National Center for Chronic Disease Prevention and Health Promotion, Division of Diabetes Translation. Diabetes Surveillance Data. Available online: https://www.cdc.gov/diabetes/data/statistics/faqs.html (accessed on 1 January 2017).
- National Institute of Diabetes and Digestive and Kidney Diseases. Diabetes Is Preventable. Available online: https://www.niddk.nih.gov/health-information/health-communication-programs/ndep/am-i-at-risk/diabetes-preventable/pages/diabetesispreventable.aspx (accessed on 1 January 2017).
- Sallis, J.F.; Glanz, K. The role of built environments in physical activity, eating, and obesity in childhood. Future Child. 2006, 16, 89–108. [Google Scholar] [CrossRef] [PubMed]
- Rabi, D.M.; Edwards, A.L.; Southern, D.A.; Svenson, L.W.; Sargious, P.M.; Norton, P.; Larsen, E.T.; Ghali, W.A. Association of socio-economic status with diabetes prevalence and utilization of diabetes care services. BMC Health Serv. Res. 2006, 6, 124. [Google Scholar] [CrossRef] [PubMed]
- Stephens, J.; Artiga, S.; Paradise, J. Health Coverage and Care in the South in 2014 and Beyond; Henry J. Kaiser Family Foundation: Menlo Park, CA, USA, 2014. [Google Scholar]
- Solar, O.; Irwin, A. A Conceptual Framework for Action on the Social Determinants of Health; Social Determinants of Health Discussion Paper 2; World Health Organization: Geneva, Switzerland, 2007. [Google Scholar]
- Peek, M.E.; Cargill, A.; Huang, E.S. Diabetes health disparities a systematic review of health care interventions. Med. Care Res. Rev. 2007, 64, 101S–156S. [Google Scholar] [CrossRef] [PubMed]
- Gaskin, D.J.; Thorpe, R.J., Jr.; McGinty, E.E.; Bower, K.; Rohde, C.; Young, J.H.; LaVeist, T.A.; Dubay, L. Disparities in diabetes: The nexus of race, poverty, and place. Am. J. Public Health 2014, 104, 2147–2155. [Google Scholar] [CrossRef] [PubMed]
- Nicklett, E.J. Socioeconomic status and race/ethnicity independently predict health decline among older diabetics. BMC Public Health 2011, 11, 684. [Google Scholar] [CrossRef] [PubMed]
- Kelley, A.; Giroux, J.; Schulz, M.; Aronson, B.; Wallace, D.; Bell, R.; Morrison, S. American-Indian diabetes mortality in the great plains region 2002–2010. BMJ Open Diabetes Res. Care 2015, 3, e000070. [Google Scholar] [CrossRef] [PubMed]
- Deshpande, A.D.; Harris-Hayes, M.; Schootman, M. Epidemiology of diabetes and diabetes-related complications. Phys. Ther. 2008, 88, 1254. [Google Scholar] [CrossRef] [PubMed]
- Hale, N.L.; Bennett, K.J.; Probst, J.C. Diabetes care and outcomes: Disparities across rural America. J. Community Health 2010, 35, 365–374. [Google Scholar] [CrossRef] [PubMed]
- Bolin, J.N.; Schulze, A.; Helduser, J.; Ory, M.G. The burden of diabetes in rural America. In Rural Healthy People 2020; Bolin, J.N., Bellamy, G., Ferdinand, A.O., Eds.; The Texas A&M University Health Science Center, School of Public Health, Southwest Rural Health Research Center: College Station, TX, USA, 2015; pp. 43–53. [Google Scholar]
- Canedo, J.R.; Miller, S.T.; Schlundt, D.; Fadden, M.K.; Sanderson, M. Racial/ethnic disparities in diabetes quality of care: The role of healthcare access and socioeconomic status. J. Racial Ethn. Health Dispar. 2017. [Google Scholar] [CrossRef] [PubMed]
- Walker, R.J.; Williams, J.S.; Egede, L.E. Influence of race, ethnicity and social determinants of health on diabetes outcomes. Am. J. Med. Sci. 2016, 351, 366–373. [Google Scholar] [CrossRef] [PubMed]
- Notah Begay III Foundation. Social Determinants of Health of Type 2 Diabetes and Obesity in Native American Children. 2015. Available online: http://www.nb3foundation.org/assets/docs/2015-10-20-sdoh%20full%20summary%20final.pdf (accessed on 1 January 2017).
- Connolly, V.; Unwin, N.; Sherriff, P.; Bilous, R.; Kelly, W. Diabetes prevalence and socioeconomic status: A population based study showing increased prevalence of type 2 diabetes mellitus in deprived areas. J. Epidemiol. Community Health 2000, 54, 173–177. [Google Scholar] [CrossRef] [PubMed]
- Krishna, S.; Gillespie, K.N.; McBride, T.M. Diabetes burden and access to preventive care in the rural United States. J. Rural Health 2010, 26, 3–11. [Google Scholar] [CrossRef] [PubMed]
- Towne, S.D., Jr.; Probst, J.C.; Hardin, J.W.; Bell, B.A.; Glover, S. Differences in the effects of the great recession on health outcomes among minority working-age adults. J. Racial Ethn. Health Dispar. 2015, 2, 43–52. [Google Scholar] [CrossRef] [PubMed]
- Nicklett, E.J.; Damiano, S.K. Too little, too late: Socioeconomic disparities in the experience of women living with diabetes. Qual. Soc. Work 2014, 13, 372–388. [Google Scholar] [CrossRef] [PubMed]
- American Diabetes Association. The Cost of Diabetes. Available online: http://www.diabetes.org/advocacy/news-events/cost-of-diabetes.html?referrer=https://www.google.com/ (accessed on 1 January 2017).
- Jiang, L.; Manson, S.M.; Beals, J.; Henderson, W.G.; Huang, H.; Acton, K.J.; Roubideaux, Y.; Special Diabetes Program for Indians Diabetes Prevention Demonstration Project. Translating the diabetes prevention program into american indian and alaska native communities. Diabetes Care 2013, 36, 2027–2034. [Google Scholar] [CrossRef] [PubMed]
- ¡Sí, Yo Puedo Controlar Mi Diabetes! Available online: http://fcs.tamu.edu/yopuedo/ (accessed on 1 January 2017).
- Anderson, G. Chronic Care: Making the Case for Ongoing Care; Robert Wood Johnson Foundation: Princeton, NJ, USA, 2010. [Google Scholar]
- Lorig, K.R.; Sobel, D.S.; Stewart, A.L.; Brown, B.W., Jr.; Bandura, A.; Ritter, P.; Gonzalez, V.M.; Laurent, D.D.; Holman, H.R. Evidence suggesting that a chronic disease self-management program can improve health status while reducing hospitalization: A randomized trial. Med. Care 1999, 37, 5–14. [Google Scholar] [CrossRef] [PubMed]
- Lorig, K.R.; Ritter, P.; Stewart, A.L.; Sobel, D.S.; Brown, B.W., Jr.; Bandura, A.; Gonzalez, V.M.; Laurent, D.D.; Holman, H.R. Chronic disease self-management program: 2-year health status and health care utilization outcomes. Med. Care 2001, 39, 1217–1223. [Google Scholar] [CrossRef] [PubMed]
- Ory, M.G.; Ahn, S.; Jiang, L.; Smith, M.L.; Ritter, P.L.; Whitelaw, N.; Lorig, K. Successes of a national study of the chronic disease self-management program: Meeting the triple aim of health care reform. Med. Care 2013, 51, 992–998. [Google Scholar] [CrossRef] [PubMed]
- Lorig, K.R.; Sobel, D.S.; Ritter, P.L.; Laurent, D.; Hobbs, M. Effect of a self-management program on patients with chronic disease. Eff. Clin. Pract. 2001, 4, 256–262. [Google Scholar] [PubMed]
- Towne, S.D., Jr.; Smith, M.L.; Ahn, S.; Ory, M.G. The reach of chronic disease self-management education programs to rural populations. Front. Public Health 2015. [Google Scholar] [CrossRef] [PubMed]
- Department of Noncommunicable Disease Surveillance, World Health Organization. Definition, Diagnosis and Classification of Diabetes Mellitus and Its Complications: Report of a WHO Consultation. Part 1, Diagnosis and Classification of Diabetes Mellitus; World Health Organization: Geneva, Switzerland, 1999. [Google Scholar]
- Garvey, W.T.; Ryan, D.H.; Henry, R.; Bohannon, N.J.; Toplak, H.; Schwiers, M.; Troupin, B.; Day, W.W. Prevention of type 2 diabetes in subjects with prediabetes and metabolic syndrome treated with phentermine and topiramate extended release. Diabetes Care 2014, 37, 912–921. [Google Scholar] [CrossRef] [PubMed]
- Funnell, M.M.; Brown, T.L.; Childs, B.P.; Haas, L.B.; Hosey, G.M.; Jensen, B.; Maryniuk, M.; Peyrot, M.; Piette, J.D.; Reader, D. National standards for diabetes self-management education. Diabetes Care 2009, 32, S87–S94. [Google Scholar] [CrossRef] [PubMed]


| Variables | 2011 | 2012 | 2013 | 2014 | 2015 | ||||||
|---|---|---|---|---|---|---|---|---|---|---|---|
| Total Unweighted Sample Size | n = 506,467 | n = 475,687 | n = 491,773 | n = 464,664 | n = 441,456 | ||||||
| Unweighted Sample Size with Diabetes | n = 62,461 | n = 59,763 | n = 62,345 | n = 61,118 | n = 57,256 | ||||||
| Percent with Diabetes | Percent with Diabetes and Forgone Medical Care | Percent with Diabetes | Percent with Diabetes and Forgone Medical Care | Percent with Diabetes | Percent with Diabetes and Forgone Medical Care | Percent with Diabetes | Percent with Diabetes and Forgone Medical Care | Percent with Diabetes | Percent with Diabetes and Forgone Medical Care | ||
| Total | 9.81% | 17.92% | 10.19% | 17.92% | 10.28% | 16.59% | 10.55% | 15.41% | 10.50% | 14.69% | |
| Age | 18–24 years | 0.95% | 35.06% | 1.10% | 34.77% | 1.20% | 31.27% | 0.91% | 22.48% | 0.82% | 18.19% |
| 25–34 years | 2.18% | 35.01% | 2.26% | 27.99% | 2.10% | 36.37% | 2.16% | 32.17% | 1.80% | 29.09% | |
| 35–44 years | 5.24% | 29.84% | 5.80% | 32.80% | 5.16% | 26.21% | 5.24% | 29.54% | 5.34% | 23.67% | |
| 45–54 years | 10.28% | 27.89% | 10.52% | 27.69% | 10.73% | 26.41% | 10.97% | 23.46% | 10.52% | 23.04% | |
| 55–64 years | 16.83% | 18.83% | 17.08% | 20.05% | 17.01% | 19.34% | 17.63% | 16.66% | 17.53% | 16.36% | |
| 65 and older | 21.53% | 7.11% | 21.78% | 6.42% | 22.40% | 5.91% | 22.73% | 6.54% | 22.86% | 7.35% | |
| Income | Missing/don’t know | 9.81% | 15.59% | 10.00% | 16.04% | 10.39% | 14.11% | 10.39% | 13.78% | 10.21% | 13.10% |
| <$15,000 | 14.98% | 28.64% | 15.16% | 30.92% | 15.68% | 27.26% | 16.69% | 25.40% | 16.39% | 23.83% | |
| $15,000–<$25,000 | 12.79% | 24.27% | 13.24% | 24.70% | 13.45% | 23.83% | 13.85% | 23.28% | 14.45% | 21.12% | |
| $25,000–<$35,000 | 11.46% | 18.10% | 11.80% | 17.76% | 11.82% | 18.82% | 11.66% | 15.30% | 12.03% | 16.79% | |
| $35,000–<$50,000 | 9.46% | 14.43% | 10.32% | 12.70% | 10.05% | 10.69% | 10.41% | 12.01% | 10.27% | 11.63% | |
| ≥$50,000 | 6.51% | 7.53% | 6.96% | 7.19% | 6.91% | 6.39% | 7.28% | 5.29% | 7.48% | 6.79% | |
| Sex | Male | 10.09% | 15.70% | 10.63% | 15.88% | 10.46% | 14.79% | 10.92% | 13.79% | 10.94% | 13.50% |
| Female | 9.54% | 20.15% | 9.78% | 20.01% | 10.11% | 18.34% | 10.20% | 17.05% | 10.08% | 15.91% | |
| Education | Did not graduate High School | 15.11% | 23.79% | 15.83% | 24.36% | 16.03% | 23.57% | 16.21% | 21.91% | 16.64% | 20.82% |
| Graduated High School | 10.79% | 18.33% | 11.14% | 18.11% | 11.28% | 16.54% | 11.68% | 15.44% | 11.41% | 13.86% | |
| Attended College or Technical School | 9.12% | 16.93% | 9.45% | 16.55% | 9.61% | 14.94% | 9.86% | 14.14% | 9.88% | 14.12% | |
| Graduated from College or Technical School | 6.32% | 10.41% | 6.69% | 10.97% | 6.58% | 9.46% | 7.02% | 9.03% | 6.92% | 8.98% | |
| Race/Ethnicity | Hispanic | 10.38% | 28.33% | 11.11% | 27.13% | 10.93% | 25.84% | 11.16% | 23.73% | 10.68% | 22.83% |
| Other | 9.38% | 21.76% | 10.46% | 23.67% | 10.92% | 19.37% | 10.29% | 19.78% | 8.90% | 19.17% | |
| American Indian or Alaska Native | 14.76% | 22.39% | 14.74% | 24.72% | 14.76% | 21.47% | 15.15% | 20.30% | 16.68% | 20.82% | |
| Asian | 7.74% | 13.00% | 7.91% | 14.55% | 8.34% | 11.67% | 7.33% | 13.26% | 8.81% | 13.86% | |
| Black or African American | 13.22% | 22.06% | 13.48% | 21.62% | 14.23% | 19.15% | 14.72% | 17.62% | 14.32% | 17.71% | |
| White | 9.11% | 14.22% | 9.41% | 14.02% | 9.45% | 13.31% | 9.83% | 12.31% | 9.83% | 11.24% | |
| Rurality (2-level) | Urban | 10.64% | 15.23% | 12.09% | 14.08% | 13.05% | 12.14% | 13.37% | 11.27% | 14.01% | 11.44% |
| Rural (Not in an MSA) | 12.37% | 16.93% | 13.39% | 15.05% | 14.19% | 13.91% | 14.59% | 13.79% | 15.22% | 12.75% | |
| Rurality (4-level) | In the center city of an MSA | 11.24% | 15.85% | 12.81% | 14.59% | 13.73% | 13.41% | 14.01% | 11.47% | 13.98% | 11.03% |
| Outside the center city of an MSA but inside the county containing the center city | 9.80% | 14.98% | 11.16% | 13.59% | 12.39% | 10.87% | 12.94% | 10.63% | 13.50% | 11.66% | |
| Inside a suburban county of the MSA | 10.75% | 14.10% | 12.10% | 13.64% | 12.54% | 10.90% | 12.66% | 11.73% | 15.93% | 13.33% | |
| Not in an MSA (rural) | 12.37% | 16.93% | 13.39% | 15.05% | 14.19% | 13.91% | 14.59% | 13.79% | 15.22% | 12.75% | |
| Census Region | South | 10.66% | 21.27% | 11.00% | 21.29% | 11.22% | 19.47% | 11.38% | 18.03% | 11.64% | 17.84% |
| North | 9.46% | 14.64% | 9.54% | 12.78% | 9.75% | 13.08% | 10.08% | 12.62% | 9.59% | 11.52% | |
| Midwest | 9.46% | 15.43% | 9.90% | 15.60% | 9.69% | 14.39% | 10.24% | 12.93% | 10.08% | 12.29% | |
| Western/Pacific | 8.79% | 16.50% | 9.36% | 18.13% | 9.48% | 15.93% | 9.61% | 15.19% | 9.47% | 13.46% | |
| State Median Income | |||||||||||
| Medicaid Expansion in 2014 | Not Expanded | 10.22% | 19.66% | 10.57% | 19.48% | 10.70% | 17.96% | 10.90% | 16.68% | 11.01% | 16.57% |
| Expanded | 9.30% | 15.92% | 9.67% | 16.33% | 9.75% | 15.08% | 10.08% | 14.09% | 9.86% | 12.69% | |
| Variables | 2011 | 2012 | 2013 | 2014 | 2015 | ||||||||||||||||
|---|---|---|---|---|---|---|---|---|---|---|---|---|---|---|---|---|---|---|---|---|---|
| OR | 99% Confidence Intervals | p-Value | OR | 99% Confidence Intervals | p-Value | OR | 99% Confidence Intervals | p-Value | OR | 99% Confidence Intervals | p-Value | OR | 99% Confidence Intervals | p-Value | |||||||
| Income | Missing/don’t know | 1.563 ** | 1.454 | 1.68 | <0.0001 | 1.487 ** | 1.367 | 1.617 | <0.0001 | 1.561 ** | 1.443 | 1.688 | <0.0001 | 1.476 ** | 1.37 | 1.591 | <0.0001 | 1.406 ** | 1.312 | 1.507 | <0.0001 |
| <$15,000 vs. ≥$50,000 | 2.532 ** | 2.353 | 2.726 | 2.390 ** | 2.211 | 2.582 | 2.503 ** | 2.306 | 2.718 | 2.552 ** | 2.363 | 2.757 | 2.424 ** | 2.236 | 2.627 | ||||||
| $15,000–<$25,000 vs. ≥$50,000 | 2.107 ** | 1.965 | 2.261 | 2.041 ** | 1.899 | 2.195 | 2.093 ** | 1.948 | 2.25 | 2.048 ** | 1.913 | 2.192 | 2.087 ** | 1.937 | 2.249 | ||||||
| $25,000–<$35,000 vs. ≥$50,000 | 1.859 ** | 1.711 | 2.02 | 1.790 ** | 1.632 | 1.962 | 1.804 ** | 1.656 | 1.967 | 1.681 ** | 1.546 | 1.827 | 1.690 ** | 1.55 | 1.844 | ||||||
| $35,000–<$50,000 vs. ≥$50,000 | 1.502 ** | 1.39 | 1.622 | 1.539 ** | 1.417 | 1.671 | 1.504 ** | 1.378 | 1.641 | 1.481 ** | 1.372 | 1.598 | 1.415 ** | 1.3 | 1.54 | ||||||
| Sex | Male vs. Female | 1.064 ** | 1.017 | 1.114 | 0.0005 | 1.097 ** | 1.045 | 1.153 | <0.0001 | 1.039 * | 0.989 | 1.091 | 0.0455 | 1.079 ** | 1.03 | 1.131 | <0.0001 | 1.096 ** | 1.044 | 1.149 | <0.0001 |
| Education | Did not graduate High School vs. Graduated from College or Technical School | 2.638 ** | 2.448 | 2.843 | <0.0001 | 2.623 ** | 2.422 | 2.84 | <0.0001 | 2.712 ** | 2.504 | 2.938 | <0.0001 | 2.563 ** | 2.374 | 2.768 | <0.0001 | 2.683 ** | 2.476 | 2.906 | <0.0001 |
| Graduated High School vs. Graduated from College or Technical School | 1.792 ** | 1.689 | 1.902 | 1.748 ** | 1.642 | 1.861 | 1.807 ** | 1.702 | 1.918 | 1.751 ** | 1.649 | 1.859 | 1.732 ** | 1.627 | 1.843 | ||||||
| Attended College or Technical School vs. Graduated from College or Technical School | 1.488 ** | 1.4 | 1.582 | 1.455 ** | 1.362 | 1.554 | 1.510 ** | 1.417 | 1.61 | 1.449 ** | 1.362 | 1.541 | 1.473 ** | 1.38 | 1.573 | ||||||
| Race/Ethnicity | Hispanic vs. White | 1.156 ** | 1.069 | 1.251 | <0.0001 | 1.203 ** | 1.109 | 1.306 | <0.0001 | 1.175 ** | 1.081 | 1.277 | <0.0001 | 1.152 ** | 1.067 | 1.245 | <0.0001 | 1.097 ** | 1.015 | 1.186 | <0.0001 |
| Other vs. White | 1.033 | 0.882 | 1.209 | 1.125 | 0.955 | 1.325 | 1.174 | 0.993 | 1.389 | 1.052 | 0.918 | 1.206 | 0.897 | 0.777 | 1.034 | ||||||
| American Indian or Alaska Native vs. White | 1.728 ** | 1.448 | 2.061 | 1.665 ** | 1.403 | 1.976 | 1.658 ** | 1.385 | 1.985 | 1.639 ** | 1.382 | 1.944 | 1.837 ** | 1.542 | 2.188 | ||||||
| Asian vs. White | 0.837 * | 0.689 | 1.017 | 0.827 | 0.644 | 1.063 | 0.872 | 0.704 | 1.08 | 0.726 ** | 0.587 | 0.897 | 0.886 | 0.718 | 1.094 | ||||||
| Black or African American vs. White | 1.521 ** | 1.416 | 1.632 | 1.500 ** | 1.394 | 1.614 | 1.589 ** | 1.477 | 1.71 | 1.584 ** | 1.48 | 1.695 | 1.534 ** | 1.428 | 1.647 | ||||||
| Rurality | Urban versus Rural (Not in an MSA) | 0.844 ** | 0.802 | 0.887 | <0.0001 | 0.890 ** | 0.844 | 0.939 | <0.0001 | 0.908 ** | 0.860 | 0.958 | <0.0001 | 0.904 ** | 0.853 | 0.957 | <0.0001 | 0.908 ** | 0.853 | 0.965 | <0.0001 |
| Rurality | In the center city of an MSA versus Not in an MSA (rural) | 0.898 ** | 0.846 | 0.953 | <0.0001 | 0.951 | 0.889 | 1.017 | <0.0001 | 0.962 | 0.901 | 1.028 | <0.0001 | 0.954 | 0.892 | 1.021 | <0.0001 | 0.906 ** | 0.847 | 0.968 | <0.0001 |
| Outside the center city of an MSA but inside the county containing the center city versus Not in an MSA (rural) | 0.770 ** | 0.721 | 0.822 | 0.813 ** | 0.758 | 0.872 | 0.855 ** | 0.793 | 0.922 | 0.870 ** | 0.803 | 0.944 | 0.870 ** | 0.796 | 0.95 | ||||||
| Inside a suburban county of the MSA versus Not in an MSA (rural) | 0.853 ** | 0.794 | 0.918 | 0.891 ** | 0.826 | 0.96 | 0.867 ** | 0.806 | 0.932 | 0.849 ** | 0.786 | 0.917 | 1.056 | 0.945 | 1.18 | ||||||
| Census Region | North vs. South | 0.876 ** | 0.819 | 0.936 | <0.0001 | 0.853 ** | 0.791 | 0.92 | <0.0001 | 0.854 ** | 0.799 | 0.913 | <0.0001 | 0.873 ** | 0.819 | 0.931 | <0.0001 | 0.806 ** | 0.754 | 0.861 | <0.0001 |
| Midwest vs. South | 0.875 ** | 0.824 | 0.928 | 0.889 ** | 0.838 | 0.943 | 0.849 ** | 0.802 | 0.899 | 0.889 ** | 0.841 | 0.939 | 0.851 ** | 0.804 | 0.902 | ||||||
| Western/Pacific vs. South | 0.807 ** | 0.757 | 0.861 | 0.835 ** | 0.778 | 0.896 | 0.828 ** | 0.766 | 0.895 | 0.828 ** | 0.77 | 0.89 | 0.794 ** | 0.739 | 0.854 | ||||||
| Variables | 2011 | 2012 | 2013 | 2014 | 2015 | ||||||||||||||||
|---|---|---|---|---|---|---|---|---|---|---|---|---|---|---|---|---|---|---|---|---|---|
| OR | 99% Confidence Intervals | p-Value | OR | 99% Confidence Intervals | p-Value | OR | 99% Confidence Intervals | p-Value | OR | 99% Confidence Intervals | p-Value | OR | 99% Confidence Intervals | p-Value | |||||||
| Income | Missing/don’t know | 1.414 ** | 1.305 | 1.532 | <0.0001 | 1.419 ** | 1.284 | 1.569 | <0.0001 | 1.400 ** | 1.279 | 1.534 | <0.0001 | 1.420 ** | 1.297 | 1.555 | <0.0001 | 1.331 ** | 1.213 | 1.46 | <0.0001 |
| <$15,000 vs. ≥$50,000 | 2.306 ** | 2.104 | 2.527 | 2.104 ** | 1.89 | 2.343 | 2.287 ** | 2.041 | 2.562 | 2.216 ** | 1.974 | 2.487 | 2.194 ** | 1.936 | 2.485 | ||||||
| $15,000–<$25,000 vs. ≥$50,000 | 2.025 ** | 1.865 | 2.199 | 1.999 ** | 1.822 | 2.193 | 1.979 ** | 1.802 | 2.174 | 1.908 ** | 1.741 | 2.092 | 1.918 ** | 1.736 | 2.12 | ||||||
| $25,000–<$35,000 vs. ≥$50,000 | 1.814 ** | 1.656 | 1.987 | 1.723 ** | 1.548 | 1.918 | 1.782 ** | 1.614 | 1.966 | 1.628 ** | 1.465 | 1.809 | 1.722 ** | 1.536 | 1.93 | ||||||
| $35,000–<$50,000 vs. ≥$50,000 | 1.460 ** | 1.341 | 1.589 | 1.551 ** | 1.408 | 1.708 | 1.461 ** | 1.32 | 1.617 | 1.481 ** | 1.346 | 1.629 | 1.467 ** | 1.316 | 1.636 | ||||||
| Sex | Male vs. Female | 1.200 ** | 1.14 | 1.263 | <0.0001 | 1.302 ** | 1.227 | 1.382 | <0.0001 | 1.274 ** | 1.201 | 1.351 | <0.0001 | 1.283 ** | 1.21 | 1.361 | <0.0001 | 1.294 ** | 1.214 | 1.38 | <0.0001 |
| Education | Did not graduate High School vs. Graduated from College or Technical School | 1.864 ** | 1.702 | 2.041 | <0.0001 | 1.771 ** | 1.589 | 1.974 | <0.0001 | 1.869 ** | 1.68 | 2.08 | <0.0001 | 1.890 ** | 1.696 | 2.105 | <0.0001 | 1.957 ** | 1.737 | 2.204 | <0.0001 |
| Graduated High School vs. Graduated from College or Technical School | 1.342 ** | 1.252 | 1.438 | 1.356 ** | 1.25 | 1.471 | 1.408 ** | 1.301 | 1.523 | 1.41 ** | 1.303 | 1.525 | 1.411 ** | 1.293 | 1.539 | ||||||
| Attended College or Technical School vs. Graduated from College or Technical School | 1.298 ** | 1.211 | 1.391 | 1.274 ** | 1.173 | 1.384 | 1.331 ** | 1.233 | 1.437 | 1.302 ** | 1.204 | 1.407 | 1.344 ** | 1.237 | 1.459 | ||||||
| Race/Ethnicity | Hispanic vs. White | 0.873 ** | 0.787 | 0.968 | <0.0001 | 0.974 | 0.862 | 1.099 | <0.0001 | 1.026 | 0.907 | 1.161 | <0.0001 | 1.032 | 0.908 | 1.173 | <0.0001 | 0.973 | 0.855 | 1.107 | <0.0001 |
| Other vs. White | 1.041 | 0.865 | 1.252 | 1.280 ** | 1.031 | 1.589 | 1.461 ** | 1.194 | 1.787 | 1.115 | 0.926 | 1.343 | 1.053 | 0.866 | 1.279 | ||||||
| American Indian or Alaska Native vs. White | 1.349 ** | 1.106 | 1.646 | 1.351 ** | 1.097 | 1.662 | 1.095 | 0.875 | 1.371 | 1.469 ** | 1.158 | 1.864 | 1.410 ** | 1.13 | 1.759 | ||||||
| Asian vs. White | 1.130 | 0.912 | 1.401 | 1.134 | 0.844 | 1.525 | 1.231 * | 0.946 | 1.603 | 1.116 | 0.839 | 1.486 | 1.411 ** | 1.022 | 1.947 | ||||||
| Black or African American vs. White | 1.326 ** | 1.226 | 1.435 | 1.453 ** | 1.323 | 1.596 | 1.487 ** | 1.356 | 1.632 | 1.521 ** | 1.387 | 1.669 | 1.380 ** | 1.254 | 1.519 | ||||||
| Rurality | In the center city of an MSA versus Not in an MSA (rural) | 0.984 | 0.923 | 1.048 | 0.1736 | 1.045 | 0.976 | 1.12 | 0.2898 | 1.036 | 0.967 | 1.108 | 0.5870 | 1.013 | 0.943 | 1.087 | 0.6948 | 1.045 | 0.972 | 1.123 | 0.1009 |
| Outside the center city of an MSA but inside the county containing the center city versus Not in an MSA (rural) | 0.942 * | 0.878 | 1.010 | 0.994 | 0.922 | 1.073 | 1.024 | 0.949 | 1.106 | 1.037 | 0.955 | 1.127 | 1.054 | 0.964 | 1.153 | ||||||
| Inside a suburban county of the MSA versus Not in an MSA (rural) | 0.976 | 0.904 | 1.055 | 1.026 | 0.945 | 1.113 | 1.013 | 0.937 | 1.094 | 1.006 | 0.926 | 1.094 | 1.107* | 0.985 | 1.245 | ||||||
| Census Region | North vs. South | 0.924 * | 0.847 | 1.008 | <0.0001 | 0.902 ** | 0.815 | 0.998 | 0.0001 | 0.918 * | 0.840 | 1.003 | 0.0075 | 0.910 ** | 0.833 | 0.993 | 0.0002 | 0.840 ** | 0.763 | 0.924 | <0.0001 |
| Midwest vs. South | 0.911 ** | 0.854 | 0.973 | 0.926 ** | 0.866 | 0.99 | 0.936 * | 0.873 | 1.003 | 0.900 ** | 0.841 | 0.964 | 0.921 ** | 0.857 | 0.991 | ||||||
| Western/Pacific vs. South | 0.821 ** | 0.759 | 0.888 | 0.864 ** | 0.791 | 0.945 | 0.898 ** | 0.814 | 0.991 | 0.901 ** | 0.819 | 0.991 | 0.879 ** | 0.795 | 0.973 | ||||||
| State Median Income | State Median Income (continuous variable) | 1.000 | 1.000 | 1.000 | 0.0192 | 1.000 | 1.000 | 1.000 | <0.0001 | 1.000 | 1.000 | 1.000 | <0.0001 | 1.000 | 1.000 | 1.000 | <0.0001 | 1.000 | 1.000 | 1.000 | <0.0001 |
| Variables | 2011 | 2012 | 2013 | 2014 | 2015 | ||||||||||||||||
|---|---|---|---|---|---|---|---|---|---|---|---|---|---|---|---|---|---|---|---|---|---|
| OR | 99% Confidence Intervals | p-Value | OR | 99% Confidence Intervals | p-Value | OR | 99% Confidence Intervals | p-Value | OR | 99% Confidence Intervals | p-Value | OR | 99% Confidence Intervals | p-Value | |||||||
| Income | Missing/don’t know | 2.267 ** | 1.774 | 2.896 | <0.0001 | 2.466 ** | 1.810 | 3.359 | <0.0001 | 2.408 ** | 1.807 | 3.208 | <0.0001 | 2.860 ** | 2.209 | 3.702 | <0.0001 | 2.069 ** | 1.560 | 2.746 | <0.0001 |
| <$15,000 vs. ≥$50,000 | 4.926 ** | 3.978 | 6.099 | 5.777 ** | 4.534 | 7.361 | 5.492 ** | 4.222 | 7.143 | 6.094 ** | 4.865 | 7.635 | 4.294 ** | 3.260 | 5.657 | ||||||
| $15,000–<$25,000 vs. ≥$50,000 | 3.933 ** | 3.174 | 4.873 | 4.232 ** | 3.321 | 5.391 | 4.585 ** | 3.544 | 5.931 | 5.431 ** | 4.372 | 6.746 | 3.675 ** | 2.800 | 4.824 | ||||||
| $25,000–<$35,000 vs. ≥$50,000 | 2.712 ** | 2.097 | 3.506 | 2.786 ** | 2.070 | 3.750 | 3.396 ** | 2.518 | 4.580 | 3.234 ** | 2.468 | 4.237 | 2.770 ** | 2.042 | 3.758 | ||||||
| $35,000–<$50,000 vs. ≥$50,000 | 2.069 ** | 1.593 | 2.687 | 1.877 ** | 1.407 | 2.502 | 1.753 ** | 1.248 | 2.462 | 2.442 ** | 1.881 | 3.171 | 1.807 ** | 1.304 | 2.503 | ||||||
| Sex | Male vs. Female | 0.738 ** | 0.653 | 0.835 | <0.0001 | 0.754 ** | 0.659 | 0.864 | <0.0001 | 0.773 ** | 0.674 | 0.887 | <0.0001 | 0.778 ** | 0.683 | 0.888 | <0.0001 | 0.825 ** | 0.715 | 0.952 | 0.0005 |
| Education | Did not graduate High School vs. Graduated from College or Technical School | 2.685 ** | 2.229 | 3.236 | <0.0001 | 2.613 ** | 2.108 | 3.241 | <0.0001 | 2.952 ** | 2.417 | 3.606 | <0.0001 | 2.827 ** | 2.297 | 3.481 | <0.0001 | 2.664 ** | 2.011 | 3.529 | <0.0001 |
| Graduated High School vs. Graduated from College or Technical School | 1.930 ** | 1.625 | 2.293 | 1.794 ** | 1.473 | 2.187 | 1.897 ** | 1.578 | 2.281 | 1.84 ** | 1.516 | 2.233 | 1.631 ** | 1.256 | 2.116 | ||||||
| Attended College or Technical School vs. Graduated from College or Technical School | 1.753 ** | 1.471 | 2.089 | 1.610 ** | 1.314 | 1.972 | 1.682 ** | 1.389 | 2.037 | 1.661 ** | 1.366 | 2.018 | 1.666 ** | 1.275 | 2.178 | ||||||
| Race/Ethnicity | Hispanic vs. White | 2.385 ** | 2.006 | 2.836 | <0.0001 | 2.284 ** | 1.898 | 2.749 | <0.0001 | 2.270 ** | 1.884 | 2.736 | <0.0001 | 2.216 ** | 1.862 | 2.638 | <0.0001 | 2.337 ** | 1.930 | 2.830 | <0.0001 |
| Other vs. White | 1.677 ** | 1.207 | 2.330 | 1.902 ** | 1.330 | 2.720 | 1.565 ** | 1.112 | 2.204 | 1.757 ** | 1.307 | 2.360 | 1.874 ** | 1.260 | 2.787 | ||||||
| American Indian or Alaska Native vs. White | 1.740 ** | 1.155 | 2.622 | 2.014 ** | 1.365 | 2.971 | 1.781 ** | 1.209 | 2.622 | 1.815 ** | 1.216 | 2.710 | 2.078 ** | 1.330 | 3.246 | ||||||
| Asian vs. White | 0.901 | 0.532 | 1.527 | 1.044 | 0.475 | 2.295 | 0.861 | 0.412 | 1.798 | 1.089 | 0.527 | 2.252 | 1.271 | 0.624 | 2.591 | ||||||
| Black or African American vs. White | 1.707 ** | 1.442 | 2.020 | 1.692 ** | 1.426 | 2.008 | 1.543 ** | 1.295 | 1.839 | 1.524 ** | 1.284 | 1.807 | 1.701 ** | 1.422 | 2.035 | ||||||
| Rurality | Urban versus Rural (Not in an MSA) | 0.882 * | 0.768 | 1.012 | 0.0189 | 0.925 | 0.795 | 1.078 | 0.1905 | 0.855 * | 0.721 | 1.013 | 0.0176 | 0.794 ** | 0.665 | 0.948 | 0.0008 | 0.884 | 0.722 | 1.083 | 0.1177 |
| Rurality | In the center city of an MSA versus Not in an MSA (rural) | 0.925 | 0.787 | 1.086 | 0.0288 | 0.965 | 0.801 | 1.161 | 0.4140 | 0.958 | 0.778 | 1.18 | 0.0006 | 0.810 ** | 0.666 | 0.986 | 0.0089 | 0.849 * | 0.691 | 1.043 | 0.1272 |
| Outside the center city of an MSA but inside the county containing the center city versus Not in an MSA (rural) | 0.865 * | 0.720 | 1.039 | 0.888 | 0.719 | 1.097 | 0.755 ** | 0.600 | 0.949 | 0.744 ** | 0.572 | 0.967 | 0.903 | 0.635 | 1.285 | ||||||
| Inside a suburban county of the MSA versus Not in an MSA (rural) | 0.806 ** | 0.659 | 0.985 | 0.892 | 0.695 | 1.144 | 0.757 ** | 0.608 | 0.943 | 0.831 | 0.649 | 1.063 | 1.053 | 0.749 | 1.480 | ||||||
| Census Region | North vs. South | 0.635 ** | 0.530 | 0.761 | <0.0001 | 0.542 ** | 0.426 | 0.688 | <0.0001 | 0.622 ** | 0.508 | 0.762 | <0.0001 | 0.657 ** | 0.541 | 0.797 | <0.0001 | 0.600 ** | 0.490 | 0.735 | <0.0001 |
| Midwest vs. South | 0.676 ** | 0.576 | 0.793 | 0.684 ** | 0.578 | 0.808 | 0.695 ** | 0.596 | 0.811 | 0.675 ** | 0.576 | 0.792 | 0.646 ** | 0.545 | 0.765 | ||||||
| Western/Pacific vs. South | 0.731 ** | 0.619 | 0.864 | 0.819 ** | 0.687 | 0.976 | 0.784 ** | 0.634 | 0.968 | 0.814 ** | 0.671 | 0.988 | 0.716 ** | 0.575 | 0.893 | ||||||
| State Median Income | State Median Income (continuous variable) | 1.000 | 1.000 | 1.000 | 1.000 | 1.000 | 1.000 | 1.000 | 1.000 | 1.000 | 1.000 | 1.000 | 1.000 | 1.000 | 1.000 | 1.000 | |||||
| Variables | 2011 | 2012 | 2013 | 2014 | 2015 | ||||||||||||||||
|---|---|---|---|---|---|---|---|---|---|---|---|---|---|---|---|---|---|---|---|---|---|
| OR | 99% Confidence Intervals | p-Value | OR | 99% Confidence Intervals | p-Value | OR | 99% Confidence Intervals | p-Value | OR | 99% Confidence Intervals | p-Value | OR | 99% Confidence Intervals | p-Value | |||||||
| Income | Missing/don’t know | 1.766 ** | 1.327 | 2.351 | <0.0001 | 2.327 ** | 1.540 | 3.515 | <0.0001 | 1.816 ** | 1.225 | 2.694 | <0.0001 | 2.156 ** | 1.510 | 3.080 | <0.0001 | 1.674 ** | 1.115 | 2.514 | <0.0001 |
| <$15,000 vs. ≥$50,000 | 3.608 ** | 2.734 | 4.762 | 4.703 ** | 3.274 | 6.757 | 3.869 ** | 2.539 | 5.895 | 4.621 ** | 3.157 | 6.764 | 3.256 ** | 2.134 | 4.968 | ||||||
| $15,000–<$25,000 vs. ≥$50,000 | 3.097 ** | 2.379 | 4.031 | 3.760 ** | 2.660 | 5.316 | 3.428 ** | 2.318 | 5.069 | 4.310 ** | 3.125 | 5.943 | 2.629 ** | 1.819 | 3.801 | ||||||
| $25,000–<$35,000 vs. ≥$50,000 | 2.397 ** | 1.783 | 3.221 | 2.522 ** | 1.739 | 3.657 | 2.842 ** | 1.904 | 4.241 | 2.253 ** | 1.539 | 3.297 | 2.220 ** | 1.435 | 3.434 | ||||||
| $35,000–<$50,000 vs. ≥$50,000 | 1.890 ** | 1.398 | 2.556 | 1.710 ** | 1.173 | 2.493 | 1.323 | 0.856 | 2.046 | 2.197 ** | 1.518 | 3.181 | 1.376 | 0.863 | 2.195 | ||||||
| Sex | Male vs. Female | 0.823 ** | 0.711 | 0.953 | 0.0006 | 0.793 ** | 0.656 | 0.957 | 0.0015 | 0.836 * | 0.693 | 1.008 | 0.0134 | 0.917 | 0.760 | 1.107 | 0.2347 | 1.013 | 0.814 | 1.261 | 0.8751 |
| Education | Did not graduate High School vs. Graduated from College or Technical School | 1.214 * | 0.946 | 1.559 | 0.0118 | 1.063 | 0.787 | 1.434 | 0.8511 | 1.320 * | 0.921 | 1.891 | 0.0793 | 1.091 | 0.781 | 1.523 | 0.6820 | 1.427 * | 0.962 | 2.117 | 0.0410 |
| Graduated High School vs. Graduated from College or Technical School | 1.188 * | 0.956 | 1.478 | 1.077 | 0.804 | 1.443 | 1.285 | 0.904 | 1.827 | 1.065 | 0.787 | 1.442 | 1.138 | 0.792 | 1.634 | ||||||
| Attended College or Technical School vs. Graduated from College or Technical School | 1.309 ** | 1.061 | 1.614 | 1.103 | 0.830 | 1.466 | 1.317 * | 0.998 | 1.739 | 1.135 | 0.854 | 1.508 | 1.297 | 0.886 | 1.897 | ||||||
| Race/Ethnicity | Hispanic vs. White | 2.001 ** | 1.578 | 2.538 | <0.0001 | 1.817 ** | 1.329 | 2.485 | <0.0001 | 1.846 ** | 1.354 | 2.518 | <0.0001 | 1.831 ** | 1.346 | 2.491 | <0.0001 | 1.826 ** | 1.312 | 2.54 | <0.0001 |
| Other vs. White | 1.673 ** | 1.148 | 2.437 | 1.920 ** | 1.186 | 3.107 | 1.679 ** | 1.050 | 2.686 | 1.931 ** | 1.240 | 3.009 | 1.623 * | 0.927 | 2.843 | ||||||
| American Indian or Alaska Native vs. White | 1.577 * | 0.949 | 2.620 | 1.926 ** | 1.204 | 3.081 | 1.501 | 0.871 | 2.587 | 1.867 ** | 1.133 | 3.076 | 1.857 ** | 1.032 | 3.343 | ||||||
| Asian vs. White | 1.228 | 0.665 | 2.267 | 1.766 | 0.650 | 4.796 | 1.664 | 0.554 | 4.992 | 1.306 | 0.456 | 3.741 | 2.280 | 0.627 | 8.288 | ||||||
| Black or African American vs. White | 1.313 ** | 1.085 | 1.589 | 1.338 ** | 1.066 | 1.679 | 1.239 * | 0.994 | 1.543 | 1.284 ** | 1.023 | 1.611 | 1.456 ** | 1.113 | 1.905 | ||||||
| Rurality | In the center city of an MSA versus Not in an MSA (rural) | 0.878 | 0.736 | 1.047 | 0.2051 | 0.934 | 0.769 | 1.133 | 0.6691 | 0.947 | 0.766 | 1.171 | 0.3999 | 0.805 * | 0.646 | 1.003 | 0.0279 | 0.897 | 0.702 | 1.146 | 0.4200 |
| Outside the center city of an MSA but inside the county containing the center city versus Not in an MSA (rural) | 0.993 | 0.816 | 1.21 | 1.020 | 0.815 | 1.278 | 0.854 | 0.668 | 1.092 | 0.838 | 0.641 | 1.095 | 0.988 | 0.727 | 1.343 | ||||||
| Inside a suburban county of the MSA versus Not in an MSA (rural) | 0.925 | 0.745 | 1.149 | 1.055 | 0.808 | 1.378 | 0.908 | 0.717 | 1.149 | 1.001 | 0.774 | 1.296 | 1.113 | 0.781 | 1.586 | ||||||
| Census Region | North vs. South | 0.789 * | 0.619 | 1.005 | 0.0007 | 0.629 ** | 0.459 | 0.862 | <0.0001 | 0.791 * | 0.585 | 1.070 | 0.0301 | 0.818 | 0.621 | 1.077 | <0.0001 | 0.717 ** | 0.532 | 0.966 | 0.0010 |
| Midwest vs. South | 0.764 ** | 0.633 | 0.920 | 0.766 ** | 0.637 | 0.921 | 0.806 ** | 0.660 | 0.985 | 0.695 ** | 0.565 | 0.855 | 0.769 ** | 0.608 | 0.973 | ||||||
| Western/Pacific vs. South | 0.791 ** | 0.635 | 0.985 | 0.832 | 0.647 | 1.069 | 0.838 | 0.603 | 1.163 | 0.754 ** | 0.571 | 0.995 | 0.652 ** | 0.438 | 0.971 | ||||||
| State Median Income | State Median Income (continuous variable) | 1.000 | 1.000 | 1.000 | 0.0184 | 1.000 | 1.000 | 1.000 | 0.4139 | 1.000 | 1.000 | 1.000 | 0.0035 | 1.000 | 1.000 | 1.000 | 0.0554 | 1.000 | 1.00 | 1.000 | 0.0233 |
© 2017 by the authors. Licensee MDPI, Basel, Switzerland. This article is an open access article distributed under the terms and conditions of the Creative Commons Attribution (CC BY) license (http://creativecommons.org/licenses/by/4.0/).
Share and Cite
Towne, S.D.; Bolin, J.; Ferdinand, A.; Nicklett, E.J.; Smith, M.L.; Ory, M.G. Assessing Diabetes and Factors Associated with Foregoing Medical Care among Persons with Diabetes: Disparities Facing American Indian/Alaska Native, Black, Hispanic, Low Income, and Southern Adults in the U.S. (2011–2015). Int. J. Environ. Res. Public Health 2017, 14, 464. https://doi.org/10.3390/ijerph14050464
Towne SD, Bolin J, Ferdinand A, Nicklett EJ, Smith ML, Ory MG. Assessing Diabetes and Factors Associated with Foregoing Medical Care among Persons with Diabetes: Disparities Facing American Indian/Alaska Native, Black, Hispanic, Low Income, and Southern Adults in the U.S. (2011–2015). International Journal of Environmental Research and Public Health. 2017; 14(5):464. https://doi.org/10.3390/ijerph14050464
Chicago/Turabian StyleTowne, Samuel D., Jane Bolin, Alva Ferdinand, Emily Joy Nicklett, Matthew Lee Smith, and Marcia G. Ory. 2017. "Assessing Diabetes and Factors Associated with Foregoing Medical Care among Persons with Diabetes: Disparities Facing American Indian/Alaska Native, Black, Hispanic, Low Income, and Southern Adults in the U.S. (2011–2015)" International Journal of Environmental Research and Public Health 14, no. 5: 464. https://doi.org/10.3390/ijerph14050464