
Is Increasing Coal Seam Gas Well Development Activity Associated with Increasing Hospitalisation Rates in Queensland, Australia? An Exploratory Analysis 1995–2011


 and
and
Abstract
:1. Introduction
2. Materials and Methods
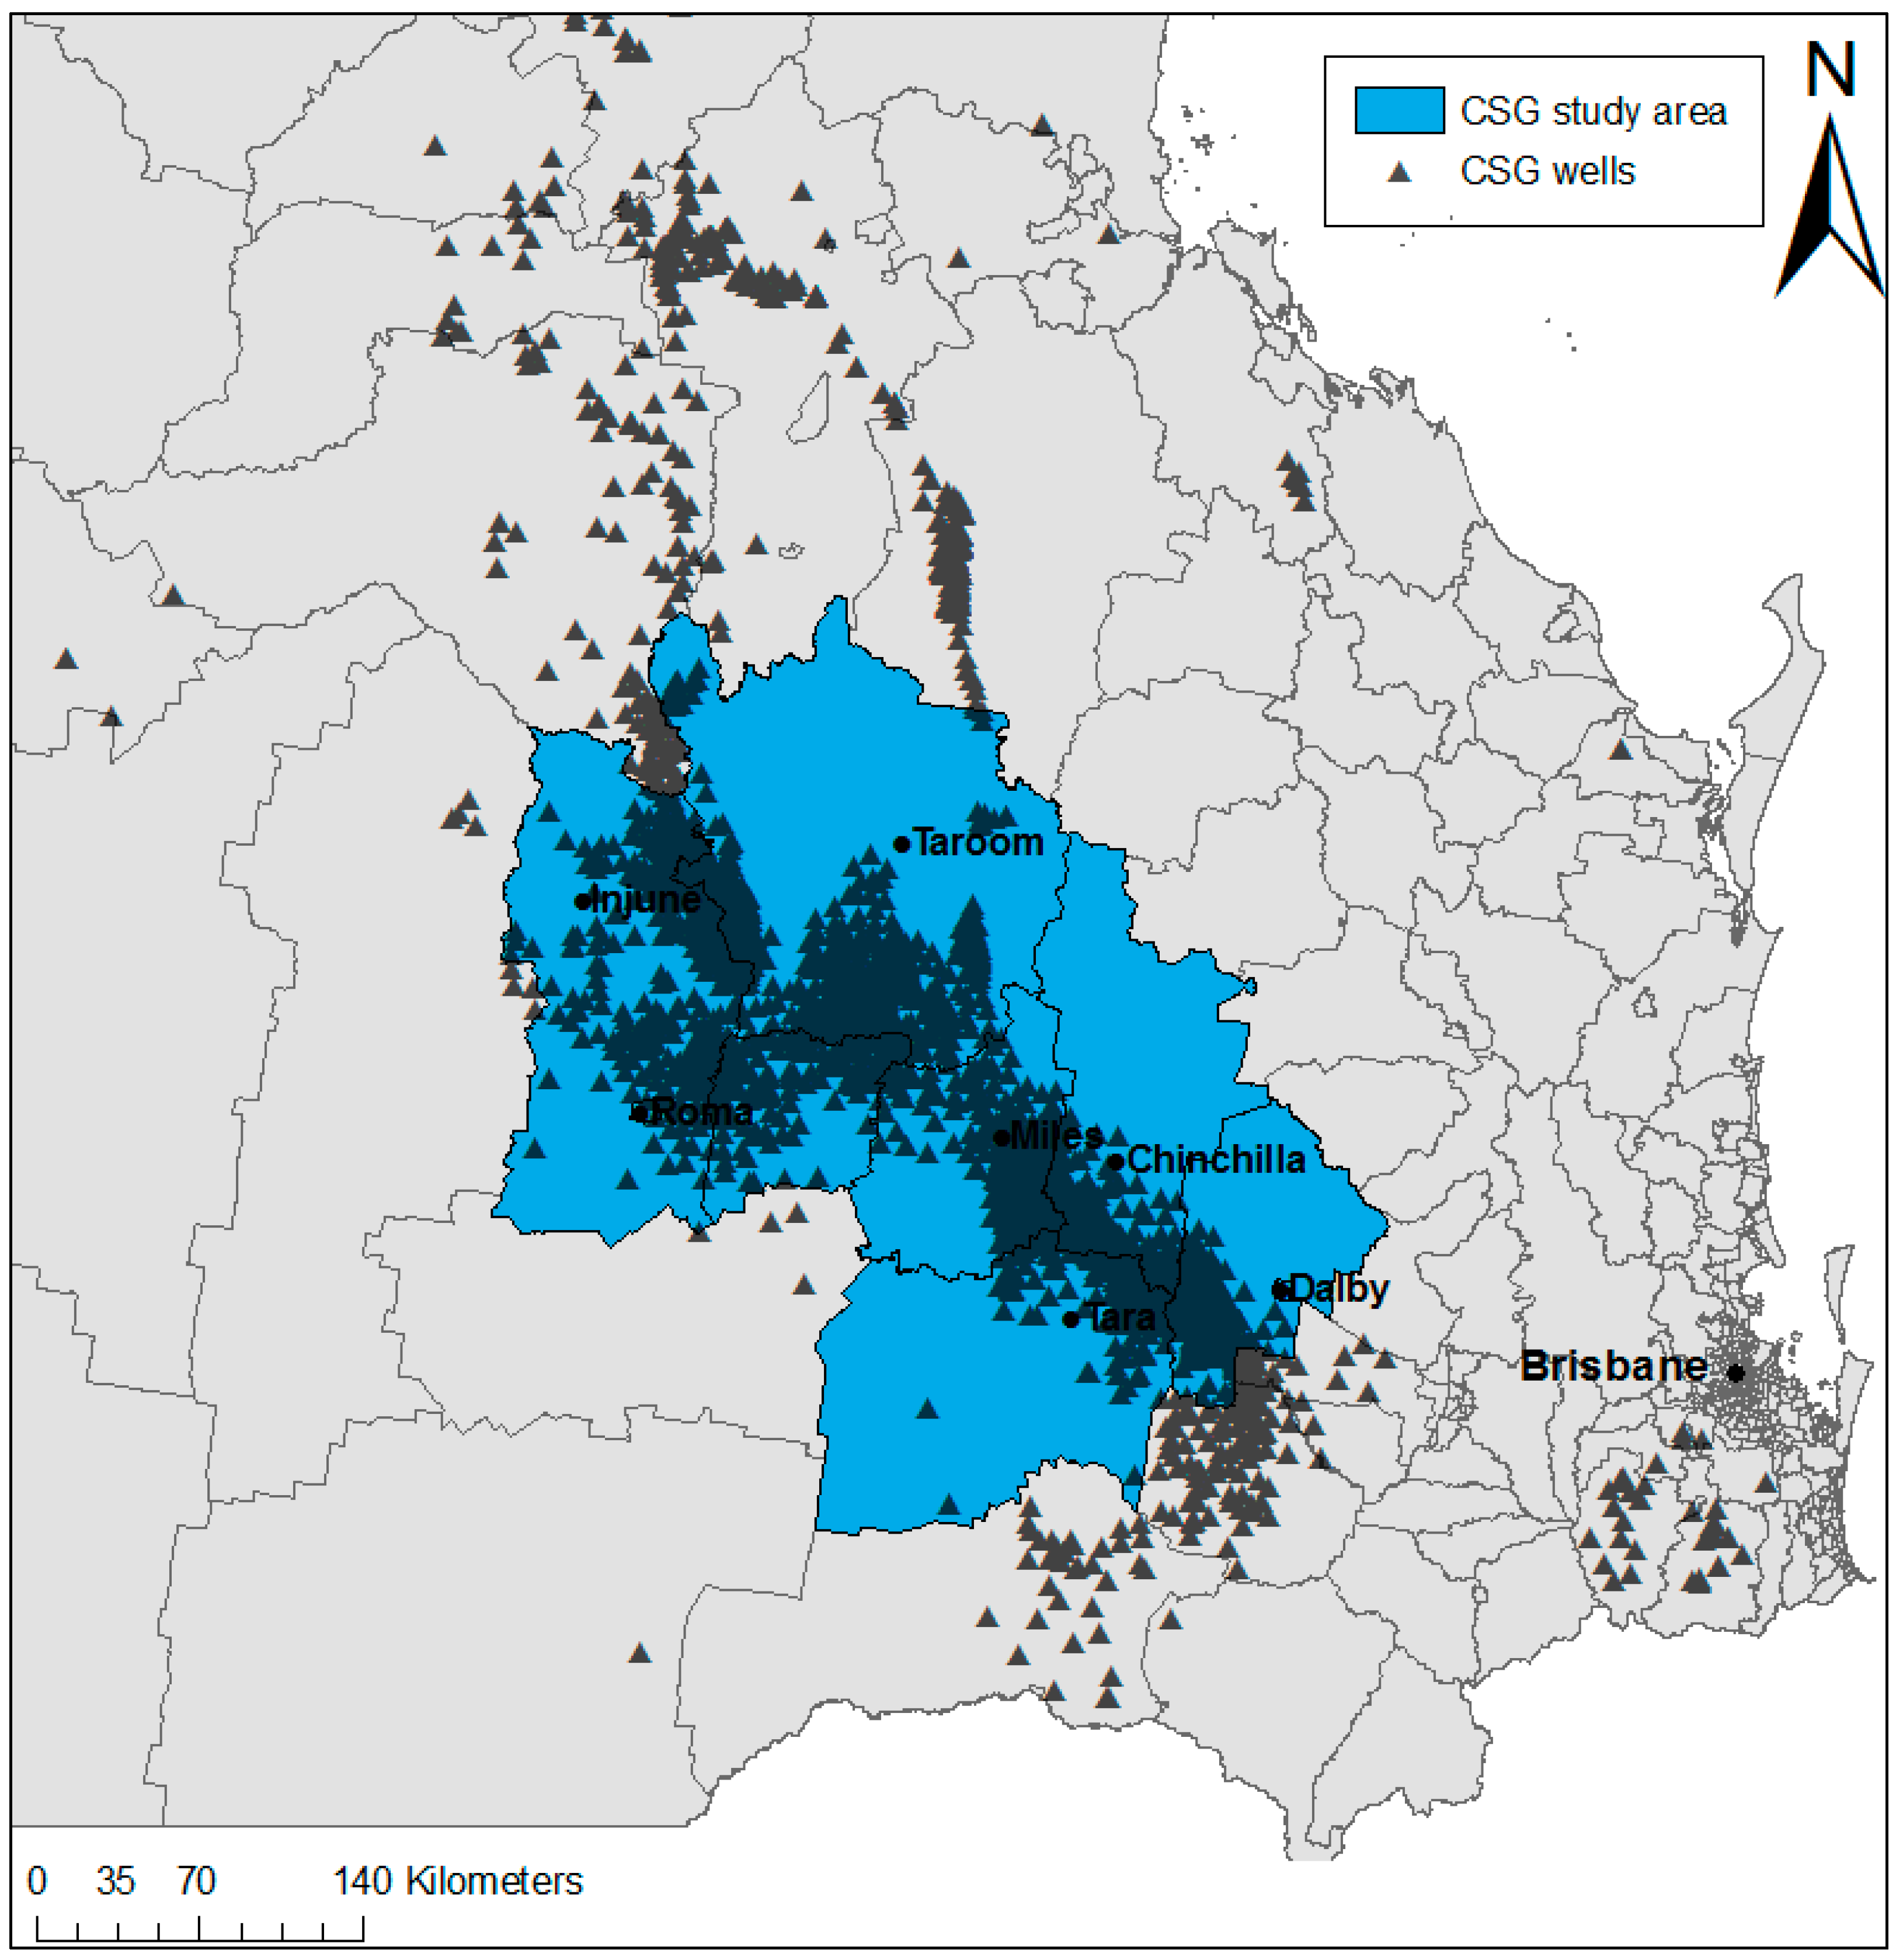
2.1. Study Area
2.2. Data
2.3. Analyses
3. Results
4. Discussion
5. Conclusions
Supplementary Materials
Acknowledgments
Author Contributions
Conflicts of Interest
References
- Queensland Government. Conventional Oil and Gas. Department of Environment and Heritage Protection: Brisbane, 2013. Available online: https://www.ehp.qld.gov.au/management/non-mining/conventional.html (accessed on 16 April 2017).
- Korn, A. Prospects for Unconventional Gas in Europe. 2010. Available online: http://www.eon.com/content/dam/eon-com/en/downloads/ir/20100205_Unconventional_gas_in_Europe.pdf (accessed on 5 February 2016).
- Ross, C.; Darby, P. Unconventional Gas: Coal seam Gas, Shale Gas and Tight Gas. Parliament of Victoria: East Melbourne, 2013. Available online: http://www.parliament.vic.gov.au/publications/research-papers/8927-unconventional-gas-coal-seam-gas-shale-gas-and-tight-gas/download (accessed on 3 March 2016).
- Hamawand, I.; Yusaf, T.; Hamawand, S.G. Coal seam gas and associated water: A review paper. Renew. Sust. Energy Rev. 2013, 22, 550–560. [Google Scholar] [CrossRef]
- Rutovitz, J.; Harris, S.; Kuruppu, N.; Dunstan, C. Drilling down. Coal Seam Gas: A Background Paper. Prepared for the City of Sydney Council by Institute for Sustainable Futures, University of Technology Sydney. 2011. Available online: http://cfsites1.uts.edu.au/find/isf/publications/rutovitzetal2011sydneycoalseamgasbkgd.pdf (accessed on 6 February 2016).
- Saunders, P.J.; McCoy, D.; Goldstein, R.; Saunders, A.T.; Munroe, A. A review of the public health impacts of unconventional natural gas development. Environ. Geochem. Health 2016, 1–57. [Google Scholar] [CrossRef] [PubMed]
- Stacy, S.L. A review of the human health impacts of unconventional natural gas development. Curr. Epidemiol. Rep. 2017, 1–8. [Google Scholar] [CrossRef]
- Australian Government. Review of the Socioeconomic Impacts of Coal Seam Gas in Queensland. Office of the Chief Economist, Department of Industry, Innovation and Science: Canberra, 2015. Available online: http://industry.gov.au/Office-of-the-Chief-Economist/Publications/Documents/coal-seam-gas/Socioeconomic-impacts-of-coal-seam-gas-in-Queensland.pdf (accessed on 10 March 2016).
- Towler, B.; Firouzi, M.; Underschultz, J.; Rifkin, W.; Garnett, A.; Schultz, H.; Esterle, J.; Tyson, S.; Witt, K. An overview of the coal seam gas developments in Queensland. J. Nat. Gas Sci. Eng. 2016, 31, 249–271. [Google Scholar] [CrossRef]
- NSW Chief Scientist & Engineer. Initial Report on the Independent Review of Coal Seam Gas Activities in NSW. NSW Government: Sydney, 2013. Available online: http://www.chiefscientist.nsw.gov.au/__data/assets/pdf_file/0016/31246/130730_1046_CSE-CSG-July-report.pdf (accessed on 12 November 2015).
- Walton, A.; Leonard, R.; Williams, R.; McCrea, R. A Review of Community Concerns about Onshore Gas Development: Challenges and Opportunities (CSIRO report for the Government of Victoria). CSIRO: Australia, 2015. Available online: https://publications.csiro.au/rpr/download?pid=csiro:EP152912&dsid=DS2 (accessed on 6 April 2016).
- Coram, A.; Moss, J.; Blashki, G. Harms unknown: Health uncertainties cast doubt on the role of unconventional gas in Australia’s energy future. Med. J. Aust. 2014, 4, 210–213. [Google Scholar] [CrossRef] [PubMed]
- Stearman, W.; Taulis, M.; Smith, J.; Corkeron, M. Assessment of geogenic contaminants in water co-produced with coal seam gas extraction in Queensland, Australia: Implications for human health risk. Geosci. J. 2014, 4, 219–239. [Google Scholar] [CrossRef]
- Queensland Government. Coal Seam Gas in the Tara Region: Summary Risk Assessment of Health Complaints and Environmental Monitoring Data. Department of Health: Brisbane, 2013. Available online: http://www.health.qld.gov.au/publications/csg/documents/report.pdf (accessed on 8 October 2014).
- Davies, P.; Gore, D.; Khan, S. Managing produced water from coal seam gas projects: Implications for an emerging industry in Australia. Environ. Sci. Pollut. Res. 2015, 22, 1–20. [Google Scholar] [CrossRef] [PubMed]
- Taylor, M.; Sandy, N.; Raphael, B. Background Paper on Community Concerns in Relation to Coal Seam Gas. University of Western Sydney: Penrith, NSW, 2013. Available online: http://www.chiefscientist.nsw.gov.au/__data/assets/pdf_file/0010/31789/Community-Concerns-in-relation-to-Coal-Seam-Gas_Taylor,-Sandy-and-Raphael_UWS.pdf (accessed on 6 February 2016).
- McCarron, G.; King, D. Unconventional natural gas development: Economic salvation or looming public health disaster? Aust. N. Z. J. Public Health 2014, 38, 108–109. [Google Scholar] [CrossRef] [PubMed]
- Werner, A.K.; Vink, S.; Watt, K.; Jagals, P. Environmental health impacts of unconventional natural gas development: A review of the current strength of evidence. Sci. Total Environ. 2015, 505, 1127–1141. [Google Scholar] [CrossRef] [PubMed]
- Werner, A.K.; Watt, K.; Cameron, C.M.; Vink, S.; Page, A.; Jagals, P. All-age hospitalization rates in coal seam gas areas in Queensland, Australia, 1995–2011. BMC Public Health 2016, 16, 125. [Google Scholar] [CrossRef] [PubMed]
- Werner, A.K.; Cameron, C.M.; Watt, K.; Page, A.; Vink, S.; Jagals, P. Age-specific differentials in hospitalisation rates in a coal seam gas development area in Queensland, Australia (1995–2011). Int. J. Occup. Environ. Health 2017. Under review. [Google Scholar]
- Werner, A.K.; Cameron, C.M.; Watt, K.; Page, A.; Vink, S.; Jagals, P. Examination of child and adolescent hospital admission rates in Queensland, Australia, 1995–2011: A comparison of coal seam gas, coal mining, and rural areas. Matern. Child Health J. 2017. Under review. [Google Scholar]
- Jemielita, T.; Gerton, G.L.; Neidell, M.; Chillrud, S.; Yan, B.; Stute, M.; Howarth, M.; Saberi, P.; Fausti, N.; Penning, T.M.; et al. Unconventional gas and oil drilling is associated with increased hospital utilization rates. PLoS ONE 2015, 10, e0131093. [Google Scholar] [CrossRef] [PubMed]
- McKenzie, L.; Witter, R.; Newman, L.; Adgate, J. Human health risk assessment of air emissions from development of unconventional natural gas resources. Sci. Total Environ. 2012, 424, 79–87. [Google Scholar] [CrossRef] [PubMed]
- Rabinowitz, P.M.; Slizovskiy, I.B.; Lamers, V.; Trufan, S.J.; Holford, T.R.; Dziura, J.D.; Peduzzi, P.N.; Kane, M.J.; Reif, J.S.; Weiss, T.R.; et al. Proximity to natural gas wells and reported health status: Results of a household survey in Washington County, Pennsylvania. Environ. Health Perspect. 2015, 123, 21–26. [Google Scholar] [CrossRef] [PubMed]
- Rasmussen, S.G.; Ogburn, E.L.; McCormack, M.; Casey, J.A.; Bandeen-Roche, K.; Mercer, D.G.; Schwartz, B.S. Association between unconventional natural gas development in the Marcellus Shale and asthma exacerbations. JAMA Intern. Med. 2016, 176, 1334–1343. [Google Scholar] [CrossRef] [PubMed]
- Tustin, A.W.; Hirsch, A.G.; Rasmussen, S.G.; Casey, J.A.; Bandeen-Roche, K.; Schwartz, B.S. Associations between unconventional natural gas development and nasal and sinus, migraine headache, and fatigue symptoms in Pennsylvania. Environ. Health Perspect. 2017, 125, 189–197. [Google Scholar] [CrossRef] [PubMed]
- Stacy, S.L.; Brink, L.L.; Larkin, J.C.; Sadovsky, Y.; Goldstein, B.; Pitt, B.R.; Talbott, E.O. Perinatal outcomes and unconventional natural gas operations in Southwest Pennsylvania. PLoS ONE 2015, 10, e0126425. [Google Scholar] [CrossRef] [PubMed]
- McKenzie, L.; Guo, R.; Witter, R.; Savitz, D.; Newman, L.; Adgate, J. Birth outcomes and maternal residential proximity to natural gas development in rural Colorado. Environ. Health Perspect. 2014, 122, 412–417. [Google Scholar] [CrossRef] [PubMed]
- Casey, J.A.; Savitz, D.A.; Rasmussen, S.G.; Ogburn, E.L.; Pollak, J.; Mercer, D.G.; Schwartz, B.S. Unconventional natural gas development and birth outcomes in Pennsylvania, USA. Epidemiology 2015, 27, 163–172. [Google Scholar] [CrossRef] [PubMed]
- Webb, E.; Bushkin-Bedient, S.; Cheng, A.; Kassotis, C.D.; Balise, V.; Nagel, S.C. Developmental and reproductive effects of chemicals associated with unconventional oil and natural gas operations. Rev. Environ. Health 2014, 29, 307–318. [Google Scholar] [CrossRef] [PubMed]
- Queensland Government. Coal Seam Gas Well Locations—Queensland: Department of Natural Resources and Mines. 2014. Available online: http://data.qld.gov.au (accessed on 23 September 2014).
- Australian Bureau of Statistics. Australian Standard Geographical Classification (ASGC), July 2011. ABS: Canberra, 2011; [updated October 4; Cited 15 August 2015]. Available online: http://www.abs.gov.au/AUSSTATS/[email protected]/Latestproducts/DEDA554E1B6BB78BCA25791F000EEA26 (accessed on 15 August 2015).
- Moore, C.W.; Zielinska, B.; Jackson, R.B. Air Impacts of Shale Gas Extraction and Distribution. Desert Research Institute and Duke University: Reno, NV, 2013. Available online: http://sites.nationalacademies.org/cs/groups/dbassesite/documents/webpage/dbasse_083226.pdf (accessed on 12 November 2014).
- Yaffee, R.A.; McGee, M. Introduction to Time Series Analysis and Forecasting with Applications of SAS and SPSS, 1st ed.; Academic Press, Inc.: New York, NY, USA, 2000. [Google Scholar]
- Coons, T.; Walker, R. Community Health Risk Analysis of Oil and Gas Industry Impacts in Garfield County. Saccomanno Research Institute and Mesa State College: Grand Junction, CO, 2008. Available online: http://www.garfield-county.com/public-health/documents/1._COMMUNITY_HEALTH_RISK_ANALYSIS-(Complete_Report_16MB).pdf (accessed on 4 April 2012).
- Peng, L.; Meyerhoefer, C.; Chou, S.Y. The health implications of unconventional natural gas development in Pennsylvania. In Proceedings of the Agricultrual & Applied Economics Association Annual Meeting, Boston, MA, USA, 31 July–2 August 2016. [Google Scholar]
- Werner, A.K.; Watt, K.; Cameron, C.M.; Vink, S.; Page, A.; Jagals, P. Environmentally-related health impact assessment of coal seam gas development activities in Queensland, Australia. In Proceedings of the 36th Annual Conference of the International Association for Impact Assessment, Aichi-Nagoya, Japan, 11–14 May 2016. [Google Scholar]
- Boyle, M.D.; Payne-Sturges, D.C.; Sangaramoorthy, T.; Wilson, S.; Nachman, K.E.; Babik, K.; Jenkins, C.C.; Trowell, J.; Milton, D.K.; Sapkota, A. Hazard ranking methodology for assessing health impacts of unconventional natural gas development and production: The Maryland case study. PLoS ONE 2016, 11, e0145368. [Google Scholar] [CrossRef] [PubMed]
- Hill, E. Unconventional Natural Gas Development and Infant Health: Evidence from Pennsylvania—Working Paper. Cornell University: Ithaca, NY, 2012. Available online: http://publications.dyson.cornell.edu/research/researchpdf/wp/2012/Cornell-Dyson-wp1212.pdf (accessed on 18 May 2014).
- Ma, Z.Q.; Sneeringer, K.C.; Liu, L.; Kuller, L.H. Time series evaluation of birth defects in areas with and without unconventional natural gas development. J. Epidemiol. Public Health Rev. 2016, 1. [Google Scholar] [CrossRef]
- Brown, D.; Lewis, C.; Weinberger, B. Human exposure to unconventional natural gas development: A public health demonstration of periodic high exposure to chemical mixtures in ambient air. J. Environ. Sci. Health Part. A Toxic/Hazard. Subst. Environ. Eng. 2015, 50, 460–472. [Google Scholar] [CrossRef] [PubMed]


| Very Low (Jan. 1995–May 1998) | Low (Jun. 1998–Sep. 2001) | Medium (Oct. 2001–Feb. 2005) | High (Mar. 2005–Jul. 2008) | Intense (Aug. 2008–Dec. 2011) | p-Value for Linear Trend | |
|---|---|---|---|---|---|---|
| Adjusted | ||||||
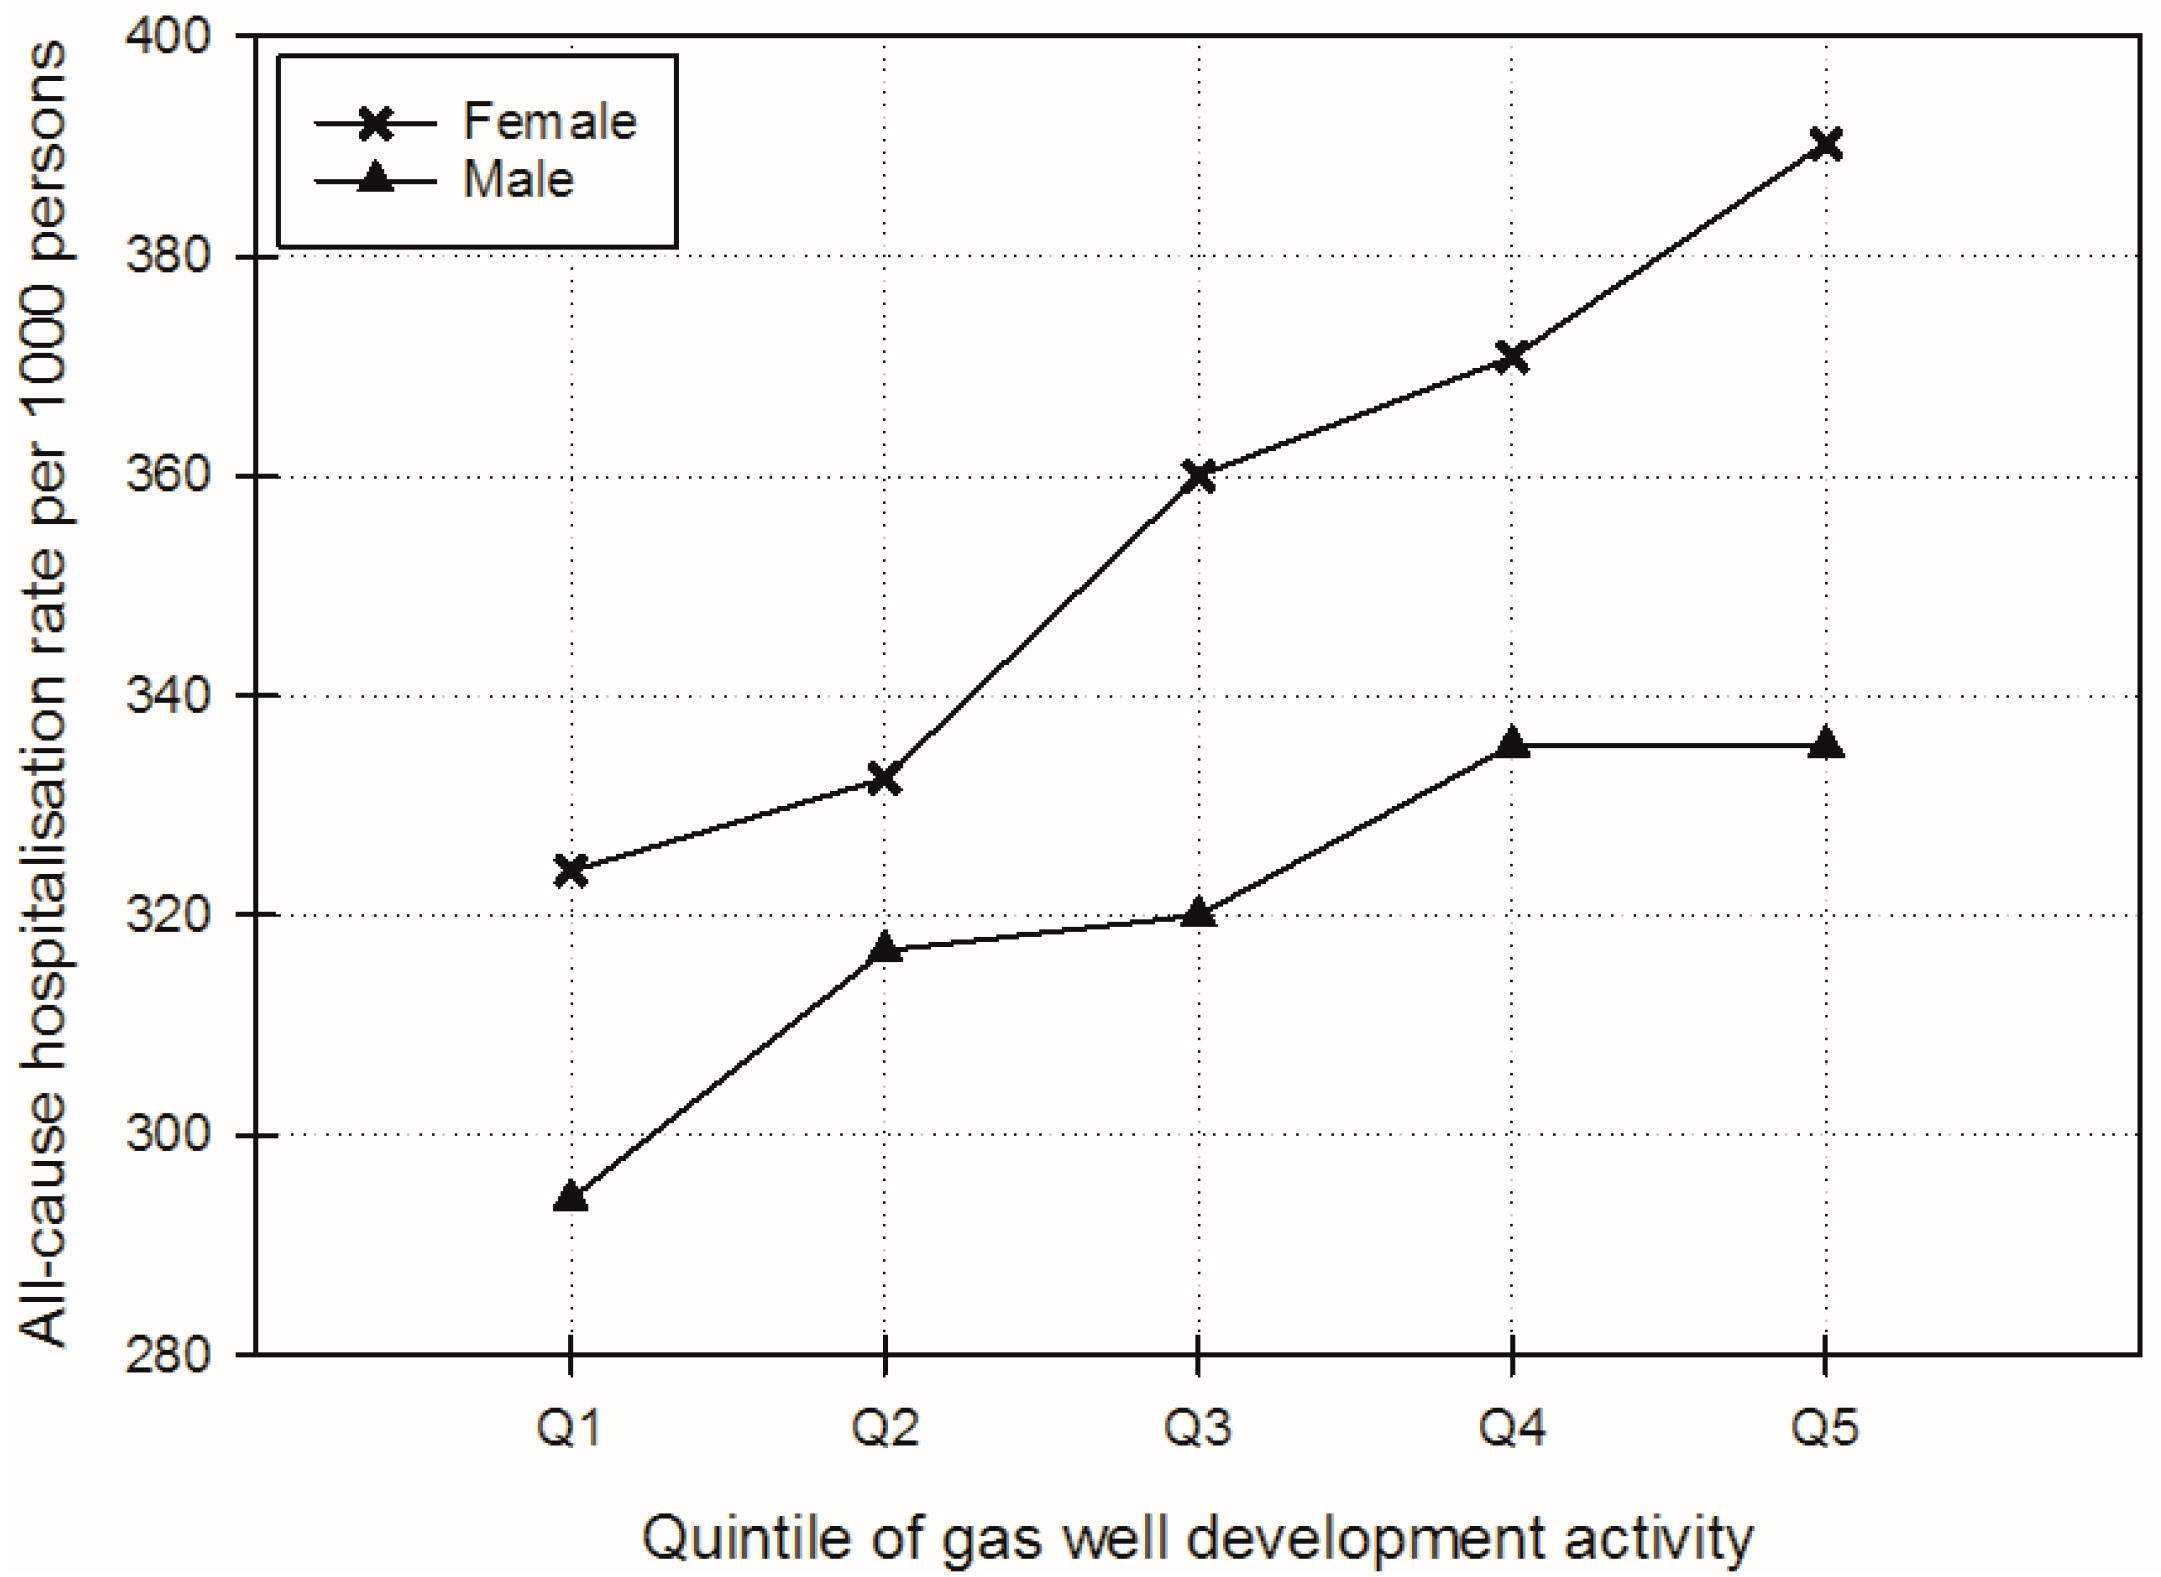
| All-cause | 324.0 (295.3–352.8) | 332.5 (312.6–352.3) | 360.0 (333.8–386.3) | 370.8 (338.5–403.1) | 390.3 (355.3–425.3) | 0.0003 |
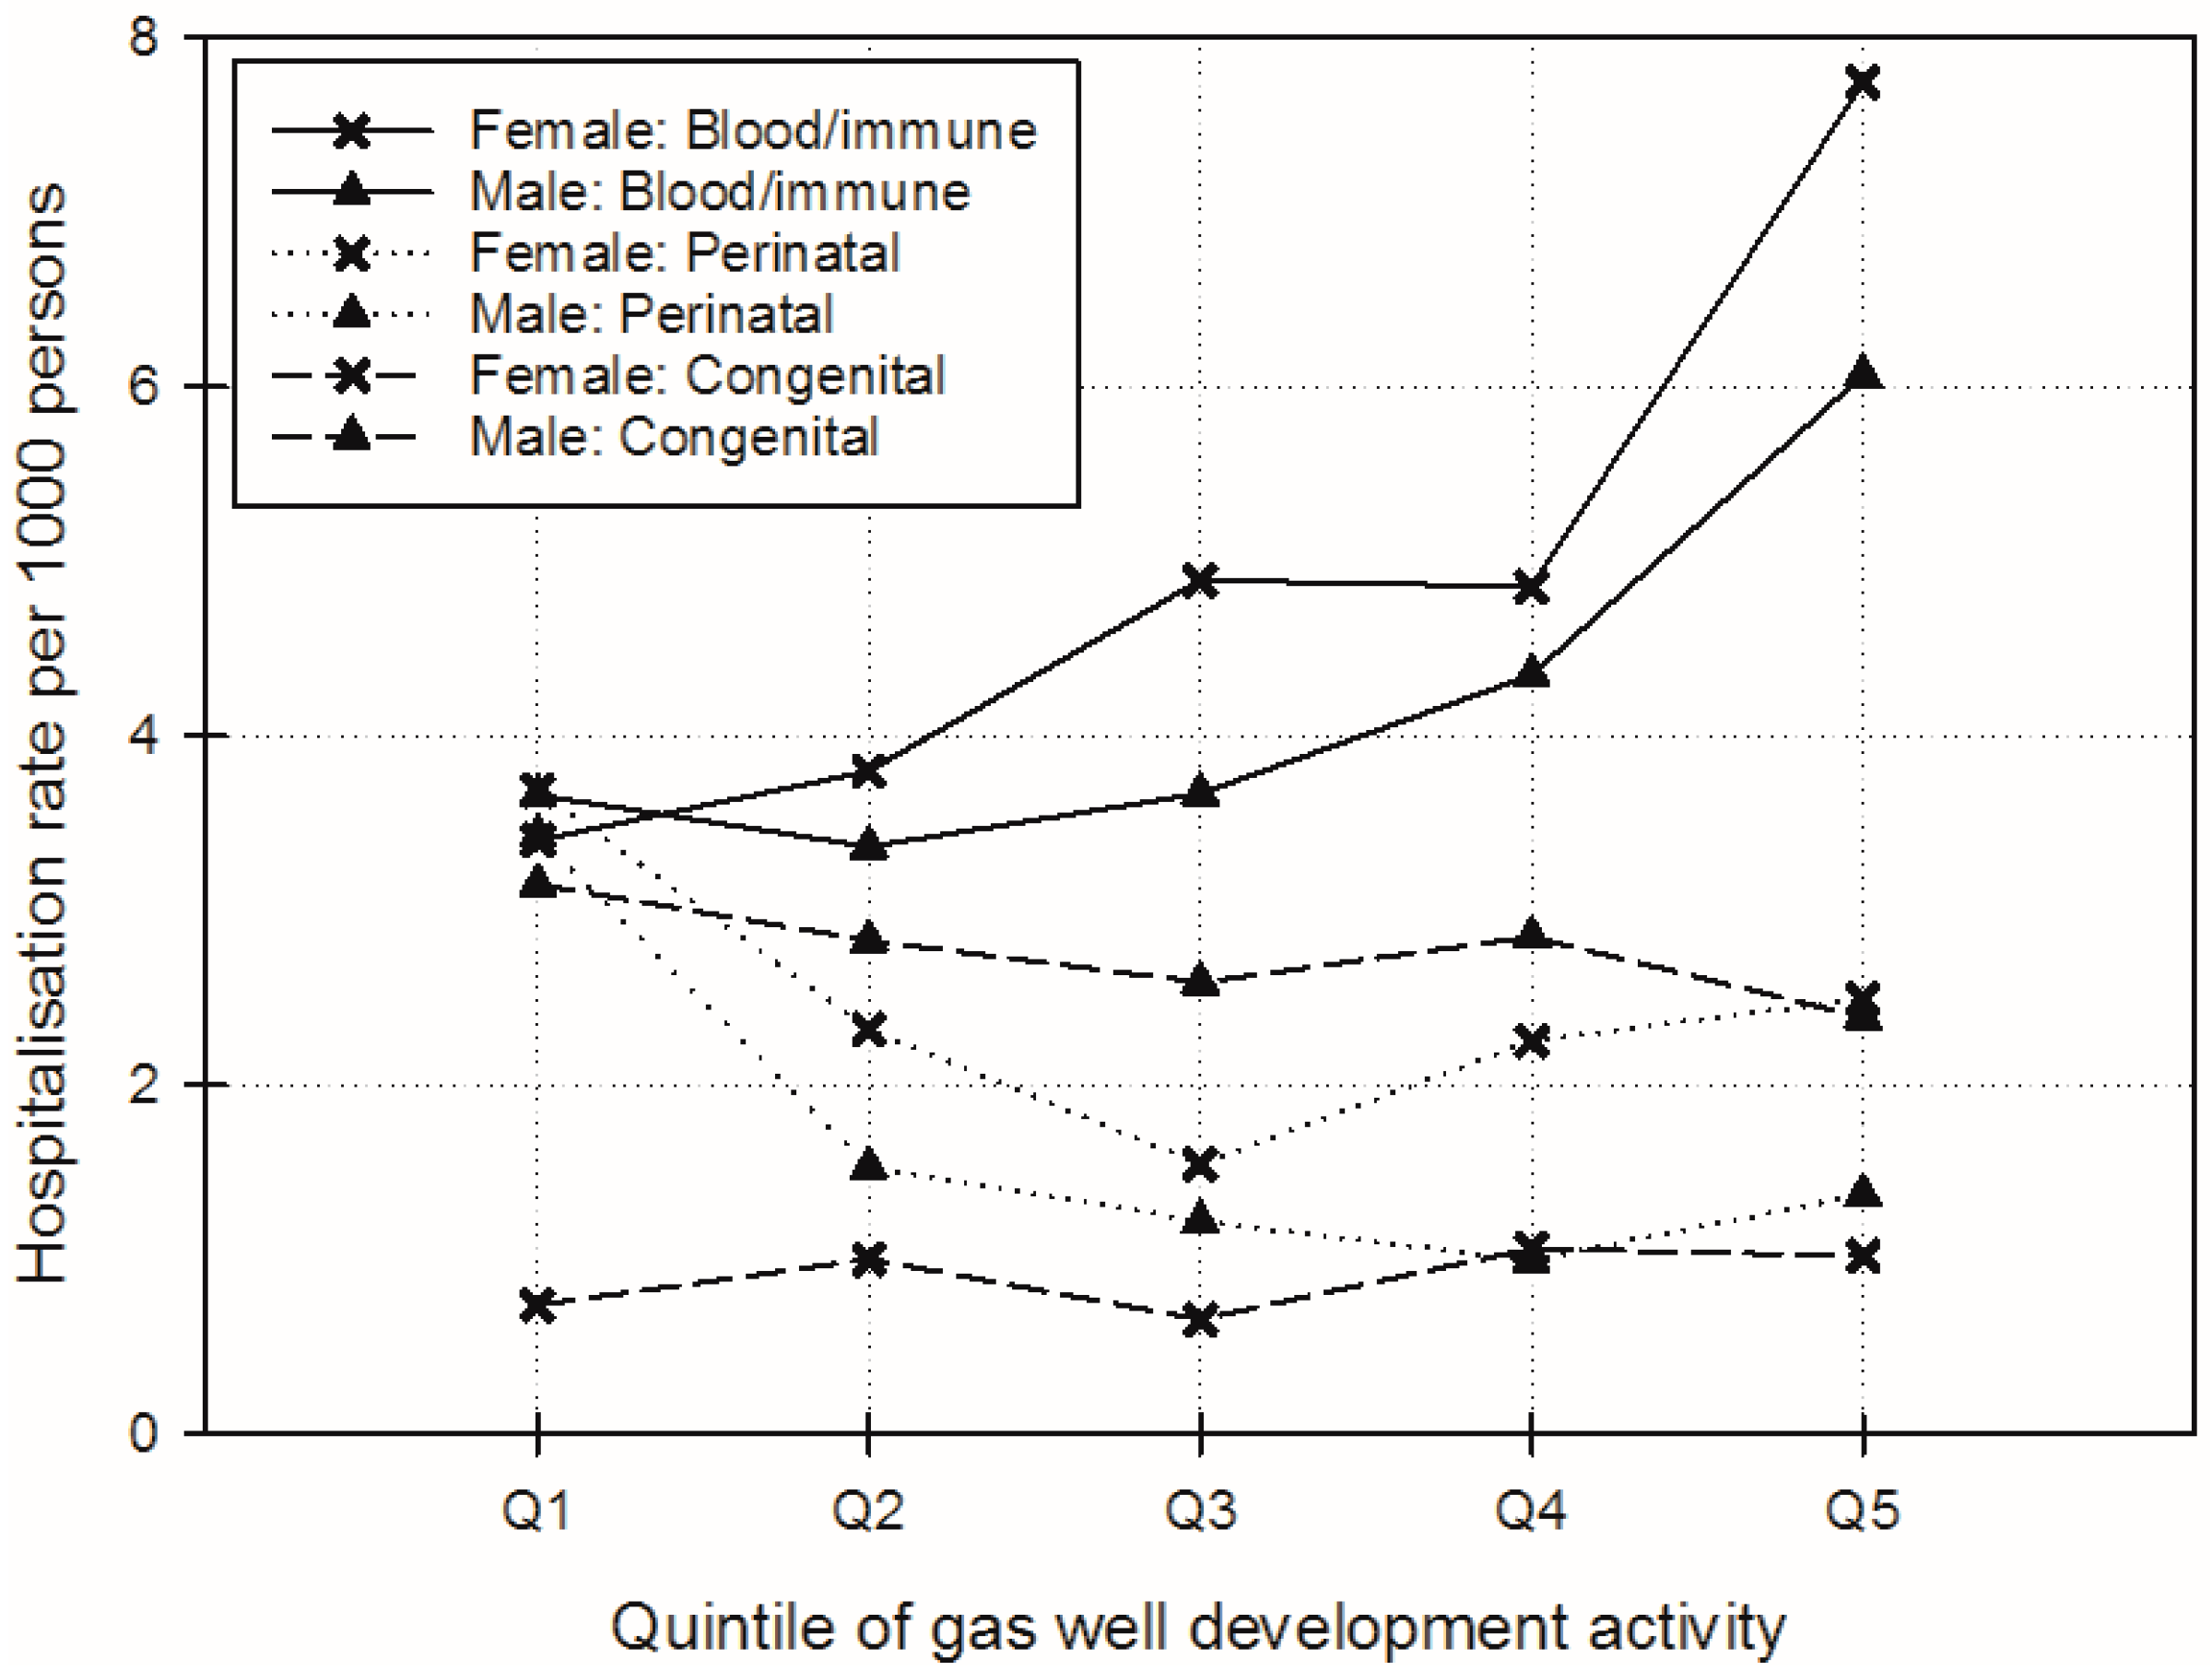
| Blood/immune | 3.4 (0.9–5.9) | 3.8 (2.5–5.1) | 4.9 (2.9–6.9) | 4.9 (2.3–7.4) | 7.7 (5.1–10.4) | 0.0009 |
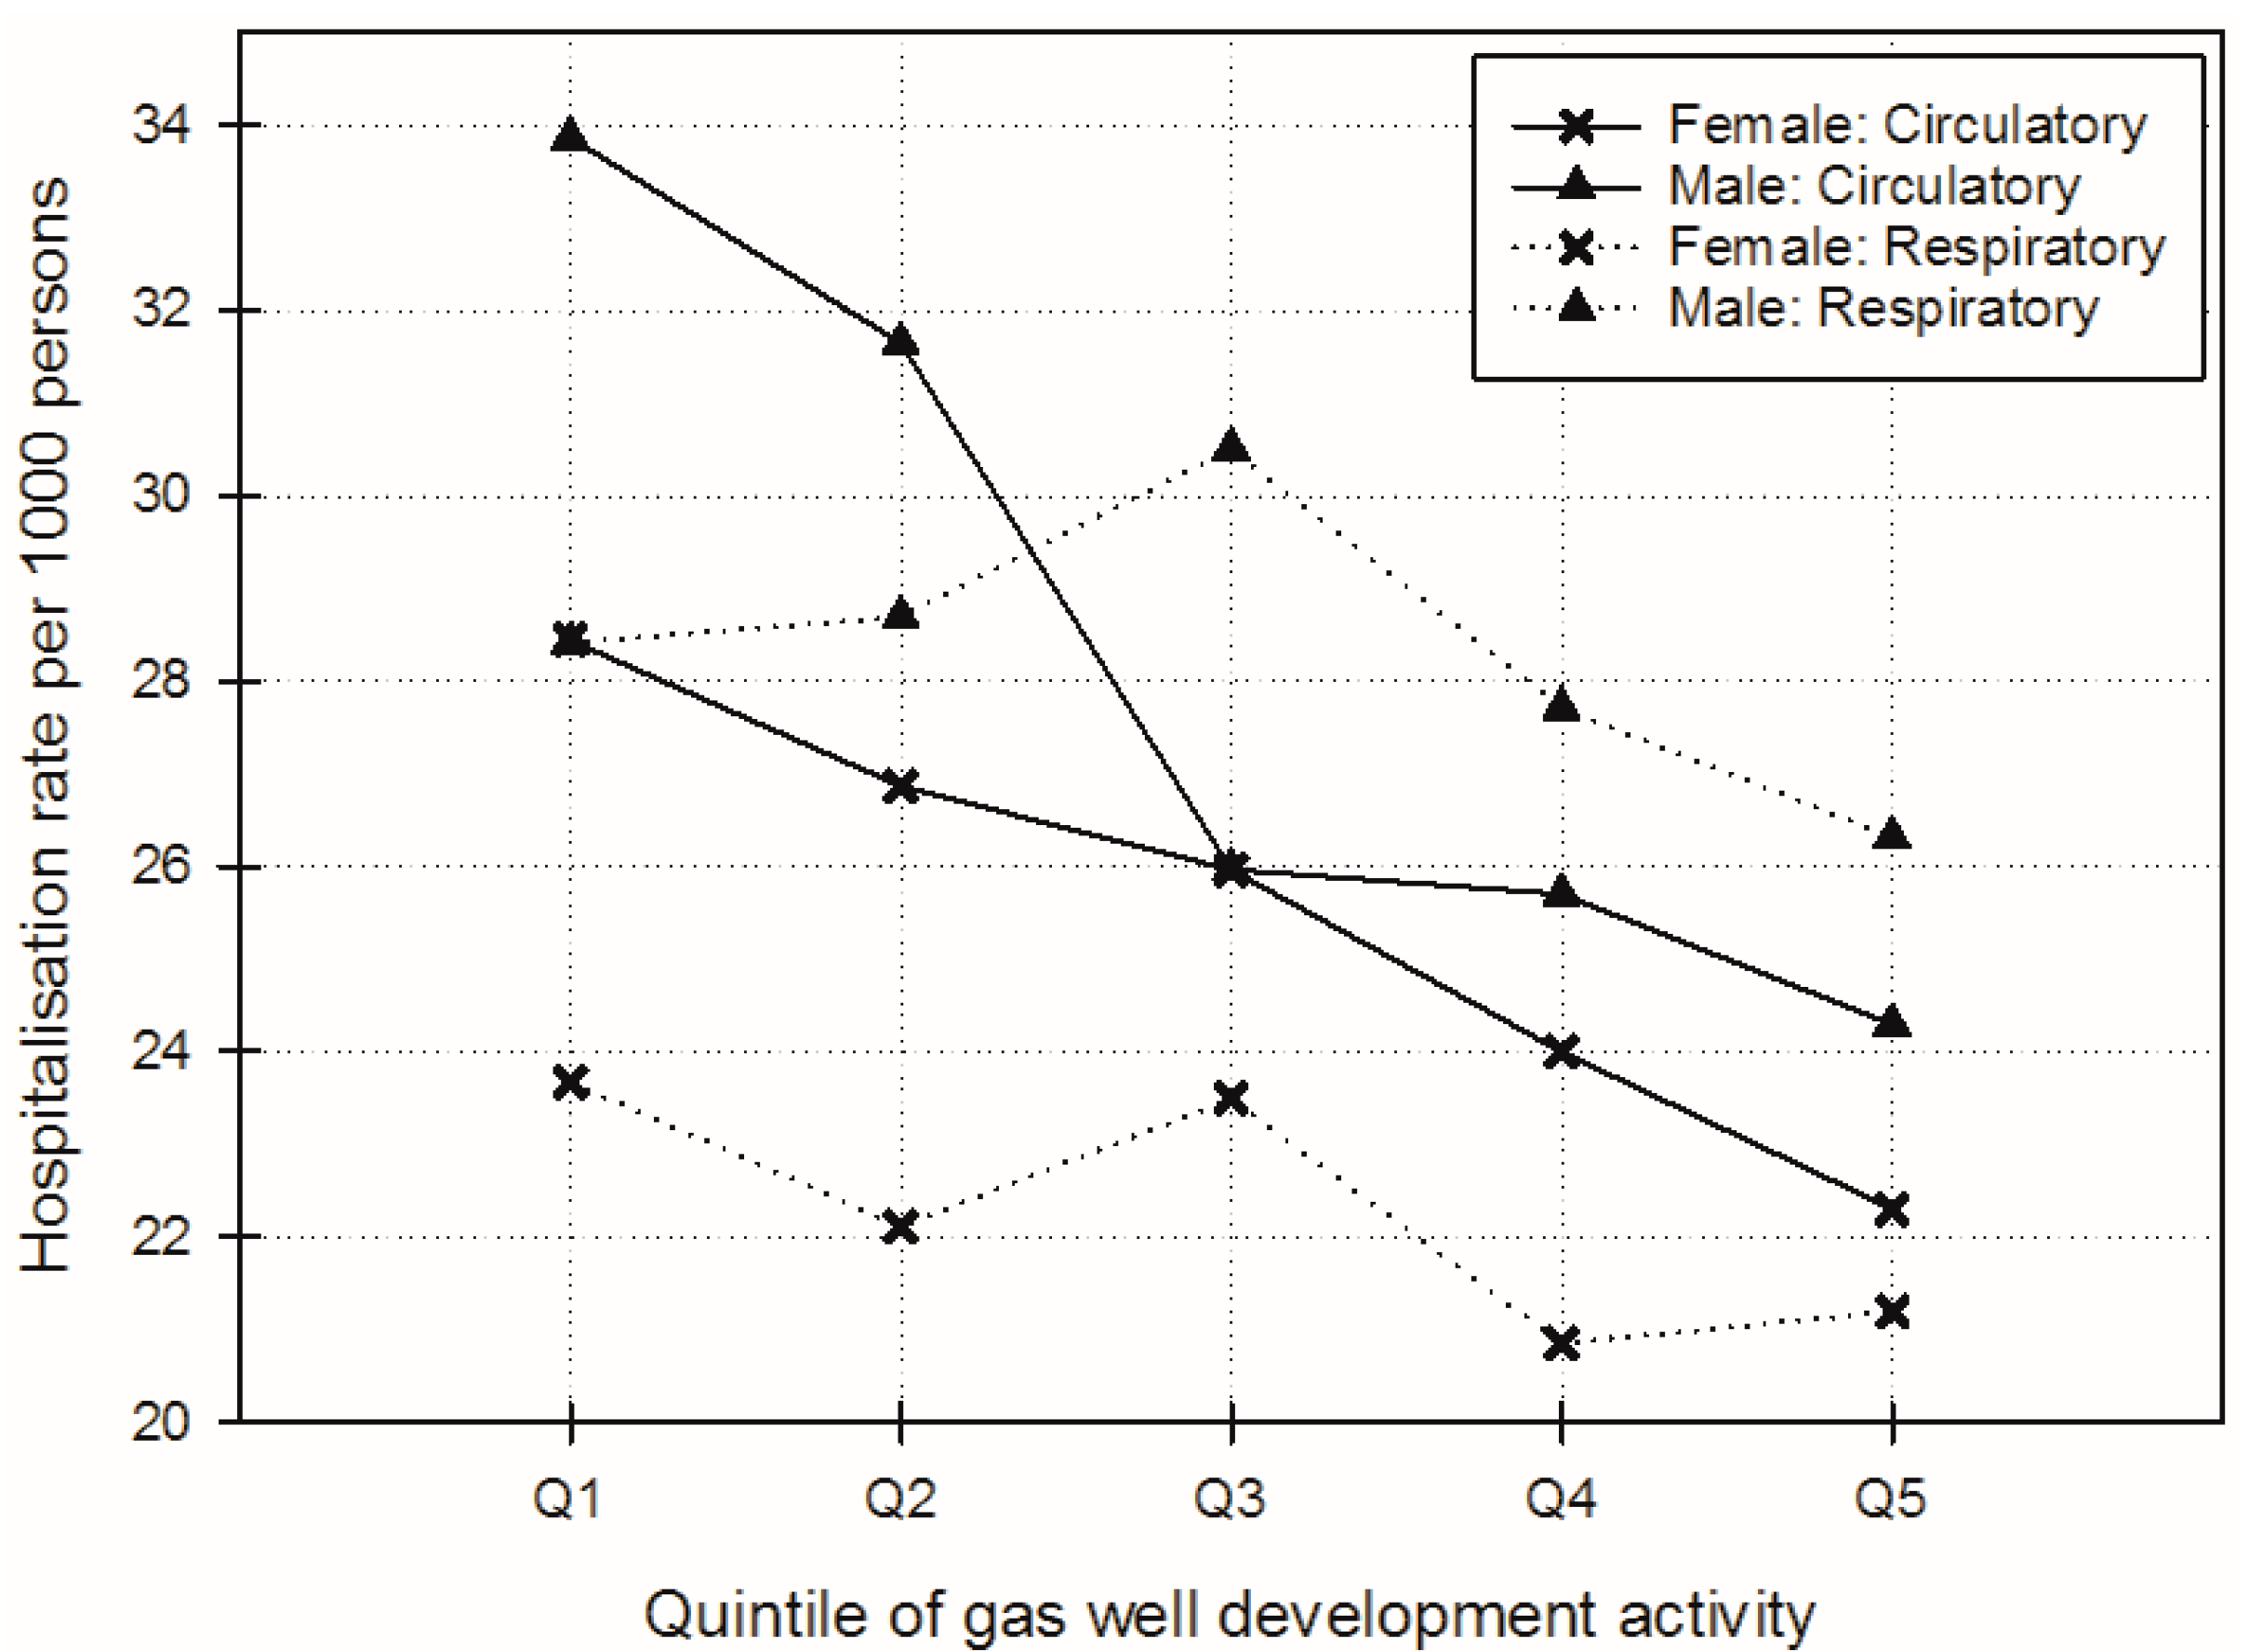
| Circulatory | 28.4 (22.7–34.2) | 26.9 (23.7–30.1) | 26.0 (21.3–30.6) | 24.0 (18.0–30.0) | 22.3 (16.1–28.5) | 0.0443 |
| Respiratory | 23.7 (17.8–30.0) | 22.1 (17.8–26.4) | 23.5 (17.9–29.1) | 20.8 (14.2–27.5) | 21.2 (13.8–28.6) | 0.5146 |
| Perinatal | 3.7 (2.3–5.1) | 2.3 (1.7–3.0) | 1.5 (0.5–2.6) | 2.2 (0.9–3.6) | 2.5 (1.1–3.8) | 0.0207 |
| Congenital | 0.7 (0.0–1.5) | 1.0 (0.6–1.4) | 0.7 (0.1–1.2) | 1.1 (0.3–1.8) | 1.0 (0.3–1.8) | 0.4174 |
| Unadjusted | ||||||
| All-cause | 328.5 (311.9–345.1) | 340.7 (320.0–361.4) | 363.7 (340.5–386.9) | 382.4 (358.6–406.1) | 409.2 (384.8–433.7) | <0.0001 |
| Blood/immune | 2.0 (1.1–3.0) | 2.4 (1.1–3.7) | 3.1 (1.7–4.4) | 3.4 (2.1–4.8) | 6.4 (5.0–7.7) | <0.0001 |
| Circulatory | 25.5 (23.2–28.0) | 24.0 (20.7–27.3) | 21.1 (17.8–24.5) | 20.8 (17.5–24.1) | 19.9 (16.5–23.3) | 0.0003 |
| Respiratory | 22.5 (18.8–26.2) | 21.3 (17.1–25.5) | 23.2 (18.2–28.2) | 21.3 (15.9–26.6) | 22.0 (16.4–27.6) | 0.8604 |
| Perinatal | 3.7 (3.2–4.1) | 2.3 (1.6–3.0) | 2.3 (1.6–3.0) | 2.4 (1.7–3.1) | 2.3 (1.6–3.0) | 0.0036 |
| Congenital | 1.2 (0.9–1.5) | 1.5 (1.1–1.8) | 1.0 (0.6–1.4) | 1.2 (0.8–1.6) | 1.2 (0.8–1.5) | 0.4684 |
| Very Low (Jan. 1995–May 1998) | Low (Jun. 1998–Sep. 2001) | Medium (Oct. 2001–Feb. 2005) | High (Mar. 2005–Jul. 2008) | Intense (Aug. 2008–Dec. 2011) | p-Value for Linear Trend | |
|---|---|---|---|---|---|---|
| Adjusted | ||||||
| All-cause | 294.2 (263.6–324.8) | 316.8 (295.6–337.9) | 320.0 (292.0–348.0) | 335.5 (300.7–370.3) | 335.4 (297.7–373.2) | 0.0339 |
| Blood/immune | 3.7 (1.4–5.9) | 3.4 (2.2–4.5) | 3.7 (1.9–5.4) | 4.3 (2.1–6.6) | 6.1 (3.8–8.3) | 0.0679 |
| Circulatory | 33.9 (28.7–39.1) | 31.7 (28.7–34.6) | 26.0 (21.7–30.2) | 25.7 (20.2–31.2) | 24.3 (18.6–29.9) | 0.0010 |
| Respiratory | 28.4 (21.6–35.2) | 28.7 (23.8–33.6) | 30.5 (24.1–36.9) | 27.7 (20.0–35.4) | 26.3 (17.8–34.8) | 0.6931 |
| Perinatal | 3.4 (1.8–5.1) | 1.5 (0.7–2.4) | 1.2 (−0.1–2.5) | 1.0 (−0.7–2.7) | 1.4 (−0.3–3.0) | 0.0089 |
| Congenital | 3.1 (2.2–4.1) | 2.8 (2.3–3.3) | 2.6 (1.8–3.4) | 2.8 (1.9–3.8) | 2.4 (1.4–3.4) | 0.0528 |
| Unadjusted | ||||||
| All-cause | 298.6 (281.2–316.0) | 322.4 (300.8–344.0) | 321.7 (297.4–346.1) | 341.4 (316.4–366.4) | 346.0 (320.3–371.8) | 0.0004 |
| Blood/immune | 2.7 (1.9–3.5) | 2.4 (1.3–3.6) | 2.4 (1.3–3.6) | 3.6 (2.4–4.7) | 5.4 (4.2–6.5) | <0.0001 |
| Circulatory | 32.6 (30.3–34.8) | 30.5 (27.4–33.6) | 25.8 (22.6–28.9) | 27.9 (24.8–31.1) | 27.4 (24.2–30.6) | 0.0020 |
| Respiratory | 25.2 (21.1–29.3) | 25.6 (20.7–30.4) | 27.4 (21.7–33.0) | 25.3 (19.4–31.2) | 24.2 (18.1–30.4) | 0.8262 |
| Perinatal | 4.5 (3.9–5.1) | 2.6 (1.8–3.4) | 2.7 (1.8–3.5) | 2.3 (1.4–3.1) | 2.7 (1.9–3.6) | 0.0009 |
| Congenital | 2.3 (2.0–2.7) | 2.0 (1.5–2.5) | 1.7 (1.2–2.2) | 2.1 (1.6–2.6) | 1.6 (1.1–2.1) | 0.0267 |
© 2017 by the authors. Licensee MDPI, Basel, Switzerland. This article is an open access article distributed under the terms and conditions of the Creative Commons Attribution (CC BY) license (http://creativecommons.org/licenses/by/4.0/).
Share and Cite
Werner, A.K.; Cameron, C.M.; Watt, K.; Vink, S.; Jagals, P.; Page, A. Is Increasing Coal Seam Gas Well Development Activity Associated with Increasing Hospitalisation Rates in Queensland, Australia? An Exploratory Analysis 1995–2011. Int. J. Environ. Res. Public Health 2017, 14, 540. https://doi.org/10.3390/ijerph14050540
Werner AK, Cameron CM, Watt K, Vink S, Jagals P, Page A. Is Increasing Coal Seam Gas Well Development Activity Associated with Increasing Hospitalisation Rates in Queensland, Australia? An Exploratory Analysis 1995–2011. International Journal of Environmental Research and Public Health. 2017; 14(5):540. https://doi.org/10.3390/ijerph14050540
Chicago/Turabian StyleWerner, Angela K., Cate M. Cameron, Kerrianne Watt, Sue Vink, Paul Jagals, and Andrew Page. 2017. "Is Increasing Coal Seam Gas Well Development Activity Associated with Increasing Hospitalisation Rates in Queensland, Australia? An Exploratory Analysis 1995–2011" International Journal of Environmental Research and Public Health 14, no. 5: 540. https://doi.org/10.3390/ijerph14050540