
Increasing the Use of Urban Greenways in Developing Countries: A Case Study on Wutong Greenway in Shenzhen, China


Abstract
:1. Introduction
2. Methodology
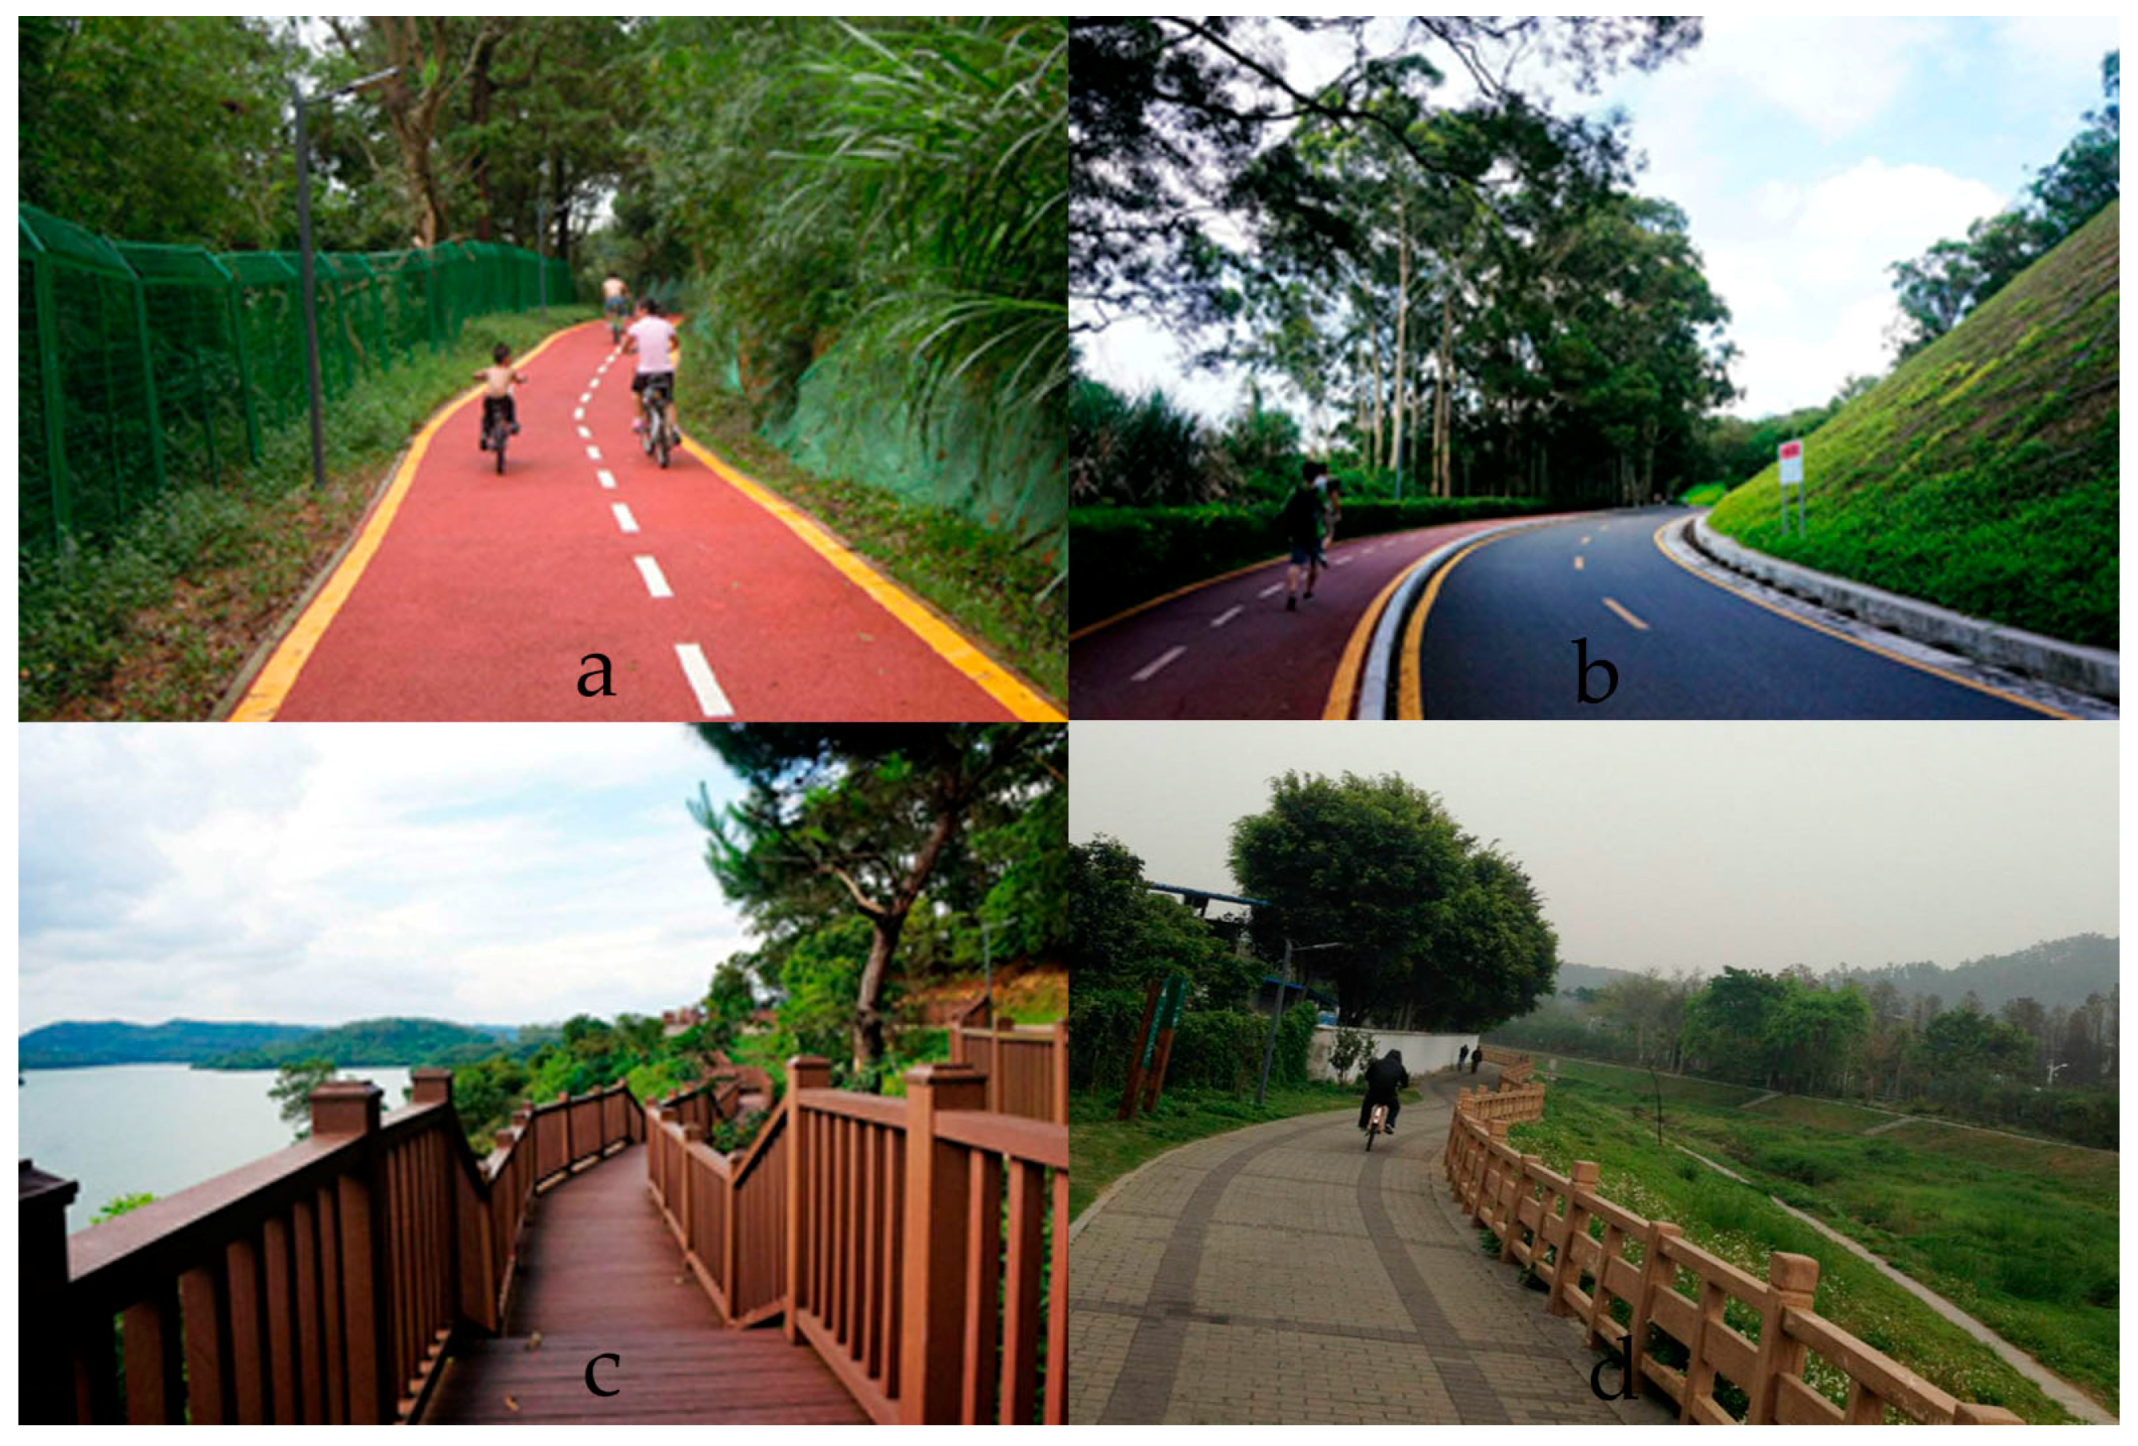
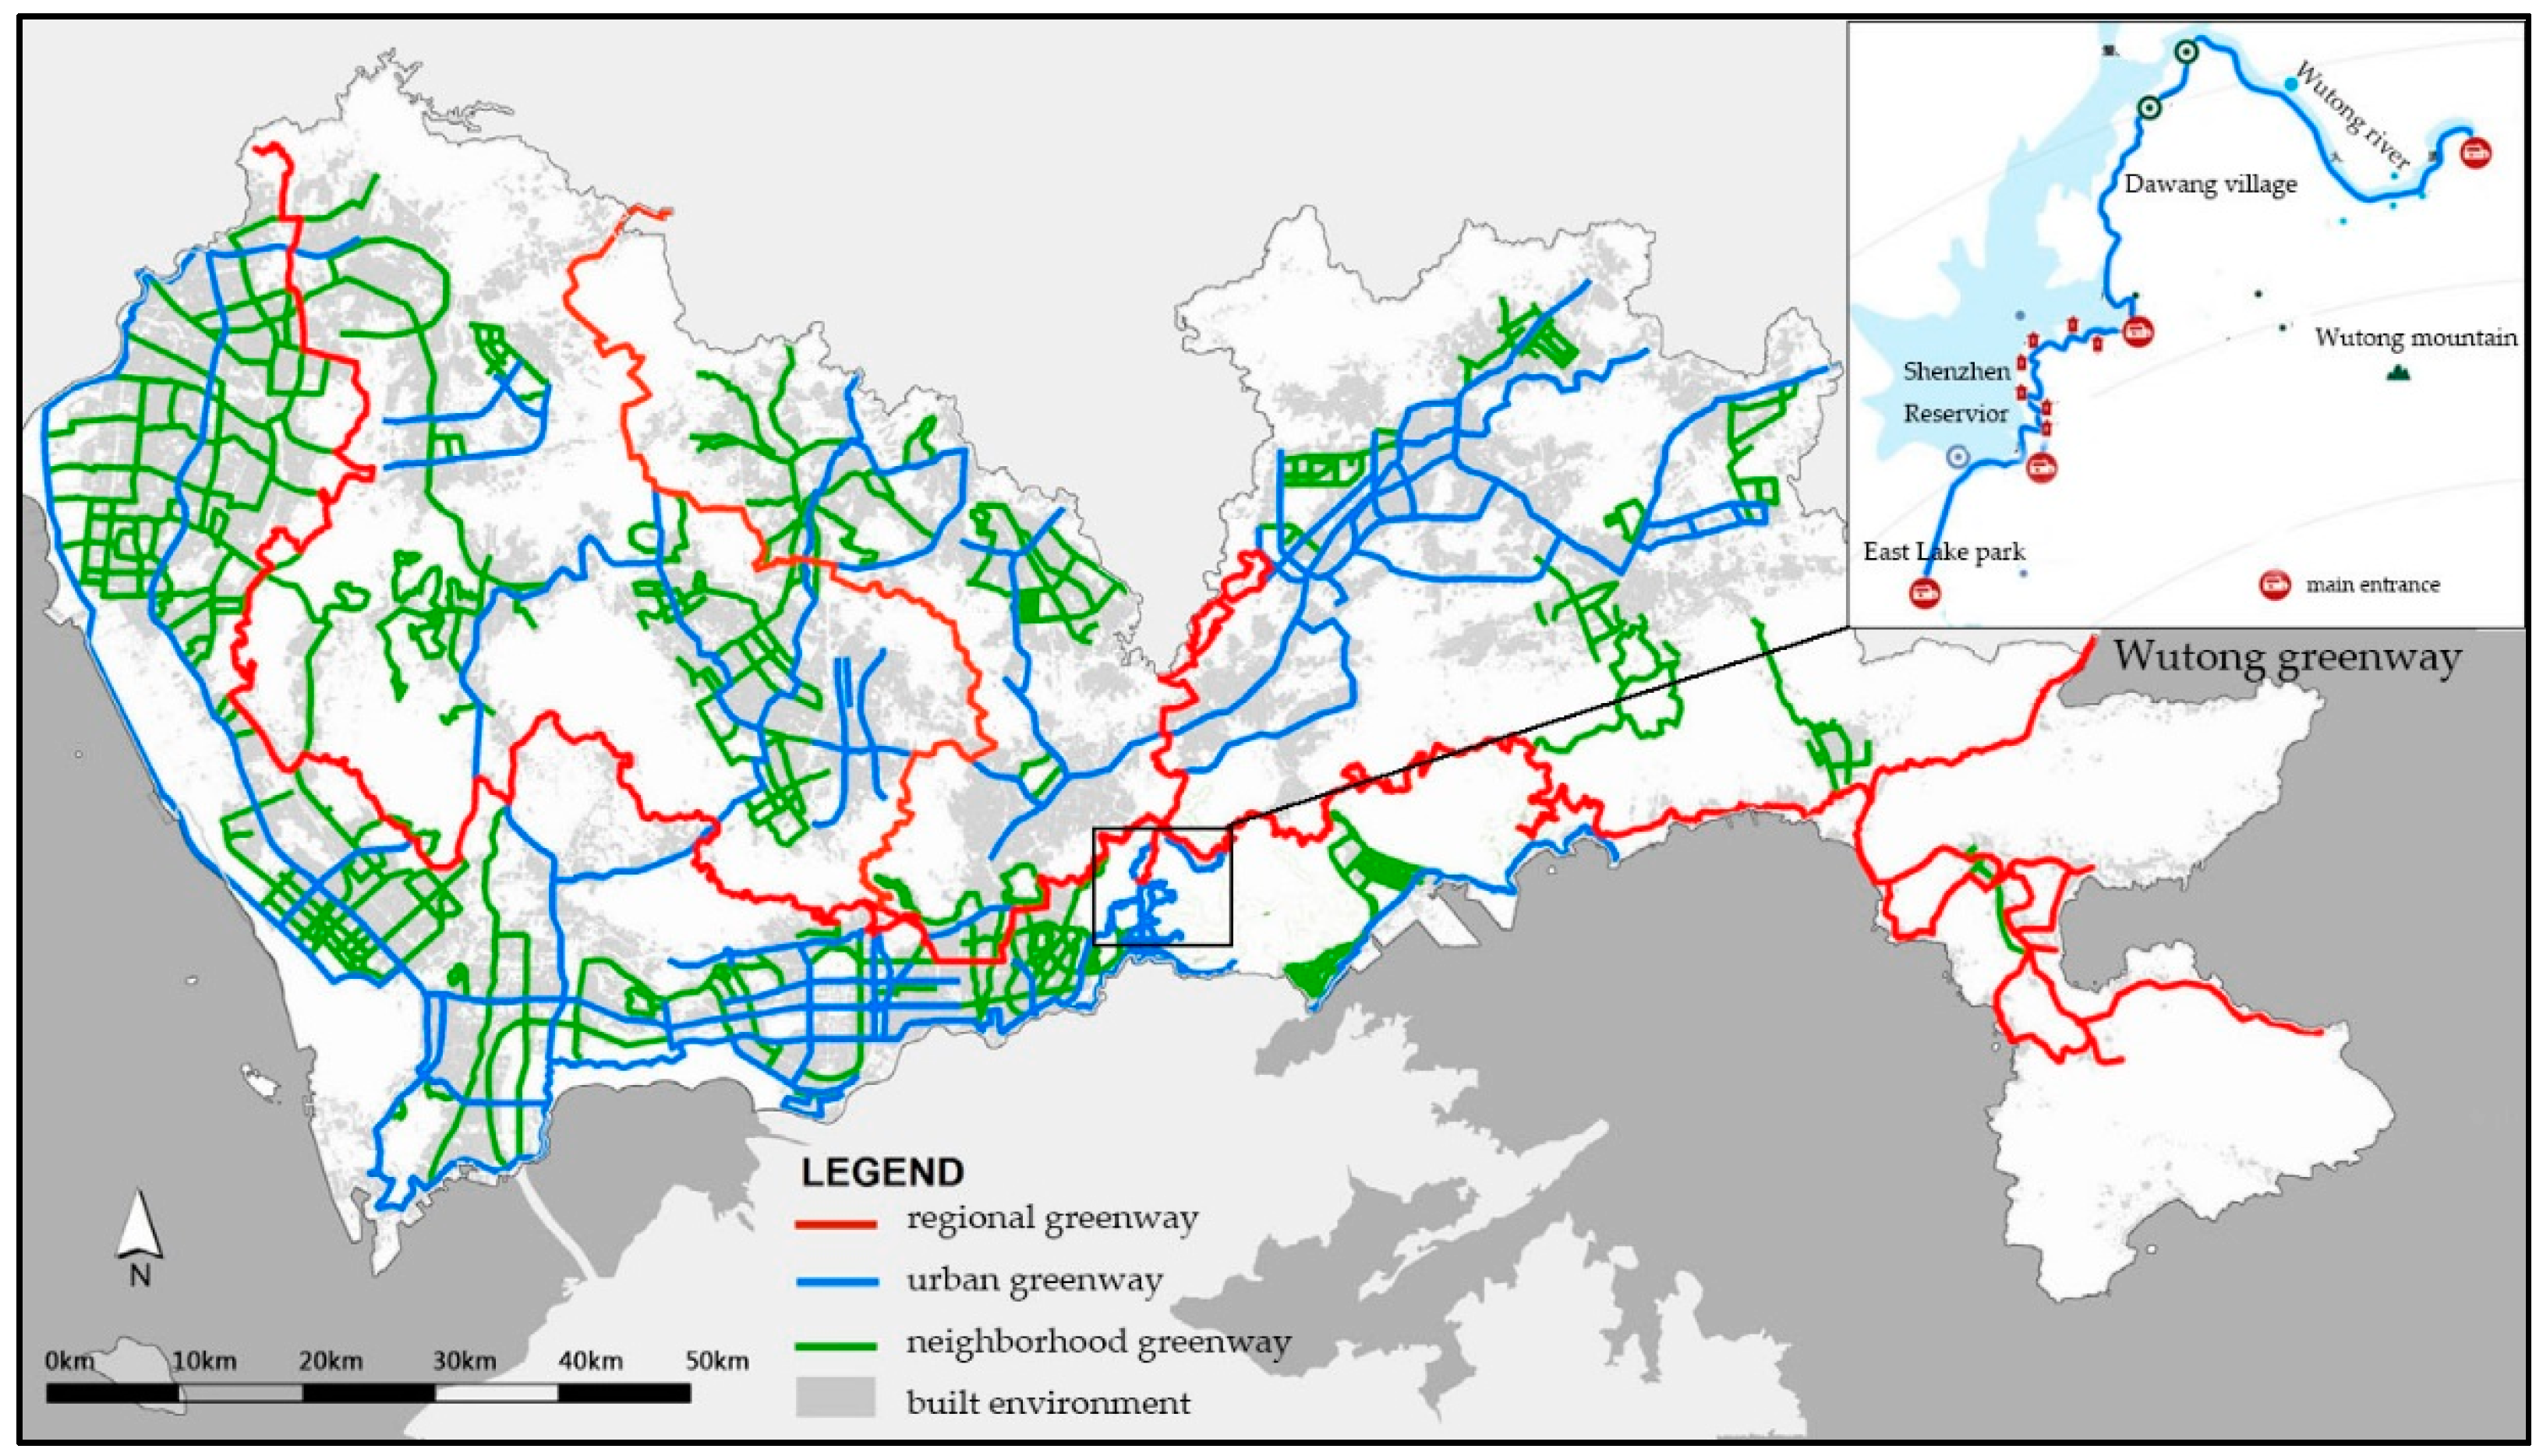
2.1. Study Case
2.2. Questionnaire
2.3. Model Construction and Data Analysis
3. Key Findings
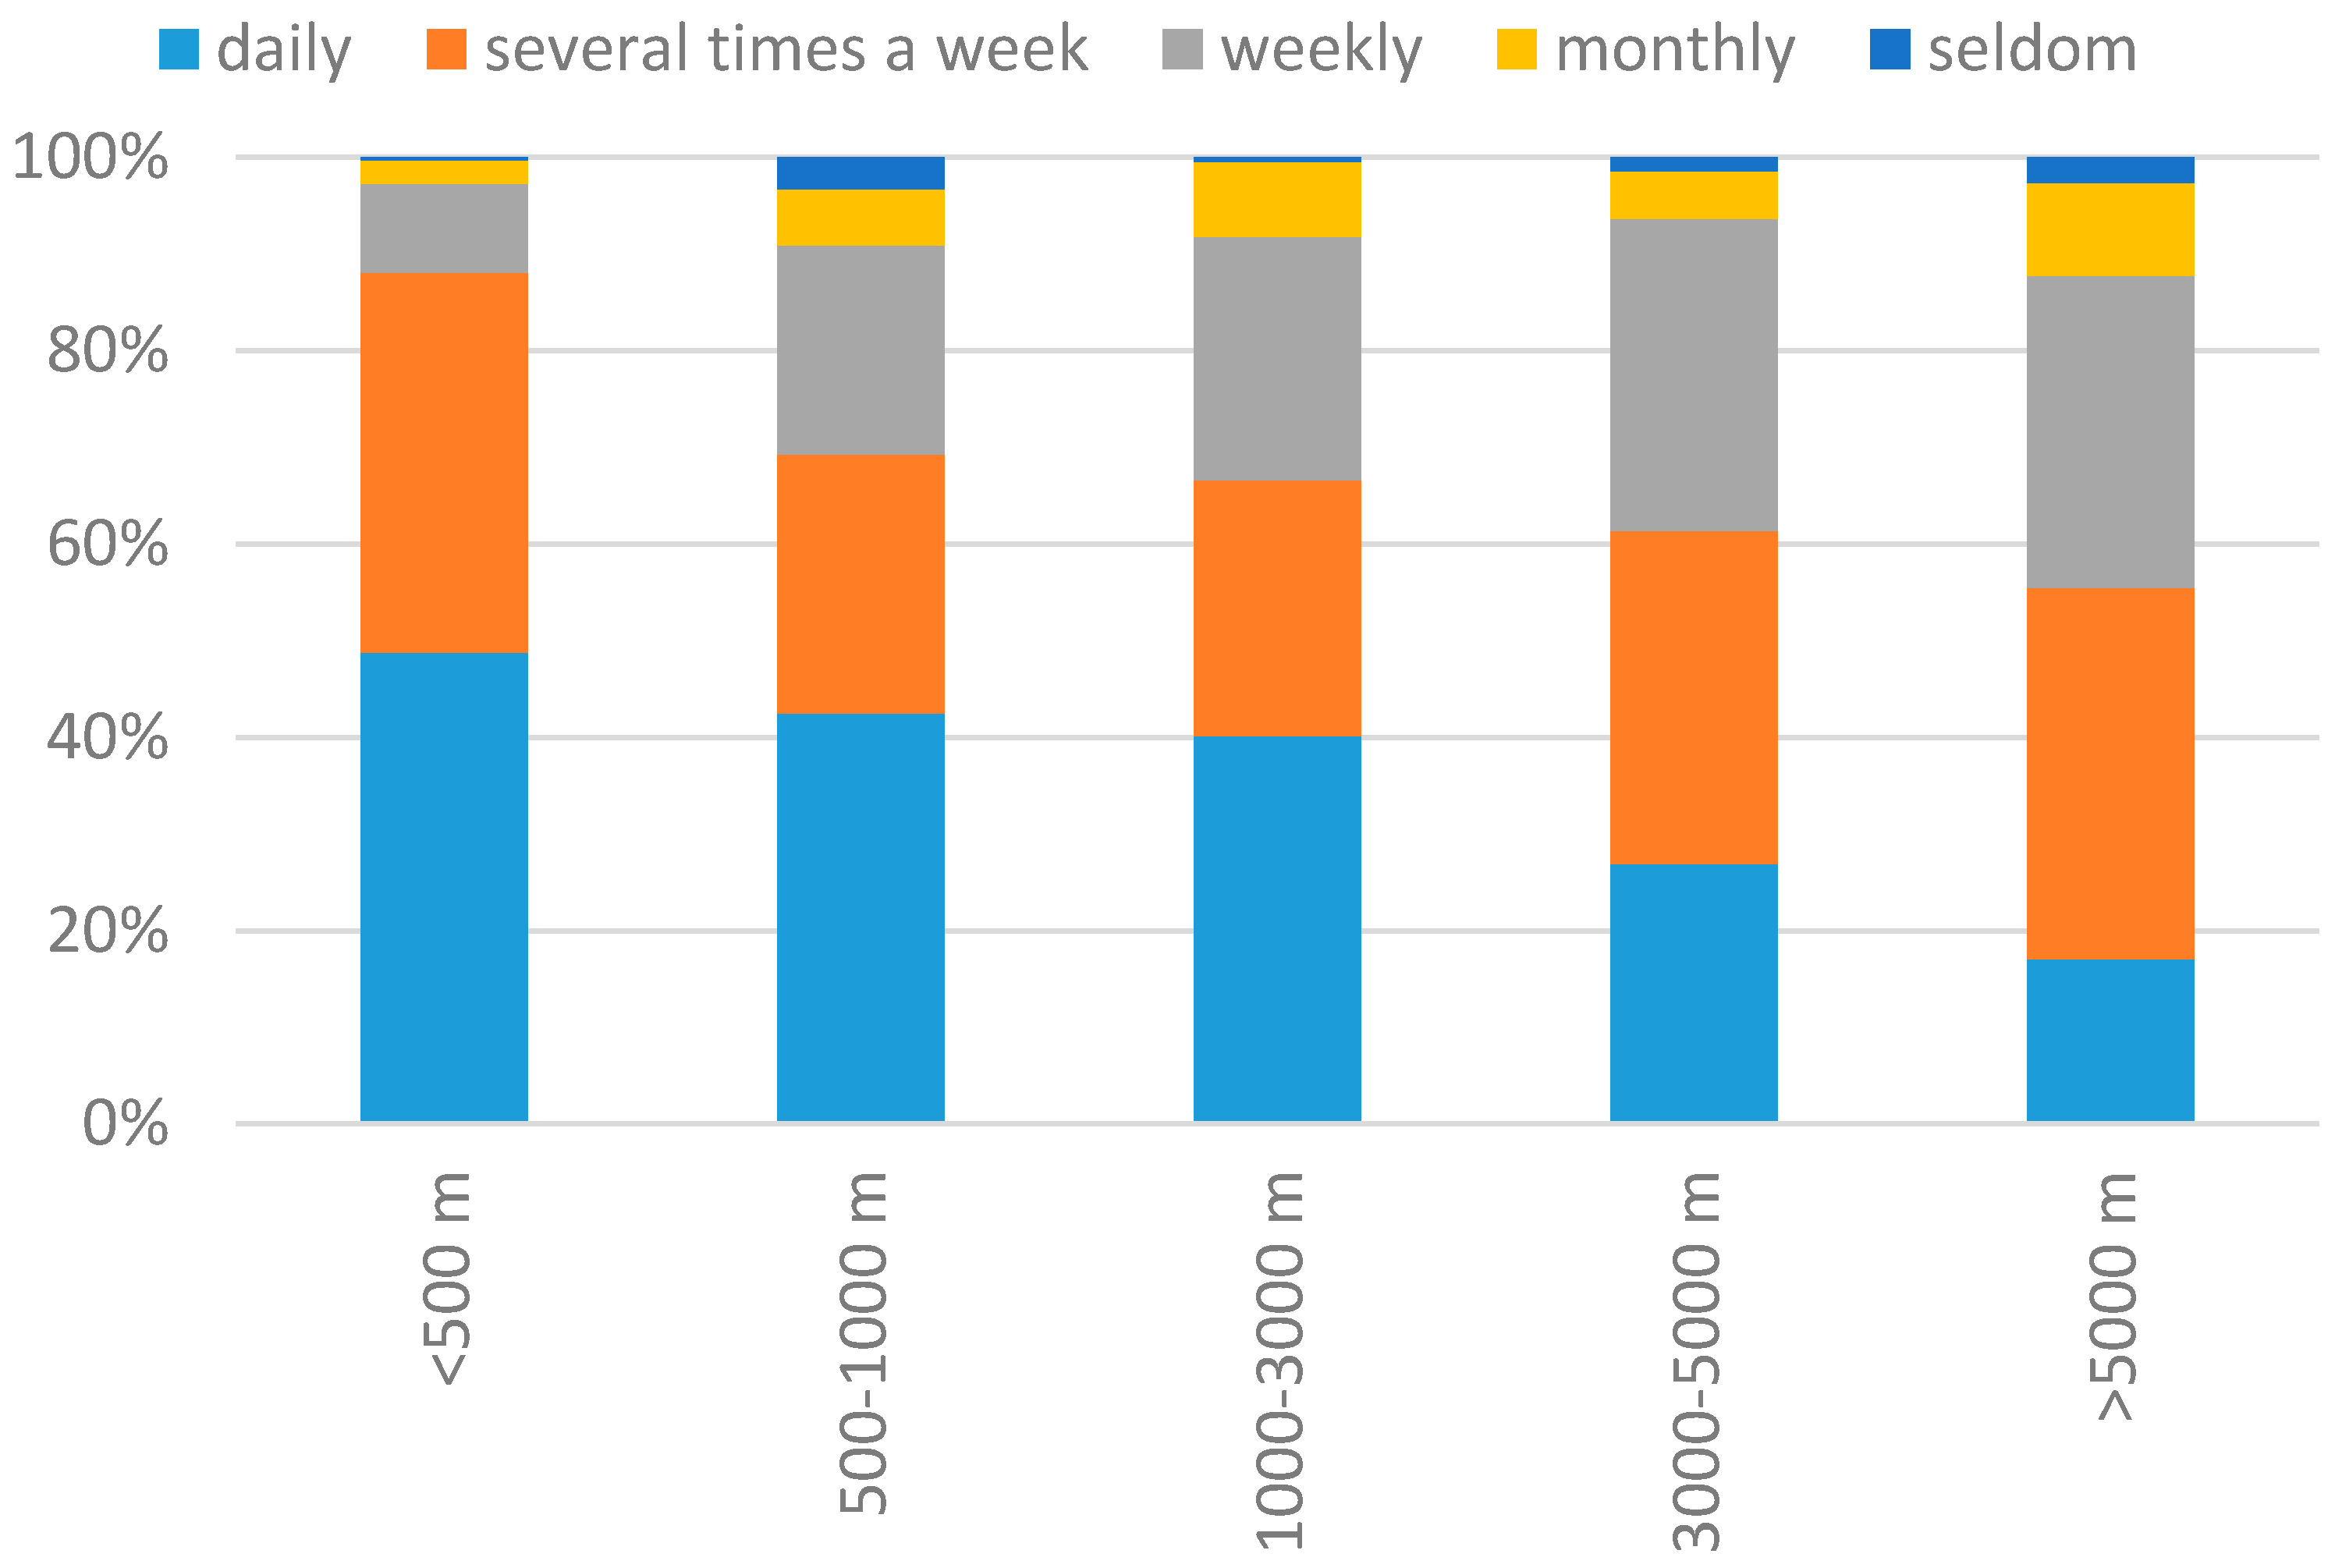
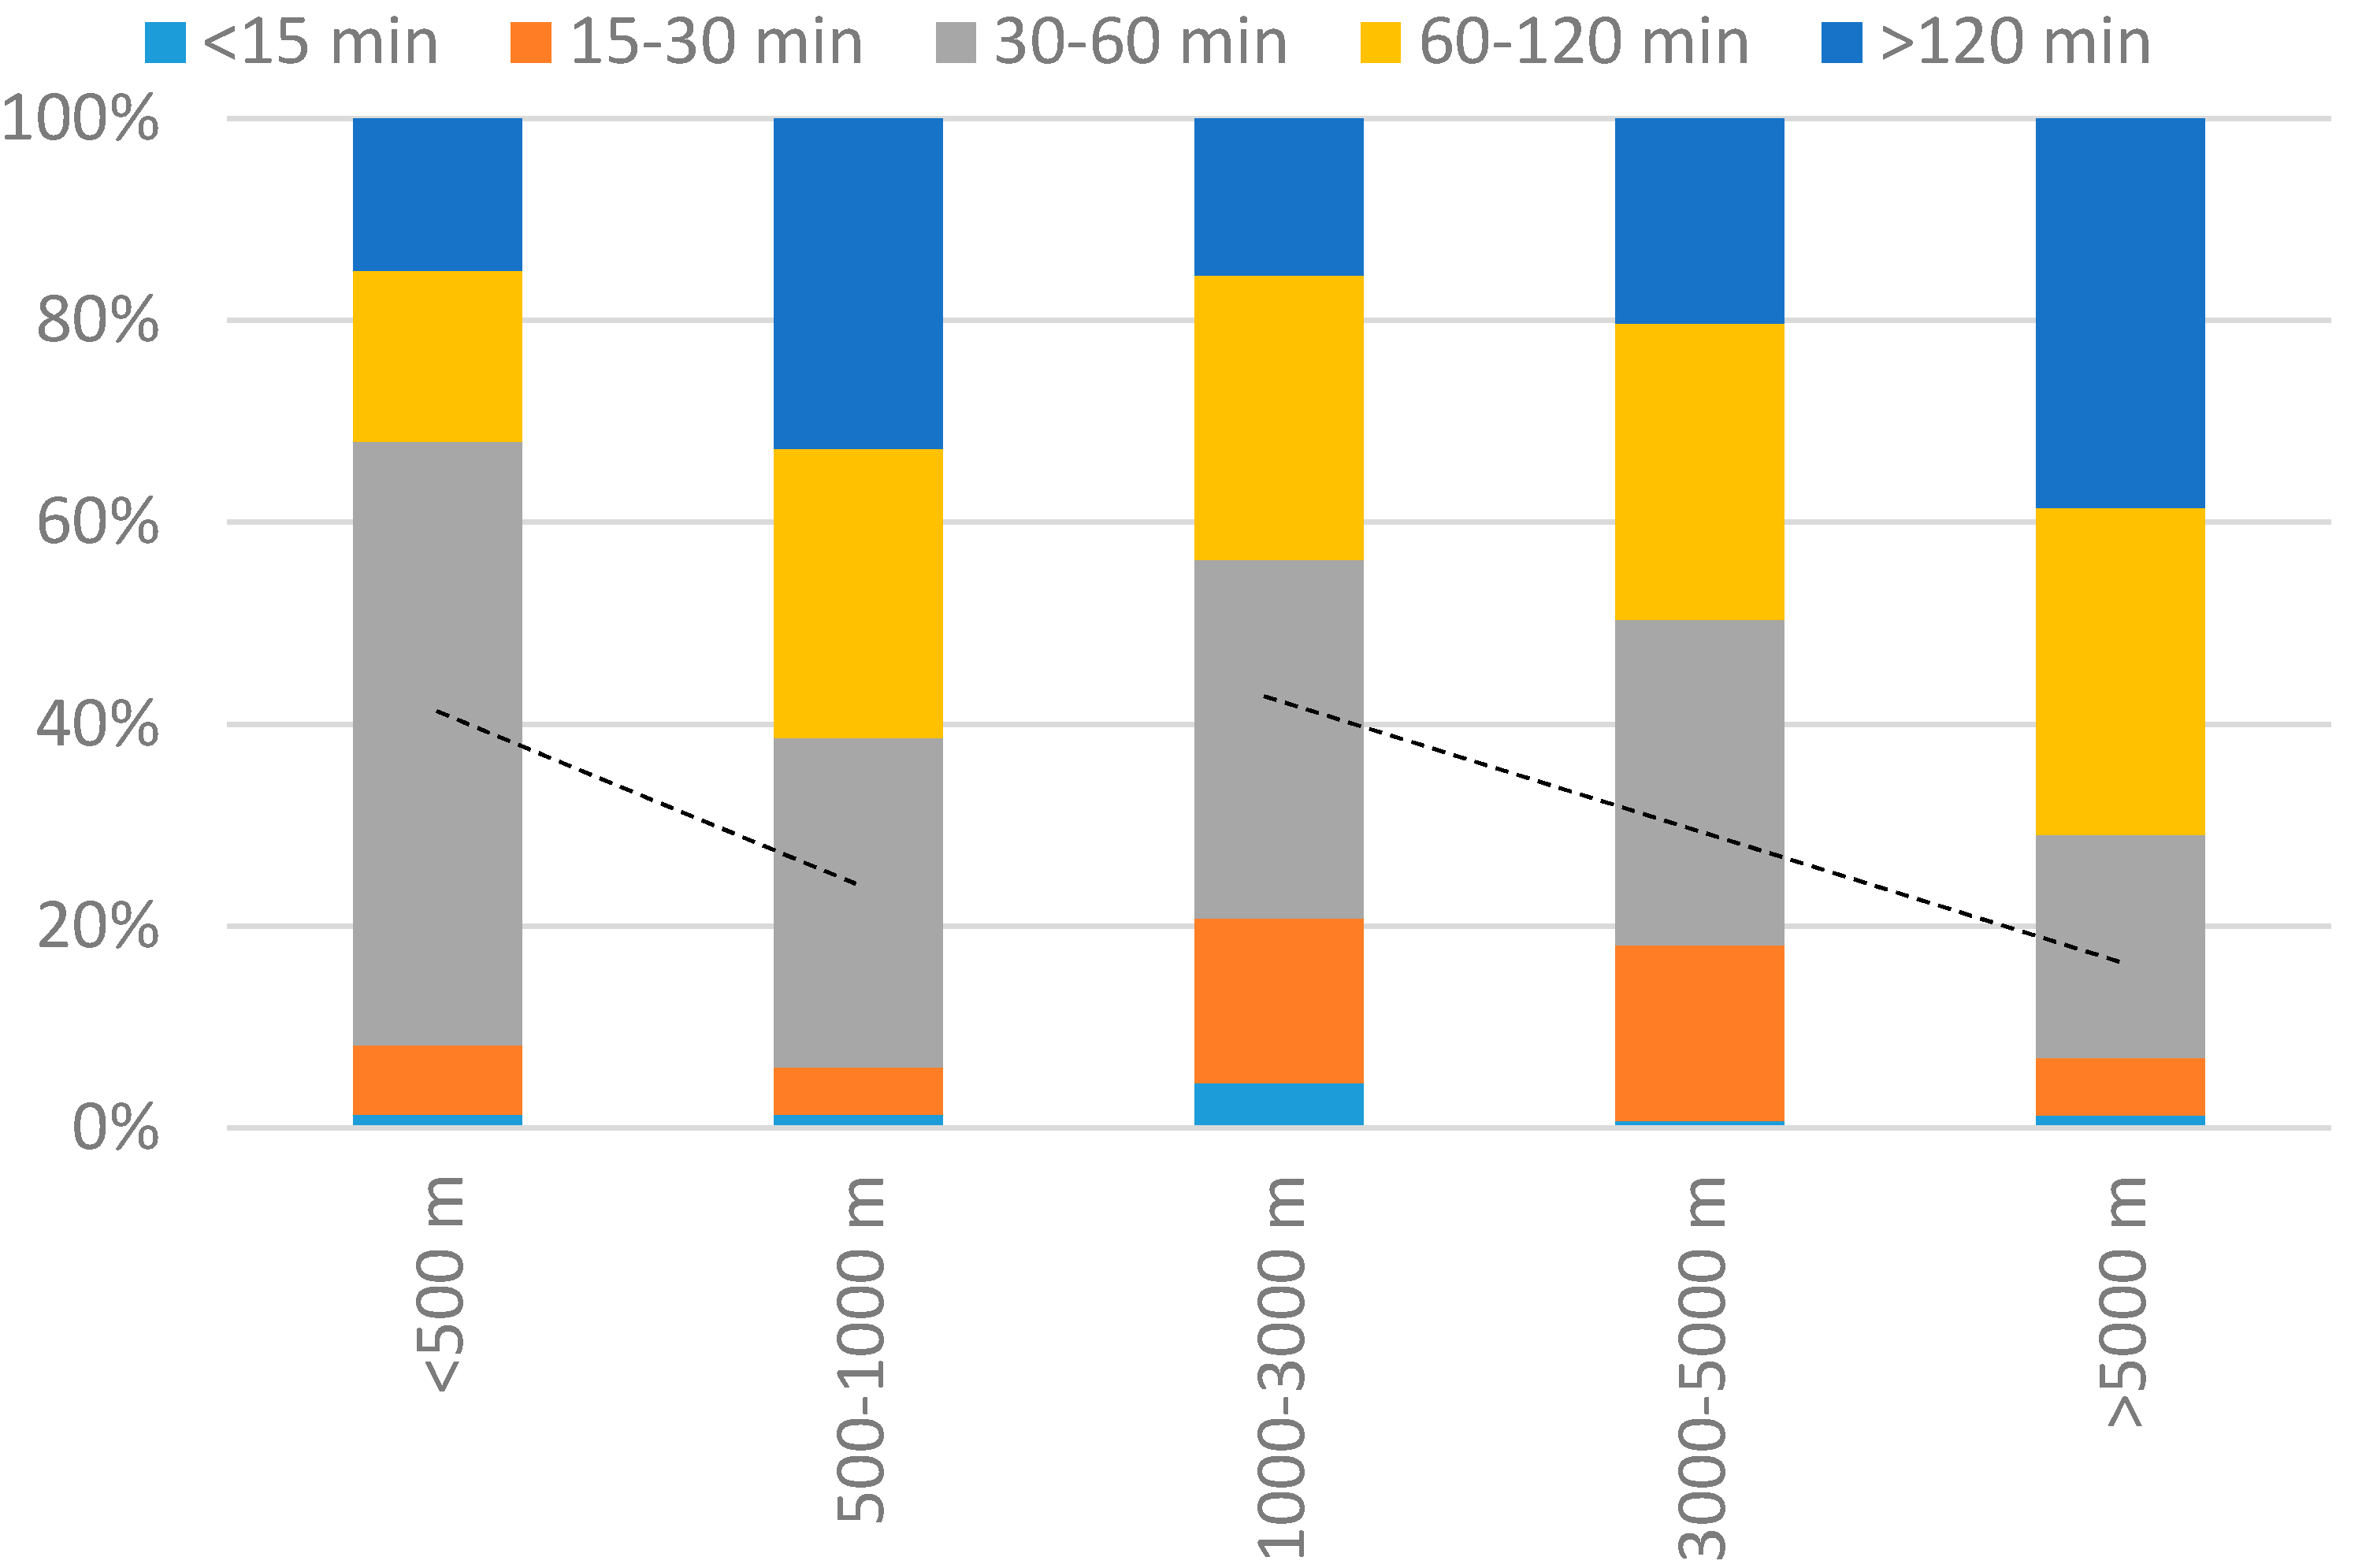
3.1. Distance between Home and Greenway and Patterns of Use
3.1.1. Distance between Place of Residence and the Greenway, Mode of Transportation, Frequency of Use and Duration of Use
3.1.2. Relationship between Distance from the Greenway and Greenway Use
3.1.3. Behavior and Patterns of Use
3.2. Factors That Influence the Frequency of Greenway Use
3.3. Factors That Influence the Duration of Greenway Use
4. Discussion
4.1. Patterns of Greenway Use
4.2. Factors That Affect Greenway Use
4.3. Future Perspectives
5. Conclusions
Acknowledgments
Author Contributions
Conflicts of Interest
References
- China National Bureau of Statistics. Main Data Bulletin of 2015 China National 1% Population Sampling Survey. Available online: http://www.stats.gov.cn/tjsj/zxfb/201604/t20160420_1346151.html (accessed on 8 March 2017).
- Malekpour, S.; Brown, R.R.; Haan, F.J.D. Strategic planning of urban infrastructure for environmental sustainability: Understanding the past to intervene for the future. Cities 2015, 46, 67–75. [Google Scholar] [CrossRef]
- Benedict, M.A.; Mcmahon, E. Green infrastructure: Linking landscapes and communities. Nat. Areas J. 2006, 3, 282–283. [Google Scholar]
- Ward Thompson, C. Activity, exercise and the planning and design of outdoor spaces. J. Environ. Psychol. 2013, 34, 79–96. [Google Scholar] [CrossRef]
- Coutts, C. Green infrastructure and public health in the florida communities trust public land acquisition program. Plan. Pract. Res. 2010, 25, 439–459. [Google Scholar] [CrossRef]
- Goličnik Marušić, B. Social behaviour as a basis for design and development of green infrastructure. Urbani Izziv 2015, 26. [Google Scholar] [CrossRef]
- Roe, J.; Aspinall, P.A.; Ward Thompson, C. Understanding relationships between health, ethnicity, place and the role of urban green space in deprived urban communities. Int. J. Environ. Res. Public Health 2016, 13, 681. [Google Scholar] [CrossRef] [PubMed]
- Fábos, J.G.; Ryan, R.L.; Fabos, J.G.; Ryan, R.L. An introduction to greenway planning around the world. Landsc. Urban Plan. 2006, 76, 1–6. [Google Scholar] [CrossRef]
- Little, C.E. Greenways for America; The Johns Hopkins University Press: Baltimore, MD, USA, 1990. [Google Scholar]
- Akpinar, A. Factors influencing the use of urban greenways: A case study of Aydın, Turkey. Urban For. Urban Green. 2016, 16, 123–131. [Google Scholar] [CrossRef]
- Kurdoğlu, B.Ç.; Kurt, S.S. Determination of greenway routes using network analysis in Amasya, Turkey. J. Urban Plan. Dev. 2016, 143, 05016013. [Google Scholar] [CrossRef]
- Liu, K.; Siu, K.W.M.; Gong, X.Y.; Gao, Y.; Lu, D. Where do networks really work? The effects of the Shenzhen greenway network on supporting physical activities. Landsc. Urban Plan. 2016, 152, 49–58. [Google Scholar] [CrossRef]
- Shui, X.; Li, J. Evaluation and optimization of urban greenway network planning based on the landscape ecological index—A case study of Chao Zhou City. J. Green Sci. Technol. 2016, 14, 214–219. [Google Scholar]
- Xu, R.; Jiang, L.; Chen, S.; Zeng, X. Ecological benefits assessment of greenway based on CITYgreen model-A case study of Zengcheng city. Guangdong Agric. Sci. 2013, 40, 173–176. [Google Scholar]
- Price, A.E.; Reed, J.A.; Muthukrishnan, S. Trail user demographics, physical activity behaviors, and perceptions of a newly constructed greenway trail. J. Community Health 2012, 37, 949–956. [Google Scholar] [CrossRef] [PubMed]
- Gobster, P.H. Perception and use of a metropolitan greenway system for recreation. Landsc. Urban Plan. 1995, 33, 401–413. [Google Scholar] [CrossRef]
- Lindsey, G. Use of urban greenways-insights from Indianapolis. Landsc. Urban Plan. 1999, 45, 145–157. [Google Scholar] [CrossRef]
- Wolff-Hughes, D.L.; Fitzhugh, E.C.; Bassett, D.R.; Cherry, C.R. Greenway siting and design: Relationships with physical activity behaviors and user characteristics. J. Phys. Act. Health 2014, 11, 1105–1110. [Google Scholar] [CrossRef] [PubMed]
- Coutts, C. Multiple case studies of the influence of land-use type on the distribution of uses along urban river greenways. J. Urban Plan. Dev. 2009. [Google Scholar] [CrossRef]
- Jang, M.; Kang, C.-D. Urban greenway and compact land use development: A multilevel assessment in Seoul, South Korea. Landsc. Urban Plan. 2015, 143, 160–172. [Google Scholar] [CrossRef]
- Lindsey, G.; Nguyen, D.B.L. Use of greenway trails in Indiana. J. Urban Plan. Dev. 2004, 130, 213–217. [Google Scholar] [CrossRef]
- Wu, J. Post Occupancy Evaluation (POE) on the Zengcheng greenway system in Guangdong province. Chin. Landsc. Architect. 2011, 4, 39–43. [Google Scholar]
- Wolff-Hughes, D.L.; Fitzhugh, E.C. The relationships between weather-related factors and daily outdoor physical activity counts on an urban greenway. Int. J. Environ. Res. Public Health 2011, 8, 579–589. [Google Scholar] [CrossRef] [PubMed]
- Deenihan, G.; Caulfield, B.; O’Dwyer, D. Measuring the success of the great western greenway in Ireland. Tour. Manag. Perspect. 2013, 7, 73–82. [Google Scholar] [CrossRef]
- Monda, K.L.; Penny, G.L.; June, S.; Popkin, B.M. China’s transition: The effect of rapid urbanization on adult occupational physical activity. Soc. Sci. Med. 2007, 64, 858–870. [Google Scholar] [CrossRef] [PubMed]
- Ma, B.C.; Sang, Q.; Gou, J.F. Shading effect on outdoor thermal comfort in high-density city a case based study of Beijing. Adv. Mater. Res. 2014, 1065–1069, 2927–2930. [Google Scholar] [CrossRef]
- Shenzhen Bureau of Statistics. Main Data Bulletin of 2015 Shenzhen 1% Population Sampling Survey. Available online: http://www.stats.gov.cn/tjsj/zxfb/201604/t20160420_1346151.html (accessed on 9 March 2017).
- Zhang, W.; Huang, B. Land use optimization for a rapidly urbanizing city with regard to local climate change: Shenzhen as a case study. J. Urban Plan. Dev. 2015, 141, 05014007. [Google Scholar] [CrossRef]
- Zhang, E.; Zhao, X.; Zhang, J. Climate change in Shenzhen during 1953–2004. Acta Sci. Nat. Univ. Pekin. 2007, 43, 535–541. [Google Scholar]
- Chen, Y.; Liu, T.; Liu, W. Increasing the use of large-scale public open spaces: A case study of the north central axis square in Shenzhen, China. Habitat Int. 2016, 53, 66–77. [Google Scholar] [CrossRef]
- Liu, K.; Siu, K.W.; Gong, Y.X.; Gao, Y.; Lu, D. Data on the distribution of physical activities in the Shenzhen greenway network with volunteered geographic information. Data Brief 2016, 8, 14–20. [Google Scholar] [CrossRef] [PubMed]
- Luohu District Urban Administration. Evaluation of Social Benefit of Wutong Greenway; Non-Public Publication: Shenzhen, China, 2017.
- Jamieson, S. Likert Scale: How to (ab) use them. Med. Edu. 2005, 38, 1217–1218. [Google Scholar] [CrossRef] [PubMed]
- Likert, R. A technique for the measturement of attittudes. Arch. Psychol. 1932, 140, 5–55. [Google Scholar]
- Koohsari, M.J.; Kaczynski, A.T.; Giles-Corti, B.; Karakiewicz, J.A. Effects of access to public open spaces on walking: Is proximity enough? Landsc. Urban Plan. 2013, 117, 92–99. [Google Scholar] [CrossRef]
- Shenzhen Bureau of Statistics. Main Data Bulletin of 2010 Shenzhen Population Sampling Survey. Available online: http://www.sztj.gov.cn/xxgk/tjsj/pcgb/201606/t20160614_3697014.htm (accessed on 9 March 2017).
- Hoffman, S.D.; Duncan, G.J. Multinomial and Conditional Logit Discrete—Choice Models in Demography. Demography 1988, 25, 415. [Google Scholar] [CrossRef] [PubMed]
- Schipperijn, J.; Stigsdotter, U.K.; Randrup, T.B.; Troelsen, J. Influences on the use of urban green space–A case study in Odense, Denmark. Urban For. Urban Green. 2010, 9, 25–32. [Google Scholar] [CrossRef]
- Sanesi, G.; Chiarello, F. Residents and urban green spaces: The case of Bari. Urban For. Urban Green. 2006, 4, 125–134. [Google Scholar] [CrossRef]
- Jiang, B.; Chang, C.Y.; Sullivan, W.C. A dose of nature: Tree cover, stress reduction, and gender differences. Landsc. Urban Plan. 2014, 132, 26–36. [Google Scholar] [CrossRef]
- Wang, J.; Li, Q.-W.; Peng, L.Q. The Enlightenments on the construction of community greenway of guangdong—Based on the example of Furong grennway in Shenzhen. Chin. Landsc. Archit. 2014, 5, 97–101. [Google Scholar]
- Koohsari, M.J.; Mavoa, S.; Villanueva, K.; Sugiyama, T.; Badland, H.; Kaczynski, A.T.; Giles-Corti, B. Public open space, physical activity, urban design and public health: Concepts, methods and research agenda. Health Place 2015, 33, 75–82. [Google Scholar] [CrossRef] [PubMed]
- Lestan, K.; Eržen, I.; Golobič, M. The role of open space in urban neighbourhoods for health-related lifestyle. Int. J. Environ. Res. Public Health 2014, 11, 6547–6570. [Google Scholar] [CrossRef] [PubMed]
- Schipperijn, J.; Ekholm, O.; Stigsdotter, U.K.; Toftager, M.; Bentsen, P.; Kamper-Jørgensen, F.; Randrup, T.B. Factors influencing the use of green space: Results from a Danish national representative survey. Landsc. Urban Plan. 2010, 95, 130–137. [Google Scholar] [CrossRef]
- Yeh, A.G.O.; Yang, F.F.; Wang, J. Producer service linkages and city connectivity in the mega-city region of China: A case study of the pearl river delta. Urban Stud. 2016, 52, 2458–2482. [Google Scholar] [CrossRef]
- Song, H.; Pan, M.; Chen, Y. Nightlife and public spaces in urban villages: A case study of the Pearl River Delta in China. Habitat Int. 2016, 57, 187–204. [Google Scholar] [CrossRef]
- Giles-Corti, B.; Broomhall, M.H.; Knuiman, M.; Collins, C.; Douglas, K.; Ng, K.; Donovan, R.J. Increasing walking: How important is distance to, attractiveness, and size of public open space? Am. J. Prev. Med. 2005, 28, 169–176. [Google Scholar] [CrossRef] [PubMed]
- Xu, L.; You, H.; Li, D.; Yu, K. Urban green spaces, their spatial pattern, and ecosystem service value: The case of Beijing. Habitat Int. 2016, 56, 84–95. [Google Scholar] [CrossRef]
- Corburn, J. Urban place and health equity: Critical issues and practices. Int. J. Environ. Res. Public Health 2017, 14, 117. [Google Scholar] [CrossRef] [PubMed]
- Goličnik Marušić, B. Discrepancy between likely and actual occupancies of urban outdoor places. Urban For. Urban Green. 2016, 18, 151–162. [Google Scholar] [CrossRef]


| Items | Choices | Results |
|---|---|---|
| Gender | Male | 53.8% |
| Age | <15 | 3.7% |
| 15–34 | 49.1% | |
| 35–50 | 34.3% | |
| >50 | 12.9% | |
| Marital status | Married | 70.2% |
| Educational level | Junior middle school or less | 19.6% |
| High school | 37.2% | |
| College | 36.1% | |
| Postgraduate | 7.1% | |
| Job status | Employed | 63.0% |
| Self-employed | 22.6% | |
| Unemployed | 2.7% | |
| Retired | 11.3% | |
| Student | 0.4% | |
| Income level (yuan/per month) | <2000 | 3.4% |
| 2000–5000 | 26.0% | |
| 5000–8000 | 34.3% | |
| >8000 | 36.3% | |
| Accommodation type | Rent | 34.8% |
| Dormitory | 15.3% | |
| Own housing | 50.0% | |
| Length of stay at present residence | <1 year | 11.8% |
| 1–2 years | 37.8% | |
| >2 years | 50.3% | |
| Vehicle ownership | Yes | 45.1% |
| Have a child under 6 | Yes | 20.4% |
| Pet ownership | Yes | 27.6% |
| Items | Choices | Results |
|---|---|---|
| Distance between home and the greenway | <500 m | 29.3% |
| 500 m–1000 m | 12.2% | |
| 1000 m–3000 m | 17.5% | |
| 3000 m–5000 m | 22.5% | |
| >5000 m | 18.5% | |
| Mode of transportation to the greenway | Walk | 60.6% |
| Bicycle | 19.6% | |
| Public traffic | 8.5% | |
| Car | 11.3% | |
| Frequency of greenway use | Daily | 32.9% |
| Several times a week | 31.9% | |
| Weekly | 28.3% | |
| Monthly | 5.5% | |
| Seldom | 1.4% | |
| Duration of greenway use | <15 min | 1.5% |
| 15–30 min | 15.9% | |
| 30–60 min | 35.1% | |
| 60–120 min | 24.3% | |
| >120 min | 23.2% |
| Items | Choices | Results |
|---|---|---|
| Activities | Jogging | 39.3% |
| Cycling | 19.1% | |
| Brisk walking | 25.2% | |
| Slow walking | 16.2% | |
| Other | 0.2% | |
| Companion | Single | 36.7% |
| Lover | 19.8% | |
| Family | 29.0% | |
| Friends | 12.9% | |
| Pet | 1.6% | |
| Reason for visit (multiple choice) | Engage in sports | 66.0% |
| Enjoy fresh air | 42.7% | |
| Reduce stress | 18.5% | |
| Lose weight | 18.1% | |
| Passing by | 5.3% | |
| Social | 4.0% | |
| Family gathering | 2.5% | |
| Other | 0.5% | |
| Satisfaction level of greenway use | Extremely satisfied | 43.6% |
| Moderately satisfied | 44.8% | |
| Neutral | 11.4% | |
| Unsatisfied | 0.1% | |
| Extremely unsatisfied | 0.1% | |
| Perceived influencing factors for greenway use * | Distance from home | 2.110 |
| Accessibility | 2.474 | |
| Scenic view | 2.594 | |
| Terrain | 2.785 | |
| Lighting | 2.949 | |
| Restroom facilities | 2.880 | |
| Maintenance | 3.008 | |
| Trail width | 3.338 | |
| Safety | 3.326 | |
| Informative signs | 3.277 | |
| Parking lot | 3.354 |
| Individual Factors | Categories | Frequency of Greenway Use | Duration of Greenway Use | ||||||
|---|---|---|---|---|---|---|---|---|---|
| OR | Sig. | Chi-Square (χ2) | p-Value | OR | Sig. | Chi-Square (χ2) | p-Value | ||
| Gender | Male | 1.351 | 0.053 | 0.590 | 0.001 | ||||
| Female | 1 | - | 3.741 | 0.053 | 1 | - | 11.503 | 0.000 | |
| Age | 15–34 | 0.366 | 0.002 | 0.816 | 0.462 | ||||
| 35–50 | 0.477 | 0.009 | 0.545 | 0.011 | |||||
| >50 | 1 | - | 1.909 | 0.012 | 1 | - | 1.088 | 0.018 | |
| Married | Yes (No = 1) | 1.342 | 0.203 | 1.624 | 0.203 | 1.897 | 0.005 | 8.089 | 0.004 |
| Education level | Junior or less | 1 | - | 16.93 | 0.001 | 4.849 | 0.001 | ||
| High school | 0.442 | 0.001 | 8.043 | 0.000 | |||||
| College | 0.492 | 0.014 | 2.856 | 0.003 | |||||
| Postgraduates | 0.874 | 0.750 | 1 | - | 47.868 | 0.000 | |||
| Job status | Employed | 1 | - | 6.826 | 0.145 | 1 | - | 3.709 | 0.000 |
| Student | 1.573 | 0.728 | 0.698 | 0.783 | |||||
| Self-employed | 0.748 | 0.109 | 1.590 | 0.013 | |||||
| Unemployed | 3.124 | 0.109 | 2.977 | 0.000 | |||||
| Retired | 1.249 | 0.565 | 3.003 | 0.001 | |||||
| Income level (yuan/per month) | <2000 | 9.440 | 0.000 | 15.676 | 0.000 | ||||
| 2000–5000 | 4.175 | 0.000 | 2.476 | 0.001 | |||||
| 5000–8000 | 1.309 | 0.157 | 5.292 | 0.000 | |||||
| >8000 | 1 | 47.819 | 0.000 | 1 | - | 92.150 | 0.000 | ||
| Accommodation type | Rent | 0.496 | 0.007 | 2.056 | 0.007 | ||||
| Dorm | 0.779 | 0.431 | 2.676 | 0.002 | |||||
| Own housing | 1 | - | 9.634 | 0.008 | 1 | - | 1.142 | 0.006 | |
| Length of stay at present residence | <1 year | 2.065 | 0.014 | 1 | - | 16.938 | 0.000 | ||
| 1–2 years | 1.127 | 0.557 | 2.182 | 0.004 | |||||
| >2 years | 1 | - | 7.156 | 0.028 | 3.481 | 0.000 | |||
| Have a car | No (yes = 1) | 0.717 | 0.119 | 2.414 | 0.12 | 0.902 | 0.664 | 0.189 | 0.664 |
| Have child under 6 | Yes (No = 1) | 0.758 | 0.164 | 1.929 | 0.165 | 0.747 | 0.127 | 2.331 | 0.127 |
| Have a pet | Yes (No = 1) | 0.772 | 0.159 | 1.985 | 0.159 | 1.556 | 0.014 | 6.095 | 0.014 |
| Distance from home | <500 m | 1.901 | 0.000 | 0.294 | 0.000 | ||||
| 500–1000 m | 1.811 | 0.007 | 0.634 | 0.099 | |||||
| 1000–3000 m | 1.606 | 0.015 | 0.115 | 0.000 | |||||
| 3000–5000 m | 1.275 | 0.179 | 0.437 | 0.001 | |||||
| >5000 m | 1 | - | 16.641 | 0.002 | 1 | - | 77.812 | 0.000 | |
| Activities | Jogging | 1.452 | 0.142 | 0.419 | 0.000 | ||||
| Cycling | 1.191 | 0.511 | 0.364 | 0.000 | |||||
| Brisk walking | 0.836 | 0.489 | 0.31 | 0.000 | |||||
| Slow walking | 1 | - | 7.994 | 0.152 | 1 | - | 25.157 | 0.000 | |
| Companion | Single | 0.685 | 0.112 | 0.248 | 0.000 | ||||
| Lover | 1.027 | 0.925 | 0.202 | 0.000 | |||||
| Family | 1.104 | 0.691 | 1.270 | 0.328 | |||||
| Friends | 1 | 7.812 | 0.051 | 1 | - | 108.77 | 0.000 | ||
| How to arrive | Walk | 3.185 | 0.000 | 1 | - | ||||
| Bicycle | 1.481 | 0.105 | 0.996 | 0.983 | |||||
| public traffic | 0.523 | 0.026 | 3.017 | 0.000 | |||||
| Car | 1 | - | 81.864 | 0.000 | 2.488 | 0.001 | 26.153 | 0.000 | |
© 2017 by the authors. Licensee MDPI, Basel, Switzerland. This article is an open access article distributed under the terms and conditions of the Creative Commons Attribution (CC BY) license (http://creativecommons.org/licenses/by/4.0/).
Share and Cite
Chen, Y.; Gu, W.; Liu, T.; Yuan, L.; Zeng, M. Increasing the Use of Urban Greenways in Developing Countries: A Case Study on Wutong Greenway in Shenzhen, China. Int. J. Environ. Res. Public Health 2017, 14, 554. https://doi.org/10.3390/ijerph14060554
Chen Y, Gu W, Liu T, Yuan L, Zeng M. Increasing the Use of Urban Greenways in Developing Countries: A Case Study on Wutong Greenway in Shenzhen, China. International Journal of Environmental Research and Public Health. 2017; 14(6):554. https://doi.org/10.3390/ijerph14060554
Chicago/Turabian StyleChen, Yiyong, Weiying Gu, Tao Liu, Lei Yuan, and Mali Zeng. 2017. "Increasing the Use of Urban Greenways in Developing Countries: A Case Study on Wutong Greenway in Shenzhen, China" International Journal of Environmental Research and Public Health 14, no. 6: 554. https://doi.org/10.3390/ijerph14060554