Associations of PM2.5 and Black Carbon with Hospital Emergency Room Visits during Heavy Haze Events: A Case Study in Beijing, China


Abstract
:1. Introduction
2. Materials and Methods
2.1. Health Data
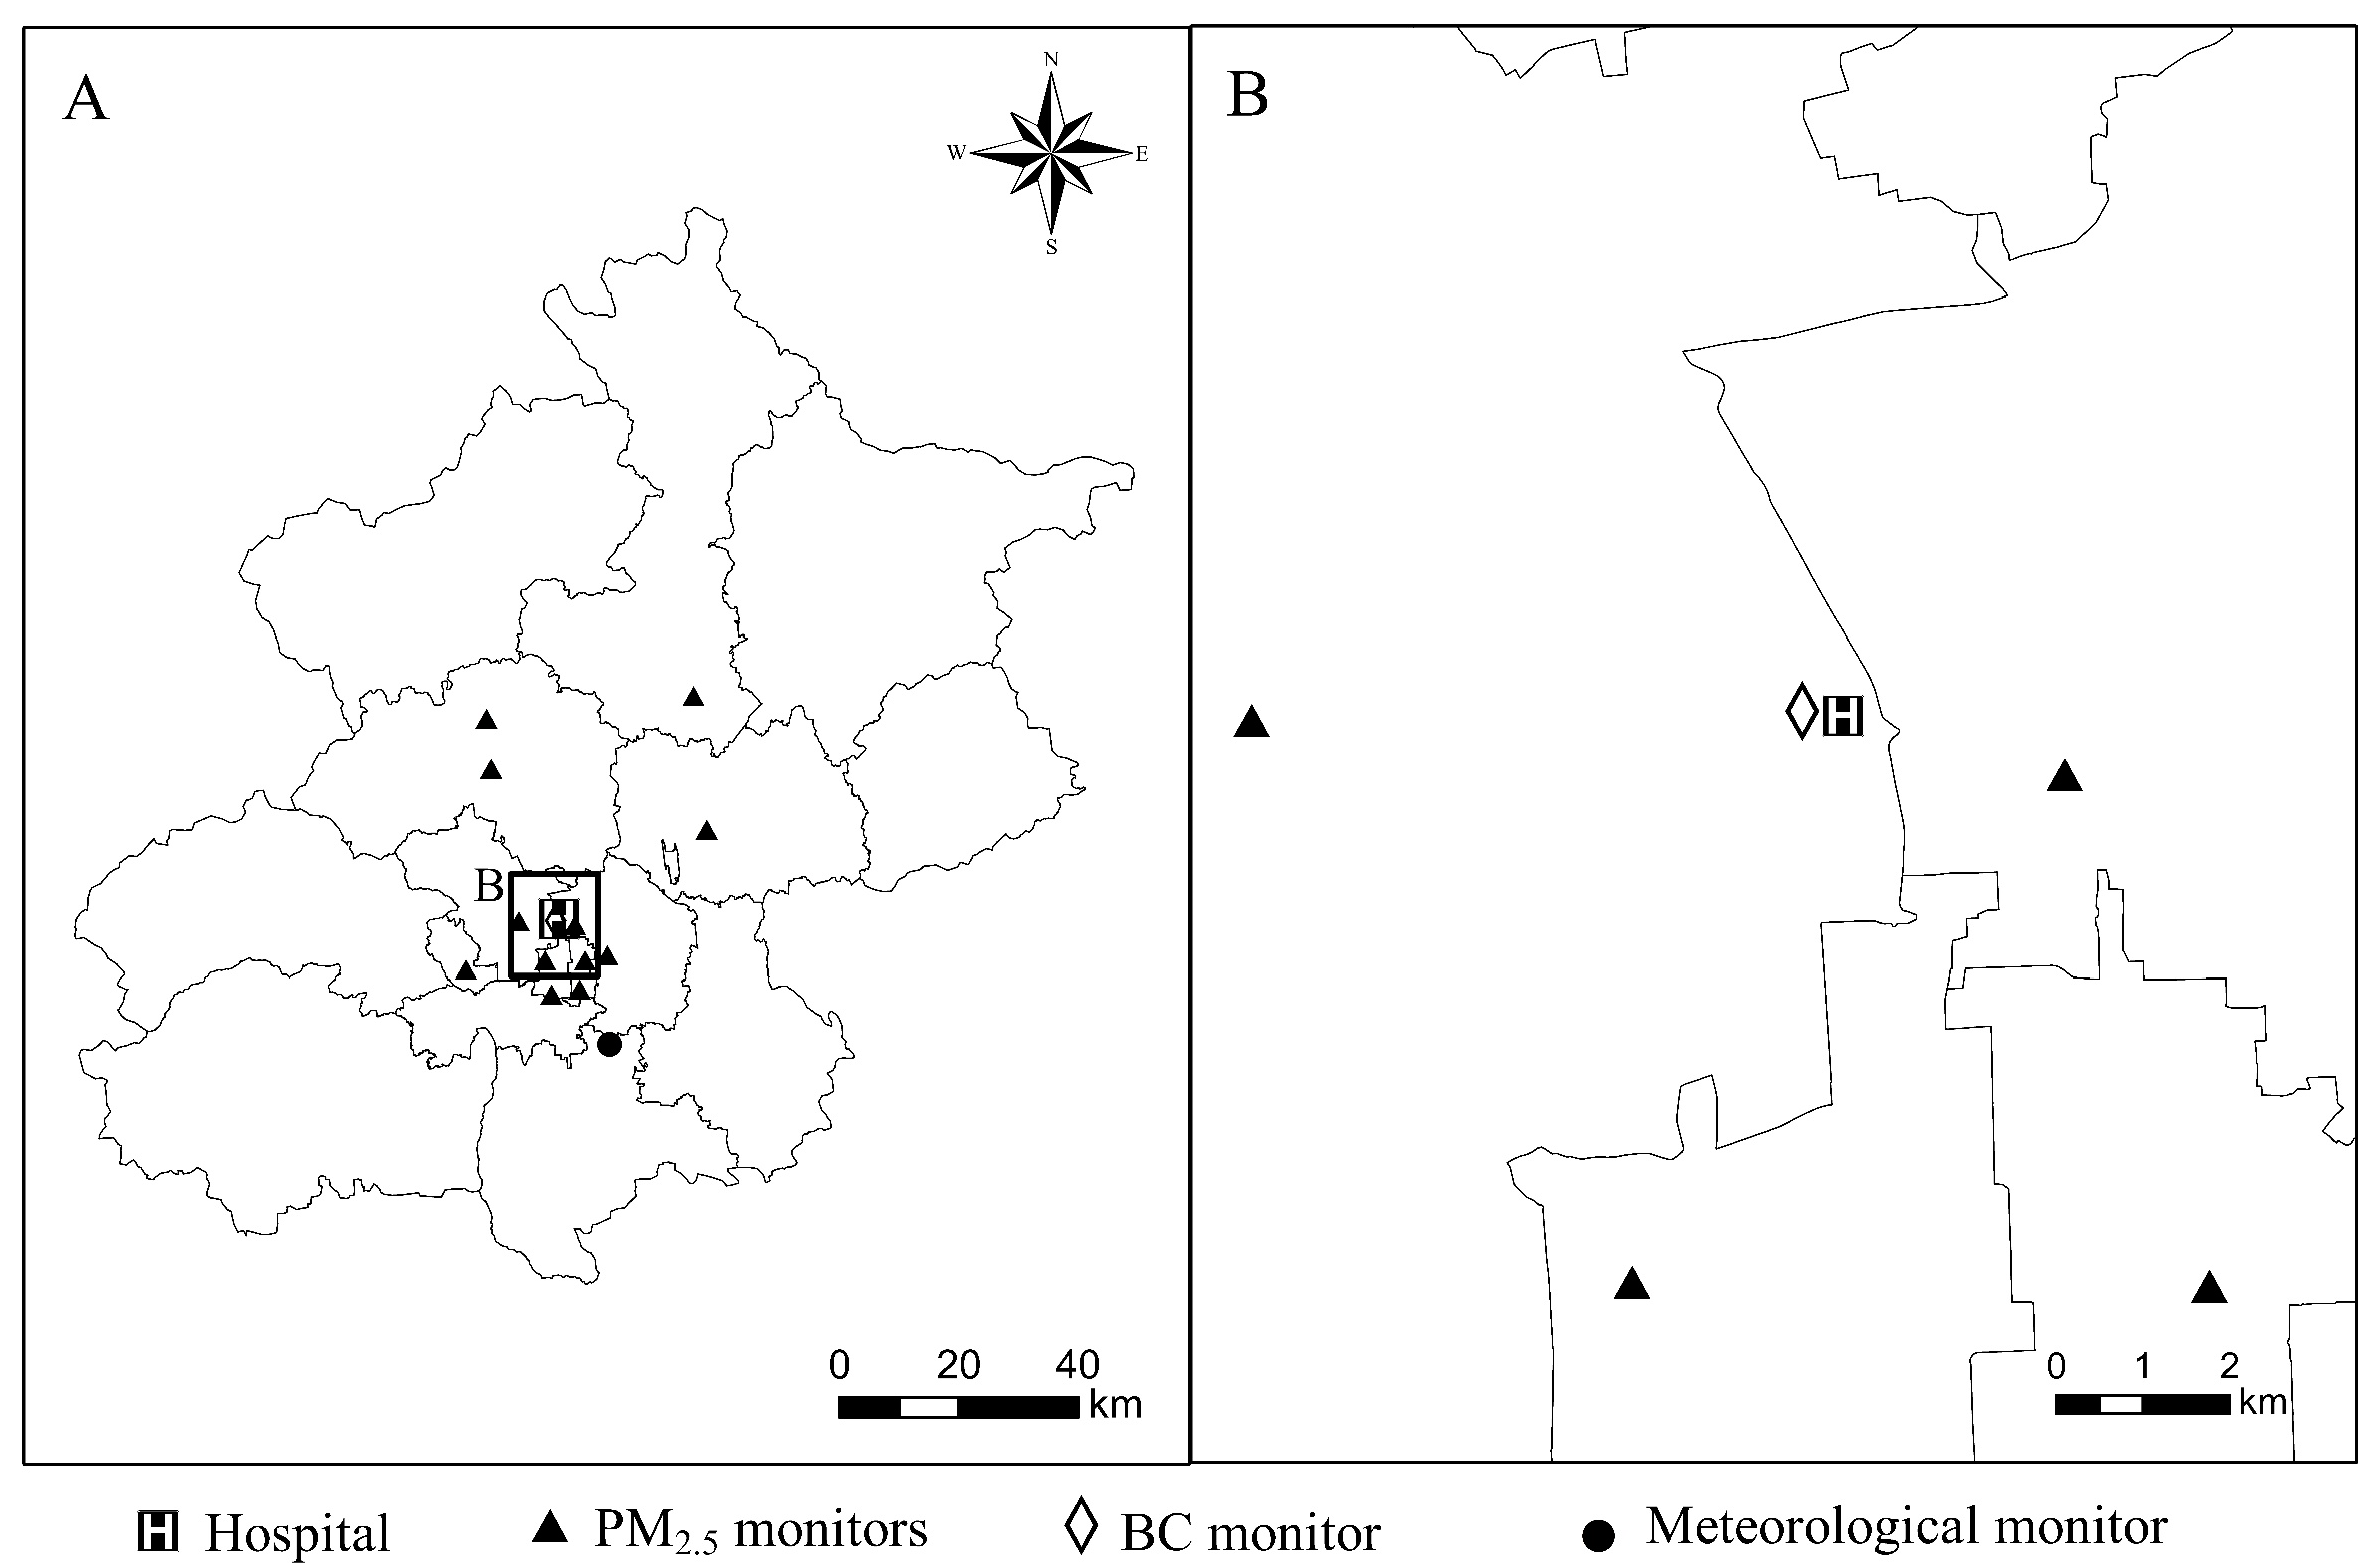
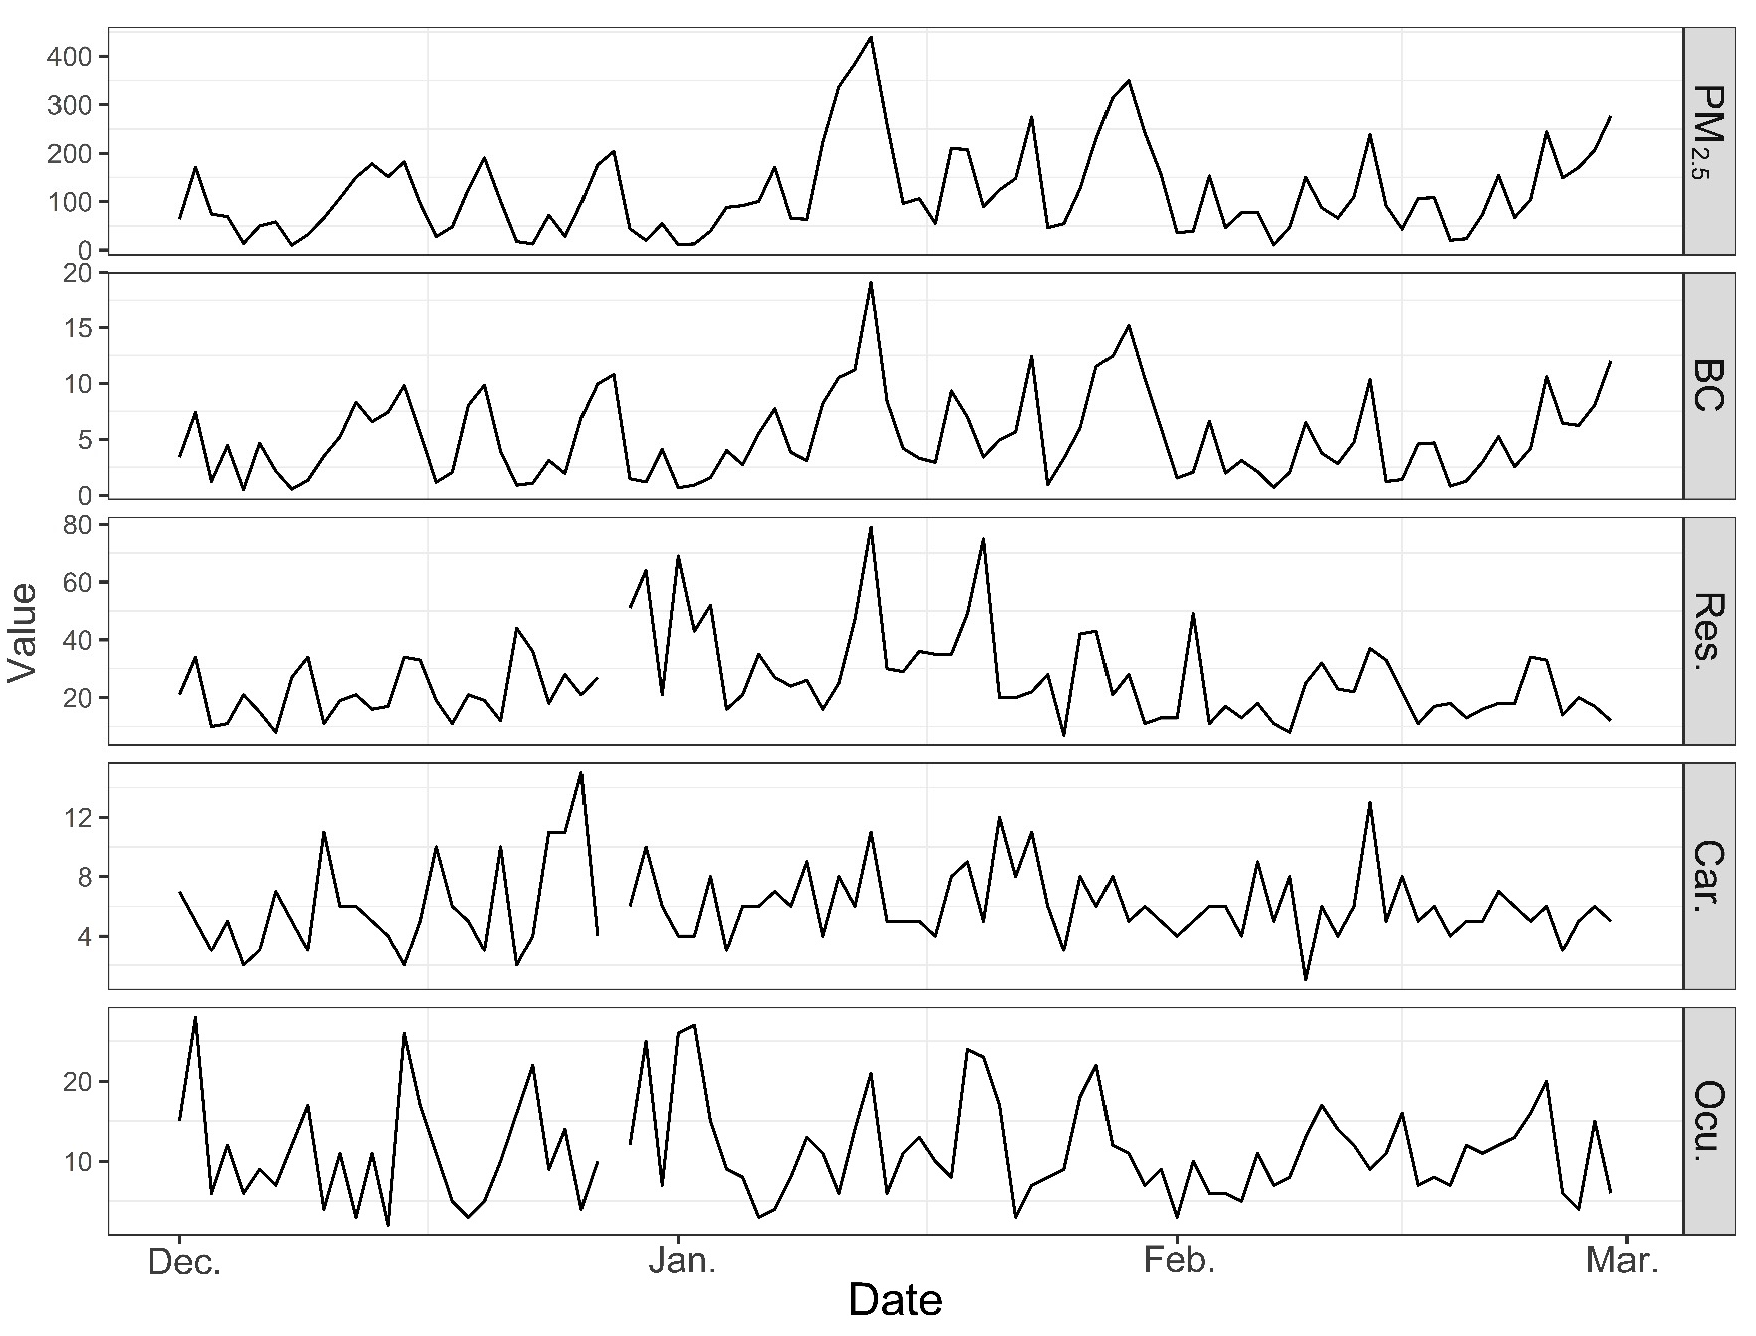
2.2. Exposure Data
2.3. Statistical Analysis
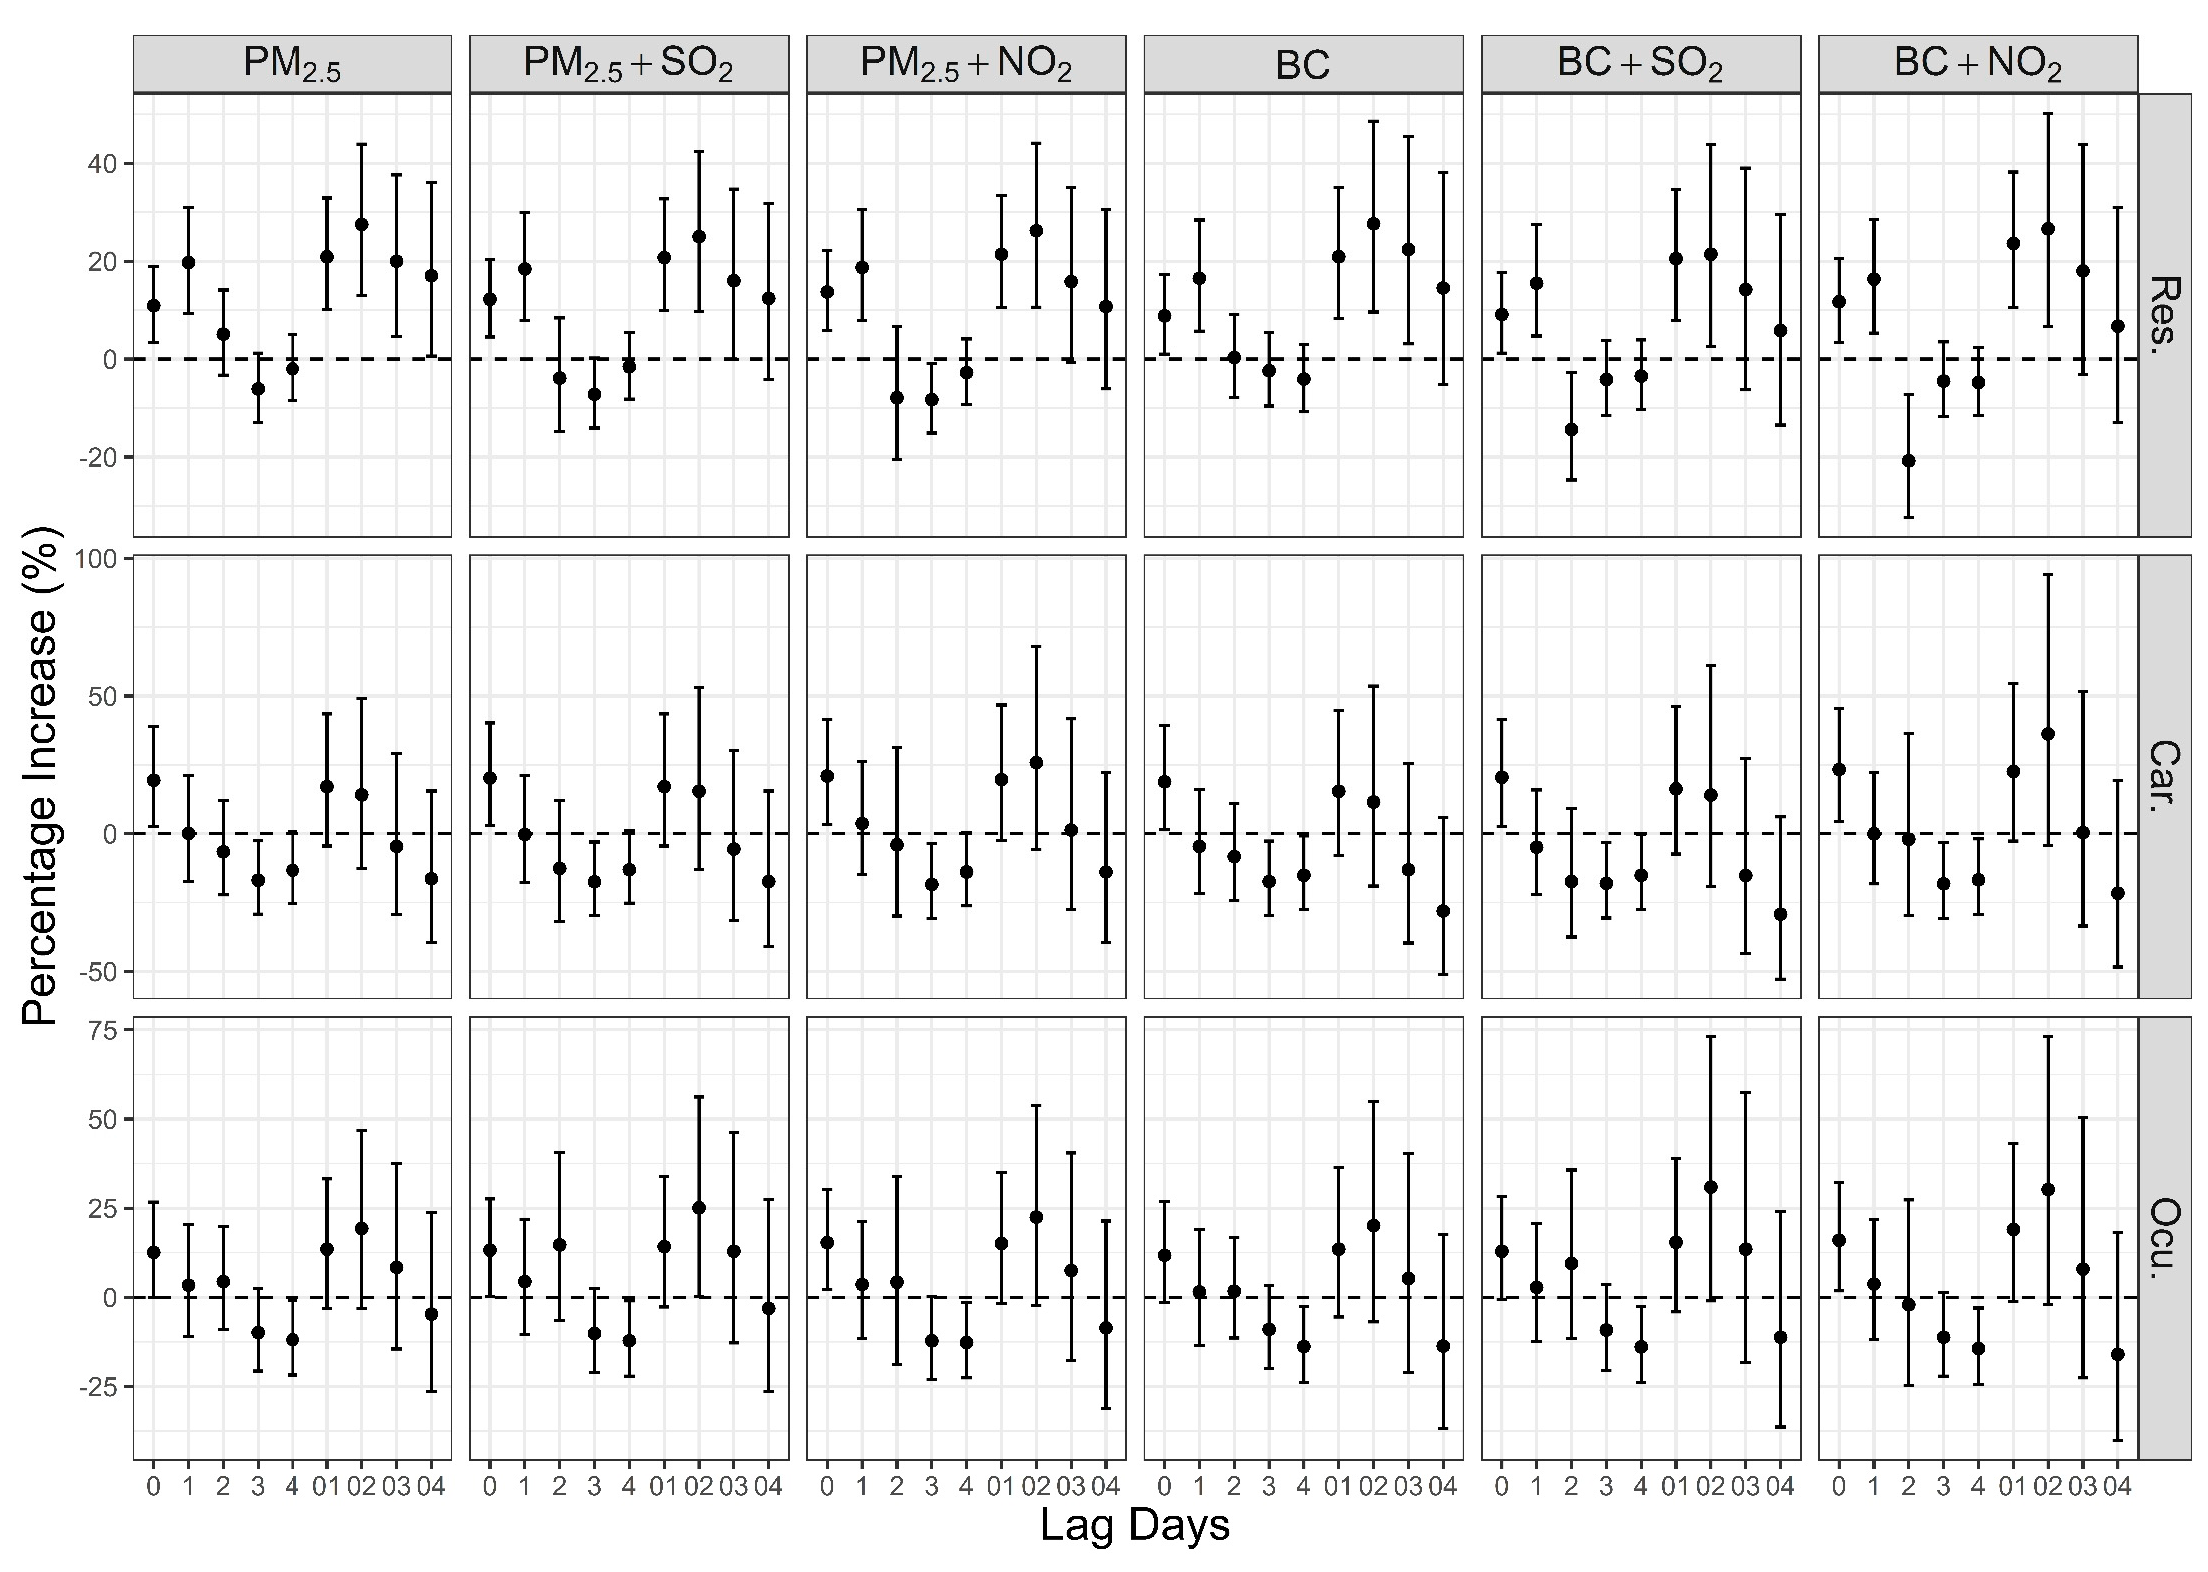
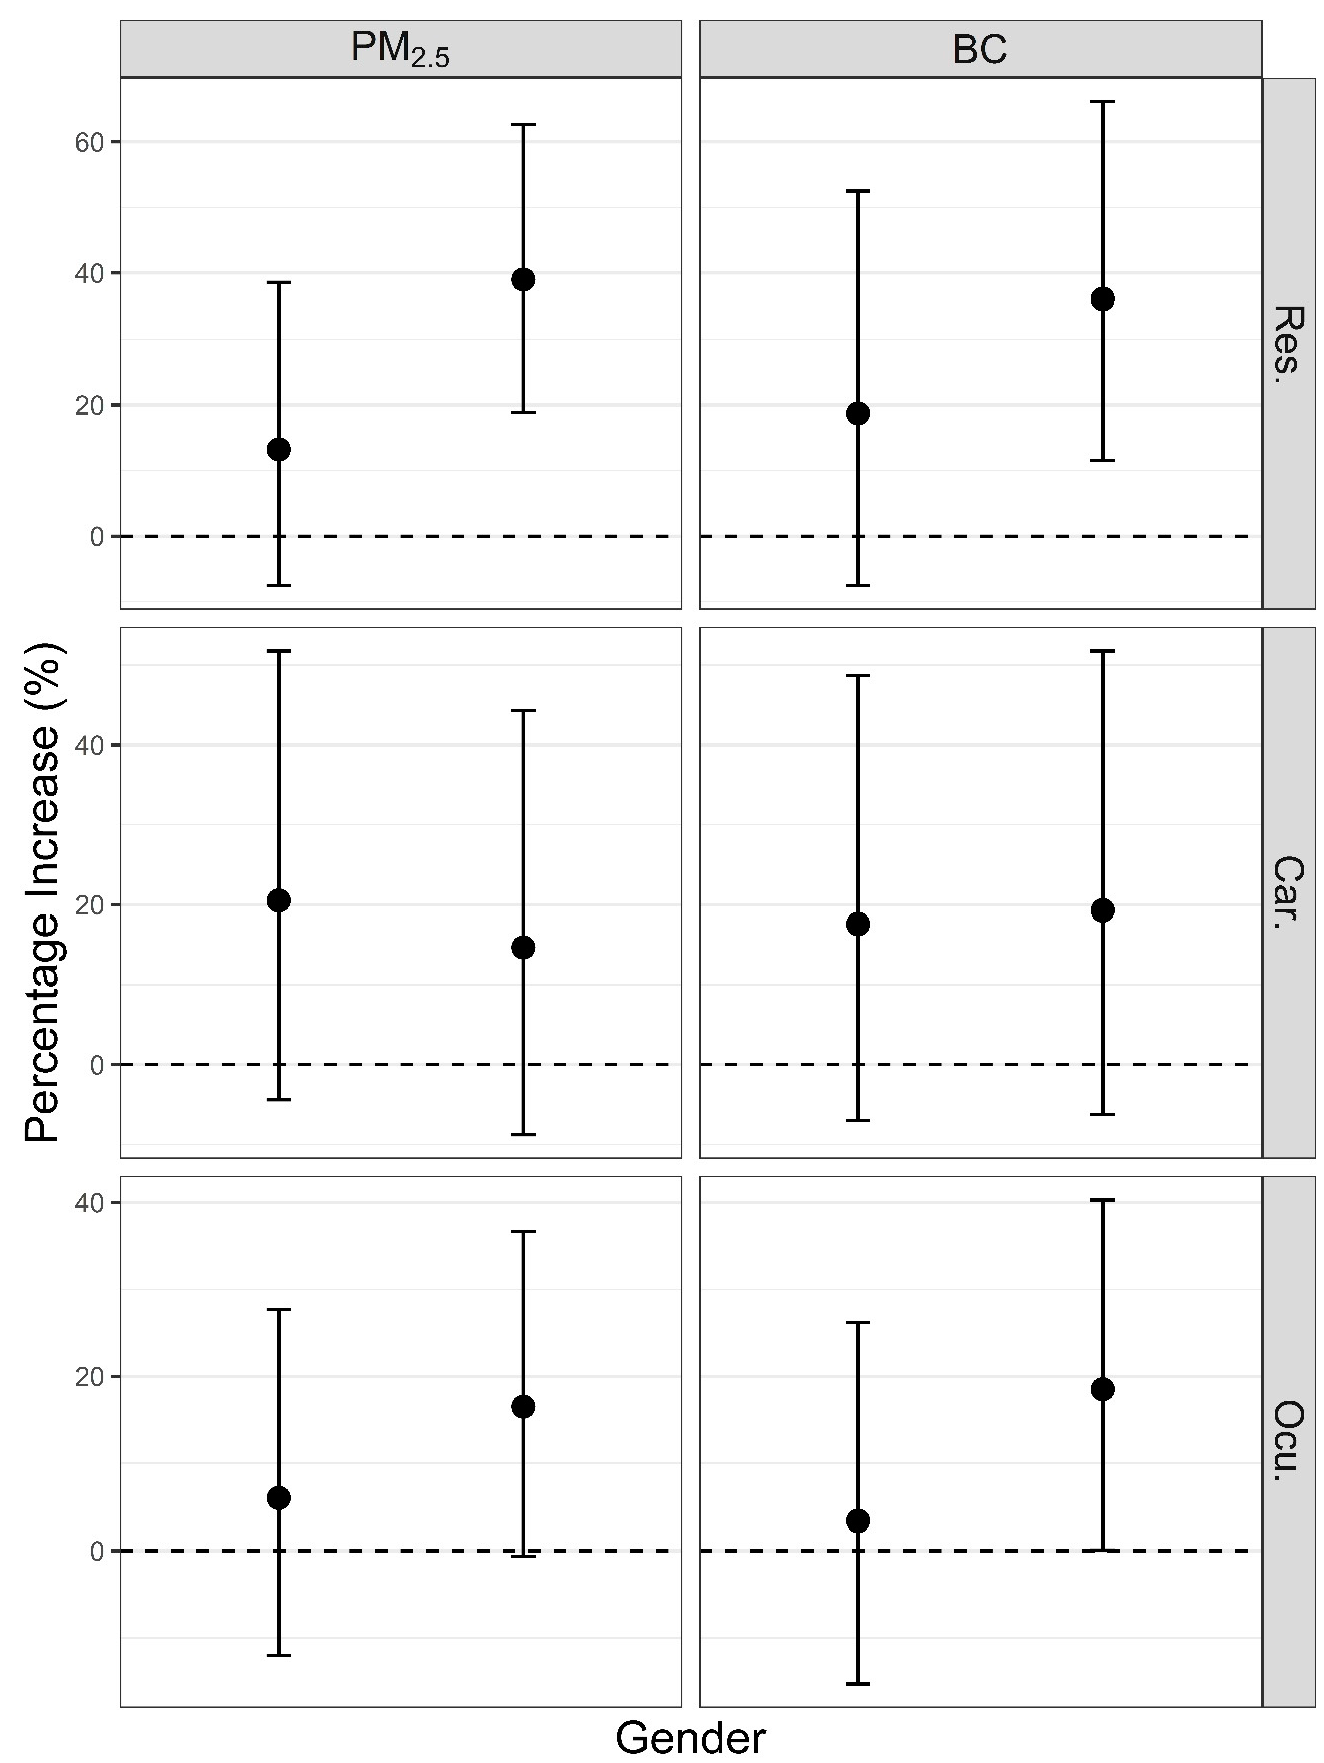
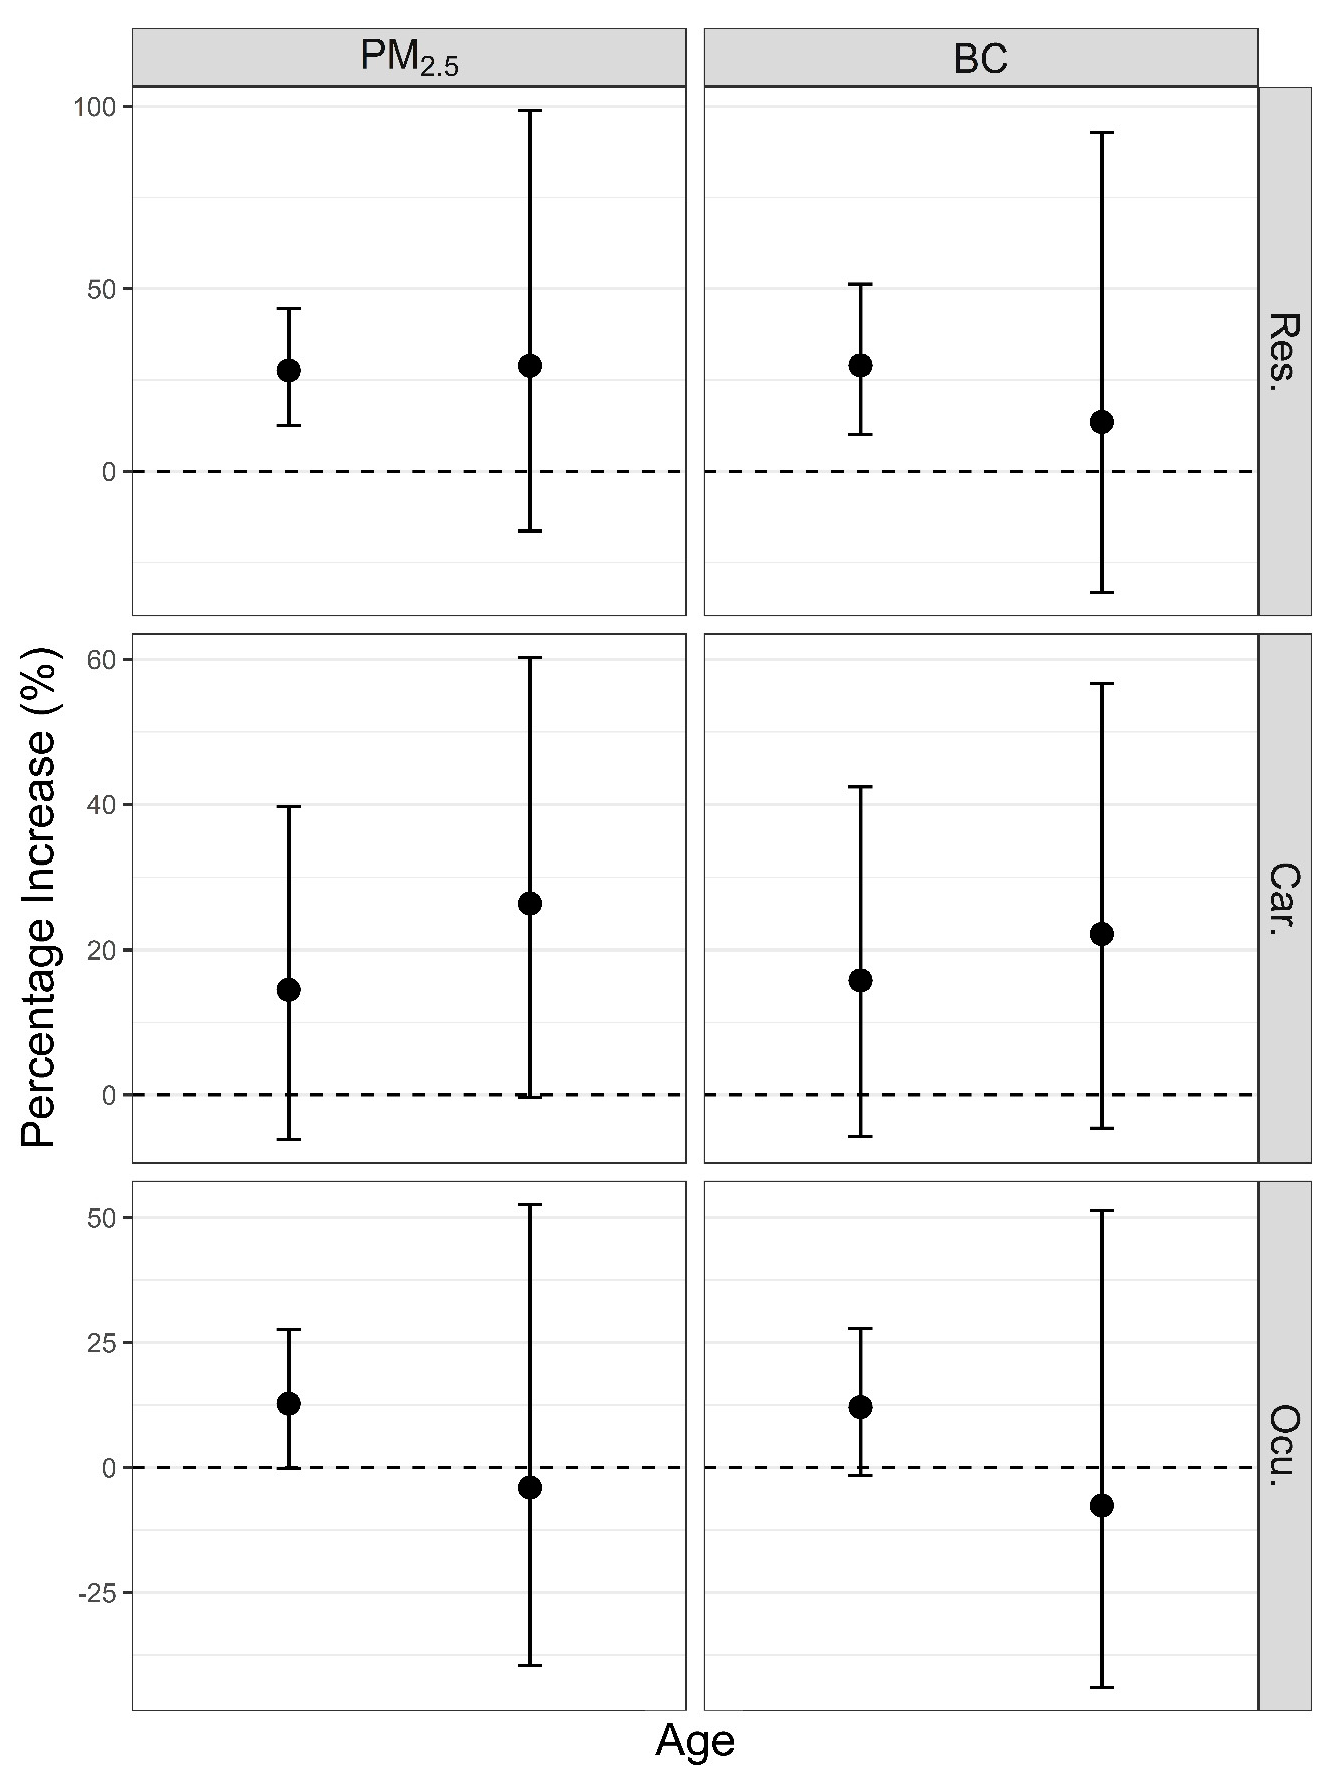
3. Results
4. Discussion
5. Conclusions
Supplementary Materials
Acknowledgments
Author Contributions
Conflicts of Interest
References
- Levy Zamora, M.E. Wintertime haze formation in Beijing. In Proceedings of the AGU Fall Meeting Abstracts, AGU Fall Meeting, San Francisco, CA, USA, 14–18 December 2015. [Google Scholar]
- Zhang, X.Y.; Wang, J.Z.; Wang, Y.Q.; Liu, H.L.; Sun, J.Y.; Zhang, Y.M. Changes in chemical components of aerosol particles in different haze regions in China from 2006 to 2013 and contribution of meteorological factors. Atmos. Chem. Phys. 2015, 15, 12935–12952. [Google Scholar] [CrossRef]
- Tan, J.; Duan, J.; He, K.; Ma, Y.; Duan, F.; Chen, Y.; Fu, J. Chemical characteristics of PM2.5 during a typical haze episode in Guangzhou. J. Environ. Sci. 2009, 21, 774–781. [Google Scholar] [CrossRef]
- Li, T.T.; Du, Y.J.; Mo, Y.; Xue, W.B.; Xu, D.Q.; Wang, J.N. Assessment of haze-related human health risks for four Chinese cities during extreme haze in January 2013. Zhonghua Yi Xue Za Zhi 2013, 93, 2699–2702. [Google Scholar] [PubMed]
- Xie, Y.B.; Chen, J.; Li, W. An assessment of PM2.5 related health risks and impaired values of Beijing residents in a consecutive high-level exposure during heavy haze days. Huan Jing Ke Xue 2014, 35, 1–8. [Google Scholar] [PubMed]
- Su, C.; Breitner, S.; Schneider, A.; Liu, L.Q.; Franck, U.; Peters, A.; Pan, X.C. Short-term effects of fine particulate air pollution on cardiovascular hospital emergency room visits: A time-series study in Beijing, China. Int. Arch. Occup. Environ. Health 2016, 9, 641–657. [Google Scholar] [CrossRef] [PubMed]
- Li, M.H.; Fan, L.C.; Mao, B.; Yang, J.W.; Choi, A.M.K.; Cao, W.J.; Xu, J.F. Short-term exposure to ambient fine particulate matter increases hospitalizations and mortality in COPD: A systematic review and meta-analysis. Chest 2016, 149, 447–458. [Google Scholar] [CrossRef] [PubMed]
- Kannell, W.B. The effect of air pollution on lung development from 10 to 18 years of age—NEJM. N. Engl. J. Med. 2004, 351, 1057–1067. [Google Scholar]
- Zhao, J.; Gao, Z.; Tian, Z.; Xie, Y.; Xin, F.; Jiang, R.; Kan, H.; Song, W. The biological effects of individual-level PM(2.5) exposure on systemic immunity and inflammatory response in traffic policemen. Occup. Environm. Med. 2013, 70, 426–431. [Google Scholar] [CrossRef] [PubMed]
- Brook, R.D.; Cakmak, S.; Turner, M.C.; Brook, J.R.; Crouse, D.L.; Peters, P.A.; Van, D.A.; Villeneuve, P.J.; Brion, O.; Jerrett, M. Long-term fine particulate matter exposure and mortality from diabetes in Canada. Diabetes Care 2013, 36, 3313–3320. [Google Scholar] [CrossRef] [PubMed]
- Wilhelm, M.; Ritz, B. Local variations in co and particulate air pollution and adverse birth outcomes in Los Angeles County, California, USA. Environ. Health Perspect. 2005, 113, 1212–1221. [Google Scholar] [CrossRef] [PubMed]
- Saxena, R.; Srivastava, S.; Trivedi, D.; Anand, E.; Joshi, S.; Gupta, S.K. Impact of environmental pollution on the eye. Acta Ophthalmol. Scan. 2003, 81, 491–494. [Google Scholar] [CrossRef]
- Szyszkowicz, M.; Shutt, R.; Kousha, T.; Rowe, B.H. Air pollution and emergency department visits for epistaxis. Clin. Otolaryngol. 2014, 39, 345–351. [Google Scholar] [CrossRef] [PubMed]
- Mimura, T.; Ichinose, T.; Yamagami, S.; Fujishima, H.; Kamei, Y.; Goto, M.; Takada, S.; Matsubara, M. Airborne particulate matter (PM2.5) and the prevalence of allergic conjunctivitis in Japan. Sci. Total Environ. 2014, 487, 493–499. [Google Scholar] [CrossRef] [PubMed]
- Torricelli, A.A.; Novaes, P.; Matsuda, M.; Braga, A.; Saldiva, P.H.; Alves, M.R.; Monteiro, M.L. Correlation between signs and symptoms of ocular surface dysfunction and tear osmolarity with ambient levels of air pollution in a large metropolitan area. Cornea 2013, 32, e11–e15. [Google Scholar] [CrossRef] [PubMed]
- Zhang, Y.S.; Ma, G.X.; Yu, F.; Cao, D. Health damage assessment due to PM2.5 exposure during haze pollution events in Beijing-Tianjin-Hebei region in January 2013. Zhonghua Yi Xue Za Zhi 2013, 93, 2707–2710. [Google Scholar] [PubMed]
- Gao, M.; Guttikunda, S.K.; Carmichael, G.R.; Wang, Y.S.; Liu, Z.R.; Stanier, C.O.; Saide, P.E.; Yu, M. Health impacts and economic losses assessment of the 2013 severe haze event in Beijing area. Sci. Total Environ. 2015, 511, 553–561. [Google Scholar] [CrossRef] [PubMed]
- Viidanoja, J.; Sillanpää, M.; Laakia, J.; Kerminen, V.M.; Hillamo, R.; Aarnio, P.; Koskentalo, T. Organic and black carbon in PM2.5 and PM10: 1 year of data from an urban site in Helsinki, Finland. Atmos. Environ. 2002, 36, 3183–3193. [Google Scholar] [CrossRef]
- Alexeeff, S.E.; Coull, B.A.; Gryparis, A.; Suh, H.; Sparrow, D.; Vokonas, P.S.; Schwartz, J. Medium-term exposure to traffic-related air pollution and markers of inflammation and endothelial function. Environ. Health Perspect. 2011, 119, 481–486. [Google Scholar] [CrossRef] [PubMed]
- Park, S.K.; O’Neill, M.S.; Vokonas, P.S.; Sparrow, D.; Rd, S.A.; Tucker, K.L.; Suh, H.; Hu, H.; Schwartz, J. Traffic-related particles are associated with elevated homocysteine: The VA normative aging study. Am. J. Respir. Crit. Care Med. 2008, 178, 283–289. [Google Scholar] [CrossRef] [PubMed]
- Schneider, A.; Hampel, R.; Ibald-Mulli, A.; Zareba, W.; Schmidt, G.; Schneider, R.; Rückerl, R.; Couderc, J.P.; Mykins, B.; Oberdörster, G. Changes in deceleration capacity of heart rate and heart rate variability induced by ambient air pollution in individuals with coronary artery disease. Part. Fibre Toxicol. 2010, 7, 29. [Google Scholar] [CrossRef] [PubMed]
- Zanobetti, A.; Schwartz, J. Air pollution and emergency admissions in Boston, MA. J. Epidemiol. Community Health 2006, 60, 890–895. [Google Scholar] [CrossRef] [PubMed]
- Louwies, T.; Nawrot, T.; Cox, B.; Dons, E.; Penders, J.; Provost, E.; Panis, L.I.; De Boever, P. Blood pressure changes in association with black carbon exposure in a panel of healthy adults are independent of retinal microcirculation. Environ. Int. 2015, 75, 81–86. [Google Scholar] [CrossRef] [PubMed]
- Gold, D.R.; Litonjua, A.A.; Zanobetti, A.; Coull, B.A.; Schwartz, J.; Maccallum, G.; Verrier, R.L.; Nearing, B.D.; Canner, M.J.; Suh, H. Air pollution and ST-segment depression in elderly subjects. Environ. Health Perspect. 2005, 113, 883–887. [Google Scholar] [CrossRef] [PubMed]
- Wang, X.; Chen, R.J.; Meng, X.; Geng, F.H.; Wang, C.C.; Kan, H.D. Associations between fine particle, coarse particle, black carbon and hospital visits in a Chinese city. Sci. Total Environ. 2013, 458–460, 1–6. [Google Scholar] [CrossRef] [PubMed]
- Janssen, N.A.H.; Hoek, G.; Simic-Lawson, M.; Fischer, P.; van Bree, L.; ten Brink, H.; Keuken, M.; Atkinson, R.W.; Anderson, H.R.; Brunekreef, B.; et al. Black carbon as an additional indicator of the adverse health effects of airborne particles compared with PM10 and PM2.5. Environ. Health Perspect. 2011, 119, 1691–1699. [Google Scholar] [CrossRef] [PubMed]
- World Health Organization (WHO). W.H.O. International Classification of Diseases (ICD-10); World Health Organization: Geneva, Switzerland, 2015; pp. 551–553. [Google Scholar]
- Bateson, T.F.; Schwartz, J. Control for seasonal variation and time trend in case-crossover studies of acute effects of environmental exposures. Epidemiology 1999, 10, 539–544. [Google Scholar] [CrossRef] [PubMed]
- Lee, J.T.; Schwartz, J. Reanalysis of the effects of air pollution on daily mortality in Seoul, Korea: A case-crossover design. Environ. Health Perspect. 1999, 107, 633–636. [Google Scholar] [CrossRef] [PubMed]
- Ma, W.J.; Chen, R.J.; Kan, H.D. Temperature-related mortality in 17 large Chinese cities: How heat and cold affect mortality in China. Environ. Res. 2014, 134, 127–133. [Google Scholar] [CrossRef] [PubMed]
- Guo, Y.M.; Barnett, A.G.; Pan, X.C.; Yu, W.W.; Tong, S.L. The impact of temperature on mortality in Tianjin, China: A case-crossover design with a distributed lag nonlinear model. Environ. Health Perspect. 2011, 119, 1719–1725. [Google Scholar] [CrossRef] [PubMed]
- Winquist, A.; Kirrane, E.; Klein, M.; Strickland, M.; Darrow, L.A.; Sarnat, S.E.; Gass, K.; Mulholland, J.; Russell, A.; Tolbert, P. Joint effects of ambient air pollutants on pediatric asthma emergency department visits in Atlanta, 1998–2004. Epidemiology 2014, 25, 666–673. [Google Scholar] [CrossRef] [PubMed]
- Sarnat, S.E.; Winquist, A.; Schauer, J.J.; Turner, J.R.; Sarnat, J.A. Fine particulate matter components and emergency department visits for cardiovascular and respiratory diseases in the St. Louis, Missouri-illinois, metropolitan area. Environ Health Perspect. 2015, 123, 437–444. [Google Scholar] [CrossRef] [PubMed]
- Krzyzanowski, M.; Kunadibbert, B.; Schneider, J.; Krzyzanowski, M.; Kunadibbert, B.; Schneider, J. Health effects of transport-related air pollution. Health Effects Transport-Relat. Air Pollut. 2005, 97, 418–419. [Google Scholar]
- Torricelli, A.A.M.; Matsuda, M.; Novaes, P.; Braga, A.L.F.; Saldiva, P.H.N.; Alves, M.R.; Monteiro, M.L.R. Effects of ambient levels of traffic-derived air pollution on the ocular surface: Analysis of symptoms, conjunctival goblet cell count and mucin 5AC gene expression. Environ. Res. 2014, 131, 59–63. [Google Scholar] [CrossRef] [PubMed]
- Szyszkowicz, M.; Kousha, T.; Castner, J. Air pollution and emergency department visits for conjunctivitis: A case-crossover study. Int. J. Occup. Med. Environ. Health 2016, 29, 381–393. [Google Scholar] [CrossRef] [PubMed]
- Chu, J.; Liu, L.; Li, S.; Shang, K. Analysis of haze pollution in the winter of 2012 in Shijiazhuang. In Proceedings of the Climatic and Environment Changes and Human Health (S15), Chinese Meteorological Society Meeting, Beijing, China, 23–25 October 2013. (In Chinese). [Google Scholar]
- Chen, S.Y.; Lin, Y.L.; Chang, W.T.; Lee, C.T.; Chan, C.C. Increasing emergency room visits for stroke by elevated levels of fine particulate constituents. Sci. Total Environ. 2014, 473–474, 446–450. [Google Scholar] [CrossRef] [PubMed]
- Xu, M.M.; Jia, Y.P.; Li, G.X.; Pan, X.C. Evaluation of personal integrated exposure to fine particle in a community in Beijing. J. Environ. Health 2011, 28, 941–943. [Google Scholar]


| Variable | Mean | SD | Min. | Percentile | Max. | ||
|---|---|---|---|---|---|---|---|
| 25% | 50% | 75% | |||||
| Tem. (°C) | −3.5 | 3.0 | −9.7 | −5.3 | −3.5 | −1.6 | 5.0 |
| RH (%) | 53.7 | 19.4 | 19.0 | 38.0 | 52.5 | 69.5 | 91.0 |
| PM2.5 (μg/m3) | 119.8 | 96.3 | 10.2 | 49.3 | 96.3 | 170.9 | 439.3 |
| BC (μg/m3) | 5.2 | 3.8 | 0.5 | 2.1 | 4.2 | 7.5 | 19.1 |
| SO2 (μg/m3) | 56.8 | 28.6 | 10.1 | 37.6 | 51.5 | 76.8 | 131.0 |
| NO2 (μg/m3) | 68.5 | 30.6 | 12.6 | 44.9 | 69.8 | 89.3 | 144.1 |
| Res. (counts) | 26.1 | 14.8 | 7 | 16 | 21 | 34 | 79 |
| Car. (counts) | 6.1 | 2.6 | 1 | 5 | 6 | 8 | 15 |
| Ocu. (counts) | 11.3 | 6.2 | 2 | 7 | 11 | 15 | 28 |
| Variable | Tem. (lag0–14) | RH (lag0–14) | PM2.5 (lag0) | BC (lag0) | SO2 (lag2) | NO2 (lag2) | Res. | Car. | Ocu. |
|---|---|---|---|---|---|---|---|---|---|
| Tem. (lag0–14) | 1.000 | ||||||||
| RH (lag0–14) | −0.046 | 1.000 | |||||||
| PM2.5 (lag0) | −0.119 | 0.137 | 1.000 | ||||||
| BC (lag0) | −0.118 | 0.110 | 0.920 ** | 1.000 | |||||
| SO2 (lag2) | −0.145 | 0.155 | 0.186 | 0.179 | 1.000 | ||||
| NO2 (lag2) | −0.159 | 0.291 ** | 0.204 | 0.193 | 0.914 ** | 1.000 | |||
| Res. | −0.442 ** | −0.019 | 0.033 | 0.032 | 0.183 | 0.164 | 1.000 | ||
| Car. | −0.220 * | 0.090 | 0.171 | 0.169 | −0.095 | −0.029 | 0.080 | 1.000 | |
| Ocu. | −0.078 | −0.017 | −0.099 | −0.123 | 0.007 | 0.001 | 0.576 ** | 0.025 | 1.000 |
© 2017 by the authors. Licensee MDPI, Basel, Switzerland. This article is an open access article distributed under the terms and conditions of the Creative Commons Attribution (CC BY) license (http://creativecommons.org/licenses/by/4.0/).
Share and Cite
Liang, F.; Tian, L.; Guo, Q.; Westerdahl, D.; Liu, Y.; Jin, X.; Li, G.; Pan, X. Associations of PM2.5 and Black Carbon with Hospital Emergency Room Visits during Heavy Haze Events: A Case Study in Beijing, China. Int. J. Environ. Res. Public Health 2017, 14, 725. https://doi.org/10.3390/ijerph14070725
Liang F, Tian L, Guo Q, Westerdahl D, Liu Y, Jin X, Li G, Pan X. Associations of PM2.5 and Black Carbon with Hospital Emergency Room Visits during Heavy Haze Events: A Case Study in Beijing, China. International Journal of Environmental Research and Public Health. 2017; 14(7):725. https://doi.org/10.3390/ijerph14070725
Chicago/Turabian StyleLiang, Fengchao, Lin Tian, Qun Guo, Dane Westerdahl, Yang Liu, Xiaobin Jin, Guoxing Li, and Xiaochuan Pan. 2017. "Associations of PM2.5 and Black Carbon with Hospital Emergency Room Visits during Heavy Haze Events: A Case Study in Beijing, China" International Journal of Environmental Research and Public Health 14, no. 7: 725. https://doi.org/10.3390/ijerph14070725