WHO Environmental Noise Guidelines for the European Region: A Systematic Review of Transport Noise Interventions and Their Impacts on Health


Abstract
:1. Introduction
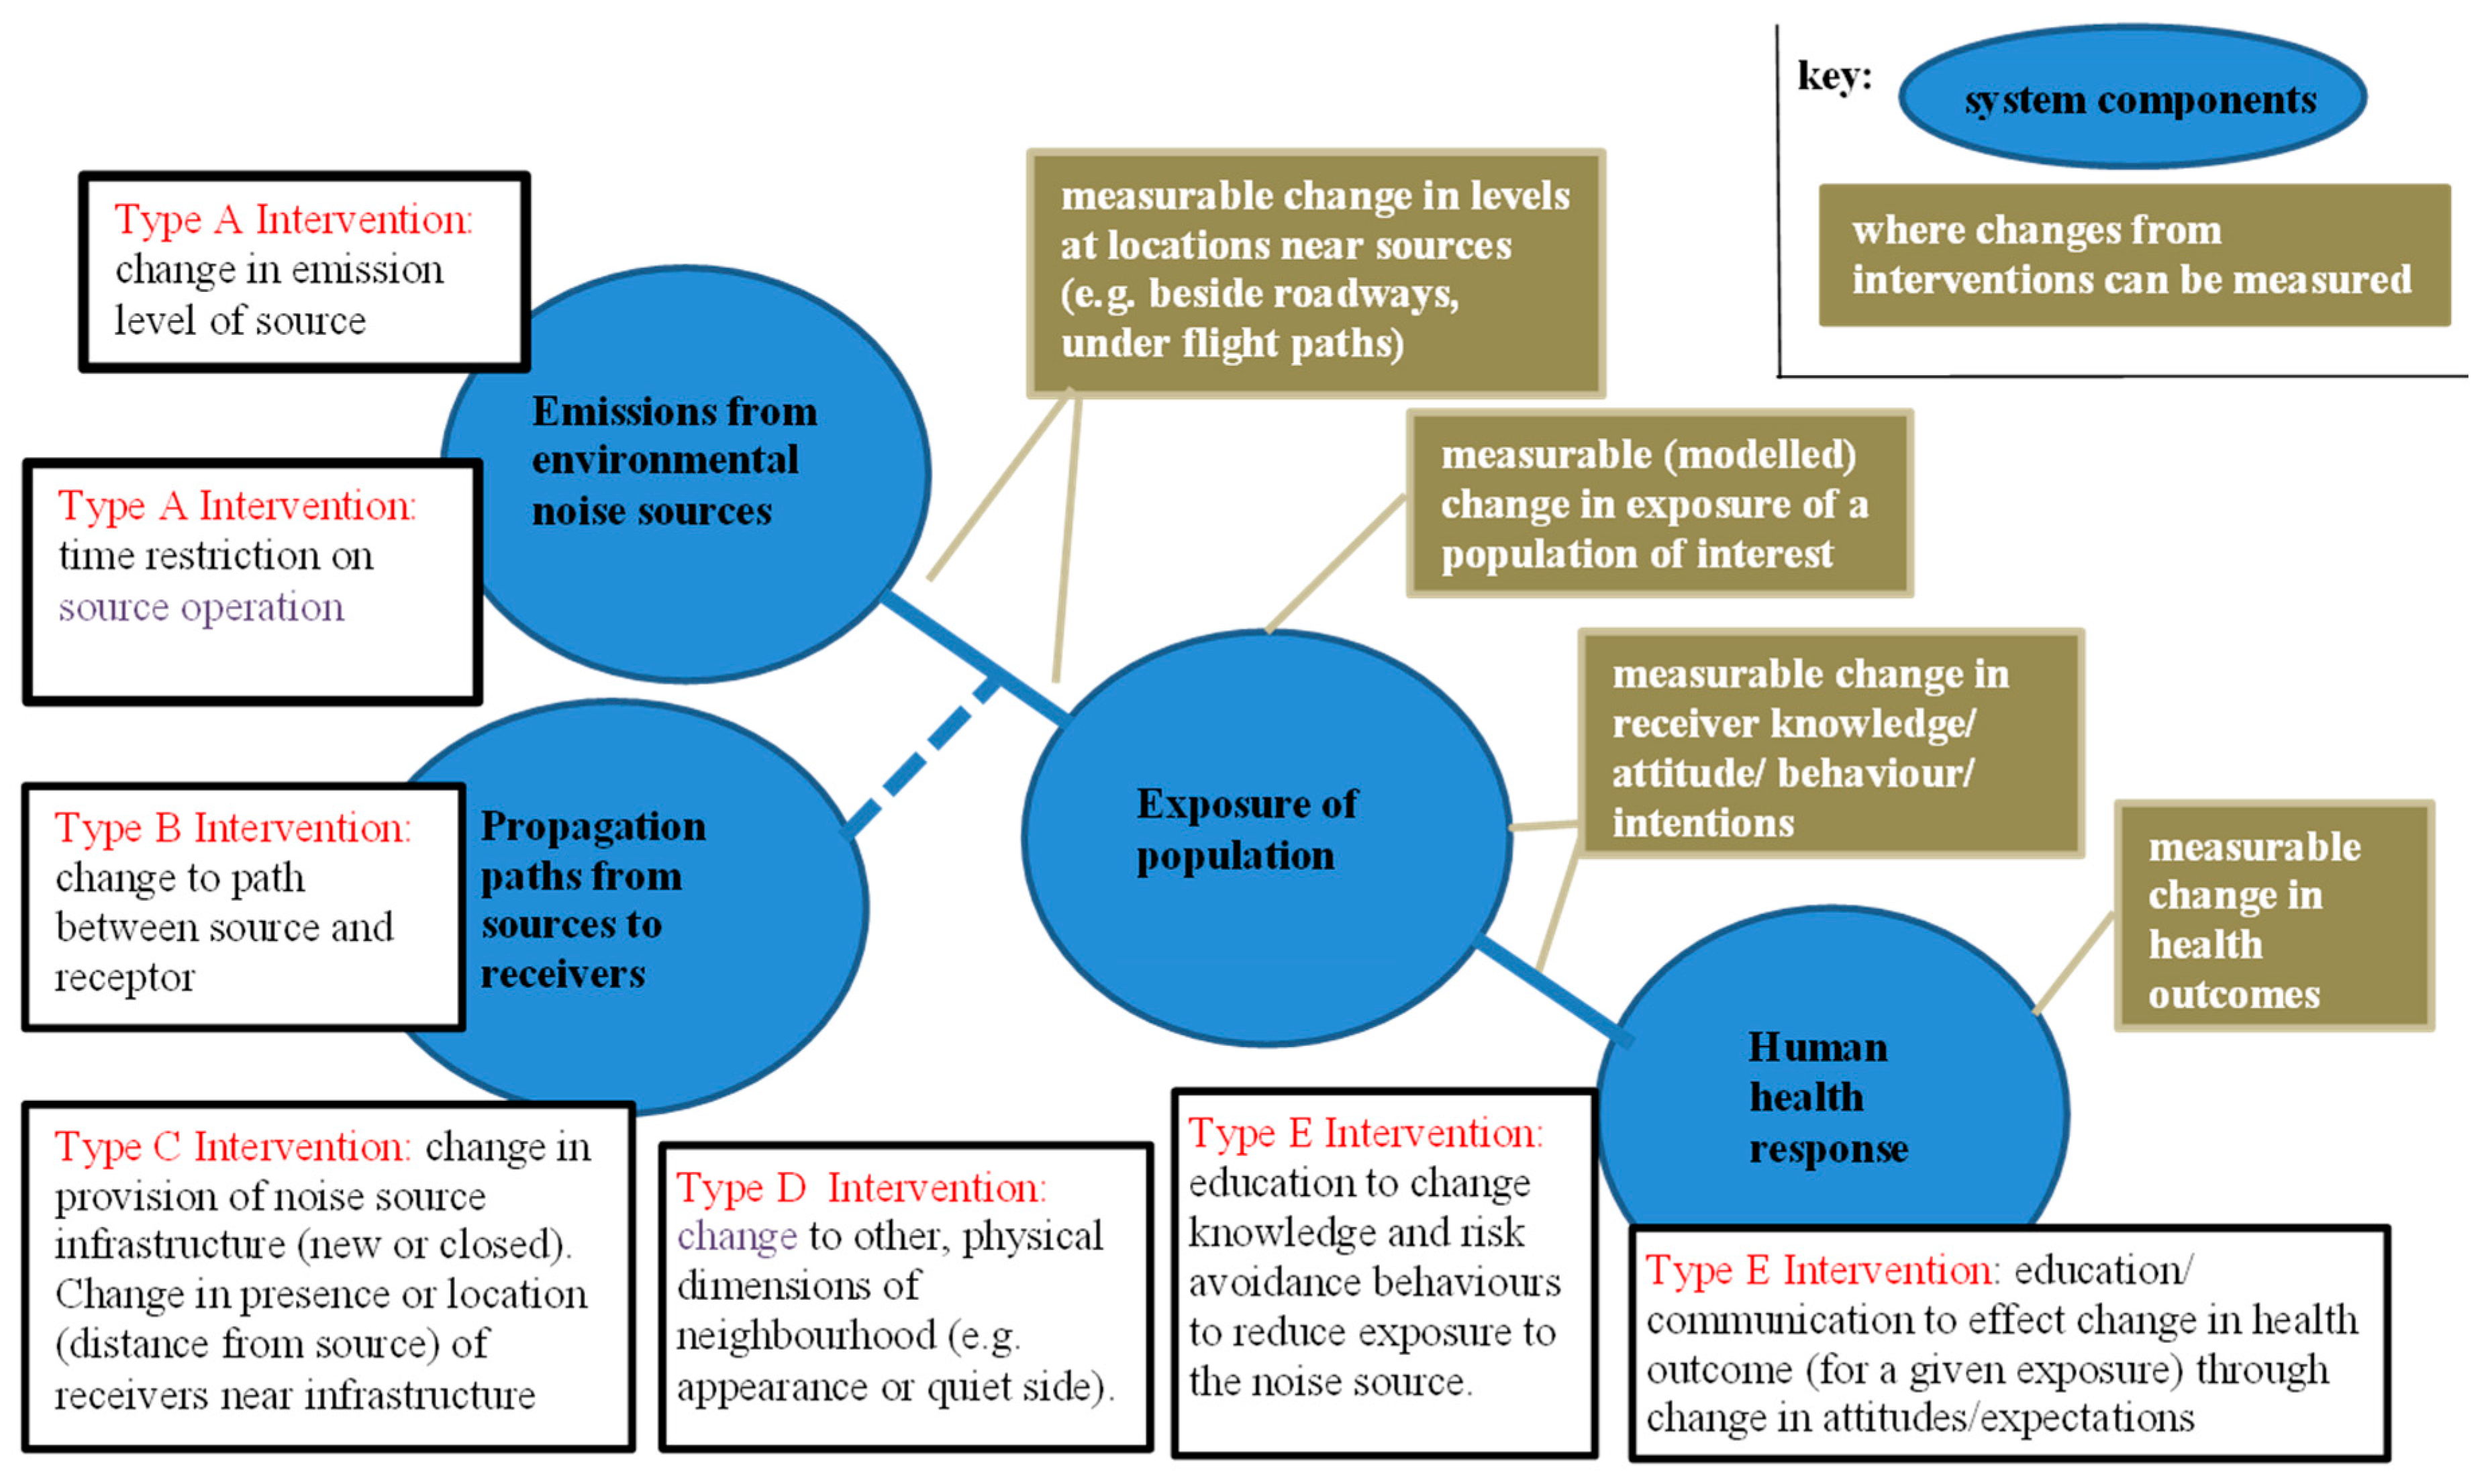
2. A Framework for Noise Interventions
3. Measurement of the Health Outcomes of an Intervention
4. Methods
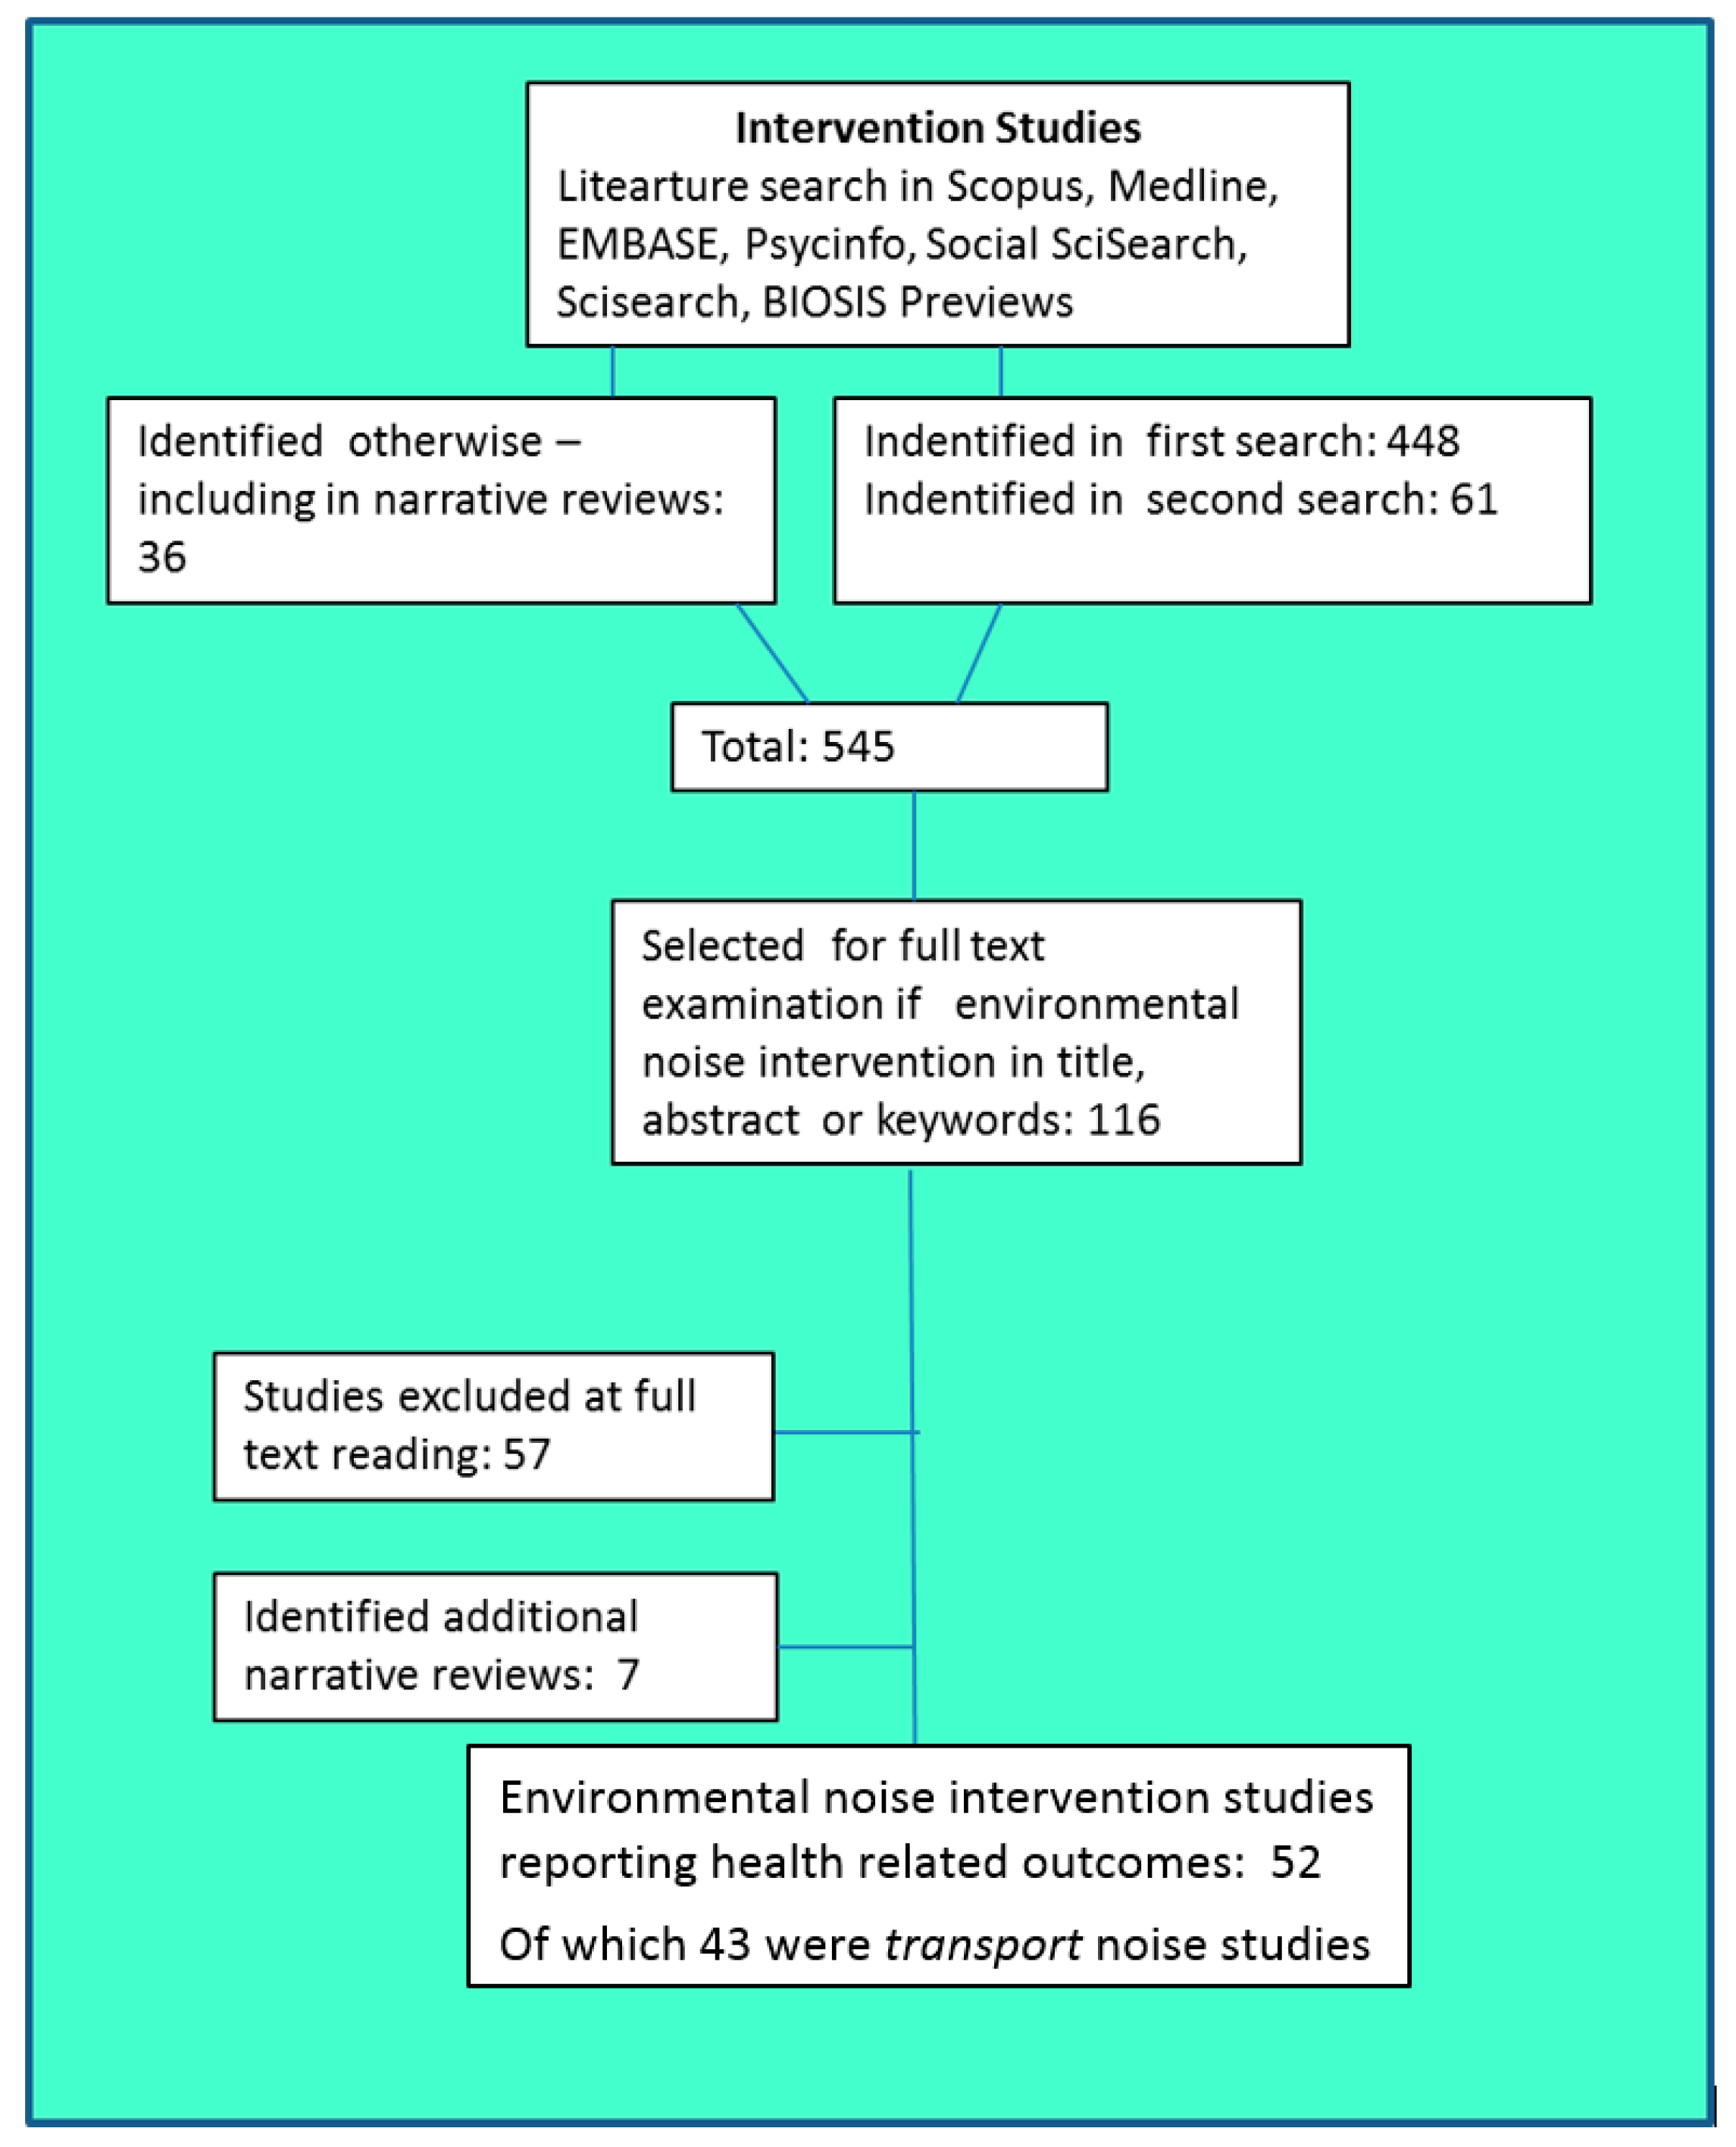
4.1. Search Strategy for the Identification of Studies
| SBAS | Scopus | |
| ME66 | MEDLINE | NLM |
| EM74 | EMBASE | 2014 Elsevier B.V. |
| PI67 | PsycINFO | AM. PSYCH. ASSN. 2010 |
| IN73 | Social SciSearch | Thomson Reuters |
| IS74 | SciSearch | Thomson Reuters |
| BA70 | BIOSIS Previews | Thomson Reuters |
4.2. Inclusion Criteria
- It dealt with noise sources as defined in the Study Protocol … rail, road, aircraft
- It reported the nature of an intervention of any Type A through E
- It specified (for intervention Types A–C), the change in exposure, usually as levels before and after the intervention
- The intervention (for intervention Types A–C) was not temporary or laboratory-based
- It reported:
- before and after health outcomes OR
- before and after exposures of a target population OR
- for interventions Type E, before and after knowledge/attitudes/behaviour OR
- a comparison of two exposure conditions with variation in some other relevant factor (e.g., quiet side).
4.3. Data Extraction and Synthesis of Findings Across Studies
- Did the study demonstrate that the intervention led to a change in health outcome?
- For source, path and infrastructure change interventions, if there was a change in health outcome, was the observed change in outcome of a magnitude at least equivalent to that which would be predicted from a relevant exposure–response function (ERF), based on the observed change in exposure?
- an ERF based on the responses to the before (steady-state) exposure conditions in that particular study (using grouped response data or individual responses), or sometime separate ERFs for both before and after states (5 studies used an ERF of this nature).
- an ERF reported from similar situations to those in the particular individual study, as determined by the study authors (4 studies used an ERF of this nature).
- a previous synthesis of ERFs. The particular ERF chosen depended on the date of the study,: namely, Schultz’s 1978 synthesis [10] (2 studies); the FICON 1992 synthesis [11] (1 study); Miedema & Vos’ 1998 synthesis [12] (2 studies); Miedema & Oudshoorn’s 2001 [13] or European Commission’s 2002 synthesis [14] (3 studies).
4.4. Organisation of the Review
5. Overall Search Results
6. Results for Road Traffic Noise
- 25 papers examined the effects of an intervention on the annoyance of adults in their dwellings
- 6 examined the effects of an intervention on sleep on adults in dwellings (several reported the effect of the intervention on both annoyance and sleep disturbance)
- 4 examined cardiovascular effects
- 2 modelled the extent of exposures to different levels of road traffic noise or the prevalence of annoyance arising from hypothetical interventions (studies modelling the effect of hypothetical interventions are considered separately from this review, in Supplementary File 4).
6.1. Annoyance
6.1.1. Evidence from Source Interventions
- Most were where traffic flow rates on the roadway changed (including several multi-site studies). Most were a decrease in traffic flow as a consequence of provision of relief roads, but at several sites there was an increase in traffic flow. Less than half of the studies were single-site studies; the others included results from multiple roadway sites.
- 1 was where there was improved roadway resurfacing.
- 1 was a truck restriction strategy.
- 1 was a complex set of control measures including barriers, road surfaces and other measures.
6.1.2. Evidence from Path Interventions
- 1 was of dwelling insulation (with a repeated survey two years after the first survey reported separately);
- 3 were barrier construction (one of which was a multi-site study involving 12 sites);
- 1 was a combination of barriers and dwelling insulation;
- 1 was a full-scale building intervention, filling in gaps between existing buildings to create a barrier for dwellings further from the roadway.
6.1.3. Evidence from New/Closed Infrastructure Interventions
- both studies involved major changes (reductions) in road traffic flows;
- both studies combined the main intervention with other environmental improvements.
6.1.4. Summary: Information from Other Physical Interventions
6.2. Outcome: Sleep Disturbance
6.2.1. Summary: Evidence from Source Interventions
6.2.2. Summary: Evidence from Path Interventions
6.2.3. Summary: Evidence from New/Closed Infrastructure Interventions
6.2.4. Information from Other Physical Interventions
6.3. Outcome: Cardiovascular Effects
Information from Other Physical Interventions
7. Evidence: Aircraft Noise
- 4 reported effects of the intervention on the annoyance of people in their dwellings;
- 2 of these also reported effects of the intervention on sleep;
- 1 reported effects of the intervention on cognitive development in children;
- 1 modelled a hypothetical intervention in terms of the effect of the intervention on annoyance and sleep disturbance (the study modelling the effect of hypothetical interventions is considered in Supplementary File 4).
7.1. Outcome: Annoyance
7.1.1. Summary: Evidence from Path Interventions
7.1.2. Summary: Evidence from New/Closed Infrastructure Interventions
7.2. Outcome: Sleep Disturbance
Summary: Evidence from New/Closed Infrastructure Interventions
7.3. Outcome: Cognitive Development in Children
Summary: Evidence from New/Closed Infrastructure Interventions
8. Evidence: Rail Noise
8.1. Outcome: Annoyance
8.1.1. Summary: Evidence from Source Intervention
8.1.2. Summary: Evidence from New/Closed Infrastructure Intervention
8.1.3. Summary: Evidence from Education/Communication Intervention
9. Discussion
9.1. Overview of Findings Across All Studies
9.1.1. Change in Health Outcomes
9.1.2. Sustainability of the Change in Health Outcomes
9.2. Implications
9.2.1. Implications for Noise Policy and Management
- This review has provided a positive answer to an important policy question: do environmental noise interventions change health outcomes? This finding is largely consistent across the transport noise interventions. It shows that many current noise management strategies have a beneficial effect on human health. The caveat is that this evidence is not extensive or well distributed over all transport noise sources, intervention types, or health outcomes.
- Another finding is that relevant ERFs for annoyance can provide an estimate of the minimum change in human outcomes that can be expected from a given change in exposure as a result of an intervention. This supports current noise management as ERFs for annoyance can thus provide a first conservative estimate for the health impact assessment of future interventions. The available evidence is more limited for aircraft noise than for road traffic noise. It is also too poorly conditioned across different groups of studies to be able to test for any differences in outcomes arising from different types of interventions. The evidence for ERFs predicting the minimum change in sleep disturbance is restricted to one aircraft noise intervention study only.
- The review demonstrated that there was excess response to the intervention in 14 road traffic noise interventions and three aircraft noise interventions. Excess response occurs where the total difference between the before-outcome and the after-outcomes is greater than the magnitude of the change in response estimated from an ERF for the given change in exposure. A similar result was found for sleep disturbance for one aircraft noise study. The notion of excess response to interventions has been considered in depth by Brown and van Kamp [54] where they examined, and rejected some of, the many explanations that have been proposed for this phenomenon. This study found that: ‘The evidence of the magnitude, and the persistence over time, of the change effect … and the existence of plausible explanations for it, suggest that it is a real effect and needs to be taken into account in assessing the response of communities in situations where noise levels change. Within the limitations of existing evidence on change, communities that experience an increase in noise exposure are likely to experience greater annoyance than is predicted from existing exposure–response relationships, and communities that experience a decrease in exposure experience greater benefit than predicted. Policy makers need to be informed of these potential change effects, particularly as situations in which noise levels increase as a result of infrastructure changes are always likely to be contentious. To do otherwise would be to deny them important information regarding potential community response in these contexts’.
9.2.2. Guidance for Future Studies of Interventions
- Further studies directly linking environmental noise interventions to health outcomes are required, for all sources of environmental noise, but particularly for aircraft and rail noise sources, and for human health outcomes other than annoyance.
- Authorities proposing/funding interventions, whether at local, national, or international level, and whether or not the primary purpose of the intervention concerns noise, should be encouraged to include significant funding for the design and implementation of studies to evaluate outcomes from the interventions. At present, many of the evaluations appear to be addendums to, rather than integral components of, the interventions.
- The effect of the intervention on the exposure of defined populations needs to be assessed, and its effect on the health outcomes of the same populations – not just the changes in noise levels that result from the intervention.
- Intervention studies should use validated, and where possible, harmonised, measures of exposures and outcomes, as well as of moderators and confounders.
- We recognize the difficulty in doing so in many intervention studies, but precise specification of the change in exposure for individuals, or subgroups, is desirable. In part to encourage this, we suggest that there are advantages in following the approach used in two of the individual aircraft noise studies [47,48] of reporting both the noise exposure before the intervention, and change in noise exposure as a result of the intervention, of the study participants, and using both in the analysis.
- Most interventions result in step changes in exposure with expected step changes in human response to this change in exposure. While many intervention studies use a before and after design, there is generally insufficient consideration that the change in human response to a step change in exposure may have a different time course to that of the change in exposure.
- A protocol is required for the conduct of future intervention studies that provides longitudinal assessment of both exposure and human response, and Brown [17] reported a design that is suitable (included below as Table 20). With a change in noise exposure over the interval between t0 and t1, sequential measurements of effect should be made before and after the change, preferably with multiple after measurements (A−1, A0, A1, A2, … Ax). Repeated measurements should also be made of activity interference (Actx), potential confounders such as noise sensitivity (Sensx), coping strategies (Copx), and a range of other attitudinal, retrospective, and prospective assessments. In addition, that model incorporates steady-state controls into the study design. The protocol in Table 20 is specific to studies of the effect of interventions on annoyance, but the principles of longitudinal measurements of exposure, of responses, and of potential confounders, can be adapted readily to studies of other human outcomes.
- In reporting the evidence for excess response (in annoyance outcomes) above, we noted that an excess response occurs when the magnitude of the observed change in outcomes is greater than that ‘predicted’ by the ERF, irrespective of whether the observed before and after outcomes themselves lie on the ERF curve. We have noted a tendency, in many studies in which there is evidence of an excess response, for the observed before-outcomes to be much higher than would be indicated by synthesised ERFs. Authors of these individual studies did not explain these higher than anticipated before-responses. We also note the comment by Baughan and Huddart [20] that it is only high noise level situations that receive interventions to reduce noise exposures. In short, intervention studies are biased towards noise situations that are ‘hotspots’. We leave this as an observation only as we have no evidence from this, or previous, reviews as to any mechanism that would lead to changes in reported outcomes from such hotspots (but see a range of potential explanations for excess response in Brown and van Kamp [54] that may have application to ‘hotspots’).
- We note that the noise exposure metrics reported in the individual studies reviewed did not include a metric that dealt specifically with noise events in transport noise time histories. One exception is the study (Table 20) by Brown (2015) [17]. Participants in that study responded to a noise intervention that focused on a change in the number of noise events, even though there was no change in energy-based noise metrics. We flag this as an issue to be considered in future intervention studies for transport noise.
9.3. Systems-Wide Considerations
- Spatial scales of interventions and effects will vary from highly local (e.g., noise barrier on a particular roadway) to regional, national (emission limits for motor vehicles), or international (e.g., emission limits for aircraft).
- There may be lag times between interventions (e.g., regulations specifying vehicle limits which might take years to implement, or which rely on natural turnover in the vehicle fleet) and measurable effect. There may also be lag times between noise reduction and health consequences, e.g., decreased risk of cardiovascular disease.
- Some interventions are applied for short periods (e.g., temporary flight path changes) vs. permanent interventions (studies of temporary interventions were excluded from the current review).
- Interventions may result in unintended displacement outcomes. For example, a traffic restriction intervention that forces traffic into surrounding areas, introduces higher exposures in other areas, even though at the point of application the exposure is reduced. Examples include congestion charging in London [55] and the removal of diesel cars in Rome [56]. In these examples, the reduction in noise levels at one location was accompanied by an increase elsewhere and often in a more deprived area.
- A related consideration is that there may be subgroup differences in health outcomes from an area-wide intervention (e.g., effects on different socio-economic subgroups) and interventions that redistribute exposures across different areas need to be cognizant of differential socio-economic status of populations in these different areas.
- There may be effects on human health responses to noise generated by interventions in other fields (e.g., intervention with respect to traffic congestion, or planning interventions that alter urban density).
9.4. Publication Bias
10. Conclusions
- An environmental noise intervention framework, showing different types of interventions along the causal path between noise sources and human outcomes, and measurement points along the pathway where changes relevant to human outcomes can be measured, has been used to structure this review. The framework also assists in focussing future studies of the effects of noise intervention strategies.
- This systematic review of the literature, 1980–2014, found, overall, that there has been a limited number of transport intervention studies published that report observed changes in health outcomes, or observed changes in peoples’ exposures, together with quantitative details on the association between change in exposure and change in human health effects.The majority of these were for road traffic noise sources; fewer for aircraft noise and rail traffic noise. The principal change in health outcomes assessed was annoyance, with fewer sleep disturbance, cardiovascular effects, and cognitive development in children.
- We note that there are many studies in the noise management/control literature of interventions, which report a change in noise emissions or in noise levels, but in the absence of reporting of change in health outcomes or of exposures, these do not elucidate the relationship between interventions and health.
- The consequence is that there is a restricted evidence base on the health effects of transport noise interventions, with studies spread across 16 different groupings (grouped by source type, health outcome, and intervention type). Only two of these groupings source interventions and path interventions for road traffic for the annoyance outcome have more than three studies.
- A major difficulty for this review was the diversity between studies, even within those categorised in the same group. This was in terms of study designs method of analyses, exposure levels, and changes in exposure experienced as a result of the interventions. In some studies, the changes in noise exposure were variable across participants (sometimes reported in aggregate) and were not always adequately linked to the corresponding change in outcomes.
- Because of the diversity, a meta-analysis across studies examining the association between changes in level and changes in outcome was not possible. However, the available evidence did show that transport noise interventions changed the health outcomes reported by those who experience the intervention. This is the case irrespective of the source, the outcome or the intervention type.
- The minimum magnitude of the change in annoyance outcomes because of the interventions can be predicted using a relevant exposure–response function (ERF). Further, in the majority of these studies, the magnitude of the change in response to an intervention exhibited a change effect—an excess response in addition to the level effect predicted using an ERF. This evidence was available for studies of road traffic noise sources (and a small number of aircraft noise studies) and largely only for the annoyance outcome.
- The available evidence did not allow testing for any differences in change in health outcomes arising from different types of interventions, or for different source types. We also could not make observations regarding thresholds for observable changes in health outcomes, other than that several interventions that reduced noise exposures by −1 to −2 dB did not result in any observed change in health outcomes.
- While there is little evidence available with respect to the longitudinal path of health outcomes changes following the initial change as a result of an intervention, there is no evidence to suggest the initial change in response is not sustained over at least several years—that is, there is no adaptation.
- Further studies directly linking transport noise interventions to health outcomes are required, particularly for aircraft and rail noise sources, and for human health outcomes other than annoyance. A protocol has been recommended for the design of future studies.
- While recognising the difficulty in doing so in many study designs, we suggest that future intervention studies should aim for precise specification of the change in exposure for individuals, or subgroups. There are advantages in following the approach [45,46], of reporting both the noise exposure before the intervention, and change in noise exposure as a result of the intervention, of the study participants, and using both in the analyses.
- Policy makers need to be informed of the existence of the change effect associated with interventions, particularly as situations in which noise levels increase as a result of infrastructure changes are always likely to be contentious. To do otherwise would be to deny them important information regarding potential community response to these changes.
- The results of the studies available to us regarding other physical interventions were obtained primarily through indirect evidence (comparison of outcomes under different conditions, rather than before-after designs). These have proved useful as a means of estimating the efficacy of such potential interventions, but they need to be supplemented by direct evidence.
- We note, without evidence, that publication bias may have influenced the findings of this review. We also suggest, again without evidence, that government and private instrumentalities that initiate noise intervention programmes may be inhibited in conducting follow-up evaluations of the intervention through a perception of reputational risk in doing so.
- The environmental noise intervention studies included in this review focussed on changes at the site of the interventions. We have indicated that there is a range of system-wide factors that also need to be considered in any comprehensive evaluation of the human health effects of any particular environmental noise intervention.
Supplementary Materials
Acknowledgments
Author Contributions
Conflicts of Interest
References
- Brown, A.L.; van Kamp, I. A Conceptual Model of Environmental Noise Interventions and Human Health Effects. In Proceedings of the INTER-NOISE and NOISE-CON Congress and Conference, San Francisco, CA, USA, 9–12 August 2015. [Google Scholar]
- National Research Council. Estimating the Public Health Benefits of Proposed Air Pollution Regulations; National Academies Press: Washington, DC, USA, 2002. [Google Scholar]
- Group, H.A.W. Assessing Health Impacts of Air Quality Regulations: Concepts and Methods for Accountability Research; Health Effects Institute: Boston, MA, USA, 2003. [Google Scholar]
- Van Erp, A.M.; Kelly, F.J.; Demerjian, K.L.; Pope, C.A.; Cohen, A.J. Progress in research to assess the effectiveness of air quality interventions towards improving public health. Air Qual. Atmos. Health 2012, 5, 217–230. [Google Scholar] [CrossRef]
- Burns, J.; Boogaard, H.; Turley, R.L.; Pfadenhauer, L.M.; van Erp, A.M.; Rohwer, A.C.; Rehfuess, E. Interventions to reduce ambient particulate matter air pollution and their effect on health. Cochrane Libr. 2014. [Google Scholar] [CrossRef]
- Organization, W.H. Guidelines for Community Noise; WHO: Geneva, Switzerland, 1999. [Google Scholar]
- Öhrström, E. Longitudinal surveys on effects of changes in road traffic noise—Annoyance, activity disturbances, and psycho-social well-being. J. Acoust. Soc. Am. 2004, 115, 719–729. [Google Scholar] [CrossRef] [PubMed]
- Gidlöf-Gunnarsson, A.; Svensson, H.; Ohrstrom, E. Noise reduction by traffic diversion and a tunnel construction: Effects on health and well-being after opening of the Southern Link. In Proceedings of the INTER-NOISE and NOISE-CON Congress and Conference, Innsbruck, Austria, 15–18 Sepetember 2013. [Google Scholar]
- Koehler, J.; Ruijsbroek, A.; van Poll, R. Effectiveness of insulation measures and underlying factors. In Proceedings of the INTER-NOISE and NOISE-CON Congress and Conference, Honolulu, HI, USA, 3–6 December 2006. [Google Scholar]
- Schultz, T.J. Synthesis of social surveys on noise annoyance. J. Acoust. Soc. Am. 1978, 64, 377–405. [Google Scholar] [CrossRef] [PubMed]
- Federal Interagency Committee on Noise. Federal Agency Review of Selected Airport Noise Analysis Issues. Available online: https://fican1.files.wordpress.com/2015/10/reports_noise_analysis.pdf (accessed on 24 July 2017).
- Miedema, H.M.; Vos, H. Exposure–response relationships for transportation noise. J. Acoust. Soc. Am. 1998, 104, 3432–3445. [Google Scholar] [CrossRef] [PubMed]
- Miedema, H.; Oudshoorn, C. Annoyance from transportation noise: Relationships with exposure metrics DNL and DENL and their confidence intervals. Environ. Health Perspect. 2001, 109, 409. [Google Scholar] [CrossRef] [PubMed]
- Miedema, H.; Oudshoorn, C. Position Paper on Dose Response Relationships between Transportation Noise and Annoyance. In EU’s Future Noise Policy WG2–Dose/Effect; AIP Publishing: Melville, NY, USA, 2002; Volume 20. [Google Scholar]
- Brown, A.L.; van Kamp, I. Response to a change in transport noise exposure: A review of evidence of a change effect. J. Acoust. Soc. Am. 2009, 125, 3018–3029. [Google Scholar] [CrossRef] [PubMed]
- Horonjeff, R.D.; Robert, W.E. Attitudinal Responses to Changes in Noise Exposure in Residential Communities; NASA Langley Research Center: Hampton, VA, USA, 1997.
- Brown, A.L. Longitudinal annoyance responses to a road traffic noise management strategy that reduced heavy vehicles at night. J. Acoust. Soc. Am. 2015, 137, 165–176. [Google Scholar] [CrossRef] [PubMed]
- Pedersen, T.H.; Le Ray, G.; Bendtsen, H.; Kraugh, J. Community response to noise reducing road pavements. In Proceedings of the INTER-NOISE and NOISE-CON Congress and Conference, Innsbruck, Austria, 15–18 Sepetember 2013. [Google Scholar]
- Stansfeld, S.A.; Haines, M.M.; Berry, B.; Burr, M. Reduction of road traffic noise and mental health: An intervention study. Noise Health 2009, 11, 169. [Google Scholar] [CrossRef] [PubMed]
- Baughan, C.; Huddart, L. Effects of traffic noise changes on residents‘ nuisance ratings. In Proceedings of the 6th International Congress on Noise as a Public Health Problem, Noise & Man, Nice, France, 5–9 July 1993; pp. 585–588. [Google Scholar]
- Griffiths, I.; Raw, G. Adaptation to changes in traffic noise exposure. J. Sound Vib. 1989, 132, 331–336. [Google Scholar] [CrossRef]
- Langdon, F.; Griffiths, I. Subjective effects of traffic noise exposure, II: Comparisons of noise indices, response scales, and the effects of changes in noise levels. J. Sound Vib. 1982, 83, 171–180. [Google Scholar] [CrossRef]
- Brown, A.L. Responses to an increase in road traffic noise. J. Sound Vib. 1987, 117, 69–79. [Google Scholar] [CrossRef]
- Griffiths, I.; Raw, G. Community and individual response to changes in traffic noise exposure. J. Sound Vib. 1986, 111, 209–217. [Google Scholar] [CrossRef]
- Brown, A.L.; Hall, A.; Kyle-Little, J. Response to a reduction in traffic noise exposure. J. Sound Vib. 1985, 98, 235–246. [Google Scholar] [CrossRef]
- Kastka, J. Zum Einfluss verkehrsberuhigender Maßnahmen auf Lärmbelastung und Lärmbelästigung. (The influence of traffic calming measures on noise load and noise annoyance). ZfLärmbek 1981, 28, 25–30. [Google Scholar]
- Amundsen, A.H.; Klæboe, R.; Aasvang, G.M. The Norwegian Façade Insulation Study: The efficacy of façade insulation in reducing noise annoyance due to road traffic. J. Acoust. Soc. Am. 2011, 129, 1381–1389. [Google Scholar] [CrossRef] [PubMed]
- Amundsen, A.H.; Klæboe, R.; Aasvang, G.M. Long-term effects of noise reduction measures on noise annoyance and sleep disturbance: The Norwegian facade insulation study. J. Acoust. Soc. Am. 2013, 133, 3921–3928. [Google Scholar] [CrossRef] [PubMed]
- Bendtsen, H.; Michelsen, L.; Christensen, E.C. Noise annoyance before and after enlarging Danish highway. Presented at the 6th Forum Acusticum, Aalborg, Denmark, 27 June–1 July 2011. [Google Scholar]
- Gidlöf-Gunnarsson, A.; Öhrström, E.; Kihlman, T. A full-scale intervention example of the quiet-side concept in a residential area exposed to road traffic noise: Effects on the perceived sound environment and general annoyance. In Proceedings of the INTER-NOISE 2010 39th International Congress on Noise Control Engineering 2010, Lisbon, Portugal, 13–16 June 2010. [Google Scholar]
- Kastka, J.; Buchta, E.; Ritterstaedt, U.; Paulsen, R.; Mau, U. The long term effect of noise protection barriers on the annoyance response of residents. J. Sound Vib. 1995, 184, 823–852. [Google Scholar] [CrossRef]
- Nilsson, M.E.; Berglund, B. Noise annoyance and activity disturbance before and after the erection of a roadside noise barriera. J. Acoust. Soc. Am. 2006, 119, 2178–2188. [Google Scholar] [CrossRef] [PubMed]
- Vincent, B.; Champelovier, P. Changes in the acoustic environment: Need for an extensive evaluation of annoyance. Proc. Noise Man 1993, 93, 425–428. [Google Scholar]
- Öhrström, E.; Skånberg, A. Adverse health effects in relation to noise mitigation—A longitudinal study in the city of Göteborg. In Proceedings of the 29th International Congress and Exhibition on Noise Control Engineering, Nice, France, 27–30 August 2000; pp. 27–30. [Google Scholar]
- De Kluizenaar, Y.; Janssen, S.A.; Vos, H.; Salomons, E.M.; Zhou, H.; van den Berg, F. Road traffic noise and annoyance: A quantification of the effect of quiet side exposure at dwellings. Int. J. Environ. Res. Public Health 2013, 10, 2258–2270. [Google Scholar] [CrossRef] [PubMed]
- Babisch, W.; Swart, W.; Houthuijs, D.; Selander, J.; Bluhm, G.; Pershagen, G.; Dimakopoulou, K.; Haralabidis, A.S.; Katsouyanni, K.; Davou, E. Exposure modifiers of the relationships of transportation noise with high blood pressure and noise annoyance. J. Acoust. Soc. Am. 2012, 132, 3788–3808. [Google Scholar] [CrossRef] [PubMed]
- Van Renterghem, T.; Botteldooren, D. Focused study on the quiet side effect in dwellings highly exposed to road traffic noise. Int. J. Environ. Res. Public Health 2012, 9, 4292–4310. [Google Scholar] [CrossRef] [PubMed] [Green Version]
- De Kluizenaar, Y.; Salomons, E.M.; Janssen, S.A.; van Lenthe, F.J.; Vos, H.; Zhou, H.; Miedema, H.M.; Mackenbach, J.P. Urban road traffic noise and annoyance: The effect of a quiet façade. J. Acoust. Soc. Am. 2011, 130, 1936–1942. [Google Scholar] [CrossRef] [PubMed]
- Gidlöf-Gunnarsson, A.; Öhrström, E. Attractive “uiet” courtyards: A potential modifier of urban residents' responses to road traffic noise? Int. J. Environ. Res. Public Health 2010, 7, 3359–3375. [Google Scholar] [CrossRef] [PubMed]
- Gidlöf-Gunnarsson, A.; Öhrström, E. Noise and well-being in urban residential environments: The potential role of perceived availability to nearby green areas. Landsc. Urban Plan. 2007, 83, 115–126. [Google Scholar] [CrossRef]
- Öhrström, E.; Skånberg, A. Longitudinal surveys on effects of road traffic noise: Substudy on sleep assessed by wrist actigraphs and sleep logs. J. Sound Vib. 2004, 272, 1097–1109. [Google Scholar] [CrossRef]
- Babisch, W.; Wölke, G.; Heinrich, J.; Straff, W. Road traffic noise and hypertension—Accounting for the location of rooms. Environ. Res. 2014, 133, 380–387. [Google Scholar] [CrossRef] [PubMed]
- Babisch, W.; Wölke, G.; Heinrich, J.; Straff, W. Road Traffic, Location of Rooms and Hypertension. J. Civ. Environ. Eng. 2014, 4, 5. [Google Scholar] [CrossRef]
- Lercher, P.; Botteldooren, D.; Widmann, U.; Uhrner, U.; Kammeringer, E. Cardiovascular effects of environmental noise: Research in Austria. Noise Health 2011, 13, 234. [Google Scholar] [CrossRef] [PubMed] [Green Version]
- Bluhm, G.L.; Berglind, N.; Nordling, E.; Rosenlund, M. Road traffic noise and hypertension. Occup. Environ. Med. 2007, 64, 122–126. [Google Scholar] [CrossRef] [PubMed]
- Asensio, C.; Recuero, M.; Pavón, I. Citizens’ perception of the efficacy of airport noise insulation programmes in Spain. Appl. Acoust. 2014, 84, 107–115. [Google Scholar] [CrossRef]
- Brink, M.; Wirth, K.E.; Schierz, C.; Thomann, G.; Bauer, G. Annoyance responses to stable and changing aircraft noise exposure. J. Acoust. Soc. Am. 2008, 124, 2930–2941. [Google Scholar] [CrossRef] [PubMed] [Green Version]
- Breugelmans, O.; Houthuijs, D.; Van Kamp, I.; Stellato, R.; van Wiechen, C.; Doornbos, G. Longitudinal effects of a sudden change in aircraft noise exposure on annoyance and sleep disturbance around Amsterdam Airport. In Proceedings of the ICA, Madrid, Spain, 2–7 September 2007. [Google Scholar]
- Fidell, S.; Silvati, L.; Haboly, E. Social survey of community response to a step change in aircraft noise exposure. J. Acoust. Soc. Am. 2002, 111, 200–209. [Google Scholar] [CrossRef] [PubMed]
- Hygge, S.; Evans, G.W.; Bullinger, M. A prospective study of some effects of aircraft noise on cognitive performance in schoolchildren. Psychol. Sci. 2002, 13, 469–474. [Google Scholar] [CrossRef] [PubMed]
- Möhler, U.; Hegner, A.; Schuemer, R.; Schuemer-Kohrs, A. Effects of railway-noise reduction on annoyance after rail-grinding. In Proceedings of the INTER-NOISE and NOISE-CON Congress and Conference, Honolulu, Budapest, Hungary, 25–27 August 1997. [Google Scholar]
- Lam, K.-C.; Au, W.-H. Human response to a step change in noise exposure following the opening of a new railway extension in Hong Kong. Acta Acust. United Acust. 2008, 94, 553–562. [Google Scholar] [CrossRef]
- Schreckenberg, D.; Mohler, U.; Liepert, M.; Schuemer, R. The impact of railway grinding on noise levels and residents’ noise responses—Part II: The role of information. In Proceedings of the INTER-NOISE and NOISE-CON Congress and Conference, Innsbruck, Austria, 15–18 September 2013. [Google Scholar]
- Brown, A.L.; van Kamp, I. Response to a change in transport noise exposure: Competing explanations of change effects. J. Acoust. Soc. Am. 2009, 125, 905–914. [Google Scholar] [CrossRef] [PubMed]
- Tonne, C.; Beevers, S.; Armstrong, B.; Kelly, F.; Wilkinson, P. Air pollution and mortality benefits of the London Congestion Charge: Spatial and socioeconomic inequalities. Occup. Environ. Med. 2008, 65, 620–627. [Google Scholar] [CrossRef] [PubMed]
- Cesaroni, G.; Boogaard, H.; Jonkers, S.; Porta, D.; Badaloni, C.; Cattani, G.; Forastiere, F.; Hoek, G. Health benefits of traffic-related air pollution reduction in different socioeconomic groups: The effect of low-emission zoning in Rome. Occup. Environ. Med. 2012, 69, 133–139. [Google Scholar] [CrossRef] [PubMed]

| Type | Intervention Category | Intervention Sub-Category | Examples |
|---|---|---|---|
| A | Source interventions | change in emission levels of sources | motor vehicle emission regulation; rail grinding; road surface change; change in traffic flow on existing roadways/railways; change in number of aircraft flights |
| time restrictions on source operations | airport curfew, heavy vehicle curfew | ||
| B | Path interventions | change in the path between source and receiver | noise barrier |
| path control through insulation of receiver’s dwelling | insulation of building envelope | ||
| C 1 | New/closed infrastructure | opening of a new infrastructure noise source, or closure of an existing one | new flight path; new railway line; new road bypass; or closure of any of these |
| planning controls 2 between (new) receivers and sources | urban planning control; ‘buffer’ requirements 2 | ||
| D | Other physical interventions | change in other physical dimensions of dwelling/neighbourhood | availability of a quiet side; appearance of the neighbourhood; availability of green space |
| E | Education/communication interventions | change in behaviour to reduce exposures; avoidance or duration of exposure | Educating people on how to change their exposure |
| community education, communication | Informing people to influence their perceptions regarding sources, or explaining reason for noise changes |
| Number of Peer Reviewed Papers | Number of Non-Peer Reviewed Papers | Total Papers per Group | |
|---|---|---|---|
| ROAD TRAFFIC NOISE SOURCES | |||
| Outcome: Annoyance | |||
| A Source Intervention | 7 | 3 | 10 |
| B Path Intervention | 4 | 2 | 6 |
| C New/Closed Infrastructure | 1 | 1 | 2 |
| D Other Physical | 6 | 1 | 7 |
| Outcome: Sleep Disturbance | |||
| A Source Intervention | 1 | - | 1 |
| B Path Intervention | 1 | 1 | 2 |
| C New/Closed Infrastructure | 2 | - | 2 |
| D Other Physical | 1 | - | 1 |
| Outcome: Cardiovascular Effects | |||
| D Other Physical | 4 | - | 4 |
| Outcome: Modelled Change in Exposure/Effect * | |||
| A Source Intervention | 1 | 1 | 2 |
| AIRCRAFT NOISE SOURCES | |||
| Outcome: Annoyance | |||
| B Path Intervention | 1 | - | 1 |
| C New/Closed Infrastructure | 2 | 1 | 3 |
| Outcome: Sleep Disturbance | |||
| C New/Closed Infrastructure | 1 | 1 | 2 |
| Outcome: Cognitive Development in Children | |||
| C New/Closed Infrastructure | 1 | - | 1 |
| Outcome: Modelled Change in Exposure/Effect * | |||
| A Source Intervention | 1 | - | 1 |
| RAIL NOISE SOURCES | |||
| Outcome: Annoyance | |||
| A Source Intervention | - | 1 | 1 |
| C New/Closed Infrastructure | 1 | - | 1 |
| E Education/Communication | - | 1 | 1 |
| Authors | Intervention & Study | N, Response Rate & Method | Exposure Levels | Change in Levels and Distribution of Change across Participants | Outcome Measure(s) before and after Outcomes | Did Outcome Change with Change in Exposure? Yes/No (Significance Tested?) | Before/after Outcome Change Compared to That Estimated from an ERF | Comments | Confounders Adjusted for in Analyses | ||
|---|---|---|---|---|---|---|---|---|---|---|---|
| Nature | Design | Before | After | ||||||||
| Brown (2015) [17] | Brisbane, Truck restriction, change in traffic composition Note: the date of this paper was outside the search time period | B/A. Five rounds of after surveys out to 20 months | 99 in panel Response rate 84% ~20% of panel drop out each survey round Interviews | 65–73 Lden 60–68 Lnight 69–77 L10,18 h Measured | 65–73 Lden 60–68 Lnight 69–77 L10,18 h Measured | No change in Lden, Lnight or L10,18 h But see comments All Ps experienced same change—but were exposed to different before levels | %HA based on 7, 8 & 9 of ISO (but with 0–9 scale). B: 58% HA A: 33%, 18%, 18% HA respectively at survey rounds 2, 3 & 4 Mean Annoyance also reported | n.a. as no change in Lden exposure (but there was a change in number of noise events) Est. Marg. Mean annoyance scores changed significantly over period of truck restriction (F4,170.4 = 12.18, p < 0.001) (see comments) | ERF cited was Miedema & Oudshoorn (2001) [13] 58% HA in before-study much higher than estimated by ERF (latter is 16 to 30% for Lden over the range of Ps’ exposures No observation possible on the relationship of change in outcomes with the ERF because Lden did not change | Change in response attributed to change in number of noise events | Noise sensitivity; neighborhood quality; respondent association with trucking industry. |
| Pedersen, Le Ray, Bendtsen & Kragh (2013) [18] | Copenhagen Resurfacing with noise reducing pavement. | B/A study 12 mo. After Not repeated measure | 2870 over two areas near roads Response rate 41% Mail surveys | 42–74 Lden Modelled noise map. Note: wide range of before levels | 38–70 Lden | Measured 4 dB reduction in source levels Same reduction assumed for all Ps | %HA based on 8, 9 & 10 of ISO (0–10 scale) Mean Annoyance also reported | Yes B&A mean annoyance scores were different (Welch’s t-test, p < 0.001) | Authors reported logistic regression ERFs for each of before and after conditions (n = 2870). The 95% CIs of B & A curves tended to overlap, and authors merged the data to establish the ERF. Hence change in response to −4 dB intervention estimated by the ERF. B & A ERFs curves are overlapping—largely parallel but with ERF (after) slightly lower than ERF (before). Response to change estimated by ERF. Slightly lower ERF(A) indicates excess response. The authors also report ‘…a small tendency to a lower %HA in the 50–60 dB range in the after situation…’. | Merged ERF was higher than Miedema & Oudshoorn (2001) [13] ERF over 60–74 Lden | |
| Stansfeld, Haines, Berry & Burr (2009) [19] | UK Bypass roads constructed reducing traffic flow in three small towns | B/A study B:1 year A: 6–7 mos | 17 5 exposed 184 control Response rate B:70% A: 74% 67 Ps at exposed area follow-up Delivered questionnaire | L10,3 h (& Leq,3 h) Exposed: 75–78 Control: 55–58 Measured Includes train noise | See next column | Change in L10,3 h of −2 to −4 dB suggested for most locations No reporting of distribution of these small changes across Ps. | ‘Standard’ noise question for assessing level of annoyance with environmental noise at home. No significant change in mean annoyance score with intervention. | No change in annoyance. Explanation was that the change was too small to be noticed | n.a. | Changes in traffic flow on source roads were small: 24 h flow changed from 26 k to 23 k veh/day, and 24 k to 21 k veh/day | |
| Baughan & Huddart (1993) [20] | U.K. Decreased traffic flow at 14 sites; increased traffic flow at 6 sites; 2 control sites | B/A study + controls 1–2 mos B&A changes Repeated measure | 33–50 per site Response rate and dropout rate not reported Interviews | L10,18 h Decrease sites: 66–76 Increase sites: 65–78 | L10,18 h 14 sites with changes ranging from −15 to +5 dB | 7 point numerical scale of satisfaction with level of road traffic noise with endpoints labelled Def. Satis. And Def. Unsatis Outcome reported as mean dissatisfaction score | Yes Infer from next column No statistical tests reported | Authors refer to ERF derived from ‘TRRL’ survey at 35 steady-state sites. Authors conclude: For decreases, both before and after levels (of dissatisfaction) differed significantly from steady state (ERF). B/A transitions steeper than ERF; For increases, after levels differed significantly from steady state. B/A transitions steeper than ERF; No statistical tests reported; Response to change in same direction as estimated by ERF, but much steeper, indicating excess response | Data used in Griffiths & Raw (1989) [21] below also included in analysis in this paper | ||
| Griffiths & Raw (1989) [21] | England. Repeated measure of after survey in Langdon & Griffiths (1982) [22] 5 sites | Repeat of After study at 7–9 years. After 48% of Ps repeat interview | 430 Interviews | See Langdon & Griffiths (1982) [22] | Four-point verbal bother scale Outcome reported as mean bother score for each of B&A conditions | n.a.(because there was no change in exposure between 7 and 9 years) | See results in Langdon & Griffiths (1982) [22] below. Observed Excess responses show no diminution out to 2 years after change, but is diminished, but still exists, 7–9 years after the change | ||||
| Brown (1987) [23] | Brisbane. Increase in traffic flow | B/A study 2 weeks B, 7 & 19 mos A Repeated measure | 20 Response rate 83% Interviews | LAeq,24 h 60 L10,18 h 60 Ldn 61 | LAeq,24 h 66/67 L10,18 h 68/71 Ldn 69/71 | LAeq,24 h + 6/+7 dB L10,18 h +8/+11 dB Ldn +8/+10 dB | 7 point semantically labelled annoyance scale. Reported individual responses and %HA based on top two categories. | Yes Distribution of individual annoyance responses changed after intervention (Friedman Two-way Anova, p < 0.01). 90% CIs for %HA B & A intervention do not overlap | ERF cited was Schultz (1978) [10] and plotted as band containing 90% of data points used in Schultz synthesis. Before %HA lay within Schultz 90% band, After %HA lay above ERF (though Cis for %HA are wide due to small sample size). Indicates excess response to increase in exposure | Note: No evidence of adaptation. Distribution of annoyance scores not different at 7 and 19 mos after change (t-test, p < 0.05) | |
| Griffiths & Raw (1986) [24] | England. Decreased traffic flow at 6 sites; increased traffic flow at 2 sites | B/A study 1–4 mos before change 2–3 mos after change Repeated measure | 469 Response rate 74% 17% drop out between surveys (391) | L10,18 h Decrease sites: 65–81 Increase sites: 54–56 Measured and calculated | L10,18 h Decrease sites: 66–74 Increase sites: 61–69 | Change in L10,18 h at seven sites were: (1) −14.5 dB (2) −5.7 dB (3) −2.6 dB (4) −3.1 dB (5) −1.3 dB (6) +5 dB (7) +15 dB | 7 point numerical scale of satisfaction with level of road traffic noise with endpoints labelled Def. Satis. And Def. Unsatis Reported site mean dissatisfaction scores | Yes Infer difference between B&A mean dissatisfaction scores from next column | Authors calculated ERF using ‘steady-state’ before responses. Site mean dissatisfaction scores regressed against before L10,18 h. Mean dissatisfaction scores (After) were compared to those estimated by the ERF. For decreases: decrease in site mean dissatisfaction score was greater than estimated by a conservatively estimated ERF (t = 3.14, df = 4, p < 0.025). Similarly, at two increase sites, increase in individual dissatisfaction score was greater than estimated (t = 2.93, df = 81, p < 0.005). Response to decrease/increase changes in direction estimated by ERF, but steeper—hence excess response | Note: resurvey of three decrease-sites out to 17–22 mos. After change showed no change in observed excess response. Griffiths & Raw (1989) [21] | |
| Brown, Hall & Kyle-Little (1985) [25] | Brisbane. Reduction in traffic flow | B/A study with 2 control groups (quasi experimental) | 49 Cntrls: 52, 40 | L10,12 h 74.3 Calculated Cntrl. 75.1 Measured | L10,12 h 64.5 Measured Cntrl. 65.2 Measured | L10,12 h −9.8 dB | 7 point semantically labelled annoyance scale. Reported %HA based on top two categories. Annoyance with before conditions assessed in retrospect. | Yes Note, before %HA based on retrospective assessment No statistical test reported—but see next column | ERF cited was Schultz [10] and plotted as band containing 90% of data points used in Schultz synthesis. After %HA and Control sites %HA lay within 90% band. Before %HA (retrospective) lay outside 90% band. Response to decrease in same direction as estimated by ERF, but steeper, indicating excess response | This study relied on retrospective assessment of annoyance before the change | |
| Langdon & Griffiths (1982) [22] | U.K. Reduction in traffic volumes at 6 sites after opening of new relief roads | B/A study 2–3 mos. B to 4–6 mos. A | Number of respondents at each of the six sites not reported | LAeq,24 h 72–76.5 | LAeq,24 h 56.5–73.5 | Change in LAeq,24 h 6 sites ranging from −5 to −15.5 dB All Ps at a site experienced the same change in exposure | Four-point verbal bother scale Outcome reported as median of bother score for each of B&A conditions at all six change sites | Yes Infer difference between B&A median bother scores from next column | Authors compare change data to ERF from eight sites in London where exposure and response were measured under steady-state condition. For the six change sites: No sig. diff. between median Before bother scores and scores estimated by ERF (t-test = 2.13, p > 0.05). Sig. diff between median After bother scores and scores estimated by ERF (t-test = 8.25, p < 0.001) Response to change in same direction as estimated by ERF, but steeper, indicating excess response | ||
| Kastka (1981) [26] | Germany Complex set of noise and traffic control measures in 6 cities Plots 50 data points | B/A study | 1800 | Measured Ld (range 47–68 B, 50–65 A | Range of sites with changes of −8 to +3 dB (mean −1 dB) | Complex set of measures including assessment of sensory experience and interferences of noise | Yes Infer from next column No statistical tests reported Percentage highly annoyed in line with an extra 6 dB from steady-state scale | Author reports ERFs of both response measures on LD for both B and A conditions After ERFs much lower, but somewhat parallel to the Before ERFs Shows strong excess response, equivalent to that of a 6 dB (8 dB for the second response measure) change in exposure No statistical test reported | This study has been included under Type A source interventions even though it is not fully clear exactly what intervention(s) were responsible for the change in response | ||
| Authors | Intervention & Study | N, Response Rate & Method | Exposure Levels | Change in Levels and Distribution of Change across Participants | Outcome Measure(s) before and after Outcomes | Did Outcome Change with Change in Exposure? Yes/No (Significance Tested?) | Before/after Outcome Change Compared to That Estimated from an ERF | Comments | Confounders Adjusted for in Analyses | ||
|---|---|---|---|---|---|---|---|---|---|---|---|
| Nature | Design | Before | After | ||||||||
| Amundsen, Klaeboe & Aasvang (2011) [27] | Norway Façade insulation | Two survey rounds: B&A Target; Control & Supplement groups. B & A surveys approx 6 mos. either side of intervention | Target: B: 168 Response rates 57% A: 161 (65%) Control: B: 469 (57%) A: 254 (65%) Supplement: 112 Mail survey | LAeq,24 h 61–78 outside. Calculated Mean 71 (Av inside level before change is 43) | Façade insulation reduces inside levels by 7 dB | –7 dB for indoor noise levels for all Ps in target group | Standard ISO annoyance scale (5 point verbal). %HA calculated using top two points of scale B: 42%HA A: 16%HA Control: B: 24%HA A: 29%HA | Yes Intervention resulted in substantial and significant (p < 0.001) reductions in individual annoyance scores | Authors chose not to compare their results with Miedema & Oudshoorn ERF [13]. Fitted a model of individual annoyance responses to outdoor levels for all Ps (target, control and supplementary: n = 738) with receiving the intervention as a dummy variable. Estimate of effect size −0.820 (p < 0.000) and 95% CI −1.170 to −0.470. Authors claim size of annoyance reductions with intervention is in line with ERF modelled from individual indoor levels. However this appears to be contradicted by the large reduction in the Target Group’s %HA (42% before intervention to 16% after). Summarised as ‘unclear’ | Authors note no explanation why %HA sig. lower in control than target before intervention; and second round higher than first in control | Gender, age, education level, marital status, access to a bedroom on the quiet side of the building, and sensitivity |
| Amundsen, Klaeboe & Aasvang (2013) [28] | See Amundsen, Klaeboe & Aasvang (2011) [27] above. Same study details but this was a repeat survey 2 year after first post-intervention study. Mailed to all Ps who had completed first post-intervention study. Number of participants now 104 (Response rate 58%) in target; 139 in Control; 63 in supplement | 2nd after-study: A: 16%HA | Result the same two years after initial After survey (p < 0.01) Additionally, repeated ANOVA was conducted on panel who had answered all three survey rounds (N = 212). Change in annoyance as a result of intervention significant in first (p < 0.0005) but not second (p = 0.33) after survey | In this repeated ANOVA, multivariate partial eta square = 0.44 | |||||||
| Bendtsen, Michelsen & Christensen (2011) [29] | Denmark Enlargement of motorway lanes but with dwelling insulation, barriers, & quiet pavement | B/A study 1 year before constr & 1 year after B/A gap 6 year | Q sent to 1200 dwel. In 6 areas out to800 m from motorway Response rates B:71% A: 65% 38% B&A Mail survey | Lden 45–65 Calculated. Unclear as to whether calculated levels included traffic sources other than motorway | Lden 45–60 Calculated. Not reported is whether some Ps may have experience increased after-levels | Reductions in extent of exposure 60–65 & 55–60 bands but increase in lower two bands. Reported only at population level. No indication of the change experienced by individual Ps | ISO scale (5 point verbal) % top three annoyance categories dropped, other two categories increased Top two categories (%HA—but authors did not use this term) dropped from 37% to 16% | Yes but no data presented of change in exposure of those reporting change in annoyance No statistical tests | n.a. | Classed as path intervention, even though includes quiet pavement as intervention Multiple sources of road traffic exposure—not just motorway | |
| Gidlöf-Gunnarsson, Öhrström & Kihlman (2010) [30] | Sweden Full-scale filling-in building gaps; barriers & housing improvement | B/A study 5 year apart | B: 160 Response rate: 56% A: 153 (47%) Mail survey | LAeq,24 h at façade 48–71 Calculated | –5 to −10 on exposed facades; −4 to −10 courtyards | ISO scale (5 point verbal) %Annoyed cut-off includes top 3 points.(Note: NOT %HA) For Ps highly exposed and with large change: B: 84% Annoyed A: 28% Annoyed For P’s with less change: B: 45–55% Annoyed A: 21–22% Annoyed | Yes Large and consistent reductions in %Annoyed associated with reduction in noise exposure (but no statistical tests) | Authors refer to Öhrström [7] who cites ERF of Miedema & Vos [12] For Ps in most exposed part of study, B/A 84/28%Annoyed outcomes both higher than estimated by this ERF, but also show much larger decrease in response than estimated by ERF. Response to change in same direction as estimated by ERF, but steeper, indicating excess response. (But no statistical tests) | This was a reconstruction project that included many other environmental changes—not just change in noise exposure (Ps reported 36% increase in overall satisfaction with area) | ||
| Kastka, Buchta, Ritterstaedt, Paulsen & Mau (1995) [31] | Germany Noise barriers at 12 sites + 2 control sites | B/A study 1–2 years B, 8–10 years A barriers were built | 283 B Response rate 59% 212 A (72%) 97 Ps both B&A | Leq,D B 50–70 Measured | Leq,D A:51–66 Measured | –13 dB close to barriers to 0 dB at 200 m Av. Change −4.1 dB | (1) 5 point verbally labelled disturbance scale (2) %HA calc. as top two responses on scale in (1) (3) factor K1: sensory-perceptional and emotional experience of traffic noise (0–10) (4) factor K2: noise interferences | Yes All response variables show significant reductions, e.g., %HA B: 64%; A:35% (chi2 = 39.69 p < 0.005) Control sites response variables same B&A | Authors calculated an ERF using the steady-state before-responses. For this, mean disturbance scores (and, separately, other outcome variables including %HA) were regressed against before Leq,D Mean (After) disturbance scores were compared to those estimated by this ERF. At 11 of the 12 sites, estimated mean disturbance score was greater than observed. Difference was statistically significant (matched pair t-test, df = 11, p < 0.05). Response to change in same direction as estimated by ERF, but steeper, indicating excess response following barrier construction | Authors reported extensive additional analyses They suggest no simple causal relation between noise level reduction and annoyance reduction | |
| Nilsson & Berglund (2006) [32] | Sweden Noise barrier | B/A study + control 9 mos. B; 15 mos. A Repeated measures on 59%, 46% only | Before 304 Response rate 77% (241 control Response rate 66%) (After Response rates: 72%, 69%) Self-administered | Lden 70 to <45 Calculated | Lden 62.5 to <45 Calculated | –7.5 dB; with reducing change out to 100 m from barrier. Distribtn of change was: –7.5 dB 52 Ps −5 dB 47 Ps −2.5 dB 31 Ps | Visual analogue scale 7-point annoyance scale. Transformed to 0–100 scale. Reports %HA as above cut-off 72 | Yes Reductions in %HA were significant (p < 0.05, sign-test) for three groups of Ps within 100 m of roadway Control: no diff in B&A %HA | ERF cited was Miedema & Oudshoorn (2001) [13] Reports both B&A %HA agree with prediction by ERF (no statistical test) Response to change same direction and magnitude as estimated by ERF | Outdoor annoyance did not conform to ERF | |
| Vincent & Champelovier (1993) [33] | France Noise barriers and low noise road surface | B/A study at 2(?) sites. | 75 Response rate not reported | Leq,12 h 65.1 Location of measurement site relative to Ps not reported | Leq,12 h 56.3 Location not reported | Change in levels was variable with distance from road: −10 to −3 dB between 10 and 100 m. | % highly annoyed (scale and definition of HA not reported). B: 22%HA A: 8%HA | Yes (but no statistical test) | No comparison of change to any ERF | Author notes that response to ‘Often disturbs sleep’ dropped from 13% to 6% | |
| Authors | Intervention & Study | N, Response Rate & Method | Exposure Levels | Change in Levels and Distribution of Change across Participants | Outcome Measure(s) before and after Outcomes | Did Outcome Change with Change in Exposure? Yes/No (Significance Tested?) | Before/after Outcome Change Compared to That Estimated from an ERF | Comments | Confounders Adjusted for in Analyses | ||
|---|---|---|---|---|---|---|---|---|---|---|---|
| Nature | Design | Before | After | ||||||||
| Gidlöf-Gunnarsson, Svensson, & Öhrström (2013) [8] | Stockholm Opening urban road tunnel reduced traffic on road system | B&A Exposure and control groups 1 year B & 1 year A Repeated measures | Exposure group: B:758 Response rate 55% A: 493 (75%) Control: B: 311 A: 165 Analysis based on 658 in both B&A Mail survey | LAeq,24 h, 48–71 Control: 52–66 Measured/some estimated | See next column | 194 Ps: −11 to −17 dB 225 Ps: –3 to −5 dB Control: no change in levels | ISO scale (5 point verbal) %Annoyed (note: not %HA) calculated using top three points of scale Exposure group: B: 60% Annoyed A: 20% Annoyed Control: B: 24% Annoyed A: 29% Annoyed | Yes Intervention resulted in substantial and significant (McNemar-test, p < 0.001) reduction in annoyance over the exposure area—but no change in control area | Authors cite Miedema & Oudshoorn (2001) ERF [13]—but refer only to %Annoyed, not %HA (uses Lden = LAeq,24 h + 4) Authors also fitted a model of individual annoyance responses to exposure levels for all Ps, but using the exposure levels AFTER the intervention (n = 437: excluding Ps in one study sub area and control). Authors report that these modelled outcomes fit ERF for %Annoyed in Miedema & Oudshoorn (2001) [13] However, %Annoyed with exposures BEFORE the intervention was very much higher than indicated by ERF. Thus response to change in same direction as estimated by ERF, but steeper, indicating excess response | Authors suggest their modelling of %Annoyed on after-levels indicates no change-effect. They noted, but did not investigate, the excess response in the overall before-to-after change Authors reported ‘dramatic’ improvement in living environment for Ps with largest noise reduction (note: traffic on nearest road dropped from 60,000 veh/day to zero) | |
| Öhrström (2004) [7] Öhrström & Skånberg (2000) [34] | Gothenburg Major traffic reduction by construction of tunnel + narrowing of surface roadway | B/A study + control 1 year. B&A tunnel opening. Repeated measure | 50 (92 control) Response rate 62% ~15% between surveys Delivered survey forms | 67 (range 56–69) Control Av. 45 Calculated Note range of before levels | Av. LAeq,24 h 55 (range 44–57) Control Av. 44 Calculated | –12 dB Av LAeq,24 h reduction Distribution of magnitude of the change across individual Ps not reported | %HA based on top category of 4 point verbal scale B: 58%HA A: 7%HA Control B&A 1.1%HA to 0%HA Mean Annoyance on ISO also reported (B: 8.9; A: 1.4) | Yes Sig. diff. (p < 0.001) in B&A %HA Sig. diff. (paired t-test, p < 0.001) in B&A mean annoyance scores | Author refers to ERF of Miedema & Vos (1998) [12]. This ERF indicated %HA should move from approx. 30%HA to approx. 10%HA for the change in exposure experienced in this study. Observed percentages were 58%HA to 7%HA measured in the study group Thus response to change much steeper than ERF indicating large excess response | Note: author claimed no excess response—based on after levels Author speculates large change in response may also be related to air quality, vibration and appearance changes | |
| Authors | Study | N, Response Rate & Method | Exposure Levels | Outcome Measure(s) | Did Outcome Change with ‘Intervention’? Yes/No Strength of Effect | Comments | Confounders Adjusted for in Analyses | |
|---|---|---|---|---|---|---|---|---|
| Nature | Design | |||||||
| de Kluizenaar et al. (2013) [35] | Questionnaire survey | Cross- sectional Stratified sample on age and district | 1967 50% RR | For each dwelling, exposure levels were calculated at the most and least exposed façade (Lden,most and Lden,least, respectively). 40–70 dB | Annoyance ISO scale (0–10 point verbal) | Yes Stronger association between noise and annoyance for those: who have relative quiet available (>10 dB difference between most and least exposed façades). Beta = 0.099 SE = 0.012, p ≤ 0.0001, who have higher noise level at the least exposed façade. Beta = 0.035, SE = 0.016, p ≤ 0.05) No interaction was confirmed | Age, gender, education, and annoyance from neighbour noise and ‘humming’ noise | |
| Babisch et al. (2012) [36] | (HYENA) study is a large-scale multi-centered study carried out simultaneously in 6 European countries Prevalence of (designed as a hypertension study with air and road traffic sources) Study examined many modifiers. Here only the result wrt quiet side and living room facing the street are reported | Cross-sectional in stratified random samples around 6 airports (but response to road traffic noise examined here) | 4861 (45–70 years old) 30–78% RR | LAeq24 h 45–65 road traffic noise | Annoyance ISO scale (0–10 point verbal) | Yes Location of the bedroom resulted in decreased annoyance at night (Beta = 1.25, CI = 1.12–1.38 vs. Beta = 0.81, CI = 0.65–0.97; interaction p < 0.001). per 10 dB Those with location of the living room facing the street were more annoyed during daytime with increasing road traffic noise level (Beta = 1.63, CI = 1.50–1.76) than those whose living room was located on the back side (Beta = 1.44, CI = 1.18–1.69); interaction p = 0.007 | Samples based on air traffic noise but models adjusted for this | Full models, both continuous noise levels (Air and Road), type of housing, location of rooms shielding due to obstacles, visibility of the postal street, window opening habits, type of windows length of residence, time spent in the living room on workdays, time spent in the bedroom on workdays noise reducing remedies, building modifications to reduce noise, self reported hearing problems, rooms per occupant |
| van Renteghem & Botteldooren (2012) [37] | Belgium Effect of presence of a quiet façade on annoyance in high noise exposure dwellings | Comparison: of responses in dwellings with and without a quiet side All dwellings had noisy side: half also had a quiet side | 100 Response rate 70% Interviews | Lden. 65–75 at most exposed façade—all dwellings. Half of dwellings also had quiet side Both levels sourced from END maps | ISO scale (5 point verbal) Analysis used mid category cut-off ‘at least moderately annoyed’ | Yes Absence of quiet façade results in increased ‘at least moderately annoyed’ respondents: Odds ratio 3.3 when adjusted for noise sensitivity (95% CI 1.35–8.01) When people actually used the bedroom at the quiet side OR = 10.6.(95% CI 2.0–56) | Quiet side defined as a front/back façade level difference >10 dB | Noise sensitivity, window closing, bedroom on a quiet side,, front-façade Lden |
| de Kluizenaar et al. (2011) [38] | Questionnaire survey | Data drawn from a prospective cohort study For a postal questionnaire survey | 18 973 (15–74 years) 70% RR | For each dwelling, exposure levels were calculated at the most and least exposed façade (Lden,most and Lden,least, respectively). 40–70 dBA (Estimates available for N = 17,650) | Total Annoyance Dichotomous scale | Yes Stronger association between noise and annoyance for those who have relative quiet available (>10 dB difference between most and least exposed façade) for all levels >45 dB Ors range: 1.33–6.54 (all significant) Interaction term significant for two noise categories: OR = 3.177 for Lden interval 57.5–62.5; OR = 5.584 for Lden >60 | Age, sex, body mass index, exercise, marital status, work situation, financial difficulties, alcohol use, education | |
| Gidlöf-Gunnarson & Öhrström (2010) [30,39] | Sweden Effect of appearance of quiet side courtyard on annoyance in dwelling with high noise exposure | Comparison: of responses in dwellings with and without an attractive courtyard All dwellings had noisy side and a quiet side | 385 Response rate 59% Mail survey | LAeq,24 h Calculated levels Noisy façade in two categories: 58–62 dB (n = 241) and 63–68 dB (n = 144). All had access to a ‘quiet side’ 239 Ps had low quality courtyard, 146 had high quality courtyard | ISO (5-point verbal) scale Analysis used mid category cut-off at least moderately annoyed Percentage of noise annoyed residents was significantly lower across the two sound level categories among those who had high (16% and 29%) than low-quality quiet courtyards (27% and 42%) | Yes Percentage annoyed depended on noisy façade exposure level, but was less when quality of courtyard was high, rather than low Odds Ratio for courtyard quality was 0.59 (95% CI: 0.36–0.96) | Quiet side defined as LAeq,24 h < 48 including façade reflection Quality of courtyard was assessed objectively. | Type of housing; Lay out and population characteristics: were comparable in the two study groups |
| Gidlöf-Gunnarsson, & Öhrström (2007) [40] | Sweden Nearby green area | Green versus non green Quiet site available versus not available All areas above 60 dB Most aspects kept constant at similar noise exposures, road traffic dominating source | 500 Response Rate 59% Interviews | >60 dB | ISO scale (0–10) | Yes Significant associations emerged for availability to green areas (p < 0.001) and for access to a quiet side (p = 0.001), However, the effect sizes were low (partial η2 = 0.029 and 0.023, respectively) | Interaction quiet side and green space not tested | Age |
| Authors | Intervention & Study | N, Response Rate & Method | Exposure Levels | Change in Levels and Distribution of Change across Participants | Outcome Measure(s) before and after outcomes | Did Outcome Change with Change in Exposure? Yes/No (Significance Tested?) | Do before and after Outcomes fit with Relevant ERF | Comments | Confounders Adjusted for in Analyses | ||
|---|---|---|---|---|---|---|---|---|---|---|---|
| Nature | Design | Before | After | ||||||||
| Stansfeld, Haines, Berry & Burr (2009) [19] | UK Bypass roads constructed reducing traffic flow in three small towns | B/A study B: 1 year A: 6–7 mos | 175 exposed 184 control Response rates B: 70% A: 74% 67 Ps at exposed area follow-up Delivered questionnaire | L10,3 h (& Leq,3 h) Exposed: 75–78 Control: 55–58 Measured some train noise | See next column | Change in L10,3 h of −2 to −4 dB suggested for most locations No reporting of distribution of these small changes across Ps | Jenkins Sleep Scale No significant change in sleep total score | No change in sleep disturbance Explanation was that the change was too small to be noticed | n.a. | Change in traffic flow on source roadways were small: 24 h flow changed from 26 k to 23 k veh/day, and 24 k to 21 k veh/day | SES |
| Authors | Intervention & Study | N, Response Rate & Method | Exposure Levels | Change in Levels and Distribution of Change across Participants | Outcome Measure(s) before and after Outcomes | Did Outcome Change with Change in Exposure? YES/NO (Significance Tested?) | Before/after Outcome Change Compared to that Estimated from an ERF | Comments | Confounders Adjusted for in Analyses | ||
|---|---|---|---|---|---|---|---|---|---|---|---|
| Nature | Design | Before | After | ||||||||
| Amundsen, Klaeboe & Aasvang (2013) [28] | See Table 4 | LAeq,24 h, –7 dB for indoor noise levels for all Ps in target group | Several sleep questions, but ‘sleep disturbed’ based on Yes/No response to either of: ‘I am disturbed by traffic noise’ or ‘I wake up because of traffic noise’ B: 45% disturbed A: 22% disturbed | YES %Sleep Disturbed dropped after intervention (p < 0.0005 McNemar’s test) No change in control group Results stayed the same two years after | n.a. | Overall sleep quality also assessed (top two points of 5-point sleep quality scale = ‘poor sleep’ Intervention resulted in less ‘poor sleep’ similar to change in %Sleep Disturbed | Gender, age, education level, marital status, access to a bedroom on the quiet side of the building, and noise sensitivity | ||||
| Bendtsen, Michelsen & Christensen (2011) [29] | See Table 4 | Lden Reductions in extent of exposure 60–65 & 55–60 bands but increase in lower two bands | Unclear. Appears to be based on binary response to two questions: ‘difficulties in falling asleep’ & ‘wake up at night’ | Yes Ps. Reported sleep disturbance (both questions) dropped B: 14 & A: 7% No statistical tests | n.a. | No data presented of change in exposure of those reporting change in sleep | |||||
| Authors | Intervention & Study | N, Response Rate & Method | Exposure Levels | Change in Levels and Distribution of Change across Participants | Outcome Measure(s) Before and after Outcomes | Did Outcome Change with Change in Exposure? Yes/No (Significance Tested?) | Before/after Outcome Change Compared to that Estimated from an ERF | Comments | Confounders Adjusted for in Analyses | ||
|---|---|---|---|---|---|---|---|---|---|---|---|
| Nature | Design | Before | After | ||||||||
| Öhrström (2004) [7] Öhrström & Skånberg (2000) [34] | Gothenburg Major traffic reduction by construction of tunnel + narrowing of surface roadway | B/A study + control 1 year. B&A tunnel opening. Repeated measure | 50 (92 control) Response rate 62% ~15% between surveys Delivered survey | Av. LAeq,24 h 67 (range 56–69) Control Av. 45 Calculated Note range of before levels | Av. LAeq,24 h 55 (range 44–57) Control Av. 44 Calculated | 12 dB Av LAeq,24 h reduction Distribution of magnitude of the change across individual Ps not reported | 15 questions on sleep and sleep environment. Ps asked to compare sleep and sleep behaviour with how it was one year earlier—before intervention | YES Sig. diff. (p < 0.01) in % exposed Ps reporting improvement, compared to control, in following: sleep with open windows time for falling asleep wakes up sleep quality tiredness in morning | n.a. | ||
| Öhrström & Skanberg (2004) [41] | See row above: Öhrström (2004) [7] Öhrström& Skånberg (2000) [34] Substudy of above. Exposed area 25–67 m from roadway (11 Ps); control area 125–405 m from roadway (13 Ps) Longitudinal study: B & two A: 5 mos and 17 mos after intervention | L Aeq,24 h outside Exposed 11 Ps –10 to −13 dB Control 13 Ps Most 0 to −1 (one P each −4 and −5) | Sleep questionnaire & wrist actigraphy After outcome: Questionnaire: reduced difficulty falling asleep & better sleep quality Actigraphy: fewer long wake episodes & shorter sleep times | Yes Questionnaire & actigraphy showed Ps significant reduction of time in bed (increased sleep efficiency) (p = 0.02); increase in subjective sleep quality and less time needed to fall asleep | n.a. | Primary purpose was to test if there was a difference between sleep questionnaire and sleep actigraphy | |||||
| Authors | Study | N, Response Rate & Method | Exposure Levels | Outcome Measure(s) | Did Outcome Change with ‘Intervention’? Yes/No | Before/after Outcome Change Compared to that Estimated from an ERF | Comments | Confounders Adjusted for in Analyses | |
|---|---|---|---|---|---|---|---|---|---|
| Nature | Design | ||||||||
| van Renteghem & Botteldooren (2012) [37] | Belgium Effect of presence of a quiet façade on sleep in dwellings with high noise exposure | Comparison: of responses in dwellings with and without a quiet side All dwellings had noisy side: half also had a quiet side | 100 Response rate 70% Interviews | Lden. 65–75 at most exposed façade All dwellings Half of dwellings also had quiet side Both levels sourced from END maps | I A Na: sleep indicators: difficulties in falling asleep, awakening due to noise and window open (4 point scale: never, sometimes, a lot, always) | Yes Absence of quiet façade results in increased ‘at least sometimes’ respondents: Odds ratio for falling asleep 5.5 (95% CI 0.7–44.1) | n.a. | Quiet side defined as a front/back façade level difference >10 dB | Noise sensitivity, window closing, bedroom on a quiet side, front-façade Lden |
| Authors | Study | N, Response Rate & Method | Exposure Levels | Outcome Measure(s) | Did outcome Change with ‘Intervention’? Yes/No Strength of Effect | Comments | Confounders Adjusted for in Analyses | |
|---|---|---|---|---|---|---|---|---|
| Nature | Design | |||||||
| Babisch, Wölke, Heinrich & Straff (2014) [42,43] | Germany Effect of quiet side and type of road on blood pressure | Major and secondary roads, quiet side available or not | 1770 (Major road 753, Side street 1017) Response Rate not reported | Lden Major road: mean 67 s.d. 7.2 Side street: mean 49 s.d. 4.7 | Self-reported hypertension. | 11% increase of the risk of hypertension per increment of 10 dB(A) of the road traffic noise level was found Yes 31% higher risk of hypertension along major roads compared to those who lived in side streets In people that lived on major roads, an odds ratio of OR = 1.736 (95% CI = 1.005–2.997, p = 0.048) was found for the extreme comparison between both rooms on the front or the rear side of the house | Location of living room more important than location of the bedroom (not in line with other studies) | Age, gender, education, body mass index, physical activity at leisure, alcohol intake, family history of hypertension and occupants per room |
| Babish et al. (2012) [36] | (HYENA) study was a large-scale multi-centered study carried out simultaneously in 6 European countries Prevalence of (designed as a hypertension study with air and road traffic sources). Study examined many modifiers. Here only the result wrt quiet side and living room facing the street are reported | Cross-sectional in stratified random samples around 6 airports | 4861 (45–70 years old) 30–78% RR | LAeq24 h 45–65 road traffic noise | Hypertension based on blood pressure measurements during home visits (defined as: a systolic BP ≥ 140 or a diastolic BP ≥ 90) | No Location of the bedroom did not result in significantly increased or decreased hypertension (OR = 1.09, 95% CI = 0.98–1.22 vs. OR = 1.10, 95% CI = 0.94–1.28; interaction p = 0.555) Location of the living room facing the street did not show an increase in the risk of hypertension with increasing road traffic noise level (OR = 1.06, 95% CI = 0.96–1.17) | Samples based on air traffic noise but models adjusted for this | Full models, both continuous noise levels (Air and Road) type of housing location of rooms, shielding due to obstacles, visibility of the postal street, window opening habits, type of windows length of residence, time spent in the living room on workdays, time spent in the bedroom on workdays noise reducing remedies, building modifications to reduce the noise, self-reported hearing problems, rooms per occupant |
| Lercher et al. (2011) [44] | Oral and telephone interviews by means of a structured questionnaire | Cross sectional | 1653 first wave, 252 second wave 35% & 41% RR | Lden 30–78. Calculated. | Self-reported hypertension | No Results show that participants with bedrooms facing toward a quiet yard reveal a clear trend, but non-significant, toward a reduction in hypertension diagnoses in the ALPNAP-study (OR = 0.78, 95% CI = 0.59–1.05). | Age, sex, BMI, family history, education, health status, duration of living, age | |
| Bluhm et al. (2007) [45] | Questionnaire survey | Cross-sectional | 667 77% RR | Estimated noise levels dB(A)) annual mean LAeq24 h. Individuals were classified into exposure categories of 5 dBA, from 45 dB(A) to 0.65 dB(A) | Self-reported hypertension | Yes Stronger association between noise and hypertension for those whose bedroom windows was facing the street (OR 1.82; 95% CI 1.22 to 2.70). Also a stronger effect for those who did not have triple glazed windows (OR 1.66; 95% CI 1.17 to 2.34) | Note: The effect of window glazing is ‘indirect evidence’ for a path effect. | Age, type of residence, occupation, smoking (others included but not significant) |
| Authors | Intervention & Study | N, Response Rate & Method | Exposure Levels | Change in Levels | Outcome Measure(s) before and after Outcomes | Did Outcome Change with Change in Exposure? Yes/No (Significance Tested?) | Before/after Outcome Change Compared to That Estimated from an ERF | Comments | Confounders Adjusted for in Analyses | ||
|---|---|---|---|---|---|---|---|---|---|---|---|
| Nature | Design | Before | After | ||||||||
| Asensio, Recuero, & Pavón (2014) [46] | Spain 5 airports Window insulation as part of NIP (Noise Insulation Program) | After study only—following insulation. Time since intervention not reported Before by retrospective assessment | 689 Random selection from buildings that had been insulated Response rate not reported Telephone interviews | Lday > 65 Lnight > 55 Calculated Actual exposures not reported | Not reported | Not reported | ISO annoyance scale (0–10) Before annoyance asked in retrospect during after-survey, followed immediately by after-annoyance question Annoyance for Day, for Night, & outdoors in neighbourhood were separate questions. Mean annoyance scores for each of these were 8.5, 7.6 and 9.0 | Yes Mean Day and Night annoyance scores dropped 3.7 and 3.4 points on annoyance scale. (Note: retrospective Before annoyance) No statistical test reported. There is a difference in the distribution of annoyance reductions across the five airports | n.a. | Primary purpose was assessment of the overall NIP process | |
| Authors | Intervention & Study | N, Response Rate & Method | Exposure Levels | Change in Levels and Distribution of Change across Participants | Outcome Measure(s) Before and after Outcomes | Did Outcome Change with Change in Exposure? Yes/No (Significance Tested?) | Before/after Outcome Change Compared to That Estimated from an ERF | Comments | Confounders Adjusted for in Analyses | ||
|---|---|---|---|---|---|---|---|---|---|---|---|
| Nature | Design | Before | After | ||||||||
| Brink, Wirth, Schierz, Thomann & Bauer (2008) [47] | Zurich Relocation of flights in shoulders (early morning and late evenings) | B&A study Effectively two cross sectional studies from which change sample was located 2 years gap between surveys | 394 change respondents (a subgroup of the 1816 Ps who were interviewed twice 1816 Ps in first ERF study/1719 in second (Response rates 54%/36%) mail & tel | Lden (and others) over range 30–70 dB Calculated | Change measured in LAeq over the shoulder periods 6–9 a.m. and 9–12 p.m. Range of intervention change in this indicator was −12 dB to +12 dB, but between −3 dB and +3 dB for ~70% of the 394 Ps who experienced the intervention | ISO 0–10 numerical scale and 5 point verbal scale. HA cutoff was 8 | Yes Logistic regression models of prob. High annoyance show change is a significant parameter (Effect 0.16 p = 0.028 for morning change; Effect = 0.16, p < 0.001 for evening change) in addition to LAeq | ERFs for logistic regression of HA obtained from random sample around Zurich airport averaged across 2001 and 2003 surveys. Excess response ERFs developed that have Lden and change in LAeq,3 h as independent predictors. The ERF in this model is different to the one developed above, demonstrating an effect of change Demonstrated descriptively that Ps who experienced an increase through the intervention exhibited quite strong excess response | ERF developed in this study is approx. parallel to EU position paper ERF [14], but shifted 5–10 dB to left. Thus %HA around Zurich higher than predicted | Military aircraft noise was accounted for by exclusion; year of survey | |
| Breugelmans et al. (2007) [48] | Amsterdam New runway opening Step-change increase in exposure Focussed on changes in outcomes | Had been 3 cross sectional surveys 1998, 2002 & 2005 2002 used as starting point for panel study Four rounds of panel survey | 640 In area with forecast change >3 dB Half surveyed in different seasons 478 completed all 4 waves Mail survey | Lden Lnight Calculated For the three subgroups: 53 61 55 Change in exposure is a noise indicator | 57 55 54 | Based on after-levels, Ps to three subgroups based on change in Lden. >+1.5 range: 1.5 to 13.7 (mean = +2.5) n = 118 <−1.5 range: −2.2 to −1.5 (mean = −1.9) n = 117 Control range: −1.4 to +1.4 (mean = 0.1) n = 405 | ISO 0–10 scale. Reports % ‘severely’ annoyed (=%HA?) | Yes %HA does not change for control group. %HA does change for increase group (%HA changes from <40% to >60% (difference significant based on plotted Cis) | 2002 panel survey before-results used to derive ERF Observed %HA control and decrease subgroups are in agreement with outcomes estimated from this ERF Observed %HA increase subgroups exceed outcome estimated from ERF Odds Ratio per 3 dB change = 0.44)—slightly less after control for confounders. Stronger association found with change over past 12 months (OR = 1.73) Excess response present for increase subgroup still present 3 years after intervention (one inconsistent result in fourth panel survey) | Part of Health Impact Assessment Schiphol Airport program Excess response was not explained by non-acoustical factors | Age, sex, ethnicity, home ownership, degree of urbanization, time of residence, living satisfaction, noise sensitivity, expectations about the airport and the neighbourhood, coping behaviour, fear for aircraft crashes, and a negative attitude towards the airport |
| Fidell, Silvati, and Haboly (2002) [49] | Vancouver Step change with new runway Change in aircraft operations | B/A study Independent samples, not a panel 15 mos B and 21 mos A. 3 year gap | B: 1000 A: 1067 Located in 7 areas Telephone interviews | Ldn 44–71 But most areas experienced 44 to 54 Calculated using INM | 44–70 | Ps in 5 areas experience effectively no change in exposure. One area experienced +7, another +3 | Filter question as to whether bothered or annoyed in last year. If yes, then 4 point verbal annoyance scale. HA cutoff at top two points (very, extremely) Reported %HA each area B & A Most areas, no change. See next column | Yes +7 dB area: B: 11%; A: 52% (chi2 59.8, p < 0.007) +3 dB area: B: 0%; A: 18% (chi2 19.7, p < 0.007) | Author cites FICON ERF [11] For the two sites with major increase, the %HA is higher than predicted by the above ERF—and outside of a one s.d. error of the mean value of the ERF. Author notes excess response in only +7 dB area—but it is also present in the +3 dB area too Response to change in same direction as estimated by ERF, but steeper, indicating excess response | Author comments: greater-than-predicted increase in the prevalence of annoyance cannot be attributed to change in noise exposure alone | Attitude; dependency on airport; fear of crashes |
| Authors | Intervention & Study | N, Response Rate & Method | Exposure Levels | Change in Levels and Distribution of Change across Participants | Outcome Measure(s) before and after Outcomes | Did Outcome Change with Change in Exposure? Yes/No (Significance Tested?) | Before/after Outcome Change Compared to That Estimated from an ERF | Comments | Confounders Adjusted for in Analyses | ||
|---|---|---|---|---|---|---|---|---|---|---|---|
| Nature | Design | Before | After | ||||||||
| Breugelmans et al. (2007) [48] | Amsterdam New runway opening Step-change increase in exposure. Focused on changes in outcomes | See study details as reported in Table 13 (annoyance) Calculated Lnight and change in Lnight were the exposure measures | Sleep disturbance 0–10 scale | Yes %Highly Sleep Disturbed does change for increase group | 2002 panel survey before-results used to derive ERF for sleep disturbance Observed %Highly Sleep Disturbed is consistent with that estimated from above ERF Sleep disturbance response to change as estimated by ERF | Wide range of confounders incorporated into the analysis. See Table 13 | |||||
| Fidell, Silvati, & Haboly (2002) [49] | Vancouver Step change with new runway Change in aircraft operations | See study details as reported in Table 13 (annoyance) | Filter question, then: ‘bothered or annoyed in last year’ If Yes, Has your sleep been disturbed? Y/N Reported %sleep disturbed each area B & A Most areas, no change. See next column | Yes +7 dB area: B: 16%; A: 43% (chi2 27.5, p < 0.007) +3 dB area: B: 5%; A: 17% (chi2 8.2, p < 0.007) | n.a. | See Table 13 | |||||
| Authors | Intervention & Study | N, Response Rate & Method | Exposure Levels | Change in Levels and Distribution of Change across Participants | Outcome Measure(s) before and after Outcomes | Did Outcome Change with Change in Exposure? Yes/No (Significance Tested?) | Before/after Outcome Change Compared to That Estimated from an ERF | Comments | Confounders Adjusted for in Analyses | ||
|---|---|---|---|---|---|---|---|---|---|---|---|
| Nature | Design | Before | After | ||||||||
| Hygge, Evans & Bullinger (2002) [50] | Munich Opening new airport closing old airport | Prospective cohort study +control matched om SES 3 data collection waves B (6 mos) & two A (1&2 year) | 326 (mean age 10.4 years) Memory and Reading paper and pencil tests High response rates | Measured LAeq,24 h at school only Increase: 53 (n = 111) Decrease: 68 (n = 65) Control: (n = 107) | 62 54 | +9 new airport –14 old airport | Long and short term memory; reading; attention; speech perception | Yes Effects on reading, memory and speech perception, not attention. Effects disappeared when old airport closed; emerging after the new airport opened Various statistical tests including interactions. | n.a. | Children tested in soundproof caravan Suggest effects may be reversible | Confounds ruled out by design: ethnicity; mother’s education; number of family members; occupation; attrition |
| Authors | Intervention & Study | N, Response Rate & Method | Exposure Levels | Change in Levels and Distribution of Change across Participants | Outcome Measure(s) before and after Outcomes | Did Outcome Change with Change in Exposure? Yes/No (Significance Tested?) | Before/after Outcome Change Compared to That Estimated from an ERF | Comments | Confounders Adjusted for in Analyses | ||
|---|---|---|---|---|---|---|---|---|---|---|---|
| Nature | Design | Before | After | ||||||||
| Möhler et al. (1997) [51] | Germany Rail grinding to reduce railway noise emissions | B and two A. 1 mo. B; 1mo A. 3rd round was 1 year after 2nd round | B. 81 A. 64 A2. 46 questionnaire | Ldn 55–75 Calculated, with some measurement | Ldn 50–65 | −7 to −8 dB Distribution of change across Ps not reported | 0–10 total annoyance scale Reported as mean annoyance scores for group Difference in mean reported | Yes Difference between B & A = 0.6 (t = 2.07, df = 63, p < 0.05) Difference between B & A2 = 0.8 (t = 2.26, df = 45, p < 0.05) No difference between A1 & A2 | n.a. | ||
| Authors | Intervention & Study | N, Response Rate & Method | Exposure Levels | Change in Levels and Distribution of Change across Participants | Outcome Measure(s) | Did Outcome Change with Change in Exposure? Yes/No | Before/after Outcome Change Compared to That Estimated from an ERF | Comments | Confounders Adjusted for in Analyses | ||
|---|---|---|---|---|---|---|---|---|---|---|---|
| Nature | Design | Before | After | ||||||||
| Lam & Au (2008) [52] | Hong Kong Opening of new 11 km urban rail line | 6 mos B and two A. 2nd round 3 mo after. 3rd round was 1 year after 2nd round. | 6000 invitation letters. Response rate not reported Face-to-face interviews B and A1 Telephone interview A2 | Estimation of noise + validating measurements Noise mapping, validating measurement | Introduction of railway lead to very small increase in total noise exposure. LAeq,30 min. 70% Ps experienced <+1 dB change. Others had +2 to +4 dB change | n.a. Results showed that original noise from road traffic overwhelmed the train noise for effectively all Ps | n.a. | There was a parallel survey over same area that experimentally manipulated information supplied to Ps about noise mitigation. This component is not reported here | |||
| Authors | Intervention & Study | N, Response Rate & Method | Exposure Levels | Change in Levels and Distribution of Change across Participants | Outcome Measure(s) before and after Outcomes | Did Outcome Change with Change in Exposure? Yes/No (Significance Tested?) | Before/after Outcome Change Compared to That Estimated from an ERF | Comments | Confounders Adjusted for in Analyses | ||
|---|---|---|---|---|---|---|---|---|---|---|---|
| Nature | Design | Before | After | ||||||||
| Schreckenberg et al. (2013) [53] | Germany Rail grinding plus provision of information to Ps | BA. 3 mos B; 1–2 mos A. Part given information about rail grinding, part not given information. Randomly distributed over an information and non-information group | B: 411 A: 340 (163 informed area; 177 uninformed area) Response Rates: 73% & 83%) Repeated interviews | Not reported | Emission levels LAeq (day and night)reduced by only 1–2 dB | 5 point verbal annoyance scale and range of disturbances Authors’ conclusion based on the above | Rejected that rail disturbances dropped because of noise level drop. Yes However, author suggests disturbances are less where Ps have been given information compared to not given information | n.a. | |||
| Number of Papers | Evidence 1 That Health Outcome Changed | Observed Magnitude of Change in Health Outcome | |||||
|---|---|---|---|---|---|---|---|
| YES | NO | n.a. | Magnitude at Least as Predicted by ERF | Excess 2 Response | n.a.3 | ||
| ROAD TRAFFIC NOISE SOURCES (33) | |||||||
| Outcome: Annoyance (23) | |||||||
| A Source Intervention | 9 | ******* | ** | ******* | ******* | ** | |
| B Path Intervention | 6 | ****** | **** | ** ? | ** | ||
| C New/Closed Infrastructure | 2 | ** | ** | ** | |||
| D Other physical | 6 | ****** | |||||
| Outcome: Sleep Disturbance (6) | |||||||
| A Source Intervention | 1 | * | * | ||||
| B Path Intervention | 2 | ** | ** | ||||
| C New/Closed Infrastructure | 2 | ** | ** | ||||
| D Other physical | 1 | * | |||||
| Outcome: Cardiovascular Effects (4) | |||||||
| D Other physical | 4 | *** | * | ||||
| AIRCRAFT NOISE SOURCES (7) | |||||||
| Outcome: Annoyance (4) | |||||||
| B Path Intervention | 1 | * | * | ||||
| C New/Closed Infrastructure | 3 | *** | *** | *** | |||
| Outcome: Sleep Disturbance (2) | |||||||
| C New/Closed Infrastructure | 2 | ** | * | * | |||
| Outcome: Cognitive Development in Children (1) | |||||||
| C New/Closed Infrastructure | 1 | * | * | ||||
| RAIL NOISE SOURCES (3) | |||||||
| Outcome: Annoyance (3) | |||||||
| A Source Intervention | 1 | * | * | ||||
| C New/Closed Infrastructure | 1 | * | * | ||||
| E Education/Communication | 1 | * | |||||
| Sequential Measurements | Before−1 | Before0 | After1 | After2 ... |
|---|---|---|---|---|
| Time | t−1 | t0 | t1 | t2 … |
| noise exposure | L−1 | L0 | L1 | L2 … |
| Effect Measures (or Respondent Attribute Measures) | ||||
| annoyance | A−1 | A0 | A1 | A2 |
| activity interference | Act1 | Act0 | Act1 | Act2 |
| retrospective annoyance | RA01 1 | RA02 | ||
| noise sensitivity | Sens-1 | Sens0 | Sens1 | Sens2 |
| attitudes to authorities etc. | Ats−1 | Ats0 | Ats1 | Ats2 |
| opinion of neighbourhood | Neigh−1 | Neigh0 | Neigh1 | Neigh2 |
| coping strategies | Cop−1 | Cop0 | Cop1 | Cop2 |
| prior knowledge | … | X10 2 | … | … |
| expectations | … | Y10 2 | … | … |
| Steady-state Controls | Before Control | After Control | ||
© 2017 by the authors. Licensee MDPI, Basel, Switzerland. This article is an open access article distributed under the terms and conditions of the Creative Commons Attribution (CC BY) license (http://creativecommons.org/licenses/by/4.0/).
Share and Cite
Brown, A.L.; Van Kamp, I. WHO Environmental Noise Guidelines for the European Region: A Systematic Review of Transport Noise Interventions and Their Impacts on Health. Int. J. Environ. Res. Public Health 2017, 14, 873. https://doi.org/10.3390/ijerph14080873
Brown AL, Van Kamp I. WHO Environmental Noise Guidelines for the European Region: A Systematic Review of Transport Noise Interventions and Their Impacts on Health. International Journal of Environmental Research and Public Health. 2017; 14(8):873. https://doi.org/10.3390/ijerph14080873
Chicago/Turabian StyleBrown, Alan Lex, and Irene Van Kamp. 2017. "WHO Environmental Noise Guidelines for the European Region: A Systematic Review of Transport Noise Interventions and Their Impacts on Health" International Journal of Environmental Research and Public Health 14, no. 8: 873. https://doi.org/10.3390/ijerph14080873