Identifying Key Performance Indicators for Holistic Hospital Management with a Modified DEMATEL Approach


Abstract
:1. Introduction
2. Literature Review
2.1. Applications of Interval 2-Tuples
2.2. Applications of the DEMATEL Method
3. Preliminaries
3.1. Interval 2-Tuple Linguistic Variables
3.2. Evidential Reasoning Approach
3.3. The DEMATEL Method
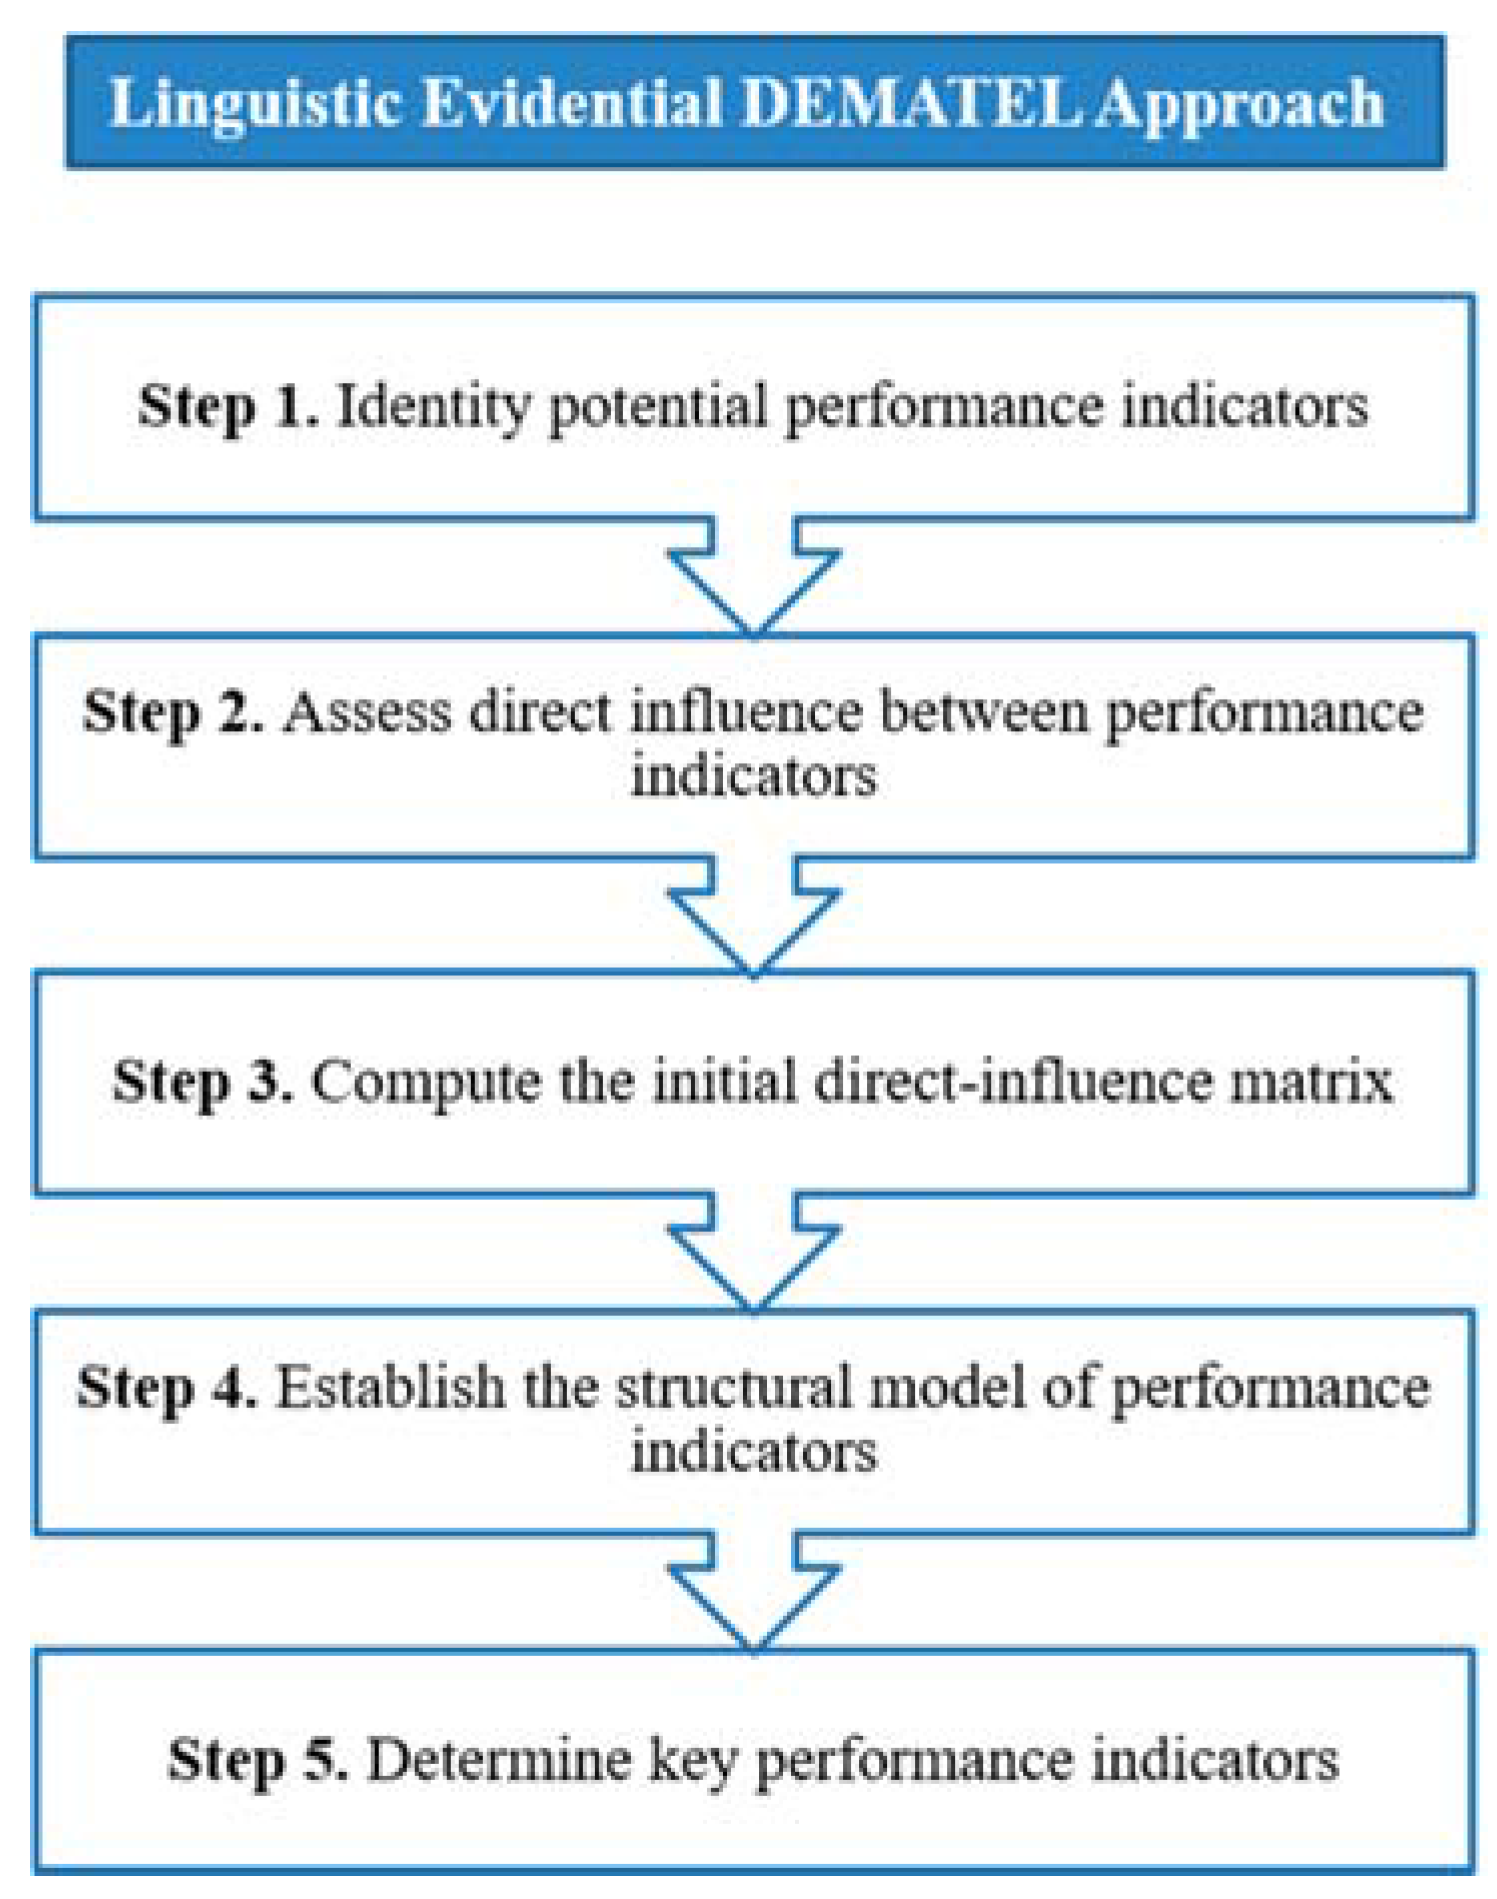
4. The Proposed Linguistic Evidential DEMATEL Approach
- A certain grade such as Low, which can be expressed as .
- A distribution such as Low to a degree of belief 0.3 and Moderate to a degree of belief 0.7 can be equivalently written as . Here the values of 0.3 and 0.7 represent the belief degrees (also called confidences) of the expert in his/her subjective judgments.
- An interval such as Low-Moderate, which means that the evaluation grade given by the expert is between Low and Moderate. This can be expressed as
- No judgment, which means the expert is not willing to or cannot provide an assessment due to a lack of evidence or data. In other words, the grade by this expert could be anywhere between Very Low and Very High and can be represented as .
5. Case Study
5.1. Application
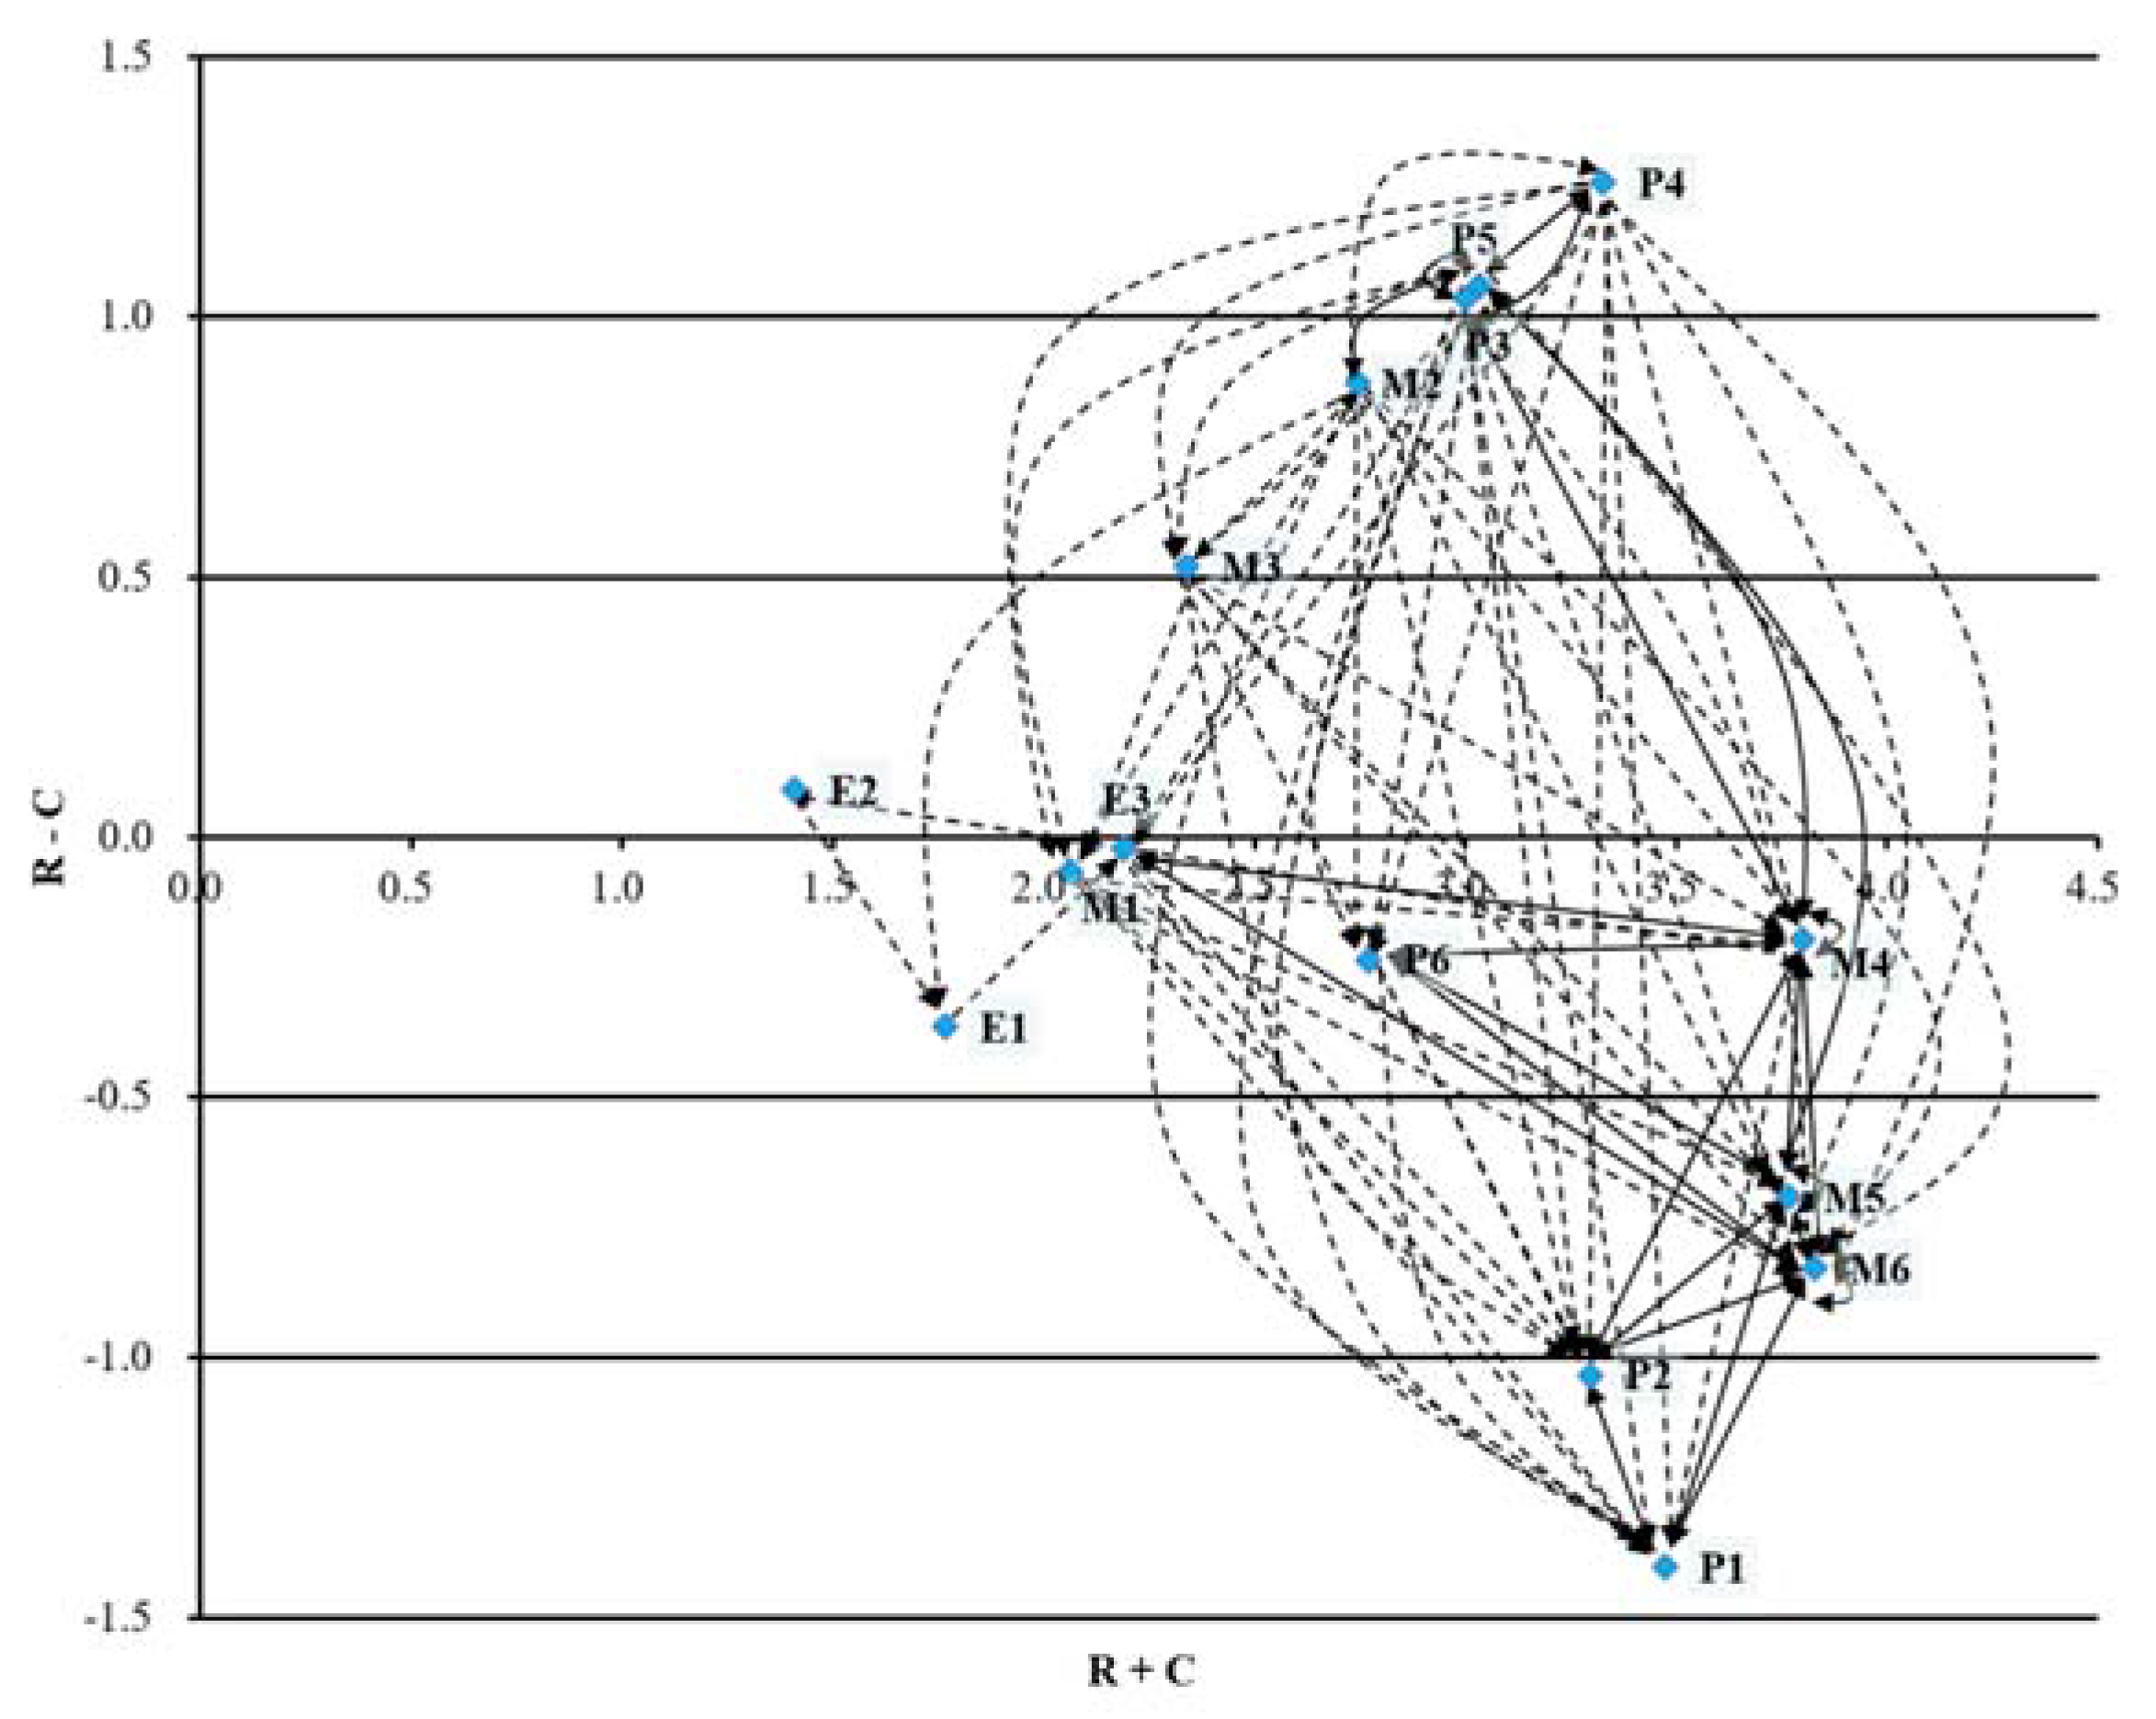
5.2. Discussions
6. Conclusions
Acknowledgments
Author Contributions
Conflicts of Interest
References
- Liu, H.C. A theoretical framework for holistic hospital management in the Japanese healthcare context. Health Policy 2013, 113, 160–169. [Google Scholar] [CrossRef] [PubMed]
- Gu, X.; Itoh, K. Performance indicators: Healthcare professionals’ views. Int. J. Health Care Qual. Assur. 2016, 29, 801–815. [Google Scholar] [CrossRef] [PubMed]
- McNatt, Z.; Linnander, E.; Endeshaw, A.; Tatek, D.; Conteh, D.; Bradley, E.H. A national system for monitoring the performance of hospitals in Ethiopia. B. World Health Organ. 2015, 93, 719–726. [Google Scholar] [CrossRef] [PubMed]
- El-Jardali, F.; Saleh, S.; Ataya, N.; Jamal, D. Design, implementation and scaling up of the balanced scorecard for hospitals in Lebanon: Policy coherence and application lessons for low and middle income countries. Health Policy 2011, 103, 305–314. [Google Scholar] [CrossRef] [PubMed]
- Veillard, J.; Champagne, F.; Klazinga, N.; Kazandjian, V.; Arah, O.A.; Guisset, A.L. A performance assessment framework for hospitals: The WHO regional office for Europe PATH project. Int. J. Qual. Health Care 2005, 17, 487–496. [Google Scholar] [CrossRef] [PubMed]
- Carinci, F.; Van Gool, K.; Mainz, J.; Veillard, J.; Pichora, E.C.; Januel, J.M.; Arispe, I.; Kim, S.M.; Klazinga, N.S. Towards actionable international comparisons of health system performance: expert revision of the OECD framework and quality indicators. Int. J. Qual. Health Care 2015, 27, 137–146. [Google Scholar] [PubMed]
- Groene, O.; Skau, J.K. H.; Frølich, A. An international review of projects on hospital performance assessment. Int. J. Qual. Health Care 2008, 20, 162–171. [Google Scholar] [CrossRef] [PubMed]
- Rabbani, F.; Jafri, S.M.; Abbas, F.; Shah, M.; Azam, S.I.; Shaikh, B.T.; Brommels, M.; Tomson, G. Designing a balanced scorecard for a tertiary care hospital in Pakistan: A modified Delphi group exercise. Int. J. Health Plann. Manag. 2010, 25, 74–90. [Google Scholar] [CrossRef] [PubMed]
- Toussaint, N.D.; McMahon, L.P.; Dowling, G.; Soding, J.; Safe, M.; Knight, R.; Fair, K.; Linehan, L.; Walker, R.G.; Power, D.A. Implementation of renal key performance indicators: Promoting improved clinical practice. Nephrology 2015, 20, 184–193. [Google Scholar] [CrossRef] [PubMed]
- Liu, H.C.; Itoh, K. Conceptual Framework for Holistic Dialysis Management Based on Key Performance Indicators. Ther. Apher. Dial. 2013, 17, 532–550. [Google Scholar] [CrossRef] [PubMed]
- Gabus, A.; Fontela, E. Perceptions of the World Problematique: Communication Procedure, Communicating with Those Bearing Collective Responsibility; Battelle Geneva Research Centre: Geneva, Switzerland, 1973. [Google Scholar]
- Liu, H.C.; You, J.X.; Ding, X.F.; Su, Q. Improving risk evaluation in FMEA with a hybrid multiple criteria decision making method. Int. J. Qual. Reliab. Manag. 2015, 32, 763–782. [Google Scholar] [CrossRef]
- Song, W.; Ming, X.; Liu, H.C. Identifying critical risk factors of sustainable supply chain management: A rough strength-relation analysis method. J. Clean. Prod. 2017, 143, 100–115. [Google Scholar] [CrossRef]
- Liu, H.C.; You, J.X.; Zhen, L.; Fan, X.J. A novel hybrid multiple criteria decision making model for material selection with target-based criteria. Mater. Design 2014, 60, 380–390. [Google Scholar] [CrossRef]
- Liu, H.C.; You, J.X.; Lu, C.; Chen, Y.Z. Evaluating health-care waste treatment technologies using a hybrid multi-criteria decision making model. Renew. Sust. Energ. Rev. 2015, 41, 932–942. [Google Scholar] [CrossRef]
- Yang, J.B.; Wang, Y.M.; Xu, D.L.; Chin, K.S. The evidential reasoning approach for MADA under both probabilistic and fuzzy uncertainties. Eur. J. Oper. Res. 2006, 171, 309–343. [Google Scholar] [CrossRef]
- Guo, M.; Yang, J.B.; Chin, K.S.; Wang, H.W. Evidential reasoning based preference programming for multiple attribute decision analysis under uncertainty. Eur. J. Oper. Res. 2007, 182, 1294–1312. [Google Scholar] [CrossRef]
- Solic, K.; Ocevcic, H.; Golub, M. The information systems’ security level assessment model based on an ontology and evidential reasoning approach. Comput. Secur. 2015, 55, 100–112. [Google Scholar] [CrossRef]
- Chen, S.M.; Cheng, S.H.; Chiou, C.H. Fuzzy multiattribute group decision making based on intuitionistic fuzzy sets and evidential reasoning methodology. Inf. Fusion 2016, 27, 215–227. [Google Scholar] [CrossRef]
- Herrera, F.; Martínez, L. A 2-tuple fuzzy linguistic representation model for computing with words. IEEE Trans. Fuzzy Syst. 2000, 8, 746–752. [Google Scholar]
- Zhang, H. The multiattribute group decision making method based on aggregation operators with interval-valued 2-tuple linguistic information. Math. Comput. Model. 2012, 56, 27–35. [Google Scholar] [CrossRef]
- Wan, S.P.; Xu, G.L.; Dong, J.Y. Supplier selection using ANP and ELECTRE II in interval 2-tuple linguistic environment. Inf. Sci. 2017, 385–386, 19–38. [Google Scholar] [CrossRef]
- Singh, A.; Gupta, A.; Mehra, A. Energy planning problems with interval-valued 2-tuple linguistic information. Oper. Res. 2016. [Google Scholar] [CrossRef]
- Xue, Y.X.; You, J.X.; Zhao, X.; Liu, H.C. An integrated linguistic MCDM approach for robot evaluation and selection with incomplete weight information. Int. J. Prod. Res. 2016, 54, 5452–5467. [Google Scholar] [CrossRef]
- Lu, C.; You, J.X.; Liu, H.C.; Li, P. Health-care waste treatment technology selection using the interval 2-tuple induced TOPSIS method. Int. J. Environ. Res. Public Health 2016, 13, 562. [Google Scholar] [CrossRef] [PubMed]
- You, X.Y.; You, J.X.; Liu, H.C.; Zhen, L. Group multi-criteria supplier selection using an extended VIKOR method with interval 2-tuple linguistic information. Expert Syst. Appl. 2015, 42, 1906–1916. [Google Scholar] [CrossRef]
- Liu, H.C.; You, J.X.; Fan, X.J.; Chen, Y.Z. Site selection in waste management by the VIKOR method using linguistic assessment. Appl. Soft Comput. 2014, 21, 453–461. [Google Scholar] [CrossRef]
- Liu, H.C.; Li, P.; You, J.X.; Chen, Y.Z. A novel approach for FMEA: Combination of interval 2-tuple linguistic variables and grey relational analysis. Qual. Reliab. Eng. Int. 2015, 31, 761–772. [Google Scholar] [CrossRef]
- Liu, H.C.; You, J.X.; You, X.Y. Evaluating the risk of healthcare failure modes using interval 2-tuple hybrid weighted distance measure. Comput. Ind. Eng. 2014, 78, 249–258. [Google Scholar] [CrossRef]
- Meng, F.; Zhu, M.; Chen, X. Some generalized interval-valued 2-tuple linguistic correlated aggregation operators and their application in decision making. Informatica. 2016, 27, 111–139. [Google Scholar] [CrossRef]
- Wang, J.Q.; Wang, D.D.; Zhang, H.Y.; Chen, X.H. Multi-criteria group decision making method based on interval 2-tuple linguistic information and Choquet integral aggregation operators. Soft Comput. 2015, 19, 389–405. [Google Scholar] [CrossRef]
- Lin, J.; Zhang, Q.; Meng, F. An approach for facility location selection based on optimal aggregation operator. Knowl.-Based. Syst. 2015, 85, 143–158. [Google Scholar] [CrossRef]
- Liu, X.; Tao, Z.; Chen, H.; Zhou, L. A new interval-valued 2-tuple linguistic Bonferroni mean operator and its application to multiattribute group decision making. Int. J. Fuzzy Syst. 2016, 19, 86–108. [Google Scholar] [CrossRef]
- Liu, H.C.; Lin, Q.L.; Wu, J. Dependent interval 2-tuple linguistic aggregation operators and their application to multiple attribute group decision making. Int. J. Uncertainy. Fuzz. Knowl.-Based Syst. 2014, 22, 717–735. [Google Scholar] [CrossRef]
- Luthra, S.; Govindan, K.; Kharb, R.K.; Mangla, S.K. Evaluating the enablers in solar power developments in the current scenario using fuzzy DEMATEL: An Indian perspective. Renew. Sust. Energ. Rev. 2016, 63, 379–397. [Google Scholar] [CrossRef]
- Liang, H.; Ren, J.; Gao, Z.; Gao, S.; Luo, X.; Dong, L.; Scipioni, A. Identification of critical success factors for sustainable development of biofuel industry in China based on grey decision-making trial and evaluation laboratory (DEMATEL). J. Clean. Prod. 2016, 131, 500–508. [Google Scholar] [CrossRef]
- Xia, X.; Govindan, K.; Zhu, Q. Analyzing internal barriers for automotive parts remanufacturers in China using grey-DEMATEL approach. J. Clean. Prod. 2015, 87, 811–825. [Google Scholar] [CrossRef]
- Wu, K.J.; Liao, C.J.; Tseng, M.L.; Chiu, A.S. F. Exploring decisive factors in green supply chain practices under uncertainty. Int. J. Prod. Econ. 2015, 159, 147–157. [Google Scholar] [CrossRef]
- Liu, H.C.; You, J.X.; Lin, Q.L.; Li, H. Risk assessment in system FMEA combining fuzzy weighted average with fuzzy decision-making trial and evaluation laboratory. Int. J. Comp. Integ. M. 2015, 28, 701–714. [Google Scholar] [CrossRef]
- Guo, W.F.; Zhou, J.; Yu, C.L.; Tsai, S.B.; Xue, Y.Z.; Chen, Q.; Guo, J.J.; Huang, P.Y.; Wu, C.H. Evaluating the green corporate social responsibility of manufacturing corporations from a green industry law perspective. Int. J. Prod. Res. 2015, 53, 665–674. [Google Scholar] [CrossRef]
- Akyuz, E.; Celik, E. A fuzzy DEMATEL method to evaluate critical operational hazards during gas freeing process in crude oil tankers. J. Loss. Prevent. Proc. 2015, 38, 243–253. [Google Scholar] [CrossRef]
- Wu, H.Y. Constructing a strategy map for banking institutions with key performance indicators of the balanced scorecard. Eval. Program. Plann. 2012, 35, 303–320. [Google Scholar] [CrossRef] [PubMed]
- Cheng, Y.T.; Chou, H.H.; Cheng, C.H. Extracting key performance indicators (KPIs) new product development using mind map and Decision-Making Trial and Evaluation Laboratory (DEMATEL) methods. Afr. J. Bus. Manage. 2011, 5, 10734. [Google Scholar]
- Govindan, K.; Khodaverdi, R.; Vafadarnikjoo, A. Intuitionistic fuzzy based DEMATEL method for developing green practices and performances in a green supply chain. Expert Syst. Appl. 2015, 42, 7207–7220. [Google Scholar] [CrossRef]
- Quader, M.A.; Ahmed, S.; Raja Ghazilla, R.A.; Ahmed, S.; Dahari, M. Evaluation of criteria for CO2 capture and storage in the iron and steel industry using the 2-tuple DEMATEL technique. J. Clean. Prod. 2016, 120, 207–220. [Google Scholar] [CrossRef]
- Li, Y.; Hu, Y.; Zhang, X.; Deng, Y.; Mahadevan, S. An evidential DEMATEL method to identify critical success factors in emergency management. Appl. Soft Comput. 2014, 22, 504–510. [Google Scholar] [CrossRef]
- Liu, H.C.; You, J.X.; Chen, S.; Chen, Y.Z. An integrated failure mode and effect analysis approach for accurate risk assessment under uncertainty. IIE Trans. 2016, 48, 1027–1042. [Google Scholar] [CrossRef]
- Liu, H.C.; Ren, M.L.; Wu, J.; Lin, Q.L. An interval 2-tuple linguistic MCDM method for robot evaluation and selection. Int. J. Prod. Res. 2014, 52, 2867–2880. [Google Scholar] [CrossRef]
- Nie, R.X.; Wang, J.Q.; Li, L. A shareholder voting method for proxy advisory firm selection based on 2-tuple linguistic picture preference relation. Appl. Soft Comput. 2017, in press. [Google Scholar] [CrossRef]
- Li, C.C.; Dong, Y.; Herrera, F.; Herrera-Viedma, E.; Martínez, L. Personalized individual semantics in computing with words for supporting linguistic group decision making. An application on consensus reaching. Inf. Fusion 2017, 33, 29–40. [Google Scholar] [CrossRef]

| Perspective | Measure | Indicator | Definition and Explanation |
|---|---|---|---|
| Patient | Patient satisfaction | Overall satisfaction (P1) | Overall satisfaction with healthcare service, including satisfaction with physicians, waiting time, treatment, etc. |
| Patient complaints | Overall complaints (P2) | Overall complaints about healthcare service, e.g., patient complaints per 1000 patient, rate of complaints per patient per year | |
| Patient safety | Incidents/Errors (P3) | Incidents/errors occurred in healthcare treatment process, including medication errors, diagnosis and treatment errors, blood transfusion errors, etc. | |
| Accidents/adverse events (P4) | Accident/adverse events occurred in healthcare treatment process, e.g., number of critical incidents per 100 operations | ||
| Nosocomial infection (P5) | Nosocomial infection in the hospital, including surgical wound infection, infection of Methicillin-resistant Staphylococcus aureus (MRSA), incision-wound infection, etc. | ||
| Waiting/Delay | Waiting time (P6) | Waiting time for healthcare service, such as outpatient waiting times, waiting time for admission, waiting time for treatment | |
| Employee | Employee satisfaction | Overall satisfaction (E1) | Overall satisfaction with healthcare organization, including satisfaction with job, colleagues, supervisors etc. |
| Occupational health | Sickness leave (E2) | Employee sick leave in the hospital, such as sickness leave of doctor, mental sickness, physical sickness | |
| Work conditions | Staff turnover (E3) | Staff turnover of the hospital, e.g., staff leaving the hospital in one year/total staffs | |
| Management | Health statistics | Mortality/Death (M1) | Mortality/Death in healthcare organization, such as mortality of the patients discharged, stillbirths and infant deaths, deaths in hospital following surgery |
| Number of operations/ procedures (M2) | Number of operations/procedures carried out in the hospital per operator/year | ||
| Readmission/return | Unscheduled readmission/return (M3) | Unscheduled readmission/return to the hospital, e.g., readmissions within 28 days, readmission rate within 14 days, unexpected returns after transferred out | |
| Organizational efficiency | Length of stay (M4) | Length of stay at the hospital, e.g., average length of stay, rate of length of stay exceeding 14 days, per cent long stay patient | |
| Bed occupancy (M5) | Bed occupancy of the hospital, such as average daily census/beds in service, percentage of bed emptiness | ||
| Financial effectiveness | Financial measures (M6) | Financial measures for healthcare organisation, including cash-flow, profit margin, net operating margin, asset turnover, return on assets, etc. |
| DM1 | P1 | P2 | P3 | P4 | P5 | P6 | E1 | E2 | E3 | M1 | M2 | M3 | M4 | M5 | M6 |
|---|---|---|---|---|---|---|---|---|---|---|---|---|---|---|---|
| P1 | NA | H55 | H22 | H12 | H22 | H23 | (H44, 0.7) (H55, 0.3) | H22 | H22 | H22 | H12 | H11 | H22 | H66 | H56 |
| P2 | H67 | NA | H22 | (H11, 0.5)(H22, 0.3) | H11 | H33 | H22 | H11 | H12 | H12 | H33 | H22 | H44 | H55 | (H55,0.6) (H66,0.4) |
| P3 | H66 | H66 | NA | H55 | H44 | H44 | H33 | H33 | H22 | H55 | H22 | H55 | H56 | H44 | H55 |
| P4 | H77 | H77 | H55 | NA | H44 | H55 | H33 | H44 | H33 | H66 | H22 | H55 | H56 | H55 | H56 |
| P5 | H66 | H45 | H55 | H55 | NA | H33 | H22 | H11 | H11 | H66 | H44 | H55 | H55 | H55 | H44 |
| P6 | (H44, 0.5) (H55, 0.5) | H55 | H12 | H11 | H33 | NA | H22 | H11 | H11 | H12 | H44 | H11 | H55 | H55 | H45 |
| E1 | H33 | H33 | H22 | H22 | H11 | H22 | NA | H22 | H66 | H12 | H11 | H11 | H22 | H11 | H22 |
| E2 | H22 | H11 | H22 | H22 | H11 | H34 | (H55, 0.4) (H66, 0.6) | NA | H55 | H11 | H22 | H11 | H44 | H11 | H22 |
| E3 | H33 | H33 | H44 | H33 | H33 | H33 | H44 | H22 | NA | H22 | H23 | H11 | H33 | H22 | H33 |
| M1 | H55 | H44 | H22 | H22 | H11 | H11 | H11 | H11 | H11 | NA | H12 | H22 | H34 | H55 | H55 |
| M2 | H33 | H33 | H33 | H33 | H33 | H55 | H44 | H22 | H22 | H34 | NA | H44 | (H44, 0.8) | H55 | H66 |
| M3 | H66 | H55 | H22 | H22 | H22 | H11 | H11 | H11 | H22 | H55 | H45 | NA | H55 | H44 | H44 |
| M4 | H55 | H55 | H34 | H33 | H55 | H55 | H22 | H45 | H44 | H33 | H22 | H23 | NA | H55 | H55 |
| M5 | H44 | H44 | H33 | H22 | H45 | H55 | H11 | H33 | H44 | H22 | H22 | H22 | H56 | NA | H55 |
| M6 | H66 | H55 | H22 | H22 | H22 | H44 | H44 | H11 | H44 | H22 | H11 | H11 | H44 | H55 | NA |
| Indicators | P1 | P2 | P3 | P4 | P5 | P6 |
|---|---|---|---|---|---|---|
| P1 | (H11, 1.0) | (H44, 0.6) (H55, 0.4) | (H11, 0.4) (H22 0.6) | (H11, 0.35) (H12, 0.40) (H22, 0.25) | (H11, 0.40) (H12, 0.20) (H22, 0.40) | (H22, 0.48) (H23, 0.15) (H33, 0.37) |
| P2 | (H66, 0.7) (H67, 0.3) | (H11, 1.0) | (H11, 0.4) (H22, 0.6) | (H11, 0.325) (H17, 0.055) (H22, 0.62) | (H11, 1.0) | (H22, 0.65) (H23, 0.20) (H33, 0.15) |
| P3 | (H55, 0.25) (H66, 0.75) | (H55, 0.4) (H66, 0.6) | (H11, 1.0) | (H44, 0.5) (H55, 0.5) | (H33, 0.50) (H44, 0.30) (H55, 0.20) | (H33, 0.65) (H44, 0.35) |
| P4 | (H66, 0.25) (H77, 0.75) | (H66, 0.25) (H77, 0.75) | (H44, 0.40) (H45, 0.20) (H55, 0.40) | (H11, 1.0) | (H33, 0.25) (H44, 0.50) (H55, 0.25) | (H44, 0.85) (H55, 0.15) |
| P5 | (H55, 0.65) (H66, 0.35) | (H44,0.50) (H45,0.30) (H55, 0.20) | (H44, 0.40) (H55, 0.60) | (H55, 1.0) | (H11, 1.0) | (H33, 0.55) (H34, 0.20) (H44, 0.25) |
| P6 | (H44, 0.325) (H55, 0.675) | (H55, 0.6) (H66, 0.4) | (H11, 0.40) (H12, 0.40) (H22, 0.20) | (H11, 1.0) | (H33, 0.75) (H44, 0.25) | (H11, 1.0) |
| Indicators | P1 | P2 | P3 | P4 | P5 | P6 | E1 | E2 | E3 | M1 | M2 | M3 | M4 | M5 | M6 |
|---|---|---|---|---|---|---|---|---|---|---|---|---|---|---|---|
| P1 | 0.000 | 0.567 | 0.100 | 0.075 | 0.083 | 0.241 | 0.491 | 0.067 | 0.125 | 0.158 | 0.071 | 0.067 | 0.108 | 0.733 | 0.783 |
| P2 | 0.858 | 0.000 | 0.100 | 0.131 | 0.000 | 0.208 | 0.192 | 0.000 | 0.054 | 0.046 | 0.258 | 0.108 | 0.413 | 0.750 | 0.735 |
| P3 | 0.792 | 0.767 | 0.000 | 0.583 | 0.450 | 0.392 | 0.213 | 0.225 | 0.167 | 0.567 | 0.213 | 0.592 | 0.746 | 0.500 | 0.667 |
| P4 | 0.958 | 0.958 | 0.583 | 0.000 | 0.500 | 0.525 | 0.250 | 0.292 | 0.233 | 0.733 | 0.167 | 0.675 | 0.725 | 0.667 | 0.721 |
| P5 | 0.725 | 0.558 | 0.600 | 0.667 | 0.000 | 0.392 | 0.092 | 0.042 | 0.000 | 0.750 | 0.425 | 0.667 | 0.667 | 0.667 | 0.517 |
| P6 | 0.613 | 0.733 | 0.067 | 0.000 | 0.375 | 0.000 | 0.167 | 0.000 | 0.000 | 0.092 | 0.425 | 0.000 | 0.667 | 0.525 | 0.592 |
| E1 | 0.233 | 0.233 | 0.167 | 0.167 | 0.075 | 0.175 | 0.000 | 0.167 | 0.750 | 0.033 | 0.000 | 0.067 | 0.167 | 0.075 | 0.167 |
| E2 | 0.167 | 0.075 | 0.092 | 0.058 | 0.042 | 0.367 | 0.694 | 0.000 | 0.558 | 0.000 | 0.058 | 0.000 | 0.417 | 0.075 | 0.167 |
| E3 | 0.217 | 0.258 | 0.400 | 0.333 | 0.225 | 0.250 | 0.500 | 0.167 | 0.000 | 0.067 | 0.213 | 0.042 | 0.367 | 0.233 | 0.333 |
| M1 | 0.667 | 0.575 | 0.067 | 0.167 | 0.000 | 0.000 | 0.100 | 0.000 | 0.067 | 0.000 | 0.033 | 0.167 | 0.367 | 0.625 | 0.608 |
| M2 | 0.333 | 0.367 | 0.375 | 0.400 | 0.450 | 0.600 | 0.500 | 0.233 | 0.108 | 0.358 | 0.000 | 0.383 | 0.542 | 0.667 | 0.800 |
| M3 | 0.727 | 0.550 | 0.167 | 0.167 | 0.067 | 0.200 | 0.000 | 0.000 | 0.125 | 0.583 | 0.567 | 0.000 | 0.667 | 0.529 | 0.500 |
| M4 | 0.667 | 0.546 | 0.433 | 0.267 | 0.450 | 0.667 | 0.067 | 0.554 | 0.542 | 0.250 | 0.250 | 0.233 | 0.000 | 0.667 | 0.667 |
| M5 | 0.558 | 0.500 | 0.258 | 0.167 | 0.533 | 0.608 | 0.000 | 0.333 | 0.400 | 0.075 | 0.233 | 0.192 | 0.733 | 0.000 | 0.583 |
| M6 | 0.767 | 0.667 | 0.083 | 0.450 | 0.083 | 0.400 | 0.425 | 0.067 | 0.533 | 0.233 | 0.250 | 0.133 | 0.500 | 0.667 | 0.000 |
| Indicators | P1 | P2 | P3 | P4 | P5 | P6 | E1 | E2 | E3 | M1 | M2 | M3 | M4 | M5 | M6 |
|---|---|---|---|---|---|---|---|---|---|---|---|---|---|---|---|
| P1 | 0.072 | 0.127 | 0.037 | 0.038 | 0.038 | 0.072 | 0.087 | 0.027 | 0.052 | 0.044 | 0.035 | 0.031 | 0.071 | 0.148 | 0.156 |
| P2 | 0.175 | 0.071 | 0.041 | 0.047 | 0.033 | 0.076 | 0.057 | 0.023 | 0.045 | 0.035 | 0.059 | 0.038 | 0.109 | 0.160 | 0.161 |
| P3 | 0.234 | 0.214 | 0.055 | 0.124 | 0.107 | 0.131 | 0.083 | 0.064 | 0.081 | 0.126 | 0.079 | 0.119 | 0.197 | 0.191 | 0.213 |
| P4 | 0.271 | 0.251 | 0.127 | 0.065 | 0.119 | 0.156 | 0.094 | 0.075 | 0.096 | 0.151 | 0.082 | 0.134 | 0.210 | 0.226 | 0.237 |
| P5 | 0.231 | 0.196 | 0.125 | 0.136 | 0.059 | 0.133 | 0.067 | 0.044 | 0.061 | 0.151 | 0.105 | 0.132 | 0.193 | 0.213 | 0.201 |
| P6 | 0.159 | 0.161 | 0.043 | 0.038 | 0.079 | 0.057 | 0.057 | 0.025 | 0.041 | 0.046 | 0.083 | 0.031 | 0.145 | 0.146 | 0.155 |
| E1 | 0.073 | 0.068 | 0.040 | 0.040 | 0.028 | 0.049 | 0.024 | 0.033 | 0.110 | 0.023 | 0.018 | 0.024 | 0.057 | 0.051 | 0.064 |
| E2 | 0.065 | 0.051 | 0.032 | 0.028 | 0.026 | 0.074 | 0.105 | 0.016 | 0.094 | 0.018 | 0.025 | 0.015 | 0.086 | 0.051 | 0.064 |
| E3 | 0.100 | 0.097 | 0.077 | 0.072 | 0.058 | 0.077 | 0.091 | 0.041 | 0.037 | 0.041 | 0.053 | 0.034 | 0.103 | 0.095 | 0.109 |
| M1 | 0.147 | 0.128 | 0.033 | 0.047 | 0.027 | 0.044 | 0.041 | 0.019 | 0.041 | 0.026 | 0.030 | 0.042 | 0.096 | 0.138 | 0.138 |
| M2 | 0.166 | 0.156 | 0.093 | 0.099 | 0.104 | 0.147 | 0.109 | 0.062 | 0.072 | 0.096 | 0.049 | 0.091 | 0.165 | 0.191 | 0.210 |
| M3 | 0.183 | 0.152 | 0.057 | 0.060 | 0.049 | 0.086 | 0.043 | 0.028 | 0.058 | 0.107 | 0.103 | 0.034 | 0.154 | 0.157 | 0.157 |
| M4 | 0.199 | 0.173 | 0.098 | 0.083 | 0.102 | 0.153 | 0.065 | 0.097 | 0.117 | 0.080 | 0.078 | 0.071 | 0.102 | 0.190 | 0.194 |
| M5 | 0.171 | 0.152 | 0.073 | 0.065 | 0.105 | 0.137 | 0.048 | 0.068 | 0.093 | 0.054 | 0.070 | 0.061 | 0.170 | 0.100 | 0.169 |
| M6 | 0.189 | 0.167 | 0.051 | 0.092 | 0.053 | 0.110 | 0.094 | 0.037 | 0.109 | 0.067 | 0.067 | 0.051 | 0.138 | 0.171 | 0.101 |
| Performance indicator | R | C | R + C | R – C |
|---|---|---|---|---|
| P1. Patient satisfaction | 1.035 | 2.438 | 3.472 | −1.403 |
| P2. Patient complaints | 1.131 | 2.165 | 3.296 | −1.034 |
| P3. Incidents/Errors | 2.019 | 0.983 | 3.002 | 1.036 |
| P4. Accidents/adverse events | 2.293 | 1.035 | 3.328 | 1.258 |
| P5. Nosocomial infection | 2.047 | 0.988 | 3.035 | 1.059 |
| P6. Waiting time | 1.267 | 1.503 | 2.770 | −0.236 |
| E1. Employee satisfaction | 0.701 | 1.065 | 1.766 | −0.364 |
| E2. Sickness leave | 0.750 | 0.659 | 1.409 | 0.091 |
| E3. Staff turnover | 1.084 | 1.106 | 2.190 | −0.022 |
| M1. Mortality/Death | 0.999 | 1.064 | 2.063 | −0.065 |
| M2. Number of operations/procedures | 1.809 | 0.937 | 2.746 | 0.872 |
| M3. Unscheduled readmission/return | 1.430 | 0.908 | 2.337 | 0.522 |
| M4. Length of stay | 1.802 | 1.998 | 3.800 | −0.195 |
| M5. Bed occupancy | 1.538 | 2.229 | 3.767 | −0.691 |
| M6. Financial measures | 1.499 | 2.328 | 3.827 | −0.829 |
© 2017 by the authors. Licensee MDPI, Basel, Switzerland. This article is an open access article distributed under the terms and conditions of the Creative Commons Attribution (CC BY) license (http://creativecommons.org/licenses/by/4.0/).
Share and Cite
Si, S.-L.; You, X.-Y.; Liu, H.-C.; Huang, J. Identifying Key Performance Indicators for Holistic Hospital Management with a Modified DEMATEL Approach. Int. J. Environ. Res. Public Health 2017, 14, 934. https://doi.org/10.3390/ijerph14080934
Si S-L, You X-Y, Liu H-C, Huang J. Identifying Key Performance Indicators for Holistic Hospital Management with a Modified DEMATEL Approach. International Journal of Environmental Research and Public Health. 2017; 14(8):934. https://doi.org/10.3390/ijerph14080934
Chicago/Turabian StyleSi, Sheng-Li, Xiao-Yue You, Hu-Chen Liu, and Jia Huang. 2017. "Identifying Key Performance Indicators for Holistic Hospital Management with a Modified DEMATEL Approach" International Journal of Environmental Research and Public Health 14, no. 8: 934. https://doi.org/10.3390/ijerph14080934