Article

Changes in Soil Microbial Community and Its Effect on Carbon Sequestration Following Afforestation on the Loess Plateau, China

1
College of Natural Resources and Environment, Northwest A&F University, Yangling 712100, China
2
Shanxi Research Academy of Environment Sciences, Taiyuan 030000, China
3
State Key Laboratory of Soil Erosion and Dryland Farming on the Loess Plateau, Northwest A&F University, Yangling 712100, China
4
Institute of Agricultural Environment and Resource, Shanxi Academy of Agricultural Sciences, Taiyuan 030000, China
5
French National Institute for Agricultural Research (INRA), UR 0272, UR Science du sol, Centre de recherche d’Orléans, CS 40001, Cedex 2, F-45075 Orléans, France
*
Author to whom correspondence should be addressed.
These authors contributed equally to this work.
Int. J. Environ. Res. Public Health 2017, 14(8), 948; https://doi.org/10.3390/ijerph14080948
Submission received: 19 July 2017 / Revised: 17 August 2017 / Accepted: 18 August 2017 / Published: 22 August 2017
(This article belongs to the Section Environmental Science and Engineering)

Abstract

:
Afforestation plays an important role in soil protection and ecological restoration. The objective of this study is to understand the effect of afforestation on soil carbon and soil microbial communities in the Loess Plateau of China. We measured two chemically-separated carbon fractions (i.e., humic acid, HA, and fulvic acid, FA) and soil microbial communities within shrublands (18-year-old Caragana korshinskii Kom (shrubland I) and 28-year-old Caragana korshinskii Kom (shrubland II)) and cropland. The size and structure of the soil microbial community was measured by phospholipid fatty acid (PLFA) analysis. The analysis of C-fractions indicated that at a depth of 0–20 cm, FA-C concentration in shrubland I and shrubland II were 1.7 times that of cropland, while HA-C had similar values across all three sites. Total PLFAs, G+ (Gram positive) bacterial, G (Gram negative) bacterial, and actinobacterial PLFAs were highest in shrubland II, followed by shrubland I and finally cropland. Fungal PLFAs were significantly higher in shrubland II compared to the other sites. Additionally, we found a high degree of synergy between main microbial groups (apart from fungi) with FA-C. We concluded that planting C. korshinskii in abandoned cropland could alter the size and structure of soil microbial community, with these changes being closely related to carbon sequestration and humus formation.

1. Introduction

Soil organic matter (SOM) is as a critical constituent of the physical, chemical, and biological qualities of soil [1]. Restoring soil carbon is essential to enhancing soil quality, sustaining and improving food production, maintaining clean water, and reducing increases in atmospheric CO2 [2]. It has been suggested that alteration with different fractions of SOM are more effective in indicating changes in soil use than the total soil organic matter content. Humic substances are stable organic matter compounds which can increase moisture retention, improve soil buffering capacity, and supply plants with available micronutrients [3]. The changes in the proportion of humic substances realistically reflect carbon sequestration in soils. Based on the solubility, humic substances (HSs) can be divided into fulvic acids (FAs, alkali-extractable and acid soluble), humic acids (HAs; alkali-extractable and acid insoluble), and humin (not extractable). The changes in the proportion of chemically-separated carbon fractions in soil can provide more insights into the mechanisms of carbon sequestration.
A healthy soil comprises highly diverse biota. Soil micro-organisms also play a central role in the decomposition and composition of soil carbon [4]. Fungi and bacteria govern most of the transformations and the ensuing long-term storage of organic carbon in soils. Changes in the ratio of fungi to bacteria and the total biomass may affect the storage and fluxes of carbon (C) and nitrogen (N) in terrestrial ecosystems [5]. Six et al. noted that fungal-dominated soils had slow C turnover rates [6]. Collectively, these observations imply that the microbial community structure may change and influence C sequestration.
In the last century, the “Grain for Green” Project was conducted nationwide in order to rehabilitate and recover the degraded ecosystems in China. The conversion of cropland to shrubland on the western Loess Plateau offers opportunities to conserve soil and water, improve micro-climate, and so on. Caragana korshinskii is the primary afforestation species due to its capacity to limit soil erosion, its well-developed root system, its resistance to drought, and its N2-fixing ability [7]. Afforestation can have a significant effect on soil carbon concentration and stocks [8]. In recent years, the effects of afforestation on soil properties have been studied in China [7,8,9]. However, the microbial mechanisms of C sequestration following afforestation have not been clear. Therefore, a better understanding of the effects of soil microbial communities on soil C dynamics is fundamental for providing further insight into the microbial mechanisms of C sequestration following afforestation.
The objective of this study was to assess the impact of afforestation on the soil microbial community composition and carbon fractions (humic acid, HA, and fulvic acid, FA) in shrublands (18-year-old C. korshinskii and 28-year-old C. korshinskii) and cropland on the Loess Plateau of China. In addition, the potential links between soil microbial and carbon variations following afforestation were studied. We hypothesized that (1) there would be more soil organic carbon (SOC), FA-C, and HA-C in shrublands due to the additional input of plant residue and less human disturbance; (2) soil microbial communities would change in biomass and composition following afforestation with C. korshinskii planted; and (3) the different components of soil microbial community (fungi, bacteria, actinomycetes) would play different roles in controlling soil carbon sequestration.

2. Materials and Methods

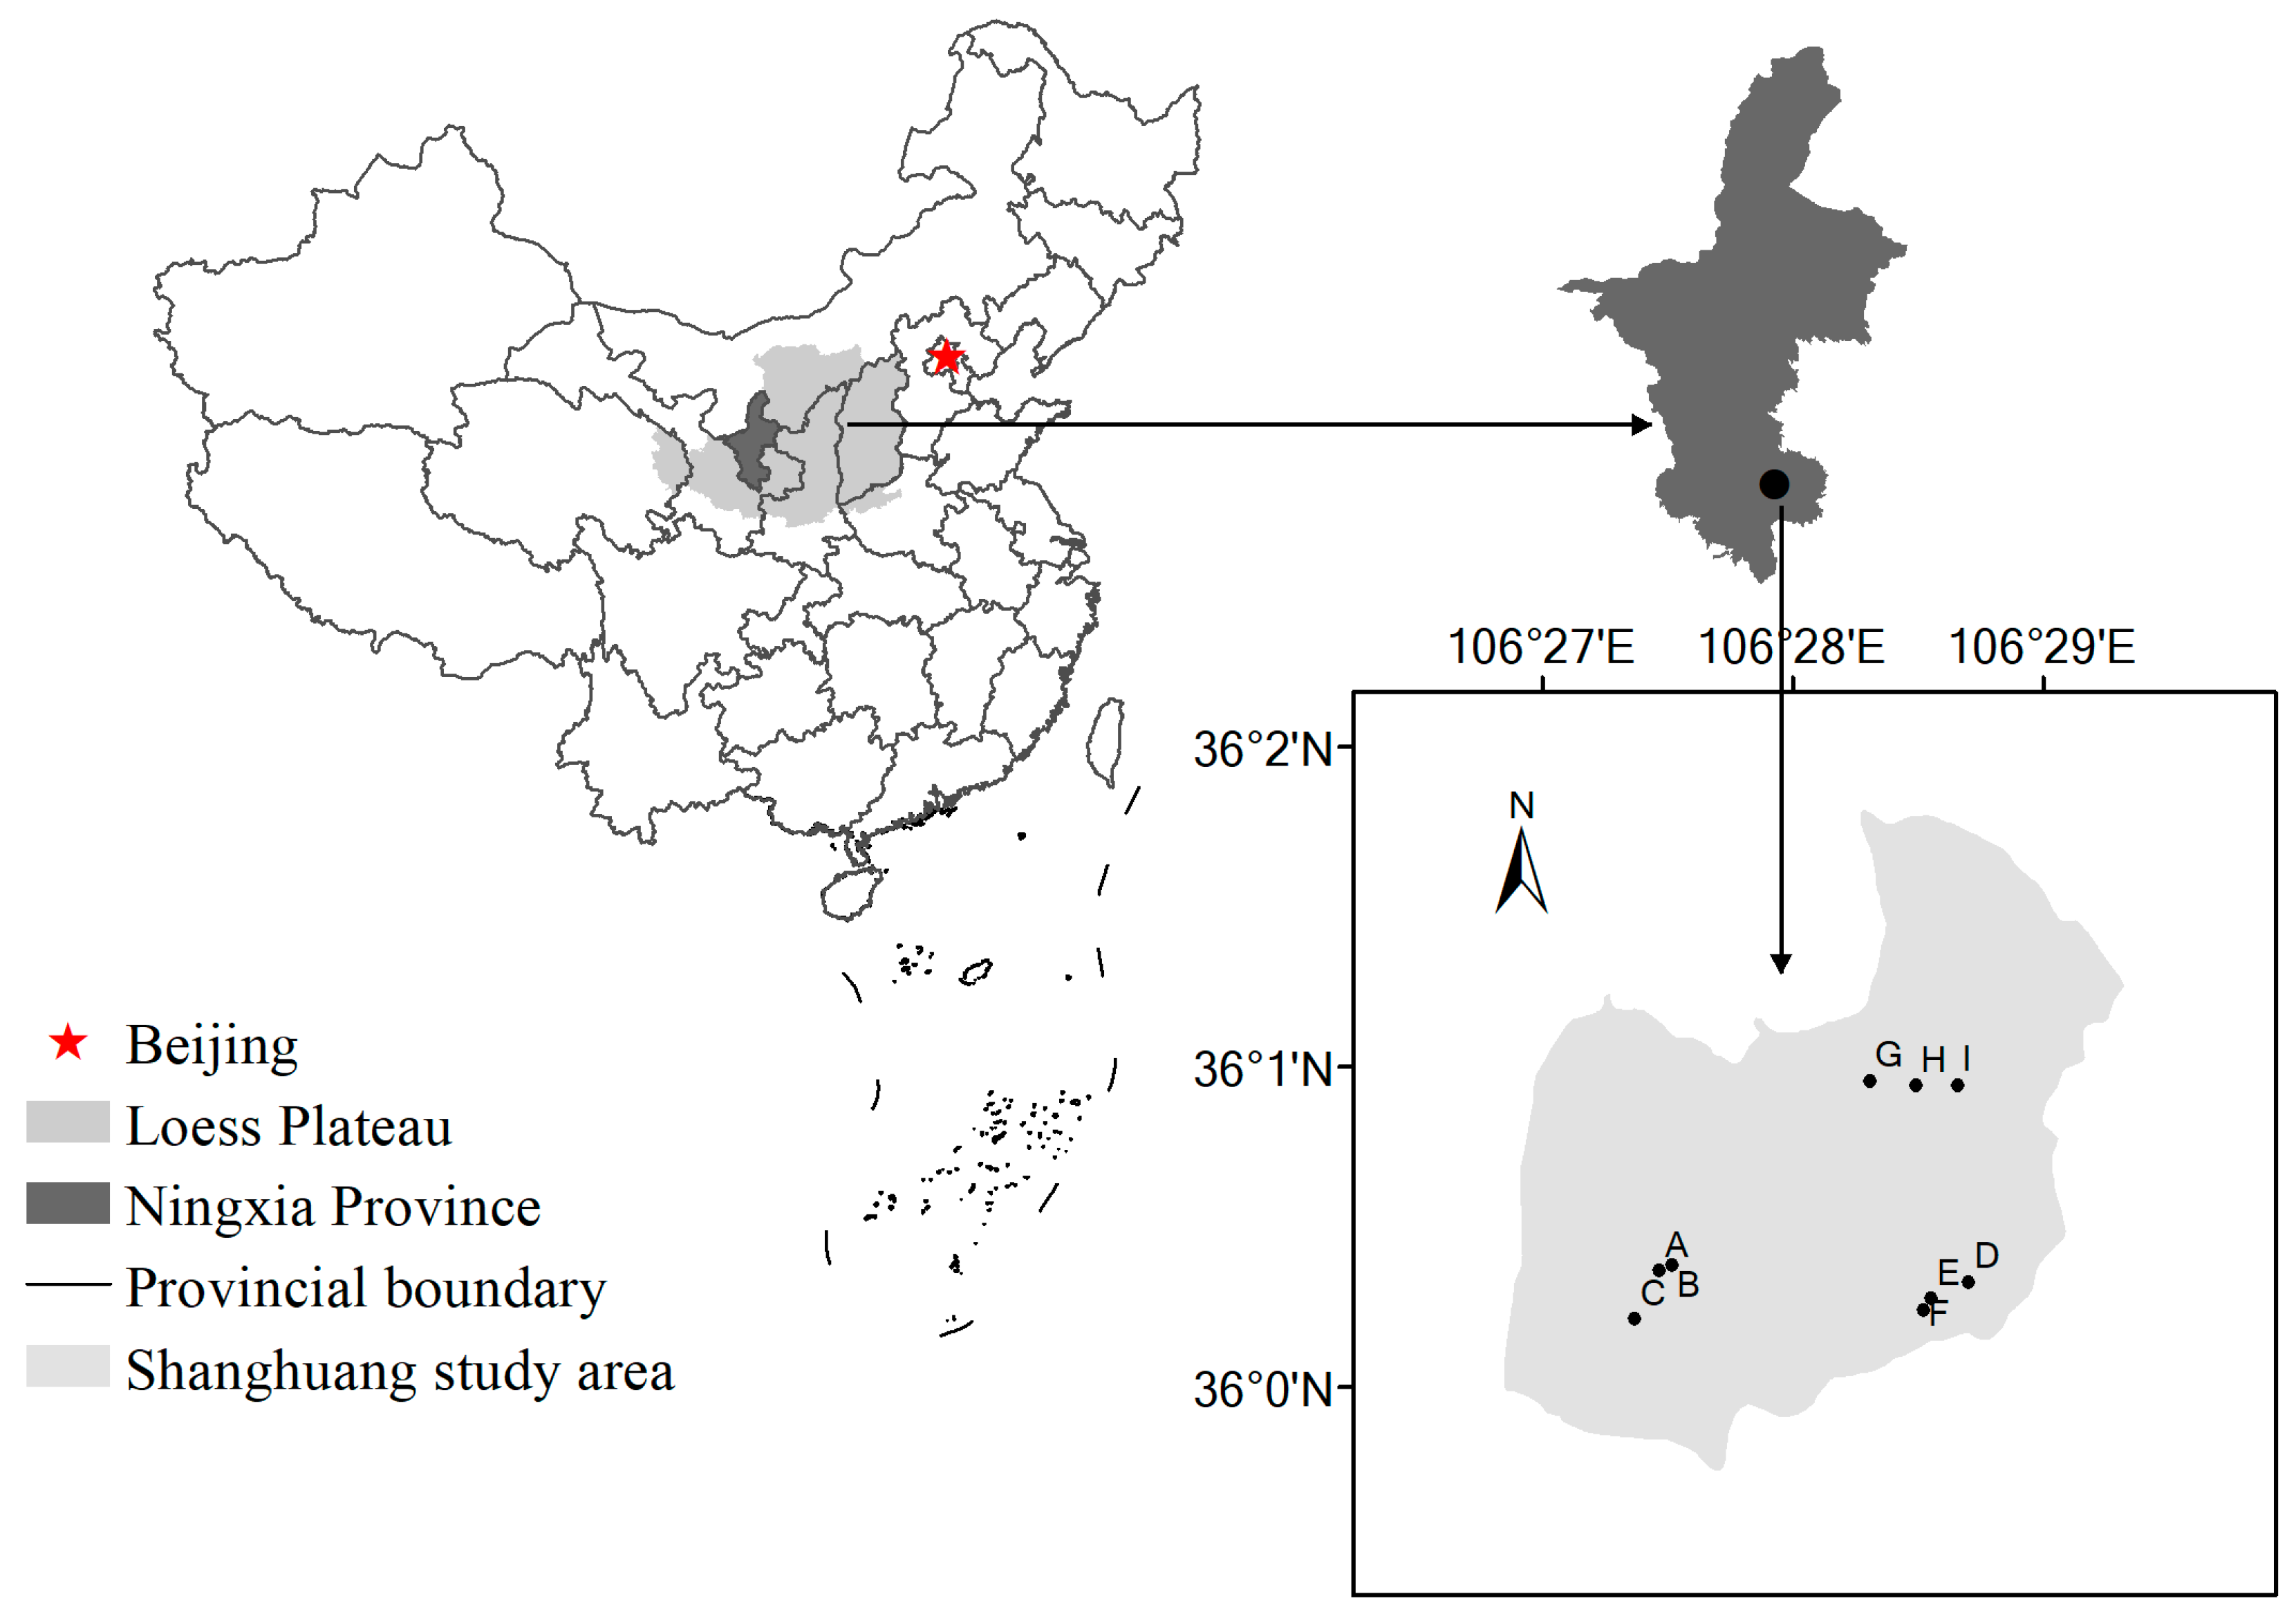
2.1. Study Site and Experimental Design

The study was performed at Guyuan Ecological Research Station in the “hilly-gully” region of the Loess Plateau. This station is located in the Shanghuang study area (106°26′–106°30′ E, 35°59′–36°02′ N), Guyuan city, Ningxia autonomous region (Figure 1). The elevation of the study region is 1534–1822 m. The study area has a sub-arid climate. The region is characterized by a mean annual temperature of 6.9 °C, a mean annual precipitation of 419.1 mm, and an aridity index of 1.55–2.00. The soil texture is medium loam. According to the U.S. Soil Taxonomy, the studied soils were classified as Entisols [10].
In the 1980s, a pilot program of the “Grain for Green” Project was established in the Shanghuang study area. Through this program, part of the cropland was successively converted into C. korshinskii shrubland in 1984 and 1994. Shrubland is presently one of main vegetation types. Here, we considered two establishment durations for C. korshinskii shrublands: 18-year-old C. korshinskii shrubland (shrubland I, from 1994 to 2012) and 28-year-old C. korshinskii shrubland (shrubland II, from 1984 to 2012), with cropland used as a reference. Croplands are currently used by farmers for wheat production with very low fertilizer input. The locations of the sampling sites are shown in Figure 1.

2.2. Soil Sampling and Preparation

Soil samples were obtained from shrublands and croplands in July 2012. Three sites were chosen for each treatment. For each site, three plots of 20 m × 20 m were delineated. Five samples were collected at depths of 0–20 and 20–40 cm from each plot and mixed to form a soil sample of about 1 kg. A total of 54 soil samples were obtained from all treatments. Each sample was passed through a 2-mm sieve to remove stones, large roots, macrofauna, and so on. Part of the fresh samples was sealed in plastic bags and stored in a refrigerator at −80 °C for soil microbial community analyses, while the remaining samples were air-dried at room temperature in a laboratory for chemical and carbon fraction analysis.

2.3. Analysis of Soil Chemical Properties, Carbon Fractions, and Phospholipid Fatty Acid (PLFA) Profiles

The concentration (g·kg−1) of soil organic carbon was determined by the Walkley and Black wet oxidation method [11,12]. The total N was analyzed using the Kjeldahl method [12]. Nitrate-N and ammonium-N were measured with a continuous flow analyzer (Flowsys, SYSTEA, Anagni, Italy). The available P was measured with the NaHCO3 method [12]. The chemically-separated carbon fractions of soil were determined by an extraction method using a NaOH and Na4P2O7 mixture [11,13]. The sum of FA and HA (FA+HA) was extracted from the 2.5 g soil sample using a 50-mL mixture of 0.1 M NaOH and 0.1 M Na4P2O7 at 70 °C for 60 min. The dark brown alkaline solution was separated into the acid-insoluble HA and the acid-soluble FA fractions by acidifying the alkaline solution to a pH of 1.0 with 0.5 M H2SO4. The HA was washed successively with 0.05 M H2SO4 and water, before being dissolved in 0.05 M NaOH. The carbon concentrations of (FA+HA)-C and HA (HA-C) were determined through the Walkley and Black wet oxidation method, while the carbon (C) concentration of FA (FA-C) was calculated by subtracting the HA-C from the (FA+HA)-C.
Soil microbial community structure was assessed by PLFA analysis using a modified Bligh and Dyer method as described by Bossio and Scow [14]. The PLFAs were measured with a Shimadzu GCMS-QP2010 SE (Shimadzu, Tokyo, Japan). The PLFAs were analyzed using a 5% diphenyl–95% dimethyl polysiloxane stationary phase (Rtx-5MS, 0.25 mm film thickness). Methyl nonadecanoate fatty acid (19:0) was added as an internal standard to quantify peak areas. The individual PLFAs were identified using fatty acid methyl ester (FAME) standard compounds (Bacterial Acid Methyl Esters Mix; Supelco, Bellefonte, PA, USA). The total PLFAs was analyzed as an index of microbial biomass (expressed as nmol·g−1 soil). The primary microbial groups of bacteria, fungi, gram-positive bacteria (G+), and gram-negative bacteria (G) were also studied to characterize the community structure. The ratio of G+/G bacteria and fungi/bacteria were analyzed.

2.4. Statistical Analysis

All data in the experiment were processed and calculated via Excel version 2003 (Microsoft, Redmond, WA, USA) and SPSS version 18.0 (IBM, Armonk, NY, USA). The effects of vegetation and soil depth on soil chemical properties, carbon fractions, and soil microbial composition were analyzed by a two-way analysis of variance (ANOVA). The Student–Newman–Keuls method (p < 0.05) was used to assess the differences among vegetations and soil depths. Pearson’s correlation analysis was used to study the significance of relationships between soil chemical properties, carbon fractions, and soil microbial community. Differences were considered significant if p < 0.05.

3. Results

3.1. Soil Chemical Properties

Soil chemical properties in shrublands and cropland are shown in Table 1. The concentrations of SOC were 1.6 and 1.1 times higher in shrubland I than in the cropland at depths of 0–20 and 20–40 cm, while it was 1.4 times higher in shrubland II than in the cropland at both depths. No significant differences in total N from shrubland I and shrubland II were observed at the depth of 0–20 cm, while the total N was highest in shrubland II at a depth of 20–40 cm, followed by shrubland I and finally cropland. NH4-N concentration was highest in shrubland I at both soil depths. The concentration of NO3-N was significantly higher in the cropland than the shrublands. For both layers, there was no difference in available P concentration between shrubland I and shrubland II. The concentration of available P was approximately 5 mg·kg−1 higher in cropland than in the C. kor. sites at a depth of 0–20 cm. At a depth of 20–40 cm, the concentration of available P was lower in cropland than in shrubland I and shrubland II. Apart from the total N in the cropland, the concentration of SOC, total NO3-N, and available P at a depth of 0–20 cm was consistently higher in the upper layer. The ratio of C to N varied from 6.43 to 9.48 under different vegetation types. The C/N ratio at both depths were significantly lower in shrubland II than in the cropland.

3.2. Soil Carbon Fraction and Its Proportion

The concentration of (HA+FA)-C had a range of 0.9–2.1 g·kg−1 (Table 2). At a depth of 0–20 cm, the concentrations of FA-C in shrubland I and shrubland II were significantly higher than that in the cropland (by a factor of about 1.7). At a depth of 20–40 cm, the concentrations of FA-C in the 28-year-old C. kor. site were significantly higher than in the other sites. HA-C in the cropland and shrubland had a range of 0.1–0.6 g·kg−1. There were no significant differences in HA-C concentrations among the cropland and shrublands at a depth of 0–20 cm. At a depth of 20–40 cm, HA-C concentration in increasing order was shrubland I, cropland, and shrubland II. At a depth of 0–20 cm, the proportion of FA-C in increasing order was cropland, shrubland I, and shrubland II. At a depth of 20–40 cm, the proportion of FA-C in shrubland II was significantly higher than in the other sites. In comparison, the HA-C/SOC from shrubland II and cropland was significantly higher than the shrubland I at both soil depths. The ratio of HA-C to FA-C varied from 0.17 to 0.64. At both soil layers, the ratio of HA-C to FA-C in increasing order was shrubland I, shrubland II, and cropland.

3.3. Soil Microbial Community Composition

A total of 36 PLFAs were detected. Twenty-eight of these PLFAs belonging to soil microbes were considered. Total PLFAs had a range of 10.9–51.0 nmol·g−1 soil at the two depths (Table 3). At both soil depths, total PLFAs, G+ bacterial, G bacterial, fungal, and actinobacterial PLFAs had the highest concentration in shrubland II, followed by shrubland I and finally cropland. Bacterial PLFAs accounted for 65–71% of the total PLFAs. At a depth of 0–20 cm, fungal PLFAs in the shrubland II site were significantly greater than that of cropland and shrubland I. For a given depth, the ratios of gram-positive/gram-negative bacteria were not statistically different between the vegetation types. These ratios were approximately 0.7 at a depth of 0–20 cm and 1.1 at a depth of 20–40 cm for all the sites. For both depths, the ratios of fungal/bacterial PLFAs were significantly lower in the shrublands than in the cropland. While these ratios were not statistically different for the shrublands between the two depths (about 1.3), it was significantly higher in the cropland at a depth of 20–40 cm than at a depth of 0–20 cm.

3.4. Correlation of Soil Chemical Properties, Carbon Fractions, and Microbial Community

As shown in Table 4, SOC, HS-C, and FA-C was significantly associated with total nitrogen (p < 0.05). There is a strong relationship between carbon fractions and soil microbial community. HS-C and FA-C were significantly correlated to the primary microbial groups, with the exception of fungi (p < 0.05). HA-C had a highly significant correlation with soil fungi, while SOC was observed to be strongly related to actinomyces. This indicated that the structure of the soil microbial community influenced carbon sequestration.

4. Discussion

4.1. Effect of Afforestation on Soil Carbon Sequestration

SOC is sensitive to land-use and land-cover change. Quantifying SOC is important for considerations of afforestation or reforestation [15]. In this study, we confirmed that afforestation with shrubs induced an increase in soil carbon. This finding is consistent with previous studies. Jia et al. suggested that SOC increased with the development of shrubs [7]. Additionally, An et al. found higher SOC in artificial shrublands than in croplands [8]. Throop and Archer reported that SOC increased with shrub (Prosopis velutina) size [16]. This increase in SOC may result from the higher carbon input and the lower rates of SOC decomposition and soil erosion associated with shrub plantation. Deng et al. reported that SOC was positively related to both litter and root biomass following afforestation [15]. Conventional tillage is typically used in the croplands on the Loess Plateau, which induces substantial carbon losses. Tillage disturbance results in accelerated SOC decomposition, before a decrease in SOC occurs [17]. In contrast, the establishment of shrubland can decrease artificial disturbance and subsequently enhance the SOC.
Furthermore, we found a higher SOC from shrubland I than shrubland II at a depth of 0–20 cm, while the results were opposite at a depth of 20–40 cm. This is related to a different mechanism of SOC sequestration for the topsoil and subsoil. This increase in SOC in topsoil may be associated with a higher carbon input and the lower rates of SOC decomposition following afforestation. The mechanisms associated with the SOC accumulation in the subsoil are different from those in the topsoil. A more extensive root system in shrubland II than shrubland I is the main factor in the higher accumulation of SOC at a depth of 20–40 cm. Qu et al. found the highest root biomass and soil organic carbon at a depth of 20–40 cm in 26-year-old C. korshinskii shrubland compared to 10-year-old, 40-year-old, and 50-year-old C. korshinskii shrubland [18].
Fulvic acid (FA) and humic acid (HA) form an important part of the organic matter in soil. Afforestation had a positive influence on FA-C and little influence on HA-C. This result is consistent with Guimarães et al., who reported that the HA fraction did not differ significantly with different soil uses [19]. However, this is not fully consistent with Reddy et al., who suggested that both HA-C and FA-C were higher in forest soils compared to agricultural soils [20]. Furthermore, we found an increase in the proportion of FA-C with C sequestration. This phenomenon implied that FA-C increased when the total organic carbon accumulated in soil after C. korshinskii plantation. The ratio of humic and fulvic acids (HA-C/FA-C) reflects the potential mobility of soil organic carbon. For shrublands and cropland, FA-C predominated with a HA-C/FA-C < 1. This indicated frequent inputs of fresh organic residues [19]. Moreover, the highest HA-C/FA-C was observed in cropland, followed by shrubland II, while the lowest was in the shrubland I. This indicated a substantial increase in fulvic acids following afforestation, especially in the early stage. According to the polyphenol theory, the structure of HA is believed to be an aromatic ring of the di- or trihydroxy phenyl type, bridged together by -O-, -CH2- and other groups [21]. In comparison, FA has a lower molecular weight and higher mobility than HA. The formation of FA occurs prior to the formation of HA. Above all, we conclude that afforestation enhanced FA-C in soil with frequent inputs of fresh organic residues.

4.2. Effect of Afforestation on Soil Microbial Community

Our results clearly demonstrated that afforestation had significant effects on the size and structure of soil microbial communities. Compared to the cropland, the microbial biomass that was marked by total PLFAs significantly increased after afforestation and increased with time after planting. This finding is consistent with previous studies. For instance, Cao et al. observed that shrub growth improved soil microbial biomass [22], while Jia et al. found that C. korshinskii that was planted on abandoned land gradually had a positive effect on the soil microbial biomass [7]. This higher bacterial biomass found in the shrubland soils is consistent with Hortal et al., who reported that the bacterial biomass increased with shrub size [23]. The fungal biomass was only observed significantly higher in shrubland II than the cropland in 0–20 cm layer. This finding is not precisely consistent with previous results. Hortal et al. reported that the fungal biomass increased with shrub size [23], while Bossio et al. found that afforestation improved fungal biomass and richness in addition to altering the microbial community structure (measured by the PLFA analysis) [24]. The microbial biomass and bacterial biomass strongly depend on plant productivity and carbon input. The greater amounts of soil microbial biomass suggested that more resources are available in shrubland soils than in cropland soils [25]. The higher concentration of SOC in shrubland soils may explain this phenomenon. According to the fungal biomass, we consider it to be related to the quality of plant residue and soil organic matter. Changes in the fungal biomass following afforestation were attributed to an increase in soil organic matter after the removal of soil disturbance.
Changes in the composition of soil microbial community (e.g., the ratios of fungi/bacteria and gram-positive bacteria/gram-negative bacteria) positively correlate with soil nutritional stress or negatively with resource availability. We found similar G+/G bacterial distributions in shrublands and cropland (0.6 at a depth of 0–20 cm and 1.0 at a depth of 20–40 cm), and lower fungi/bacteria in the shrubland soils than in the agricultural soils. The results are inconsistent with Macdonald et al., who reported increasing fungi/bacteria ratios after afforestation [26]. However, these results are consistent with Bailey [5], who showed a lower fungi/bacteria ratio in forest soils compared to agriculture field soils. Furthermore, Hortal et al. showed that the fungi/bacteria ratio decreased as the plant grows (Retama sphaerocarpa Boiss, a leguminous shrub) [23]. C. korshinskii is a deciduous leguminous shrub that has a strong N2-fixing ability. These results suggest that afforestation with planting leguminous shrub could significantly cause a decrease in fungi/bacteria. The C. korshinskii shrubland soils have a large number nitrogen-fixing microorganisms, such as rhizobacter, ammonifiers and nitrobacteria [27]. These microorganisms might contribute to the higher gram-negative bacterial biomass in shrublands soils [27], which resulted in a lower fungi/bacteria ratio.

4.3. Changes in Soil Microbial Community Control Soil Carbon Sequestration

Soil microbial community and carbon cycling are complex processes following afforestation. Our results showed a strong relationship between SOC, FA-C, and soil microbial community. Soil organic carbon was closely related to actinomycetes biomass. Nsabimana et al. suggested that land use had substantial effects on the size and diversity of the soil microbial community, with these changes possibly being broadly related to changes in the SOC [28]. We also found that FA-C was correlated with these main microbial groups except for fungi, while HA-C was related to fungal biomass. Jastrow et al. suggested that manipulations enhancing the fungal community and (bio) chemistry associated with the humidification process had the potential to increase the sequestration of C in soils [29]. Therefore, we further concluded that planting C. korshinskii resulted in significant changes in the bacterial and fungal biomass. These changes were closely related to carbon sequestration and humus formation.

5. Conclusions

Changes in carbon fractions and soil microbial community were assessed in the response to afforestation from abandoned cropland on the Loess Plateau of China. Our results indicated that afforestation caused increases in the G+, G, total bacterial, and actinomycetes biomass. Afforestation positively influenced SOC and FA-C. Additionally, we found that the changes in bacteria and actinomycetes were closely related to FA-C, while fungal biomass was strongly correlated with HA-C. These responses indicated that planting C. korshinskii in abandoned cropland could alter the size and structure of soil microbial community. Furthermore, these changes were closely related to carbon sequestration and the humus formation. The establishment of C. korshinskii shrubland in this area promoted soil organic carbon sequestration and soil ecological environment.

Acknowledgments

This study was supported by the National Natural Sciences Foundation of China (41671280), Key Projects in the National Science & Technology Pillar Program during the Twelfth Five-year Plan Period (2015BAC01B01), and Doctor Foundation of Shanxi Academy of Agricultural Sciences (YBSJJ1614).

Author Contributions

Yun Xiang, Man Cheng, Shaoshan An, Yimei Huang and Frédéric Darboux conceived and designed the study. Yun Xiang and Man Cheng performed the experiments and analyzed the data. Yun Xiang, Man Cheng and Shaoshan An wrote and edited the manuscript. All authors read and approved the final manuscript.

Conflicts of Interest

The authors declare no conflict of interest.

References

  1. Grigal, D.F. Effect of extensive forest management on soil productivity. Forest Ecol. Manag. 2000, 138, 167–185. [Google Scholar] [CrossRef]
  2. Lal, R. Soil carbon sequestration impacts on global climate change and food security. Science 2004, 304, 1623–1627. [Google Scholar] [CrossRef] [PubMed]
  3. Milori, D.M.B.P.; Martin-Neto, L.; Bayer, C.; Mielniczuk, J.; Bagnato, V.S. Humification degree of soil humic acids determined by fluorescence spectroscopy. Soil Sci. 2002, 167, 739–749. [Google Scholar] [CrossRef]
  4. Lal, R. Soil carbon sequestration to mitigate climate change. Geoderma 2004, 123, 1–22. [Google Scholar] [CrossRef]
  5. Bailey, V.L.; Smith, J.L.; Bolton, H., Jr. Fungal-to-bacterial ratios in soils investigated for enhanced C sequestration. Soil Biol. Biochem. 2002, 34, 997–1007. [Google Scholar] [CrossRef]
  6. Six, J.; Frey, S.D.; Thiet, R.K.; Batten, K.M. Bacterial and Fungal Contributions to Carbon Sequestration in Agroecosystems. Soil Sci. Soc. Am. J. 2006, 70, 555–569. [Google Scholar] [CrossRef]
  7. Jia, G.M.; Liu, B.R.; Wang, G.; Zhang, B. The microbial biomass and activity in soil with shrub Caragana korshinskii K.) plantation in the semi-arid loess plateau in China. Eur. J. Soil Biol. 2010, 46, 6–10. [Google Scholar] [CrossRef]
  8. An, S.S.; Mentler, A.; Mayer, H.; Blum, W.E.H. Soil aggregation, aggregate stability, organic carbon and nitrogen in different soil aggregate fractions under forest and shrub vegetation on the Loess Plateau, China. Catena 2010, 81, 226–233. [Google Scholar] [CrossRef]
  9. Wei, X.R.; Shao, M.A.; Fu, X.L.; Horton, R. Changes in soil organic carbon and total nitrogen after 28 years grassland afforestation: Effects of tree species, slope position, and soil order. Plant Soil 2009, 331, 165–179. [Google Scholar] [CrossRef]
  10. Staff, S.S. Keys to Soil Taxonomy, 11th ed.; U.S. Department of Agriculture: Washington, DC, USA, 2010.
  11. Walkley, A.J.; Black, I.A. An examination of the Degtjareff method for determining soil organic matter, and a proposed modification of the chromic acid titration method. Soil Sci. 1934, 37, 29–38. [Google Scholar] [CrossRef]
  12. Yan, C.S. The Soil Fertility Research Methods; China Agriciltural Press: Beijing, China, 1988. [Google Scholar]
  13. Sun, C.U.; Liu, J.S.; Wang, Y.; Zheng, N.; Wu, X.Q.; Liu, Q. Effect of long-term cultivation on soil organic carbon fractions and metal distribution in humic and fulvic acid in black soil, Northeast China. Soil Res. 2012, 50, 562–569. [Google Scholar] [CrossRef]
  14. Bossio, D.A.; Scow, S.K. Impacts of carbon and flooding on soil microbial communities: Phospholipid fatty acid profiles and substrate utilization patterns. Microb. Eco. 1998, 35, 265–278. [Google Scholar] [CrossRef]
  15. Deng, Q.; Cheng, X.; Yang, Y.; Zhang, Q.; Luo, Y. Carbon–nitrogen interactions during afforestation in central China. Soil Biol. Biochem. 2014, 69, 119–122. [Google Scholar] [CrossRef]
  16. Throop, H.; Archer, S.R. Spatial patterns of soil organic carbon relative to tree size and canopy distribution in a semidesert grassland. Glob. Chang. Biol. 2008, 14, 2420–2431. [Google Scholar] [CrossRef]
  17. Balesdent, J.C.C.; Balabane, M. Relationship of soil organic matter dynamics to physical protection and tillage. Soil Till. Res. 2000, 53, 215–230. [Google Scholar] [CrossRef]
  18. Qi, W.D.; Chen, Y.M.; Wang, L.L.; Zhang, F.; Zhang, X.W. Dynamics of soil organic carbon in Caragana microphylla forest and its relationship with environment factors in loess hilly region. Chin. Sci. Soil Water Conserv. 2011, 9, 72–77. [Google Scholar]
  19. Guimarães, D.V.; Gonzaga, M.I.S.; Da Silva, T.O.; Da Silva, T.L.; Da Silva Dias, N.; Matias, M.I.S. Soil organic matter pools and carbon fractions in soil under different land uses. Soil Till. Res. 2013, 126, 177–182. [Google Scholar] [CrossRef]
  20. Reddy, S.B.; Nagaraja, M.S.; Punish Raj, T.S.; Dhumgond, P.; Vignesh, N.S. Soil humic and fulvic acid fractions under different land use systems. Madras Agric. J. 2012, 99, 507–510. [Google Scholar]
  21. Stevenson, F.J. Humus Chemistry; John Wiley & Sons: New York, UY, USA, 1982. [Google Scholar]
  22. Cao, C.; Jiang, D.; Teng, X.; Jiang, Y.; Liang, W.; Cui, Z. Soil chemical and microbiological properties along a chronosequence of Caragana microphylla Lam. plantations in the Horqin sandy land of Northeast China. Appl. Soil Ecol. 2008, 40, 78–85. [Google Scholar] [CrossRef]
  23. Hortal, S.; Bastida, F.; Armas, C.; Lozano, Y.M.; Moreno, J.L.; García, C.; Pugnaire, F.I. Soil microbial community under a nurse-plant species changes in composition, biomass and activity as the nurse grows. Soil Biol. Biochem. 2013, 64, 139–146. [Google Scholar] [CrossRef]
  24. Bossio, D.A.; Girvan, M.S.; Verchot, L.; Bullimore, J.; Borelli, T.; Albrecht, A.; Scow, K.M.; Ball, A.S.; Pretty, J.N.; Osborn, A.M. Soil microbial community response to land use change in an agricultural landscape of western Kenya. Microb. Ecol. 2005, 49, 50–62. [Google Scholar] [CrossRef] [PubMed]
  25. Burton, J.; Chen, C.; Xu, Z.; Ghadiri, H. Soil microbial biomass, activity and community composition in adjacent native and plantation forests of subtropical Australia. J. Soil Sediment. 2010, 10, 1267–1277. [Google Scholar] [CrossRef]
  26. Macdonald, C.A.; Thomas, N.; Robinson, L.; Tate, K.R.; Ross, D.J.; Dando, J.; Singh, B.K. Physiological, biochemical and molecular responses of the soil microbial community after afforestation of pastures with Pinus radiata. Soil Biol. Biochem. 2009, 41, 1642–1651. [Google Scholar] [CrossRef]
  27. Yan, H.; Huang, Y.M.; Jiang, Y.L.; Zhao, T. Soil mineralization under two kinds of shrub lands in mountainous area of sourthern Ningxia, Northwest China. Acta Sci. Cirumstantiae 2014, 34, 2111–2120. [Google Scholar]
  28. Nsabimana, D.; Haynes, R.J.; Wallis, F.M. Size, activity and catabolic diversity of the soil microbial biomass as affected by land use. Appl. Soil Ecol. 2004, 26, 81–92. [Google Scholar] [CrossRef]
  29. Jastrow, J.D.; Amonette, J.E.; Bailey, V.L. Mechanisms controlling soil carbon turnover and their potential application for enhancing carbon sequestration. Clim. Chang. 2006, 80, 5–23. [Google Scholar] [CrossRef]
Figure 1. The location of the study area and sampling sites: (AC) cropland; (DF) 26-year-old C. korshinskii; in addition to (GI) 16-year-old C. korshinskii.
Ijerph 14 00948 g001
Table 1. Soil chemical and physical properties (mean ± standard error, n = 9).
Vegetation TypeDepth (cm)SOCTotal·NNH4-NNO3-NAvailable pC/NBulk Density
g·kg−1g·kg−1mg·kg−1mg·kg−1mg·kg−1 g·cm−3
Cropland0–207.66 ± 0.10Ca0.89 ± 0.19Ba3.75 ± 0.50Ba13.10 ± 0.05Aa9.37 ± 0.54Aa8.61 ± 0.29Aa1.30
20–406.35 ± 0.28Cb0.67 ± 0.02Ca3.69 ± 0.26Ca8.08 ± 0.38Ab2.55 ± 0.13Bb9.48 ± 0.57Aa1.51
shrubland I0–2012.39 ± 0.15Aa1.45 ± 0.06Aa6.02 ± 0.12Aa7.46 ± 0.18Ba4.89 ± 0.21Ba8.55 ± 0.27Aa1.04
20–407.43 ± 0.18 Bb0.92 ± 0.07Bb5.71 ± 0.03Aa6.41 ± 0.20Bb3.57 ± 0.20Ab8.14 ± 0.84ABa1.14
shrubland II0–2010.38 ± 0.37Ba1.59 ± 0.07Aa5.07 ± 0.23Ba7.67 ± 0.20Ba4.24 ± 0.13Ba6.52 ± 0.37Ba1.17
20–408.80 ± 0.02Ab1.37 ± 0.09Ab4.37 ± 0.06Ba5.96 ± 0.19Bb3.31 ± 0.19Ab6.43 ± 0.25Ba1.30
Different lowercase letters indicate significant differences at p < 0.05 at soil depths for each vegetation type; different capital letters indicate significant differences at p < 0.05 among different vegetation types at a same depth. SOC = soil organic carbon.
Table 2. Soil organic carbon fraction concentrations and their proportion to total SOC.
Vegetation TypeDepth (cm)FA-C (Fulvic Acid)HA-C (Humic Acid)HA-C/FA-C
Concentration (g·kg−1)Proportion to Total SOC (%)Concentration (g·kg−1)Proportion to Total SOC (%)
Cropland0–200.76 ± 0.13Ba9.9C0.48 ± 0.01Aa6.3A0.63 ± 0.09Aa
20–400.63 ± 0.13Ba10.0B0.28 ± 0.01Bb4.4A0.45 ± 0.10Aa
shrubland I0–201.64 ± 0.06Aa13.2B0.44 ± 0.01Aa3.5B0.27 ± 0.01Ca
20–400.78 ± 0.02Bb10.4B0.13 ± 0.01Cb1.7B0.17 ± 0.02Ca
shrubland II0–201.61 ± 0.05Aa15.6A0.54 ± 0.01Aa5.2A0.34 ± 0.08Ba
20–401.17 ± 0.03Ab13.3A0.41 ± 0.03Ab4.7A0.35 ± 0.01Ba
Different lowercase letters indicate significant differences at p < 0.05 within soil depths for each vegetation type; different capital letters indicate significant differences at p < 0.05 among different vegetation types at the same depth.
Table 3. The concentrations of total phospholipid fatty acids (PLFAs), Gram-positive (G+) bacterial, Gram-negative (G) bacterial, total bacterial, fungal, actinomycetic PLFAs (nmol·g−1·soil, mean ± standard error, n = 9) and the ratio of G+:G bacterial PLFAs and fungal:bacterial PLFAs in the soils of cropland and shrublands.
Vegetation TypeDepth (cm)Total PLFAsG+ Bacterial PLFAs aG Bacterial PLFAs bBacterial PLFAs cFungal PLFA dActinomycetic PLFAs eG+:G Bacterial PLFAsFungal:Bacterial PLFAs
Cropland0–2029.17 ± 0.99Ca4.79 ± 0.34Ca7.42 ± 0.21Ca20.30 ± 0.89Ca3.83 ± 0.12Ba1.47 ± 0.03Ca0.64 ± 0.03Ab2.61 ± 0.14Ab
20–4010.89 ± 0.48Cb1.53 ± 0.16Cb1.40 ± 0.09Cb7.12 ± 0.23Cb2.20 ± 0.11Ab0.42 ± 0.01Cb1.09 ± 0.05Aa5.25 ± 0.16Aa
shrubland I0–2035.98 ± 0.38Ba6.55 ± 0.34Ba9.23 ± 0.35Ba24.95 ± 0.49Ba3.50 ± 0.35Ba2.50 ± 0.05Ba0.71 ± 0.01Ab1.41 ± 0.17Ba
20–4019.04 ± 0.50Bb3.93 ± 0.03Bb3.89 ± 0.25Bb13.31 ± 0.21Bb1.78 ± 0.20Bb1.44 ± 0.08Bb1.01 ± 0.07Aa1.24 ± 0.21Ba
shrubland II0–2051.02 ± 1.57Aa9.33 ± 0.59Aa14.18 ± 0.06Aa36.14 ± 0.99Aa4.54 ± 0.11Aa3.19 ± 0.34Aa0.66 ± 0.04Ab1.43 ± 0.12Ba
20–4028.62 ± 1.03Ab6.48 ± 0.40Ab5.77 ± 0.36Ab19.86 ± 0.78Ab2.53 ± 0.19Ab2.22 ± 0.19Aa1.12 ± 0.02Aa1.15 ± 0.18Ba
Different lowercase letters indicate significant differences at p < 0.05 between soil depths for each vegetation type; different capital letters indicate significant differences at p < 0.05 among different vegetation types at a same depth. a a14:0, i14:0, i15:0, a16:0, i16:0, a17:0, i17:0; b 16:1ω5c, 16:1ω7, 16:1ω9, cy17:0, 18:1ω7, cy19:0, 16:1ω7t, 17:1ω8c; c 14:0, 15:0, 16:0, 17:0, 18:0, 20:0 and G+, G bacterial PLFAs; d 18:2ω6,9, 18:1ω9c, 18:1ω9t; e 10Me 16:0, 10Me 17:0, 10Me 18:0.
Table 4. Correlation coefficient (r) matrix between soil microbial groups and indicators of soil chemistry and carbon fractions.
SOCFA-CHA-CHA-C/FA-C
Soil Chemical and Physical Properties
TN0.869 *0.957 **0.622–0.376
C/N–0.358–0.554–0.4140.270
NO3-N–0.222–0.3250.3960.866 *
NH4-N0.6820.613–0.177–0.853 *
Available P0.054–0.0820.4700.671
Bulk density–0.758–0.855 *–0.6100.309
Soil Microbial Community
Total PLFAs0.7660.861 *0.790–0.074
G+ Bacterial 0.7630.875 *0.711–0.206
G Bacterial 0.7470.831 *0.782–0.041
Bacterial 0.7580.855 *0.783–0.078
Fungi0.5870.6360.916 *0.362
Actinomycetes0.832 *0.921 **0.643–0.321
G+/G–0.552–0.490–0.679–0.292
F/B–0.604–0.607–0.1830.522
* and ** indicate the significance at p < 0.05 and p < 0.01, respectively. Definitions: TN = Total nitrogen; HA-C = humic acid; FA-C = ulvic acid; G+ refers to gram-negative bacteria; and G refers to gram-positive bacteria.

