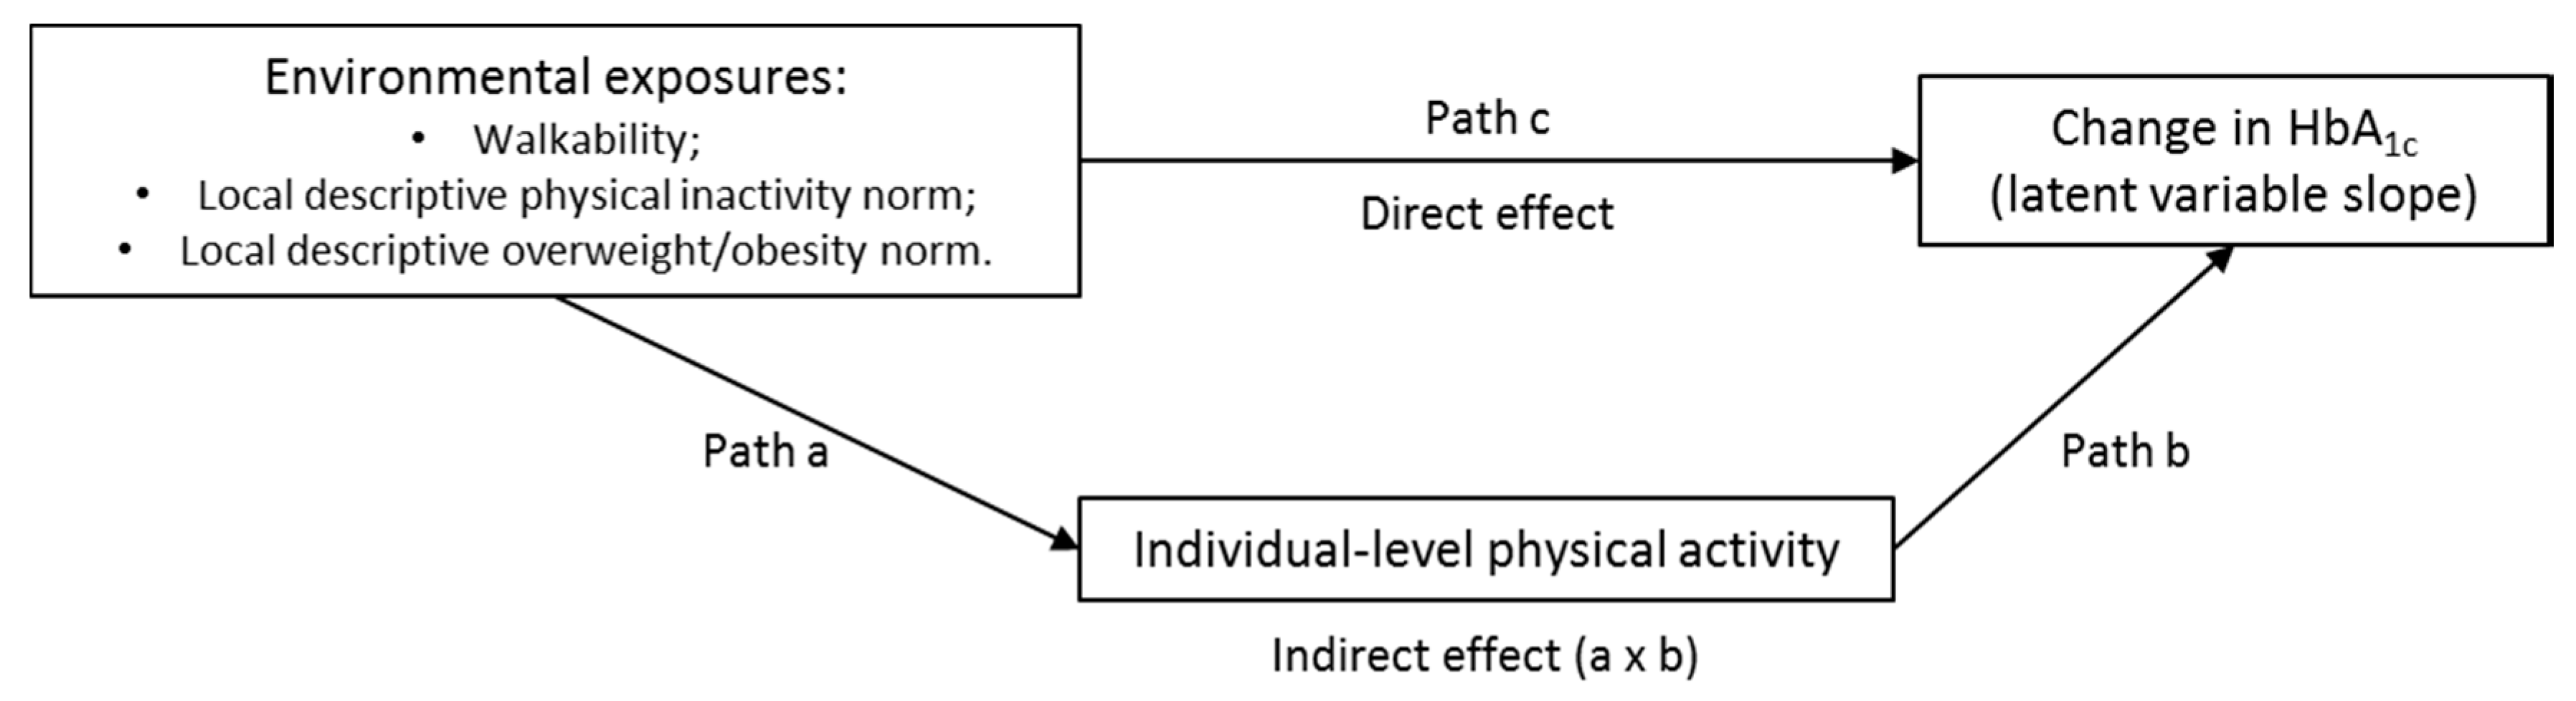
Does Physical Activity Mediate the Associations Between Local-Area Descriptive Norms, Built Environment Walkability, and Glycosylated Hemoglobin?

 , , ,
, , , 
Abstract
:1. Introduction
2. Methods
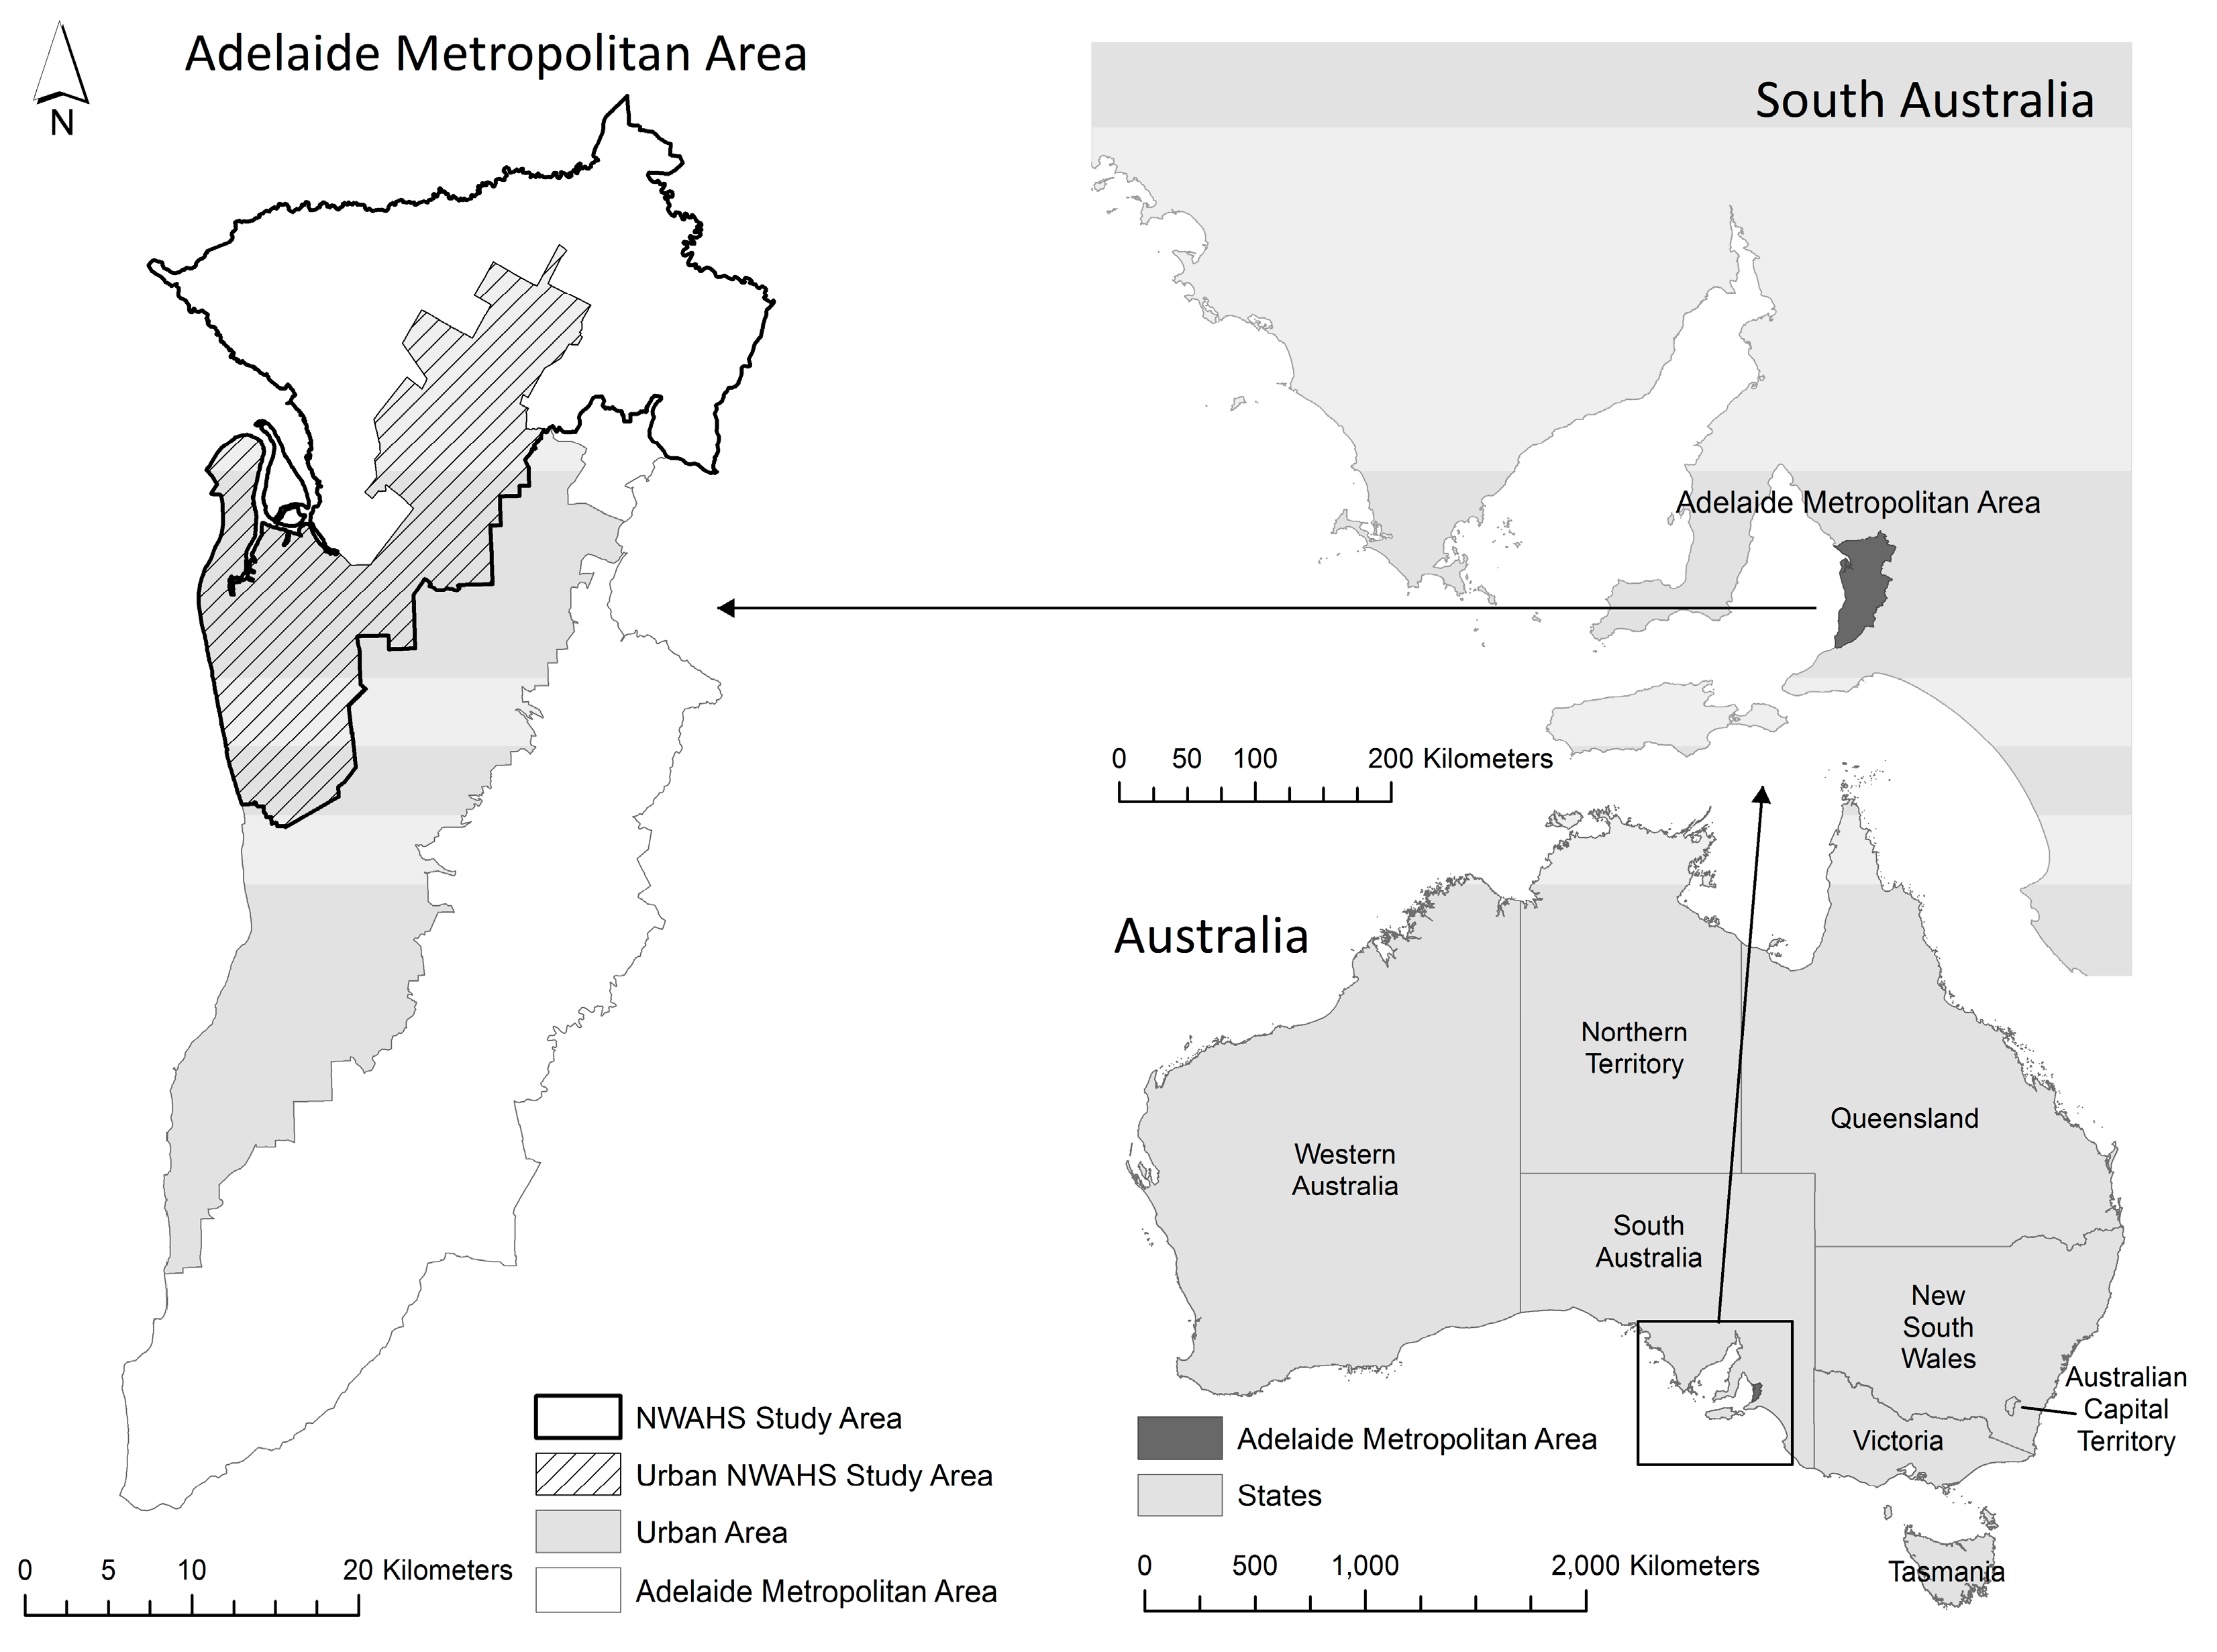
2.1. Study Area
2.2. Participants
2.3. Measures
2.3.1. Outcome Measure: HbA1c
2.3.2. Individual-Level Physical Activity Information
2.3.3. Environmental Measures
2.3.4. Covariates
2.4. Analyses
3. Results
4. Discussion
5. Conclusions
Acknowledgments
Author Contributions
Conflicts of Interest
References
- Warburton, D.E.R.; Nicol, C.W.; Bredin, S.S.D. Health benefits of physical activity: The evidence. Can. Med. Assoc. J. 2006, 174, 801–809. [Google Scholar] [CrossRef] [PubMed]
- Thompson, P.D.; Buchner, D.; Piña, I.L.; Balady, G.J.; Williams, M.A.; Marcus, B.H.; Berra, K.; Blair, S.N.; Costa, F.; Franklin, B. Exercise and physical activity in the prevention and treatment of atherosclerotic cardiovascular disease. Arterioscler. Thromb. Vasc. Biol. 2003, 23, e42–e49. [Google Scholar] [CrossRef]
- Penedo, F.J.; Dahn, J.R. Exercise and well-being: A review of mental and physical health benefits associated with physical activity. Curr. Opin. Psychiatry 2005, 18, 189–193. [Google Scholar] [CrossRef] [PubMed]
- Greaves, C.J.; Sheppard, K.E.; Abraham, C.; Hardeman, W.; Roden, M.; Evans, P.H.; Schwarz, P. Systematic review of reviews of intervention components associated with increased effectiveness in dietary and physical activity interventions. BMC Public Health 2011, 11, 119. [Google Scholar] [CrossRef] [PubMed] [Green Version]
- Daniel, M.; Lekkas, P.; Cargo, M. Environments and cardiometabolic diseases in Aboriginal populations. Heart Lung Circ. 2010, 19, 306–315. [Google Scholar] [CrossRef] [PubMed]
- Rose, G. Sick individuals and sick populations. Int. J. Epidemiol. 1985, 14, 32–38. [Google Scholar] [CrossRef] [PubMed]
- Daniel, M.; Lekkas, P.; Cargo, M.; Stankov, I.; Brown, A. Environmental risk conditions and pathways to cardiometabolic diseases in Indigenous populations. Annu. Rev. Public Health 2011, 32, 327–347. [Google Scholar] [CrossRef] [PubMed]
- Green, L.W.; Richard, L.; Potvin, L. Ecological foundations of health promotion. Am. J. Health Promot. 1996, 10, 270–281. [Google Scholar] [CrossRef] [PubMed]
- Green, L.W.; Kreuter, M.W. Health Program Planning: An Educational and Ecological Approach, 4th ed.; McGraw-Hill: Boston, MA, USA, 2005. [Google Scholar]
- Sallis, J.F.; Floyd, M.F.; Rodríguez, D.A.; Saelens, B.E. Role of built environments in physical activity, obesity, and cardiovascular disease. Circulation 2012, 125, 729–737. [Google Scholar] [CrossRef] [PubMed]
- Daniel, M.; Green, L.W. Health promotion and education. In Encyclopedia of Public Health; Breslow, L., Ed.; Macmillan: New York, NY, USA, 2002; Volume 2, pp. 541–548. [Google Scholar]
- Leal, C.; Chaix, B. The influence of geographic life environments on cardiometabolic risk factors: A systematic review, a methodological assessment and a research agenda. Obes. Rev. 2011, 12, 217–230. [Google Scholar] [CrossRef] [PubMed]
- Kaczynski, A.T.; Henderson, K.A. Environmental correlates of physical activity: A review of evidence about parks and recreation. Leis. Sci. 2007, 29, 315–354. [Google Scholar] [CrossRef]
- Gascon, M.; Triguero-Mas, M.; Martínez, D.; Dadvand, P.; Rojas-Rueda, D.; Plasència, A.; Nieuwenhuijsen, M.J. Residential green spaces and mortality: A systematic review. Environ. Int. 2016, 86, 60–67. [Google Scholar] [CrossRef] [PubMed] [Green Version]
- Riva, M.; Gauvin, L.; Barnett, T.A. Toward the next generation of research into small area effects on health: A synthesis of multilevel investigations published since July 1998. J. Epidemiol. Community Health 2007, 61, 853–861. [Google Scholar] [CrossRef] [PubMed] [Green Version]
- Diez Roux, A.V.; Mair, C. Neighborhoods and health. Ann. N. Y. Acad. Sci. 2010, 1186, 125–145. [Google Scholar] [CrossRef] [PubMed]
- Bauman, A.E.; Reis, R.S.; Sallis, J.F.; Wells, J.C.; Loos, R.J.F.; Martin, B.W. Correlates of physical activity: Why are some people physically active and others not? Lancet 2012, 380, 258–271. [Google Scholar] [CrossRef]
- Grasser, G.; Van Dyck, D.; Titze, S.; Stronegger, W. Objectively measured walkability and active transport and weight-related outcomes in adults: A systematic review. Int. J. Public Health 2013, 58, 615–625. [Google Scholar] [CrossRef] [PubMed]
- Humpel, N.; Owen, N.; Leslie, E. Environmental factors associated with adults’ participation in physical activity: A review. Am. J. Prev. Med. 2002, 22, 188–199. [Google Scholar] [CrossRef]
- Koohsari, M.J.; Badland, H.; Giles-Corti, B. (Re) Designing the built environment to support physical activity: Bringing public health back into urban design and planning. Cities 2013, 35, 294–298. [Google Scholar] [CrossRef]
- McCormack, G.R.; Shiell, A. In search of causality: A systematic review of the relationship between the built environment and physical activity among adults. Int. J. Behav. Nutr. Phys. Act. 2011, 8. [Google Scholar] [CrossRef] [PubMed]
- Saelens, B.E.; Handy, S.L. Built environment correlates of walking: A review. Med. Sci. Sports Exerc. 2008, 40, S550–S566. [Google Scholar] [CrossRef] [PubMed]
- Van Cauwenberg, J.; De Bourdeaudhuij, I.; De Meester, F.; Van Dyck, D.; Salmon, J.; Clarys, P.; Deforche, B. Relationship between the physical environment and physical activity in older adults: A systematic review. Health Place 2011, 17, 458–469. [Google Scholar] [CrossRef] [PubMed]
- Lachowycz, K.; Jones, A.P. Greenspace and obesity: A systematic review of the evidence. Obes. Rev. 2011, 12, e183–e189. [Google Scholar] [CrossRef] [PubMed]
- Malambo, P.; Kengne, A.P.; De Villiers, A.; Lambert, E.V.; Puoane, T. Built environment, selected risk factors and major cardiovascular disease outcomes: A systematic review. PLoS ONE 2016, 11, e0166846. [Google Scholar] [CrossRef] [PubMed]
- Hill, A.B. The environment and disease: Association or causation? Proc. R. Soc. Med. 1965, 58, 295–300. [Google Scholar] [CrossRef] [PubMed]
- Daniel, M.; Moore, S.; Kestens, Y. Framing the biosocial pathways underlying associations between place and cardiometabolic disease. Health Place 2008, 14, 117–132. [Google Scholar] [CrossRef] [PubMed]
- Van Dyck, D.; Cerin, E.; Cardon, G.; Deforche, B.; Sallis, J.F.; Owen, N.; de Bourdeaudhuij, I. Physical activity as a mediator of the associations between neighborhood walkability and adiposity in Belgian adults. Health Place 2010, 16, 952–960. [Google Scholar] [CrossRef] [PubMed]
- Stafford, M.; Cummins, S.; Ellaway, A.; Sacker, A.; Wiggins, R.D.; Macintyre, S. Pathways to obesity: Identifying local, modifiable determinants of physical activity and diet. Soc. Sci. Med. 2007, 65, 1882–1897. [Google Scholar] [CrossRef] [PubMed]
- Frank, L.D.; Kerr, J.; Sallis, J.F.; Miles, R.; Chapman, J. A hierarchy of sociodemographic and environmental correlates of walking and obesity. Prev. Med. 2008, 47, 172–178. [Google Scholar] [CrossRef] [PubMed]
- Santana, P.; Santos, R.; Nogueira, H. The link between local environment and obesity: A multilevel analysis in the Lisbon metropolitan area, Portugal. Soc. Sci. Med. 2009, 68, 601–609. [Google Scholar] [CrossRef] [PubMed]
- Hertzman, C.; Boyce, T. How experience gets under the skin to create gradients in developmental health. Annu. Rev. Public Health 2010, 31, 329–347. [Google Scholar] [CrossRef] [PubMed]
- Blok, D.J.; de Vlas, S.J.; van Empelen, P.; Richardus, J.H.; van Lenthe, F.J. Changes in smoking, sports participation and overweight: Does neighborhood prevalence matter? Health Place 2013, 23, 33–38. [Google Scholar] [CrossRef] [PubMed]
- Carroll, S.J.; Paquet, C.; Howard, N.J.; Coffee, N.T.; Adams, R.J.; Taylor, A.W.; Niyonsenga, T.; Daniel, M. Local descriptive body weight and dietary norms, food availability, and 10-year change in glycosylated haemoglobin in an Australian population-based biomedical cohort. BMC Public Health 2017, 17, 149. [Google Scholar] [CrossRef] [PubMed]
- Carroll, S.J.; Paquet, C.; Howard, N.J.; Coffee, N.T.; Taylor, A.W.; Niyonsenga, T.; Daniel, M. Local descriptive norms for overweight/obesity and physical inactivity, features of the built environment, and 10-year change in glycosylated haemoglobin in an Australian population-based biomedical cohort. Soc. Sci. Med. 2016, 166, 233–243. [Google Scholar] [CrossRef] [PubMed]
- Cialdini, R.B.; Reno, R.R.; Kallgren, C.A. A focus theory of normative conduct: Recycling the concept of norms to reduce littering in public places. J. Personal. Soc. Psychol. 1990, 58, 1015–1026. [Google Scholar] [CrossRef]
- Carrus, G.; Bonnes, M.; Fornara, F.; Passafaro, P.; Tronu, G. Planned behavior and “local” norms: An analysis of the space-based aspects of normative ecological behavior. Cogn. Process. 2009, 10, 198–200. [Google Scholar] [CrossRef] [PubMed]
- Fornara, F.; Carrus, G.; Passafaro, P.; Bonnes, M. Distinguishing the sources of normative influence on proenvironmental behaviors: The role of local norms in household waste recycling. Group Process. Interg. 2011, 14, 623–635. [Google Scholar] [CrossRef]
- Kormos, C.; Gifford, R.; Brown, E. The influence of descriptive social norm information on sustainable transportation behavior: A field experiment. Environ. Behav. 2015, 47, 479–501. [Google Scholar] [CrossRef]
- Australian Bureau of Statistics (ABS). Statistical Geography Volume 2: Census Geographic Areas Australia; Cat. No. 2905.0; ABS: Canberra, Australia, 2001.
- Australian Bureau of Statistics (ABS). Usual Residents Profile 2001; Cat. No. 2004.0; ABS: Canberra, Australia, 2003.
- Dal Grande, E.; Taylor, A.; Hurst, B.; Kenny, B.; Catcheside, B. The Health Status of People Living in the South. Australian Divisions of General Practice: South. Australian Monitoring and Surveillance System July 2002–December 2003; Population Research and Outcome Studies Unit, South Australian Department of Health: Adelaide, Australia, 2004.
- South Australian Department of Health. HOS: Self Reported Prevalence of Obesity in the SA Health Regions; Population Research and Outcome Studies Unit, South Australian Department of Health: Adelaide, Australia, 2005.
- Wilcox, S.; Castro, C.; King, A.C.; Housemann, R.; Brownson, R.C. Determinants of leisure time physical activity in rural compared with urban older and ethnically diverse women in the United States. J. Epidemiol. Community Health 2000, 54, 667–672. [Google Scholar] [CrossRef] [PubMed]
- Grant, J.; Chittleborough, C.; Taylor, A.; Dal Grande, E.; Wilson, D.; Phillips, P.; Adams, R.; Cheek, J.; Price, K.; Gill, T.; et al. The North West Adelaide Health Study: Detailed methods and baseline segmentation of a cohort for chronic diseases. Epidemiol. Perspect. Innov. 2006, 3. [Google Scholar] [CrossRef] [PubMed]
- Grant, J.; Taylor, A.; Ruffin, R.; Wilson, D.; Phillips, P.; Adams, R.; Price, K. Cohort profile: The North West Adelaide Health Study (NWAHS). Int. J. Epidemiol. 2009, 38, 1479–1486. [Google Scholar] [CrossRef] [PubMed]
- Bennett, C.M.; Guo, M.; Dharmage, S.C. HbA1c as a screening tool for detection of type 2 diabetes: A systematic review. Diabet. Med. 2007, 24, 333–343. [Google Scholar] [CrossRef] [PubMed]
- IEC. International Expert Committee Report on the role of the A1c assay in the diagnosis of diabetes. Diabetes Care 2009, 32, 1327–1334. [Google Scholar]
- Khaw, K.-T.; Wareham, N.; Bingham, S.; Luben, R.; Welch, A.; Day, N. Association of hemoglobin A1c with cardiovascular disease and mortality in adults: The European Prospective Investigation into Cancer in Norfolk. Ann. Intern. Med. 2004, 141, 413–420. [Google Scholar] [CrossRef] [PubMed]
- Brown, W.; Bauman, A.; Bull, F.; Burton, N.W. Development of Evidence-Based Physical Activity Recomendations for Adults (18–64 Years); Australian Government Department of Health: Canberra, Australia, 2012.
- Australian Institute of Health and Welfare (AIHW). The Active Australia Survey: A Guide and Manual for Implementation, Analysis and Reporting; AIHW: Canberra, Australia, 2003.
- Bohannon, R.W. Comfortable and maximum walking speed of adults aged 20–79 years: Reference values and determinants. Age Ageing 1997, 26, 15–19. [Google Scholar] [CrossRef] [PubMed]
- Population Research and Outcome Studies. South Australian Monitoring and Surveillance System (SAMSS). Available online: http://health.adelaide.edu.au/pros/data/samss/ (accessed on 27 June 2012).
- Population Research and Outcome Studies. South Australian Monitoring and Surveillance System: Survey Methodology, SAMSS Technical Paper Series No. 1/04, August 2004. Available online: http://health.adelaide.edu.au/pros/docs/reports/report_samss_tech_paper.pdf (accessed on 28 June 2012).
- World Health Organization (WHO). Global Database on Body Mass Index: An Interactive Surveillance Tool for Monitoring Nutrition Transition. Available online: http://apps.who.int/bmi/index.jsp (accessed on 11 September 2014).
- Pitney Bowes Business Insight. Adelaide 2007 StreetPro and Roads; Pitney Bowes Business Insight: Illnau-Effretikon, Switzerland, 2007. [Google Scholar]
- Department of Planning, Transport and Infrastructure (DPTI). South Australian Property Cadastre; DPTI, Government of South Australia: Adelaide, Australia, 2007.
- Department of Planning, Transport and Infrastructure (DPTI). South Australian Retail Database; DPTI, Government of South Australia: Adelaide, Australia, 2007.
- Leslie, E.; Coffee, N.; Frank, L.; Owen, N.; Bauman, A.; Hugo, G. Walkability of local communities: Using geographic information systems to objectively assess relevant environmental attributes. Health Place 2007, 13, 111–122. [Google Scholar] [CrossRef] [PubMed]
- Frank, L.D.; Schmid, T.L.; Sallis, J.F.; Chapman, J.; Saelens, B.E. Linking objectively measured physical activity with objectively measured urban form: Findings from SMARTRAQ. Am. J. Prev. Med. 2005, 28, 117–125. [Google Scholar] [CrossRef] [PubMed]
- Coffee, N.T. Constructing An Objective Index of Walkability. Master‘s Thesis, University of Adelaide, Adelaide, Australia, 2005. [Google Scholar]
- Coffee, N.T.; Howard, N.; Paquet, C.; Hugo, G.; Daniel, M. Is walkability associated with a lower cardiometabolic risk? Health Place 2013, 21, 163–169. [Google Scholar] [CrossRef] [PubMed]
- Carroll, S.J. The Contributions of Compositional and Contextual Features of Local Residential Areas to the Evolution of Cardiometabolic Risk over Ten Years in a Population-Based Biomedical Cohort. Ph.D. Thesis, University of South Australia, Adelaide, Australia, 2017. [Google Scholar]
- Schüle, S.A.; Bolte, G. Interactive and independent associations between the socioeconomic and objective built environment on the neighbourhood level and individual health: A systematic review of multilevel studies. PLoS ONE 2015, 10, e0123456. [Google Scholar] [CrossRef] [PubMed]
- Australian Bureau of Statistics (ABS). Basic Community Profile (BCP) DataPack, 2nd ed.; Cat. No. 20069.0.30.001; ABS: Canberra, Australia, 2006.
- Australian Bureau of Statistics (ABS). Australian Standard Geographic Classification Volume 2: Census Geographic Areas; ABS: Canberra, Australia, 2006.
- West, B.T.; Welch, K.B.; Galecki, A.T. Linear Mixed Models: A Practical Guide Using Statistical Software; Chapman & Hall/CRC: Boca Raton, FL, USA, 2007. [Google Scholar]
- Muthen, B.O.; Muthen, L.K.; Asparouhov, T. Regression and Mediation Analysis Using Mplus; Muthen & Muthen: Los Angeles, CA, USA, 2016. [Google Scholar]
- Muthen, L.K.; Muthen, B.O. Mplus User's Guide, 8th ed.; Muthen & Muthen: Los Angeles, CA, USA, 2017. [Google Scholar]
- MacKinnon, D.P.; Fairchild, A.J. Current directions in mediation analysis. Curr. Dir. Psychol. Sci. 2009, 18, 16–20. [Google Scholar] [CrossRef] [PubMed]
- Gunzler, D.; Chen, T.; Wu, P.; Zhang, H. Introduction to mediation analysis with structural equation modeling. Shanghai Arch. Psychiatry 2013, 25, 390. [Google Scholar] [PubMed]
- Enders, C.K.; Bandalos, D.L. The relative performance of full information maximum likelihood estimation for missing data in structural equation models. Struct. Equ. Mod. 2001, 8, 430–457. [Google Scholar] [CrossRef]
- Arbuckle, J.L. Full information estimation in the presence of incomplete data. In Advanced Structural Equation Modeling: Issues and Techniques; Lawrence Erlbaum Associates: Mahwah, NJ, USA, 1996. [Google Scholar]
- Ukoumunne, O.; Gulliford, M.; Chinn, S.; Sterne, J.; Burney, P. Methods for evaluating area-wide and organisation-based interventions in health and health care: A systematic review. Health Technol. Assess. 1999, 3, 98. [Google Scholar]
- D’Agostino, R.B.; Vasan, R.S.; Pencina, M.J.; Wolf, P.A.; Cobain, M.; Massaro, J.M.; Kannel, W.B. General cardiovascular risk profile for use in primary care. Circulation 2008, 117, 743–753. [Google Scholar] [CrossRef] [PubMed]
- Leiter, L.A.; Fitchett, D.H.; Gilbert, R.E.; Gupta, M.; Mancini, G.B.J.; McFarlane, P.A.; Ross, R.; Teoh, H.; Verma, S.; Anand, S.; et al. Cardiometabolic risk in Canada: A detailed analysis and position paper by the cardiometabolic risk working group. Can. J. Cardiol. 2011, 27, e1–e33. [Google Scholar] [CrossRef] [PubMed]
- Kahn, R.; Buse, J.; Ferrannini, E.; Stern, M. The metabolic syndrome: Time for a critical appraisal. Diabetes Care 2005, 28, 2289–2304. [Google Scholar] [CrossRef]
- Oliver, M.; Witten, K.; Blakely, T.; Parker, K.; Badland, H.; Schofield, G.; Ivory, V.; Pearce, J.; Mavoa, S.; Hinckson, E.; et al. Neighbourhood built environment associations with body size in adults: Mediating effects of activity and sedentariness in a cross-sectional study of New Zealand adults. BMC Public Health 2015, 15, 956. [Google Scholar] [CrossRef] [PubMed] [Green Version]
- Proper, K.I.; Singh, A.S.; van Mechelen, W.; Chinapaw, M.J.M. Sedentary behaviors and health outcomes among adults: A systematic review of prospective studies. Am. J. Prev. Med. 2011, 40, 174–182. [Google Scholar] [CrossRef] [PubMed]
- Conry, M.C.; Morgan, K.; Curry, P.; McGee, H.; Harrington, J.; Ward, M.; Shelley, E. The clustering of health behaviours in Ireland and their relationship with mental health, self-rated health and quality of life. BMC Public Health 2011, 11, 692. [Google Scholar] [CrossRef] [PubMed]
- Hajna, S.; Ross, N.A.; Brazeau, A.-S.; Bélisle, P.; Joseph, L.; Dasgupta, K. Associations between neighbourhood walkability and daily steps in adults: A systematic review and meta-analysis. BMC Public Health 2015, 15, 768. [Google Scholar] [CrossRef] [PubMed]
- Lovasi, G.S.; Grady, S.; Rundle, A. Steps forward: Review and recommendations for research on walkability, physical activity and cardiovascular health. Public Health Rev. 2012, 33, 484–506. [Google Scholar] [CrossRef] [PubMed]
- Durand, C.P.; Andalib, M.; Dunton, G.F.; Wolch, J.; Pentz, M.A. A systematic review of built environment factors related to physical activity and obesity risk: Implications for smart growth urban planning. Obes. Rev. 2011, 12, e173–e182. [Google Scholar] [CrossRef] [PubMed]
- Priebe, C.S.; Spink, K.S. Less sitting and more moving in the office: Using descriptive norm messages to decrease sedentary behavior and increase light physical activity at work. Psychol. Sport Exerc. 2015, 19, 76–84. [Google Scholar] [CrossRef]
- Koeneman, M.A.; Chorus, A.; Hopman-Rock, M.; Chinapaw, M.J.M. A novel method to promote physical activity among older adults in residential care: An exploratory field study on implicit social norms. BMC Geriatr. 2017, 17, 8. [Google Scholar] [CrossRef] [PubMed]
- Ragland, D.R. Dichotomizing continuous outcome variables: Dependence of the magnitude of association and statistical power on the cutpoint. Epidemiology 1992, 3, 434–440. [Google Scholar] [CrossRef] [PubMed]
- Brenner, P.S.; DeLamater, J.D. Social desirability bias in self-reports of physical activity: Is an exercise identity the culprit? Soc. Indic. Res. 2014, 117, 489–504. [Google Scholar] [CrossRef]
- Prince, S.A.; Adamo, K.B.; Hamel, M.E.; Hardt, J.; Gorber, S.C.; Tremblay, M. A comparison of direct versus self-report measures for assessing physical activity in adults: A systematic review. Int. J. Behav. Nutr. Phys. Act. 2008, 5, 56. [Google Scholar] [CrossRef] [PubMed]
- Diez Roux, A.V. Neighborhoods and health: Where are we and where do we go from here? Rev. Epidémiol. Santé Publique 2007, 55, 13–21. [Google Scholar] [CrossRef] [PubMed]
- Chaix, B.; Merlo, J.; Evans, D.; Leal, C.; Havard, S. Neighbourhoods in eco-epidemiologic research: Delimiting personal exposure areas. A response to Riva, Gauvin, Apparicio and Brodeur. Soc. Sci. Med. 2009, 69, 1306–1310. [Google Scholar] [CrossRef] [PubMed]
- Openshaw, S. The Modifiable Areal Unit Problem (Concepts and Techniques in Modern Geography); GeoBooks: Norwich, UK, 1984; Volume 38. [Google Scholar]
- Flowerdew, R.; Manley, D.J.; Sabel, C.E. Neighbourhood effects on health: Does it matter where you draw the boundaries? Soc. Sci. Med. 2008, 66, 1241–1255. [Google Scholar] [CrossRef] [PubMed]
- Boone-Heinonen, J.; Gordon-Larsen, P.; Guilkey, D.K.; Jacobs, D.R., Jr.; Popkin, B.M. Environment and physical activity dynamics: The role of residential self-selection. Psychol. Sport Exerc. 2011, 12, 54–60. [Google Scholar] [CrossRef] [PubMed]


| Criteria | n | Reason for Reduced Numbers |
|---|---|---|
| NWAHS sample (W1) | 4056 | - |
| Geocoded (W1) | 4041 | 15 participants with invalid residential addresses |
| Residing in urban area (W1) | 3887 | 154 participant addresses outside the urban area |
| Participated in Wave 2 | 3362 | 525 participants did not participate in Wave 2 |
| Did not move (W1 to W2) | 2797 | 565 participants moved between Waves 1 and 2 |
| CVD/diabetes free at Wave 1 | 2325 | 472 participants had CVD or Type 2 diabetes at Wave 1 |
| HbA1c data (at least 1 wave) | 2324 | 1 participant lacked at least 1 wave of HbA1c data |
| Covariate data (W1) | 2260 | 64 participants lacked covariate data at Wave 1 |
| Linked local-area data: | Of participants meeting previous criteria | |
| Walkability | 2260 | All participants had linked walkability data |
| Physical inactivity norm | 1926 | 336 participants lacked local physical inactivity norm data |
| Overweight/obesity norm | 1907 | 353 participants lacked local overweight/obesity norm data |
| Measure | Walkability Sample (n = 2260) | Physical Inactivity Norm Sample (n = 1926) | Overweight/Obesity Norm Sample (n = 1907) |
|---|---|---|---|
| Individual-Level Characteristics | Mean (SD) | Mean (SD) | Mean (SD) |
| Age (years) | 50.41 (14.83) | 49.97 (15.22) | 49.87 (15.18) |
| Sex (female) n (%) | 1252 (55.4%) | 1061 (55.1%) | 1051 (55.1%) |
| Current smoker n (%) | 401 (17.7%) | 338 (17.6%) | 335 (17.6%) |
| Married/de facto n (%) | 1476 (65.3%) | 1229 (63.8%) | 1226 (64.3%) |
| Education (university graduate) n (%) | 275 (12.2%) | 250 (13.0%) | 250 (13.1%) |
| Not employed n (%) | 975 (43.1%) | 834 (43.2%) | 815 (42.7%) |
| Physical activity-level 1: | |||
| Sedentary n (%) | 553 (43.9%) | 461 (32.5%) | 454 (32.2%) |
| Some n (%) | 449 (26.7%) | 381 (26.8%) | 381 (27.1%) |
| Meets recommendations n (%) | 677 (40.3%) | 578 (40.7%) | 573 (40.7%) |
| Missing n | 581 | 506 | 499 |
| HbA1c 2 | 5.41 (0.45) | 5.43 (0.45) | 5.43 (0.45) |
| Environmental Features | Mean (SD) | Mean (SD) | Mean (SD) |
| 1600 m buffer area (km2) 3 | 3.88 (3.21–4.81) | 3.91 (3.31–4.83) | 3.91 (3.30–4.84) |
| Walkability | 22.42 (7.45) | - | - |
| Physical inactivity norm | - | 52.76 (7.08) | - |
| SAMSS n per buffer | - | 99.4 (32.7) | - |
| Overweight/obesity norm | - | - | 62.85 (6.18) |
| SAMSS n per buffer | - | - | 95.6 (31.5) |
| Area-level income (median weekly household income) | 842 (152.78) | 835.63 (132.93) | 838.45 (131.64) |
| Assessed Association | Estimate | 95% CI | p-Value |
|---|---|---|---|
| Walkability Models (n = 2260) AIC 9646.34; BICadj 9722.72 | |||
| Walkability predicting ∆HbA1c | −0.008 | −0.011 to −0.005 | 0.000 |
| Individual PA predicting ∆HbA1c: | |||
| 1. Low (reference = sedentary) | −0.009 | −0.018 to 0.000 | 0.052 |
| 2. Meets recommendations (reference = sedentary) | −0.014 | −0.021 to −0.006 | 0.001 |
| Walkability predicting individual PA: | |||
| 1. Low (reference = sedentary) | −0.009 | −0.030 to 0.011 | 0.347 |
| 2. Meets recommendations (reference = sedentary) | 0.035 | 0.010 to 0.061 | 0.007 |
| Indirect effect (×100): through low PA | 0.008 | −0.012 to 0.029 | 0.427 |
| Indirect effect (×100): through meets PA recommendations | −0.048 | −0.091 to −0.005 | 0.029 |
| Total indirect effect (×100) | −0.040 | −0.079 to 0.001 | 0.045 |
| Total effect of walkability on ∆HbA1c (×100) | −0.847 | −1.157 to −0.536 | 0.000 |
| Physical Inactivity Norm Models (n = 1926) AIC 8259.17; BICadj 8330.75 | |||
| Physical inactivity norm predicting ∆HbA1c | 0.006 | 0.001 to 0.011 | 0.015 |
| Individual PA predicting ∆HbA1c: | |||
| 1. Low (reference = sedentary) | −0.011 | −0.020 to −0.001 | 0.039 |
| 2. Meets recommendations (reference = sedentary) | −0.016 | −0.024 to −0.007 | 0.000 |
| Physical inactivity norm predicting individual PA: | |||
| 1. Low (reference = sedentary) | −0.008 | −0.032 to 0.015 | 0.490 |
| 2. Meets recommendations (reference = sedentary) | −0.039 | −0.068 to −0.010 | 0.008 |
| Indirect effect (×100): through low PA | 0.009 | −0.016 to 0.034 | 0.496 |
| Indirect effect (×100): through meets PA recommendations | 0.061 | 0.000 to 0.122 | 0.049 |
| Total indirect effect (×100) | 0.070 | 0.011 to 0.129 | 0.019 |
| Total effect of physical inactivity norm on ∆HbA1c (×100) | 0.691 | 0.202 to 1.181 | 0.006 |
| Overweight/Obesity Norm Models (n = 1907) AIC 8151.86; BICadj 8222.87 | |||
| Overweight/obesity norm predicting ∆HbA1c | 0.006 | 0.002 to 0.010 | 0.006 |
| Individual PA predicting ∆HbA1c: | |||
| 1. Low (reference = sedentary) | −0.011 | −0.021 to −0.001 | 0.028 |
| 2. Meets recommendations (reference = sedentary) | −0.015 | −0.023 to −0.006 | 0.001 |
| Overweight/obesity norm predicting individual PA: | |||
| 1. Low (reference = sedentary) | 0.015 | −0.009 to 0.039 | 0.219 |
| 2. Meets recommendations (reference = sedentary) | −0.059 | −0.086 to −0.032 | 0.000 |
| Indirect effect (×100): through low PA | −0.016 | −0.048 to 0.016 | 0.313 |
| Indirect effect (×100): through meets PA recommendations | 0.085 | 0.019 to 0.151 | 0.011 |
| Total indirect effect (×100) | 0.069 | 0.013 to 0.125 | 0.016 |
| Total effect of overweight/obesity norm on ∆HbA1c (×100) | 0.642 | 0.239 to 1.046 | 0.002 |
© 2017 by the authors. Licensee MDPI, Basel, Switzerland. This article is an open access article distributed under the terms and conditions of the Creative Commons Attribution (CC BY) license (http://creativecommons.org/licenses/by/4.0/).
Share and Cite
Carroll, S.J.; Niyonsenga, T.; Coffee, N.T.; Taylor, A.W.; Daniel, M. Does Physical Activity Mediate the Associations Between Local-Area Descriptive Norms, Built Environment Walkability, and Glycosylated Hemoglobin? Int. J. Environ. Res. Public Health 2017, 14, 953. https://doi.org/10.3390/ijerph14090953
Carroll SJ, Niyonsenga T, Coffee NT, Taylor AW, Daniel M. Does Physical Activity Mediate the Associations Between Local-Area Descriptive Norms, Built Environment Walkability, and Glycosylated Hemoglobin? International Journal of Environmental Research and Public Health. 2017; 14(9):953. https://doi.org/10.3390/ijerph14090953
Chicago/Turabian StyleCarroll, Suzanne J., Theo Niyonsenga, Neil T. Coffee, Anne W. Taylor, and Mark Daniel. 2017. "Does Physical Activity Mediate the Associations Between Local-Area Descriptive Norms, Built Environment Walkability, and Glycosylated Hemoglobin?" International Journal of Environmental Research and Public Health 14, no. 9: 953. https://doi.org/10.3390/ijerph14090953