Article

Transnational Research Networks in Chinese Scientific Production. An Investigation on Health-Industry Related Sectors

Department of Economics and Management, University of Ferrara, Via Voltapaletto, 11-44121 Ferrara, Italy
*
Author to whom correspondence should be addressed.
Int. J. Environ. Res. Public Health 2017, 14(9), 975; https://doi.org/10.3390/ijerph14090975
Submission received: 29 July 2017 / Revised: 19 August 2017 / Accepted: 24 August 2017 / Published: 29 August 2017

Abstract

:
Transnational research networks (TRN) are becoming increasingly complex. Such complexity may have both positive and negative effects on the quality of research. Our work studies the evolution over time of Chinese TRN and the role of complexity on the quality of Chinese research, given the leading role this country has recently acquired in international science. We focus on the fields of geriatrics and gerontology. We build an original dataset of all scientific publications of China in these areas in 2009, 2012 and 2015, starting from the ISI Web of Knowledge (ISI WoK) database. Using Social Network Analysis (SNA), we analyze the change in scientific network structure across time. Second, we design indices to control for the different aspects of networks complexity (number of authors, country heterogeneity and institutional heterogeneity) and we perform negative binomial regressions to identify the main determinants of research quality. Our analysis shows that research networks in the field of geriatrics and gerontology have gradually become wider in terms of countries and have become more balanced. Furthermore, our results identify that different forms of complexity have different impacts on quality, including a reciprocal moderating effect. In particular, according to our analysis, research quality benefits from complex research networks both in terms of countries and of types of institutions involved, but that such networks should be “compact” in terms of number of authors. Eventually, we suggest that complexity should be carefully taken into account when designing policies aimed at enhancing the quality of research.

1. Introduction

In the modern age, science is characterized by a generalized enlargement of research networks. The number of authors taking part in a single publication has increased. In particular for medical sciences, we observe that the average number of authors per article in PubMed has passed from 2.0 in 1970 to 5.3 in 2010 [1]. The complexity in handling scientific cooperation networks has also been rising over the years, because cooperation increasingly takes place at transnational level [2,3,4,5,6,7]. In 2010 almost 25% of research articles included authors from at least two countries (against 10% in 1990) [8]. Such process has been called the “globalisation of science” [9]. Not only scientific cooperation networks have increasingly included several researchers from different countries. They have recently also seen the contribution of authors coming from different types of institutions, with different general goals and organization [10].
Large, multi-national and multi-institutional collaboration networks are challenging since they embed high risks and wide opportunities.
As far as risks are concerned, the early theories of collective actions suggest that, typically, large groups have more problems in cooperating because of possible free-riding, costs of coordination, monitoring and sanctioning [11]. These costs might increase for scientific cooperation involving distant disciplinary fields, even if it has also been said that this kind of interaction might be a fertile soil for the emergence of radically new ideas [12]. Other costs (in terms of funds and time) might be due to the mobility of equipment and personnel, but also to the necessity of preparing, defining and managing the agreement or of coordinating all the actors involved. There might be difficulties in putting together different cultures, financial and reward systems, and so on [13]. The smooth functioning of networks furthermore requires that the intention distance among actors in terms of goal is not too large [14]. Indeed, intention distance and network complexity can mutually reinforce each other, as with the growth in the number and variety of actors participating in the network, it is more likely that goals diverge [15]. In this framework, a university-to-university relation might be somewhat easier to manage than a relation involving firms, since partners operate in similar institutions and share the same set of values. With different institutional partners there might instead be different positions regarding the disclosure of the results, different priorities due to different career paths or different degrees of intensity in the effort put in the relationship [16].
Transnational research networks (TRNs from now on) may incur in even higher difficulties when they involve other institutions. This is the case of TRN aimed at the production of health knowledge. In fact, this field involves public as well as private producers, collective entities as well as individuals, profit oriented as well as non-profit organisations (i.e., hospitals, laboratories, physicians, etc.). It is very likely, therefore, that each category has a different main goal (profit maximization, provision of the service per se, societal wellbeing etc.) that leads to a different interpretation of the role that every actor is supposed to have in the sector. Moreover, further sources of complexity are related to the nature of the knowledge produced in the health sector, which usually requires high-tech devices and techniques and the ability to handle them, as well as the capacity to meet high quality standards that require rigorous quality controls. Consequently, participants in knowledge co-production networks in this sector are required to have high and flexible technical knowhow and knowledge skills.
The complexity of networking in these contexts may translate into a higher degree of fragility of the relation. Networks might be destined to fail due to relevant information asymmetries, wide free-riding opportunities, and potential conflicts in defining rules, goals and strategies.
However, in present times complex transnational networking in co-production of knowledge—also and in particular in the health sector—is seen by many as highly desirable. Cooperation allows to have access to new expertise and complex equipment, due to the growing complexity of science; increases the efficiency and speed of the research work, thanks to the possibility of counting on a larger team; facilitates the study of more complex and multidisciplinary problems; allows a cross fertilization of competences that facilitates the birth of new ideas; gives scientists the possibility to directly learn new competences by interacting with others, reducing isolation; makes the research work more pleasant and stimulating, by giving to people the possibility to interact with others and to travel; and improves the accessibility to funds. The consequence is an increase in prestige and visibility of participants, who can multiply the possibility to get in touch with other colleagues, and to enhance their professional status. Studies show in fact that collaboration can result in a higher rate of acceptance for publication from prestigious journals, in a higher academic productivity (in terms, for example, of number of published papers) and in a higher quality of research [4,6,13,16,17,18,19,20,21]. On the contrary, researchers working in isolation are less productive, less informed and consequently less acknowledged [22]. Co-research ultimately contributes to the scientific progress, allowing to combine and integrate competences, to ignite cross-fertilization procedures and to favor the interchange of experiences [23,24].
In the broad scenario of transnational research cooperation, China is one of the most interesting cases. Starting from the launch of the open door policy, China has put it at the center of its scientific and technological development, as a key factor to favor the modernization of the country [25,26]. Consequently, its position within the international scientific scenario has been constantly increasing over the years [27]. Furthermore, the national scientific community is increasingly open to international partnerships. Up to the eighties, the number of internationally co-authored papers of scientists located in China was very limited, since in the pre-reform period only a few selected scholars were allowed to publish in international journals, and they were strictly controlled. Afterwards, the government has constantly increased its commitment towards the improvement of international collaboration in science and technology, with the first boost given by the S&T Cooperation Program for Priority Projects launched with the 10th Five-Year Plan 2000–2005. Since then, all the Chinese research institutions, including universities, have increased the programs and incentives to international collaboration and there has been a constant increase in the number of internationally co-authored papers in the country [28]. Such increase may be explained by the opportunity, given to Chinese researchers by international collaborations, to access advanced knowledge and instruments, and enter more visible circuits, therefore enhancing their potential impact [29].
The habit of carrying out collaborative research within transnational research networks is much more common in health-related fields than in other scientific disciplines. Currently, around 50% of articles published by Chinese scientists in ISI-Web of Science journals on health issues were characterized by collaborations with foreign scientists, against a much lower 20% of the total Chinese publications.
In this framework, we believe it is particularly interesting to deepen our knowledge on the evolution over time of TRN involving Chinese scholars and on the factors affecting the quality of research carried out in health-related fields, with particular reference to the impact that complexity of TRN may have. To do so, the study focuses on the field of geriatrics and gerontology (hereinafter gerontology). This specific field has been chosen for several reasons:
(1)
Given the current effects that 30 years of one-child policy are showing on the population aging, the field is increasingly popular among scientists (and policy makers), as ageing of Chinese population is becoming a growing concern [30,31,32];
(2)
Studying a very specific field allows to avoid comparisons among different sectors, that might have different behaviors in terms of co-publishing and citations [33,34,35];
(3)
The number of papers produced in the selected field, despite the growing popularity, is still small enough to allow to collect the detailed information that is needed to perform the study across time. At the same time, numbers are high enough to apply an econometric model sufficiently reliable.

2. Materials and Methods

2.1. Data Collection

The main aim of our empirical study is to show the changes occurred over time in Chinese TRN in gerontology and to identify the determinants of research quality, with particular reference to the effects of complexity.
In this paper, we have chosen to measure the quality of science by means of the number of citations received by a publication. We are aware that the use of this indicator as a proxy for the quality of a published paper is quite controversial in the literature. The use of citations is based on the assumption that authors select the works to cite on the basis of their quality: therefore the most cited articles are those with a higher quality level [36]. However, since the motivations to cite a paper are actually much more varied, several distortions might arise. Among these:
  • A paper might have a high citation rate not only when it is highly appreciated, but also if it is greatly criticized [34];
  • a paper by an influential scientist may be more visible even if its quality is no greater than other works [34];
  • self-citations might artificially distort the number of citations [37,38];
  • low citation rates might simply be the consequence of a narrow or unpopular research field rather than of poor quality [39,40];
  • the number of citations not only depends on the quality of the article, but also on the location of the author and on the prestige, language and diffusion of the journal [34,40].
In spite of these limitations, the use of citation count is mostly supported ([39,40,41,42], only to cite some). In particular, it has been asserted that, with sufficiently large numbers, the different reasons for citing neutralize each other [43] and that there is “sufficient evidence that (the different) ‘reference motives’ are not so different or ‘randomly’ given to such an extent that the phenomenon of citation would lose its role as a reliable measure of impact” [44] (p. 26). The validity of citations as proxy of the quality of published works is confirmed by the fact that is has shown a strong correlation with several other indicators, such as Nobel Prize, honorific awards, number of publications, grants awarded to a department and peer-review assessment [18,45,46,47]. Considering that—as suggested in the literature:
  • we analyze a very specific sub-field [34,35];
  • in this scientific field, publication in international journals is one of the most utilized means of diffusion of results [4,48] and
  • we only take into account English publications in order to avoid language bias, we believe that, for our analysis, citation count can be considered a reliable proxy of the quality of the underlying research in a publication.
To perform our study, we have built a unique dataset including 1381 scientific publications of China-based scholars in the field of gerontology and geriatrics available on ISI Web of Knowledge (from now on referred as ISI WoK), developed by Thomson Reuters and internationally acknowledged as the one including at present the most prestigious scientific journals, covering over 8000 scientific journals worldwide in sciences, social sciences, arts, and humanities [49]. We have collected data for the years 2000 (18 publications), 2009 (154), 2012 (346) and 2015 (865). Due to the low number of publications in 2000 we have used the information only for the Social Network Analysis (SNA), while we have excluded them from the descriptive and the econometric analyses.
Our database contains a broad range of information on each publication. Some were readily available from ISI WoK, and concern our outcome of interest (the number of citations up to May 2017), together with some control variables (the journal of publication and the main sector(s)). However, a large part of our dataset has been built upon a careful content analysis of each publication, allowing us to extract the number of authors participating in the publications, the typology of institution of affiliation (which we classified into university, hospital, university-hospital, company, association, and public institution), the country of each institution, and the country and institutional affiliation of the reprint author. Such hand-collected information is the core of our analysis and constitutes the basis for building our main variables of interest.

2.2. Data Analysis

2.2.1. Social Network Analysis

A first set of information can be obtained by dividing our sample between publications authored only by scholars based in China (“China-only” publications from now on), and those co-authored by international and Chinese scientists (“international” from now on).
Analogously to the whole Chinese scientific production, the number of publications by Chinese authors in the ISI WoK database has risen exponentially over the years also in the case of gerontology and geriatrics. This surge has started in 2000, but it has acquired an unprecedented speed from 2008 on. At the same time, China has increased the size of its TRN, which was virtually non-existing until 2000. In parallel with the number of publications, the number of countries has increased particularly from 2008, and in more recent years it has arrived to include about 40 different countries (Figure 1).
However, the TRN did not change only in terms of number of countries involved, but also in terms of relations within the groups of partners, weight of the relations and direction of the network. We have studied all such evolutions by means of a Social Network Analysis (SNA), whose results are presented in Figure 2. In each of the graphs representing each year, the dimension of nodes is proportional to the times in which the country hosts the reprint author while the width of the linkage is proportional to the number of publications involving the two countries.
In 2000 the gerontology-geriatrics TRN was very basic, with only seven foreign countries involved and with China coordinating most of the international publications (the relative size of China’s node is in fact much larger than the others). Already in this initial phase of internationalization, China shows a preferential relation with the USA, deductible from the thicker link between the two countries. Very marginal in this first stage is the role played by Europe, with only one connection to Great Britain.
Over the years the number of countries involved has increased, the relation with the USA has become tighter and tighter, while at the same time the relative role of China as guide of the network has decreased. The peculiar shape of the 2009 network is due to one publication involving almost all countries, and this justifies the fact that the TRN in that year is particularly dense, because all countries in the group are connected with one another by means of the common publication. Passing instead from 2012 to 2015, the network has become less dense and compact. While in 2012 relations with other countries were mostly intra-continental, in 2015 the network has reached a higher degree of “inter-continentality”. There seems to be a higher number of relations involving countries belonging to different geographic groupings, while China maintains relatively more isolated relations only with a small number of countries (such as Greece or Luxembourg). There still seems to be a sort of close “continental” relation only with some Asian countries—namely Thailand, Indonesia, Malaysia and the Philippines—that are connected almost exclusively to one another. The dominant bilateral relation remains that with the United States, which seems to become stronger and stronger over time. As regards the guidance of TRNs, China still holds the reins in the majority of cases.

2.2.2. Descriptive Analysis

As a whole, there are 996 out of 1363 publications that are co-authored only by China-based authors and 367 that are co-authored by foreign authors as well. As Figure 3 shows, the absolute number of international publications has certainly grown across time. However, the gap between international and China-only publications has widened as well: if in 2009 the number of China-only publications accounted for slightly more than one half than the total of publications, in 2015 the situation had radically changed, as the international publications accounted only for the 22 percent (Figure 3).
Within the international networks, the role that China plays may vary greatly. In particular, we distinguish among six possible cases, according to the weight of Chinese institutions on the total and the nationality of the reprint author. With regard to the role of China in terms of number, we identify three cases: (1) when Chinese institutions are more than 50% of the total (majority); (2) when Chinese institutions are less than 50% of the total (minority) and (3) when Chinese institutions are 50% of the total (parity). In terms of the reprint author, it can be either Chinese or not (either foreign or not available in the publication). The distribution of publications across the six categories is represented in Table 1.
The pool of 367 international publications distributes evenly across those where Chinese actors are the majority (128), those where they are the minority (134) and those where they are exactly the 50% of participants (105). At the same time, Chinese authors coordinate approximately the same number of networks than their foreign colleagues. However, once we combine number and reprint variables, further interesting evidence emerges. About 16 percent of the publications do not have a leading author, and this occurs mainly for the publications where there is a parity of Chinese and foreign authors. Chinese authors lead about the same number of publications than their foreign colleagues, and they distribute in a mirroring way: in other words, Chinese are reprint authors mainly when they are the majority of the collaborating members, while foreign authors lead the network when Chinese partners are a minority. Overall, the matrix shows a rather balanced distribution when we look at variables one by one. However, we find a rather polarized situation—between a Chinese-majority-Chinese-led group of publications and a Chinese-minority-foreign-led group of publications—when we analyze them jointly.

2.2.3. Complexity Indices

To study the way in which complexity affects the quality of research, we identified three dimensions of network complexity: number of authors, institutional heterogeneity and country heterogeneity. The first is measured directly through the number of co-authors in a single publication. In order to measure institutional and country heterogeneity, we summarized the information for each dimension through a normalized Shannon’s index of entropy [50,51].The Shannon or entropy index is defined as:
S i = i = 1 n p i ln p i
where pi is the probability of each event in the set H = p1, p2pn to occur. It takes the largest value when all the events of the set have the same probability to occur, and the lowest when only one event has the probability to occur. We exploit this feature to study how heterogeneous our phenomenon of interest is: that is, if the index is large, we consider that the publication has a higher degree of countries’/institutions heterogeneity, being their distribution less concentrated in one or few categories and more spread across various types of countries/institutions. We standardized both the Shannon index for countries heterogeneity S(c) and the Shannon index for institutional heterogeneity S(i) to allow them to vary between 0 (minimum heterogeneity) and 100 (maximum heterogeneity). For country heterogeneity, S(c) takes value 0 when no foreign countries collaborate with China; it takes value 100 when the number of foreign collaborating countries is the highest in our sample. With respect to the institutional heterogeneity index S(i), we have minimum heterogeneity when only a type of institution is taking part in the publication (irrespective of the number of institutions). S(i) takes value 100 when all the 6 types of institutions are participating in the same proportion to the publication. Finally, we also standardized the number of authors to obtain a variable (STD_AUTH) whose range is between 0 (minimum number of authors) and 100 (maximum number of authors in the sample).
In Figure 4 and Figure 5 we report the kernel distributions of the variables representing the dimensions of complexity that we take into account. For the index of number of authors and the Shannon index for institutional heterogeneity (Figure 2), we decompose the distribution of the total of publications (in green) in that of the international (red) and China-only (blue) groups. Although the position of the distribution for international publications is slightly more to the right, the distribution of the number of authors’ index for the two groups seems to be similar, as the largest part of the observations is concentrated in all cases around a low value of the index (equal to 10). There are more differences in the kernel distributions of the Shannon index of institutional heterogeneity: in this case, it is clear that while China-only publications are largely homogeneous in terms of types of institutions taking part in the publication, a larger variety is observable in the international collaborations. Finally, Figure 5 only shows the kernel density for International publications, as for the China-only group the value of the Shannon index is, by construction, always 0. For such index, international publications are mainly distributed across an interval of medium-to-low values, between 20 and 40. From this visual analysis, we may claim that international and China-only publications tend to be rather similar in terms of number of authors, but different in terms of institutional heterogeneity.

2.2.4. Parametric Estimation

To see the effects of complexity on the quality of publications, we parametrically estimated the impacts in a model when the number of citations is a function of a set of variables. For each i publication, we have:
CITi = f(Si, Ci, Xi)
where Si is the vector of the complexity indices related to the number of authors (STD_AUTH), number of countries (S(c)) and number and types of institutions (S(i) participating in the publication. The vector Ci includes two variables that measure the impact of Chinese coordination of the network. With CN_repr_maji, we wish to capture whether there exists an effect of Chinese actors being both the majority of participants and the coordinators of the network. With CN_repr_mini, we want to assess the effect of Chinese actors being the coordinators of the network when they are a minority. The third case when a Chinese is a reprint author—parity between Chinese and foreign actors—was excluded due to collinearity. A description of these two variables is presented in Table 2. Finally, the vector Xi includes other control variables that are summarized in Table 2, while a correlation table for all independent variables is reported in the Appendix (Table A1). With the variable Nr_Sect we wish to capture the degree of interdisciplinarity of the publication. Repr_NA, Repr_UNI, Repr_FOR and Repr_US are all dummies related to the reprint authors: not available, affiliated to a university, foreign, from the US ASS, COMP, HOSP, PUB, UNIHOSP and UNI are dummies representing whether at least one association, company, hospital, public institution, university-hospital and/or university takes part in the publication. They are not exclusive to one another, as in the same publication there could be both at least one hospital (HOSP = 1) and at least one company (COMP = 1) and so on. Additionally, we include a dummy that captures the participation of a US-affiliated academic, given that this country has a prominent role in the publication network of China, as the SNA showed. Finally, in order to control for the quality of the journal of the publication we include Impact_Factor, which is the 5-year impact factor of the academic journal. Year dummies are also included in all the specifications.
Due to the features of the variable representing the number of citations, linear models would not fit in this case. In fact, our outcome of interest CIT is a count variable with a largely asymmetric distribution, and for a large part of observations the value is zero (Table 3). The skewed distribution and overdispersion of the dependent variable CIT suggest the use of a negative binomial model [52,53,54].
In the next section we perform three regressions. The first represents the baseline model, in which we analyze the effect of all the variables on CIT taking into account all publications. In the second specification, we wish to identify whether any complementarities or substitution effects exist among the three dimensions of complexity (number, countries heterogeneity, institutional heterogeneity); therefore we add to the baseline model three two-way interactive terms among the three variables. In the third regressions we finally add the two variables that allow us to analyze the impact of the management of the network and of the role that China plays within the network.

3. Results and Discussion

Table 4 shows the results for the negative binomial regression of the three specifications of the model we identified previously, while Table 5 reports the average marginal effects. Columns 1 in both tables report the results for the baseline model. Concerning our three dimensions of complexity, the institutional heterogeneity does not affect quality, while country’s heterogeneity is significant (and negative) only in the second formulation, when we introduce the interaction terms. However, such negative effect has a rather limited magnitude (−0.09 citations every increase of 1 point in the index). The only dimension of complexity that seems to affect—positively—the quality of publications in all three formulations is the standardized number of authors. However, this is not sufficient to assert that larger co-authorship networks translate in better research. With a higher number of authors, in fact, the number of citations might increase simply because there are more possibilities for the article to be found and read. This is because each of the authors not only might have his/her own citation rings, but is also simply another possible keyword to be used to search for the article. More information on the role of this variable will be deduced by the use of interaction terms in the second formulation of the model.
As far as the other determinants of research quality are concerned, the three formulations provide the same results for some variables:
  • The degree of interdisciplinarity of the publication seems to negatively affect its quality. In fact, the number of sectors to which the publication refers has a negative impact on the number of citations;
  • The absence of a reprint author noticeably decreases the quality of publications, causing a reduction in the number of citations by 29.7 in comparison with articles with the indication of the reprint author. We have considered the corresponding author as the person in charge of maintaining the relation with the journal and with the remaining actors in the partnership, therefore acting as the one de facto managing the relation. Even if it is not clear why some publications do not mention any reprint author, the effect that the lack of a direction has on the research quality seems to be evidently negative;
  • The participation of US institutions in the partnership always has a positive impact on citations, which increase—due to this participation—by a range that goes from 2 to 2.5, depending on the specification, as shown in Table 5. Other formulations of our model have been tested including other countries, such as those belonging to the G7 group, but no one has resulted to have an impact, apart from the USA. It is possible to read this result both as an effect of the possibility of accessing high tech research laboratories, world-renowned scientists and top scientific circuits, but also simply as a consequence of a higher visibility of US scientists and of a common habit of Americans to cite each other. Undoubtedly, at present the scientific world is US-centered, and our results confirm that being able to be part in this world allows to increase the visibility (and possibly the quality) of the carried out research.
  • To publish in journals with a high impact factor raises the number of received citations. This might occur because publishing a paper in a prestigious journal (i.e., highly ranked in terms of Impact Factor) per se increases the possibilities to receive a high number of citations. However, this should not be read as a weakness in the use of citation counts for the measurement of quality. On the contrary, considering that journals included in the impact factor system are all peer-reviewed, it seems to confirm the fact that a positive assessment from peers anticipates an equally positive assessment from the scientific audience.
  • The presence of universities in the partnership also increases citations. This aspect might be simply related to the fact that to cite previous works is particularly diffused within academic circuits. For analogous reasons also university-hospitals have a positive impact, but only in the first formulation.
As far as interactions are concerned, the effect of the one between countries and institutional complexity indices is positive, while that between institutional heterogeneity and number of authors is negative. However, a correct interpretation of the meaning of the interactive terms requires some specifications. Because marginal effects of each variable are computed keeping all other variables fixed, a correct estimate of such effects should not include the values for interaction terms [55]. This is because, by definition, the value of the interaction is dependent on the value assumed by its components, so its marginal effect on the outcome of interest cannot change independently on them.
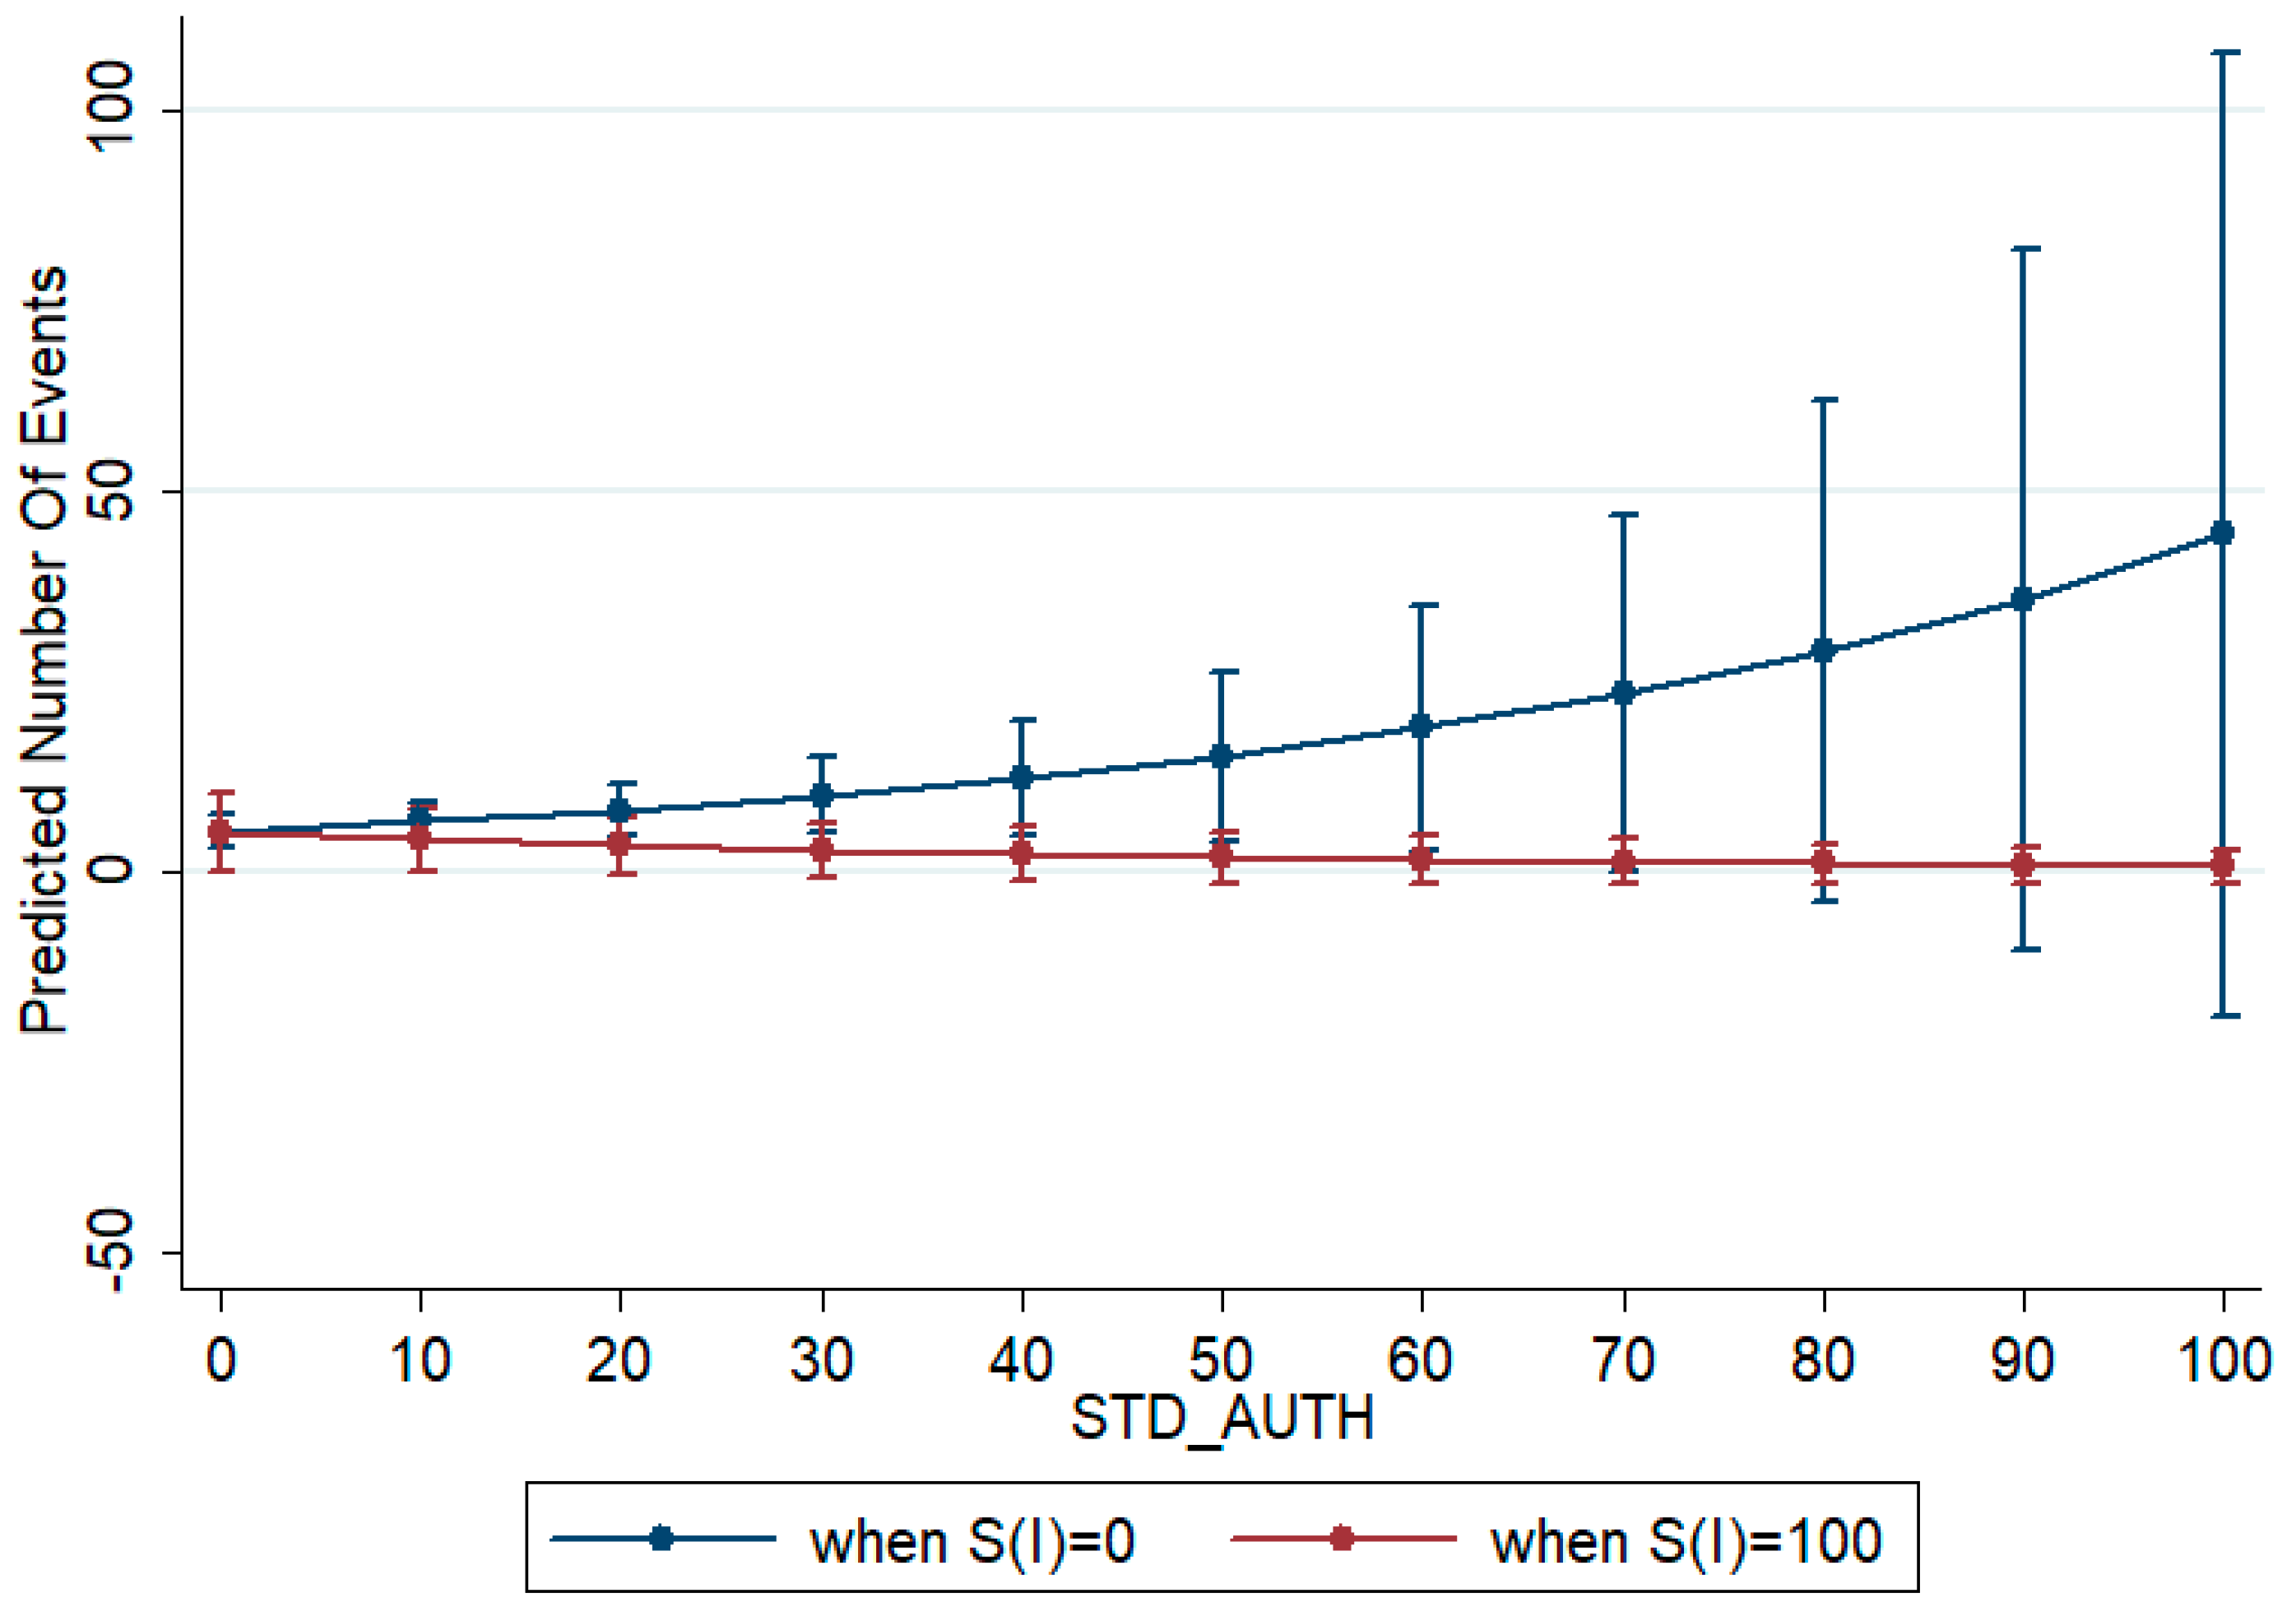
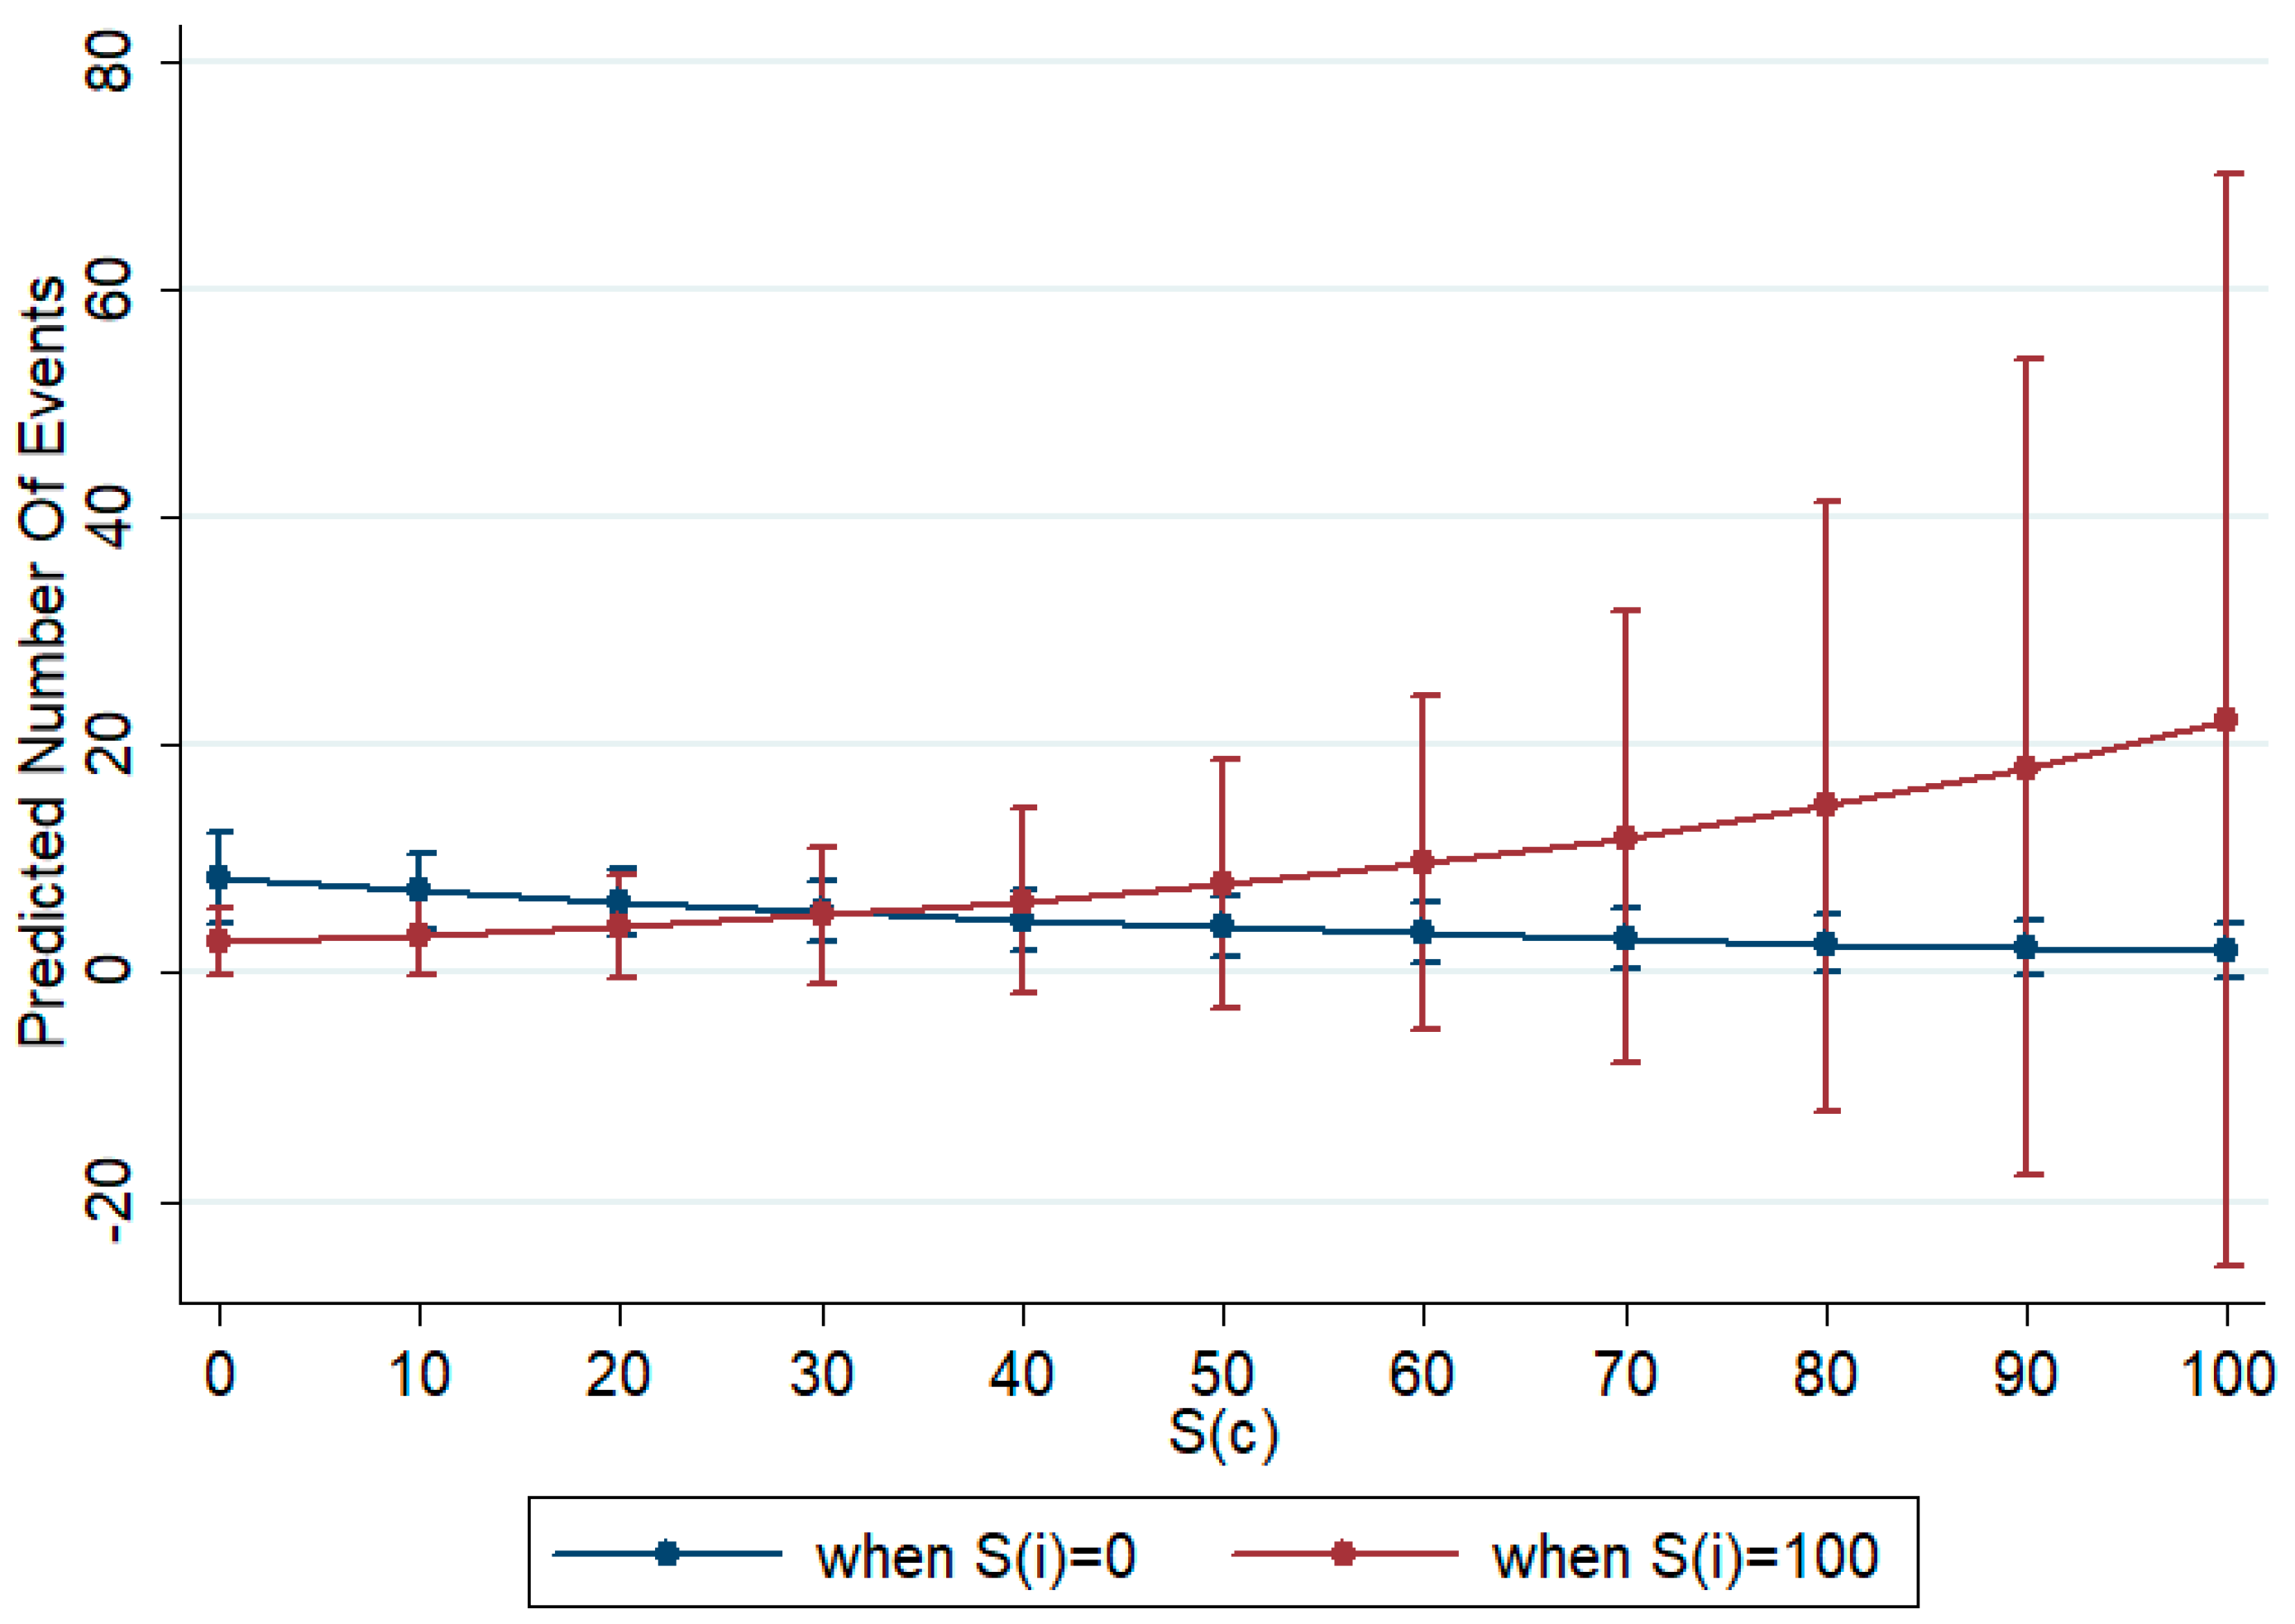
To understand whether the interactions between the complexity indices amplify or reduce quality, we graphically show their covariation by fixing them at specific values. In this case, we chose to analyze how indices covariate when complexity is at its minimum and its maximum. In Figure 6 and Figure 7 we show the variation in the number of citations (predicted number of events) related to the standardized number of authors (STD_AUTH) and to countries’ complexity (S(c)) when the institutional complexity, measured by S(i), takes the minimum (0) or the maximum (100) value. From the analysis of the two graphs, we can identify a large moderating effect of institutional complexity on the positive effect of number of citations and of the negative impact of country’s complexity on quality. In the first case (Figure 6), when institutional complexity is equal to 0, if the number of authors increases there is a positive impact on quality. However, if institutional complexity is at its maximum, to enlarge the network by increasing the number of authors has a depressive effect on quality. In the second case (Figure 7), if the research network is homogeneous in terms of institutions (S(i) = 0), to increase the number of countries induces a decrease in quality. When instead the institutional complexity is maximum, to have larger networks in terms of countries involved has a positive impact on quality.
Another interesting aspect of our results emerges in relation with the role that China plays within the network. When we include the variables representing the role of China as a majority or minority and as reprint author, we observe a negative effect of Chinese institutions as reprint author when they are a minority (about 5.5 citations less), while no effect is significant when they are a majority. One possible interpretation of the first result is that, when Chinese institutions are the minority within the network, the coordination of the partnership is entrusted to a Chinese author only for low quality research. Vice versa, in cases in which Chinese institutions are the majority, there is no impact on quality of the nationality of the reprint author. This means that China’s coordination of such networks has the same impact on quality than if the coordination is assigned to foreign institutions.

4. Conclusions

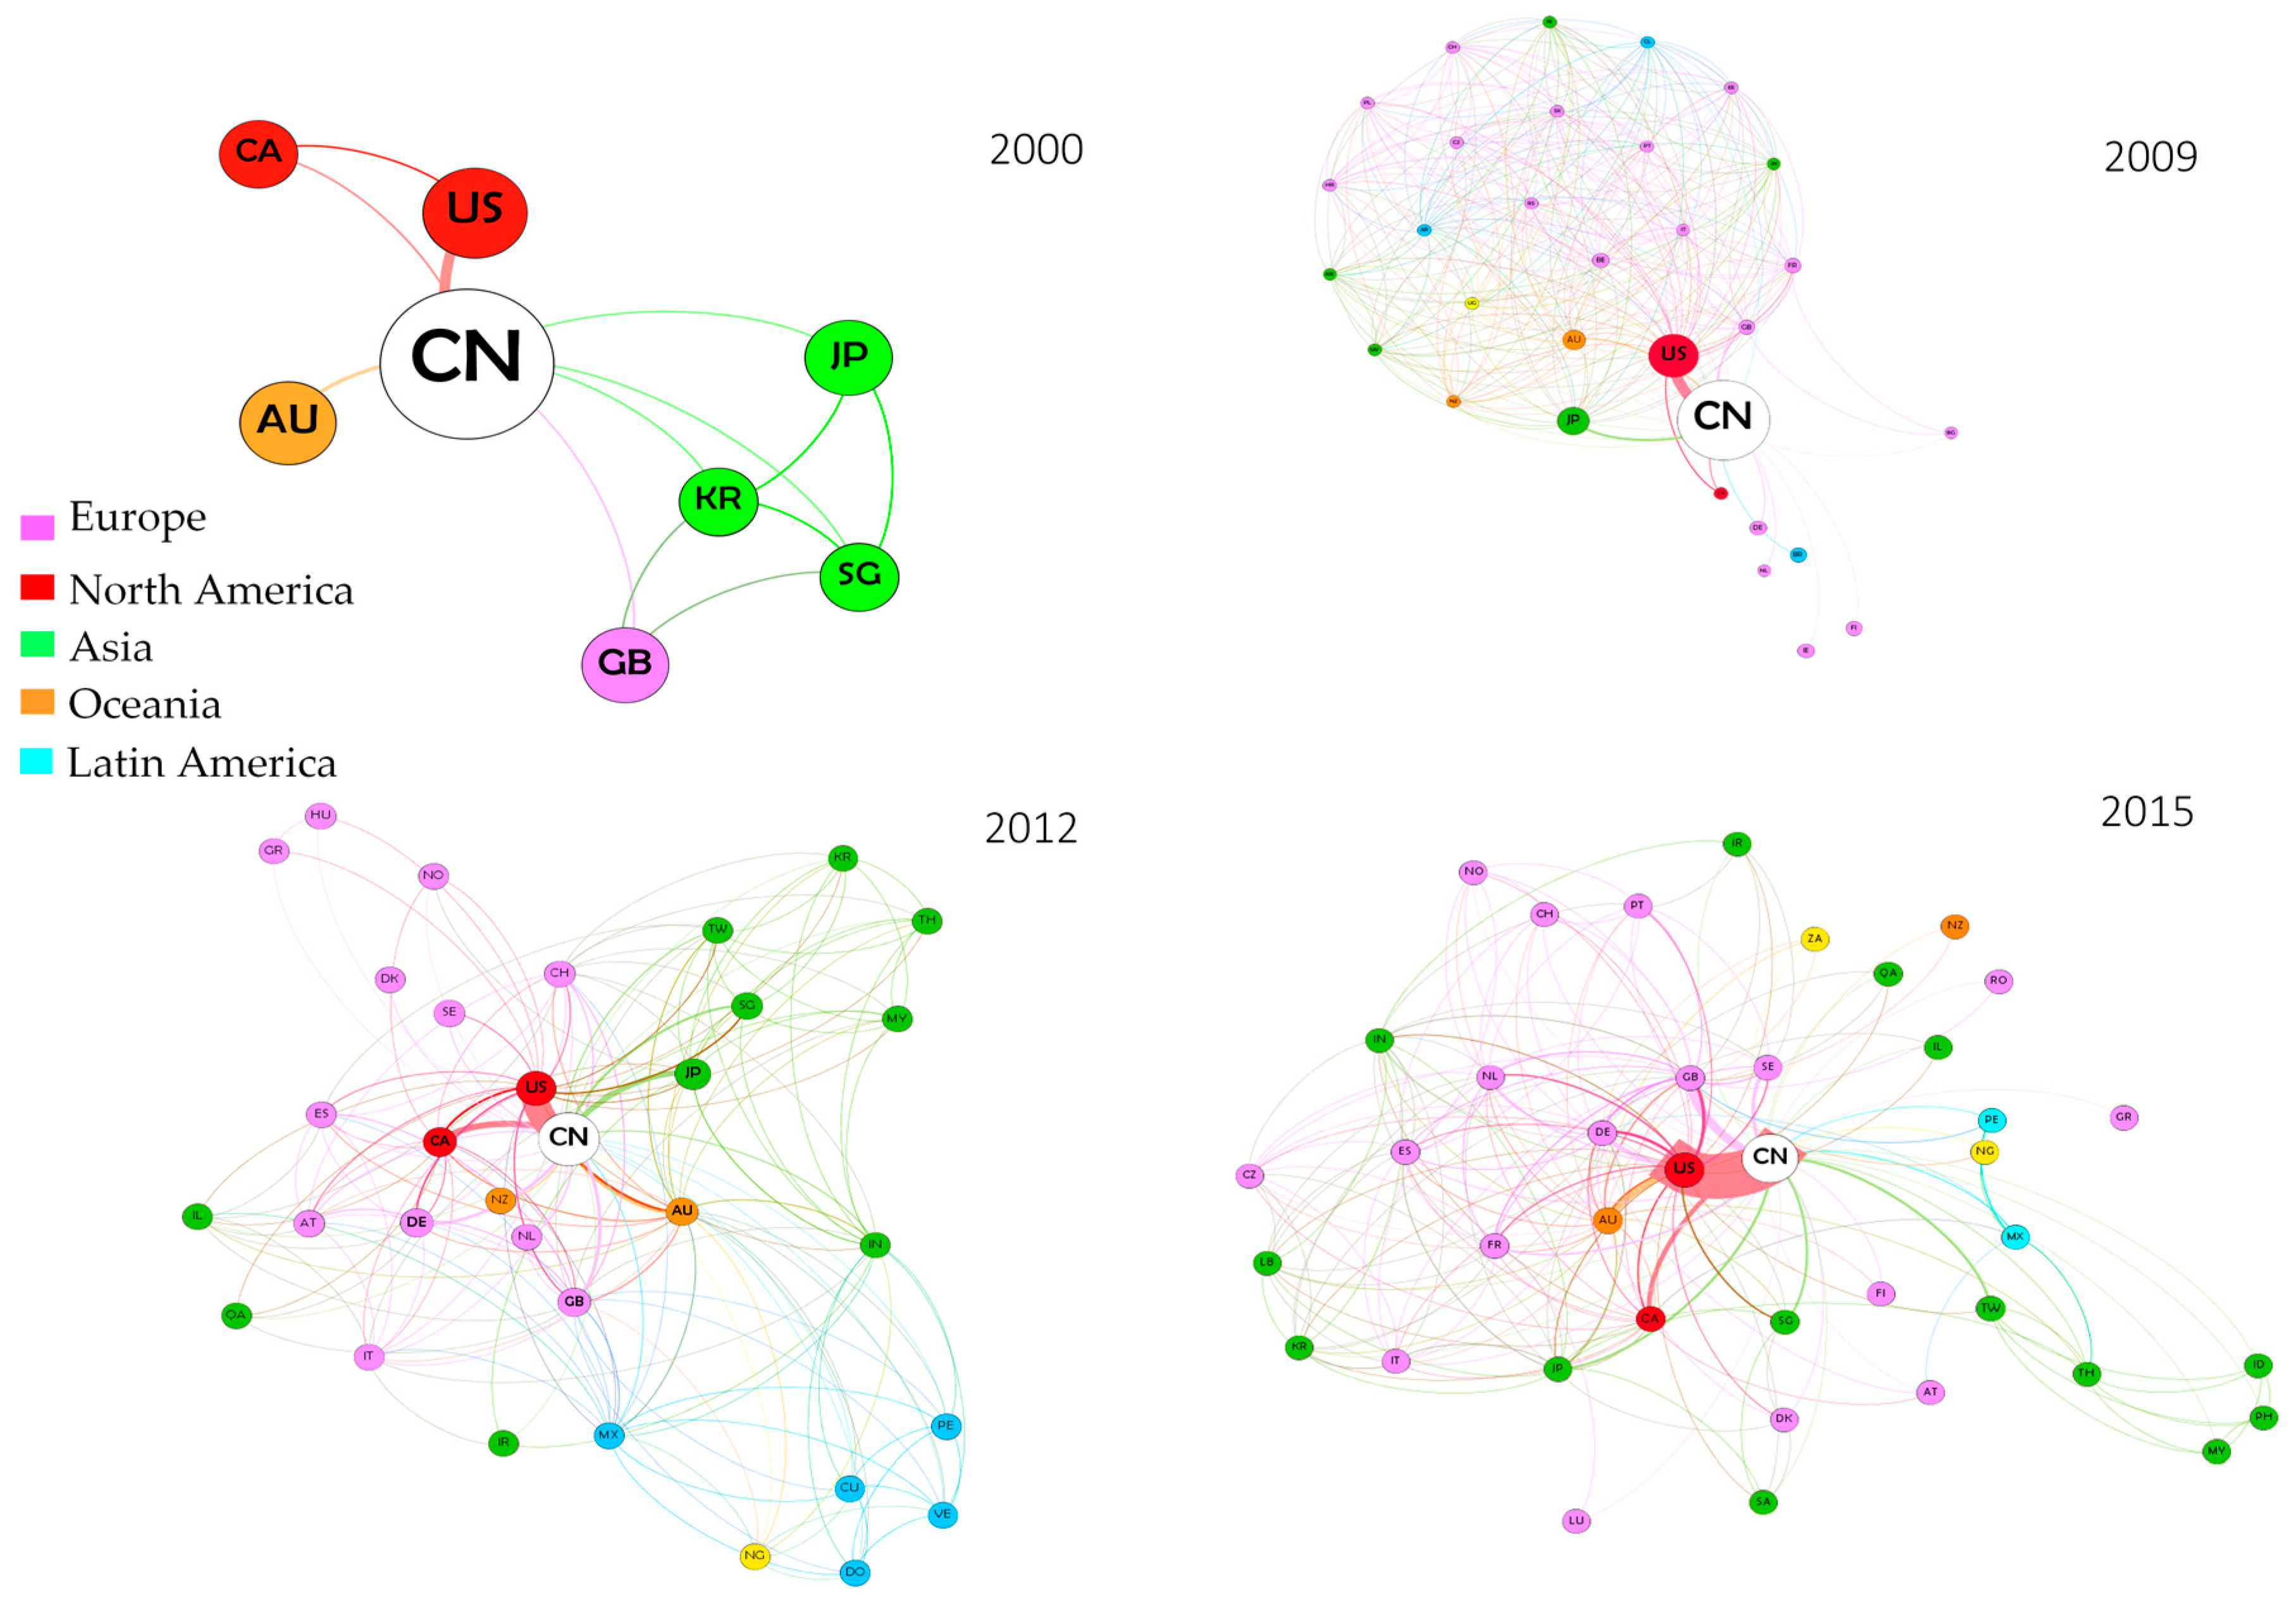
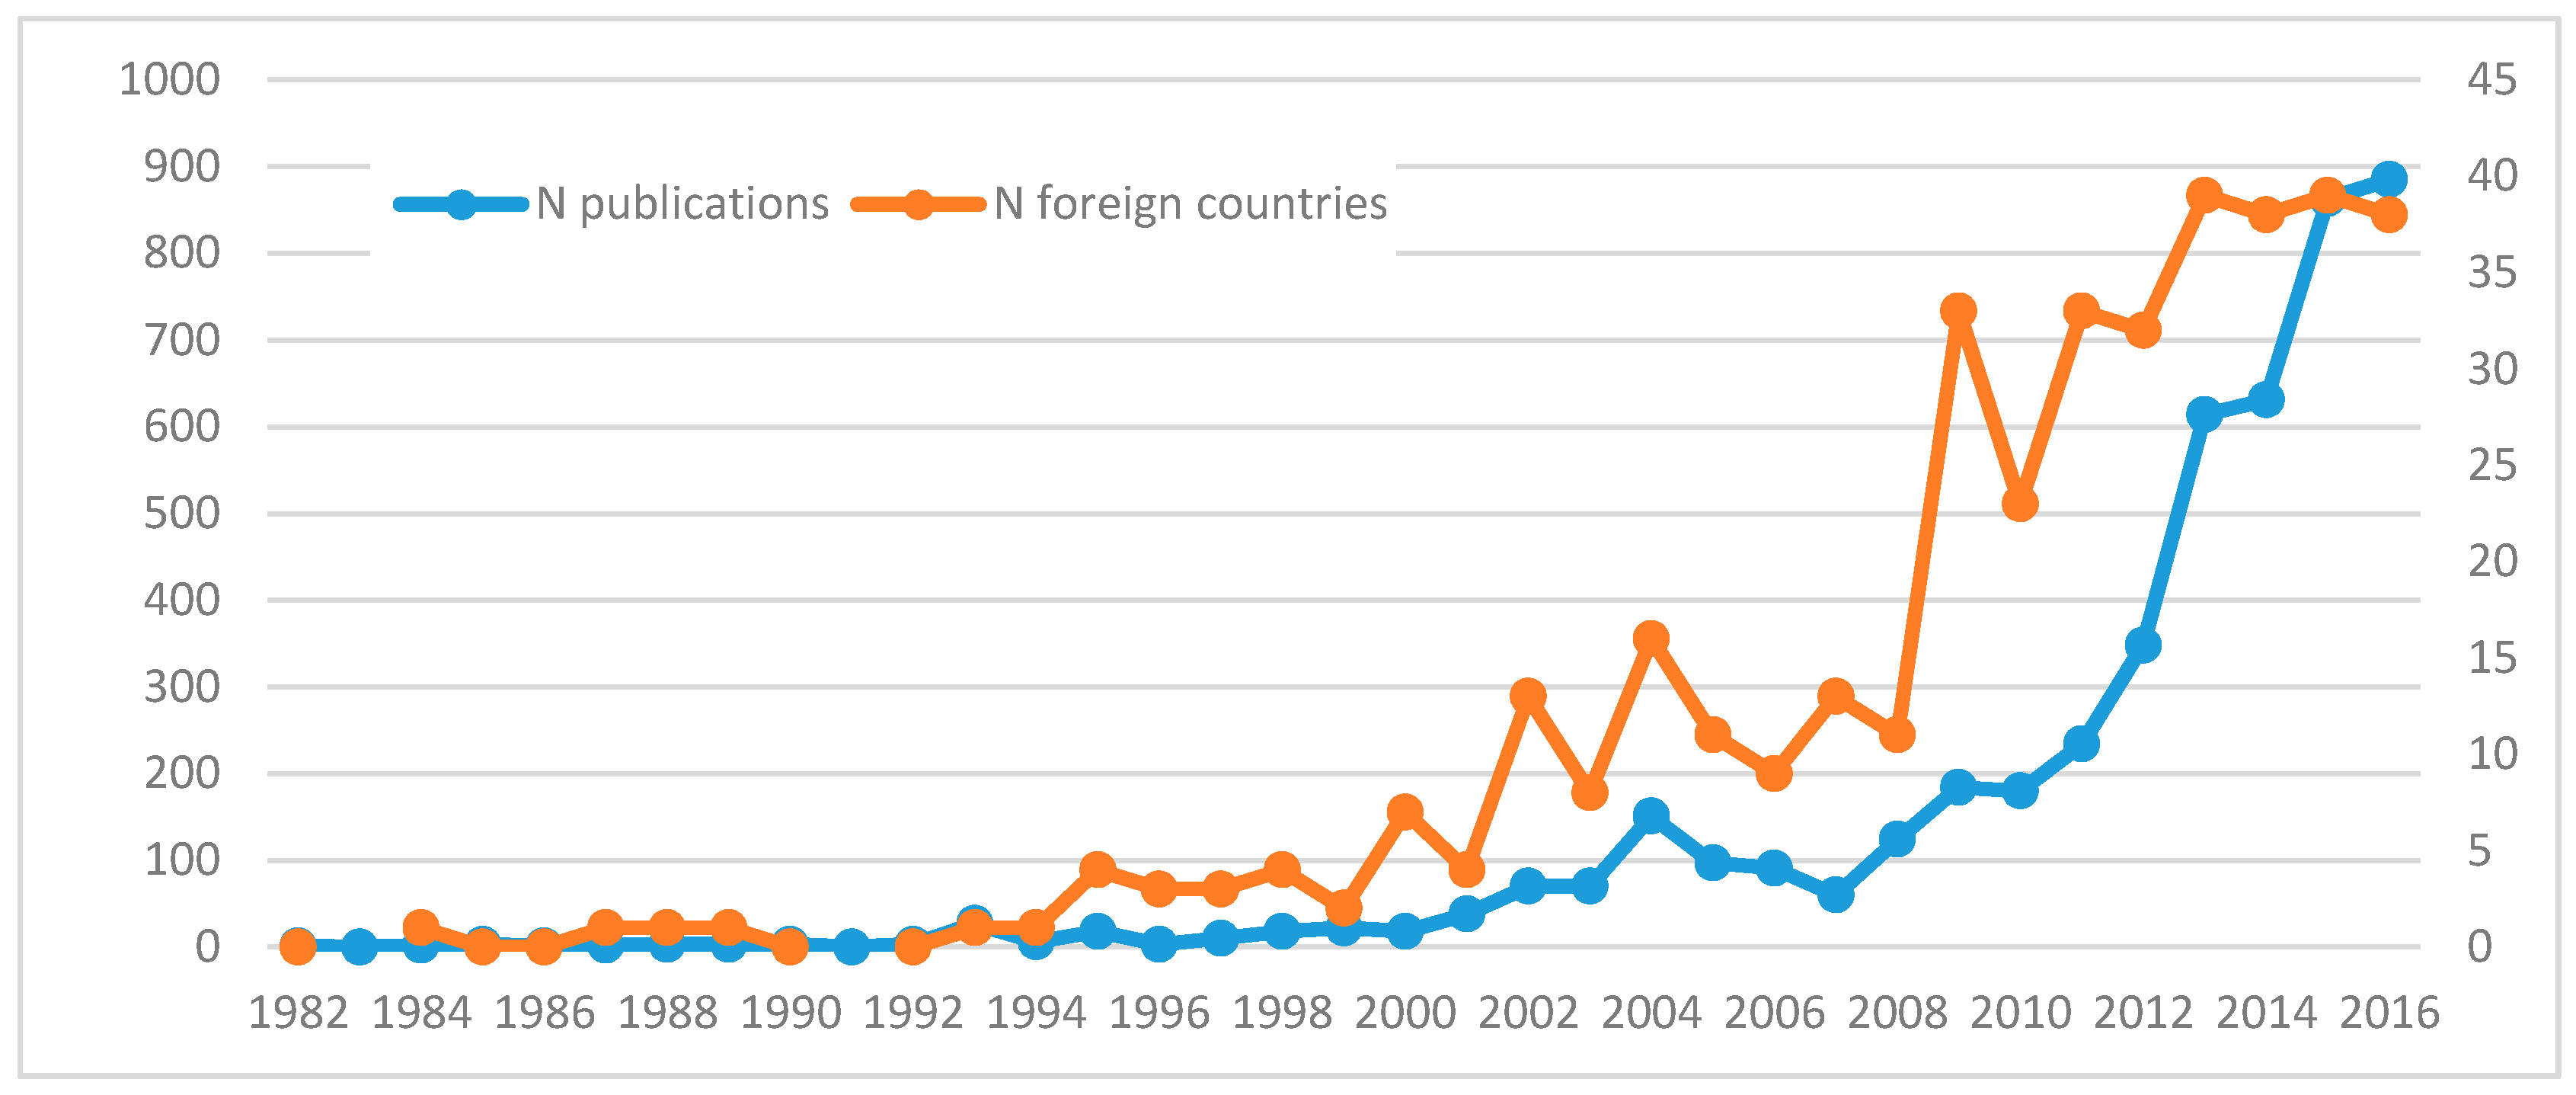
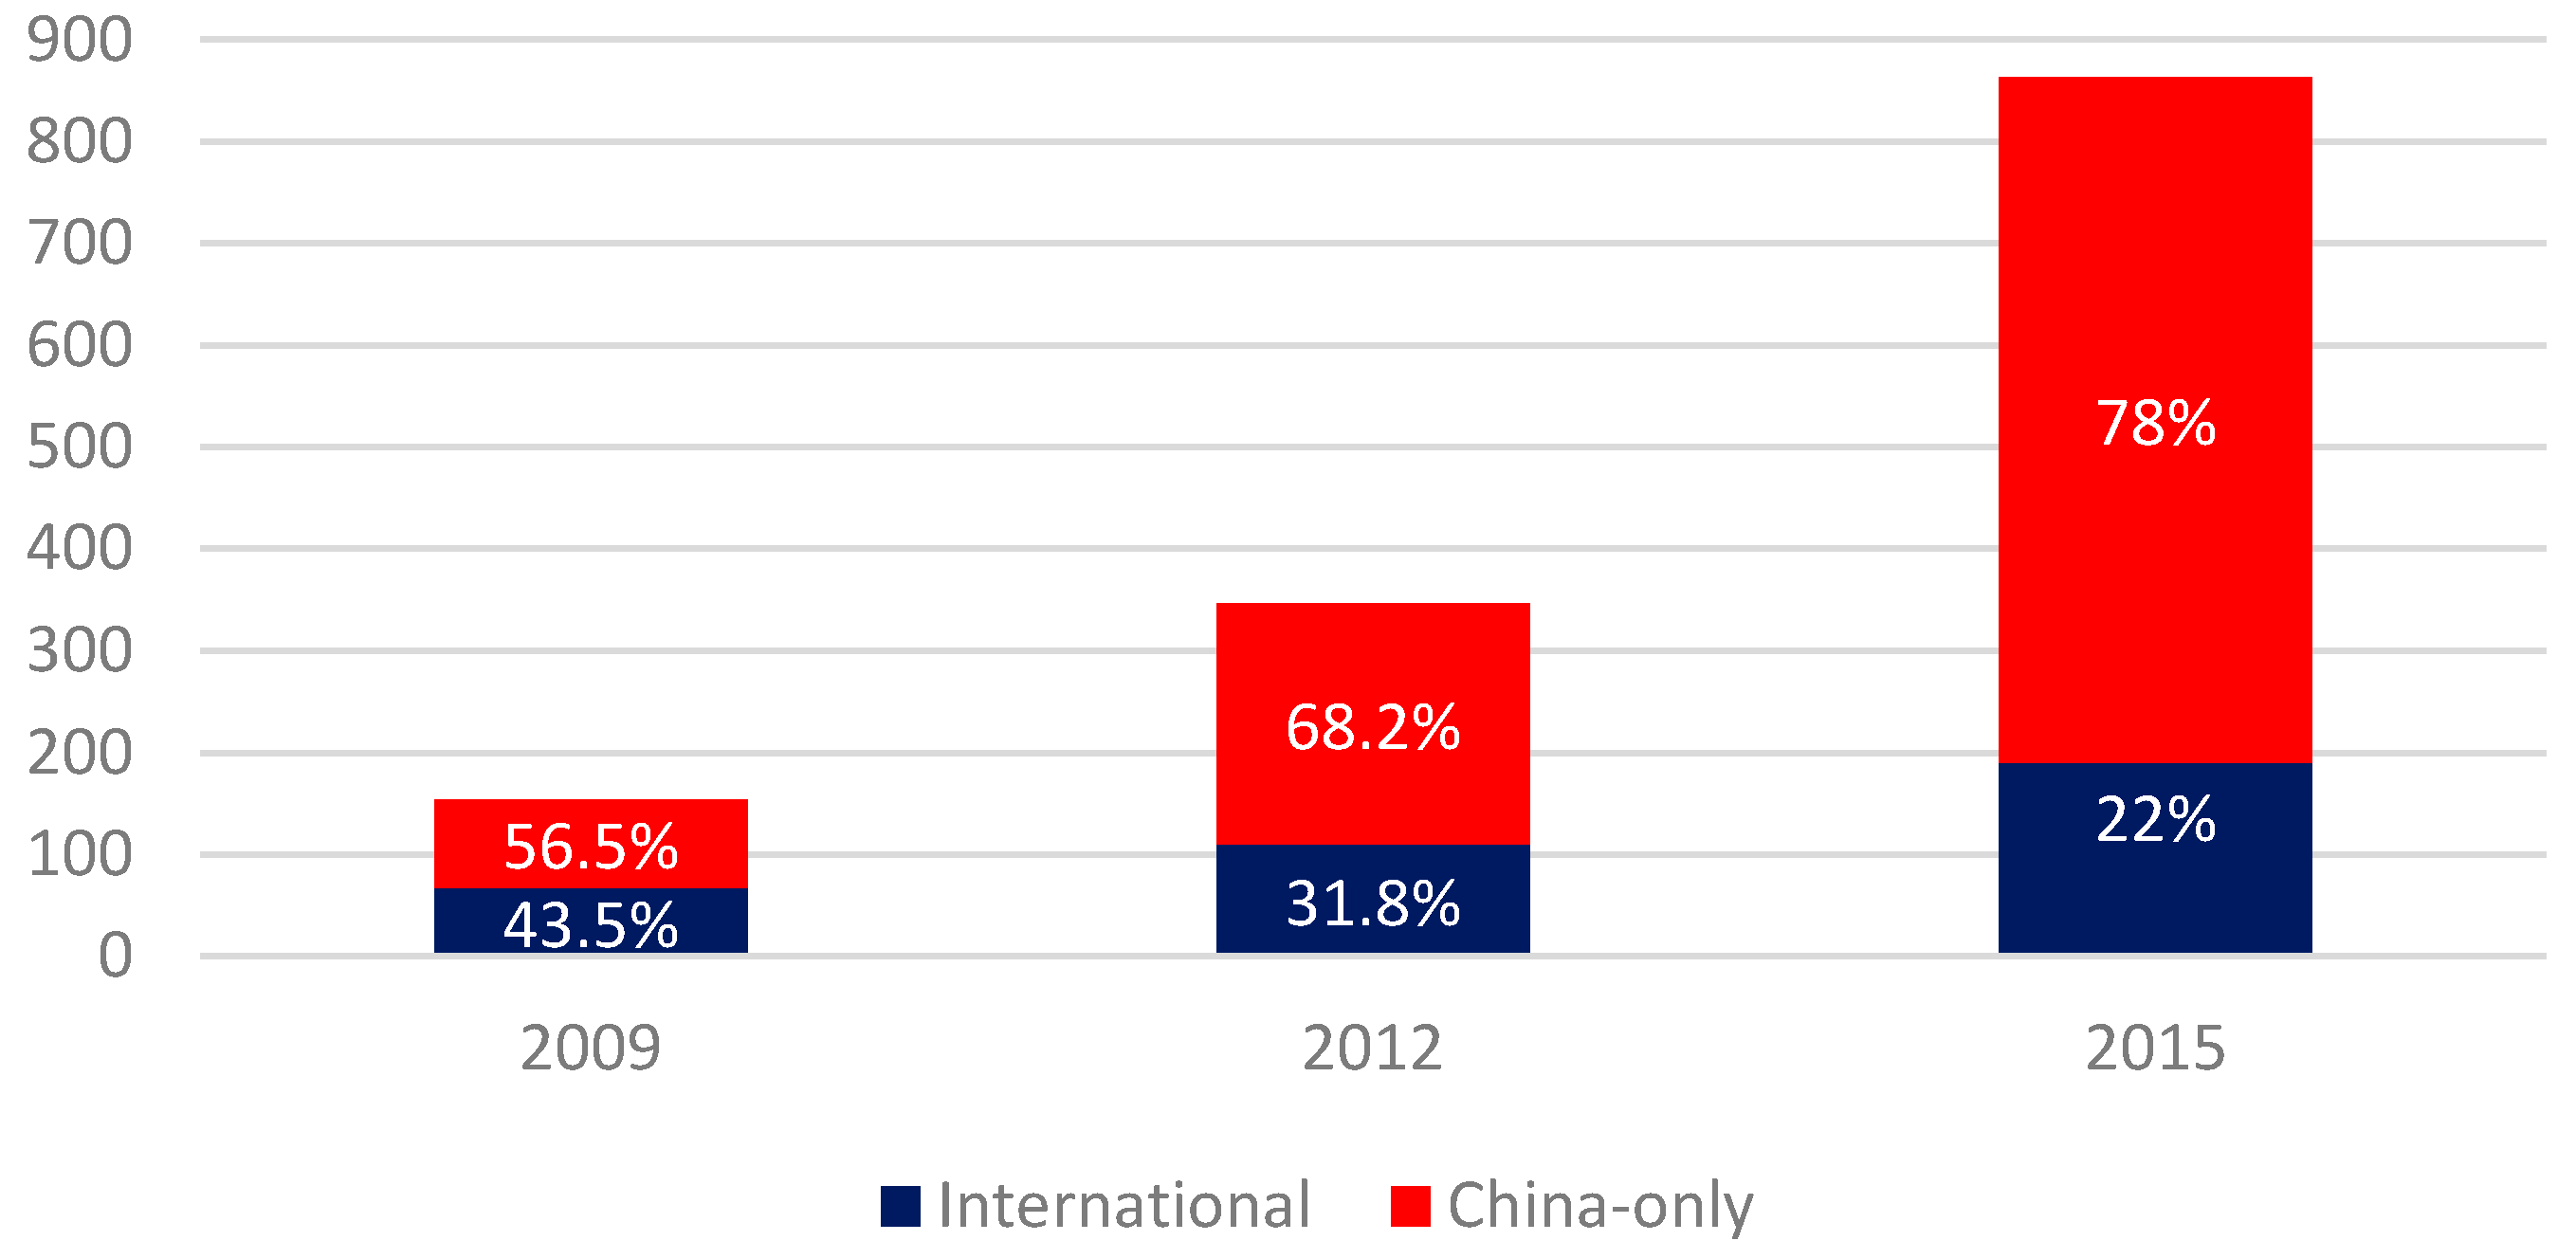
The analysis carried out in this work had the aim to shed some light on the evolution over time of Chinese TRN in gerontology and on the possible determinants of research quality in the field. By means of SNA we have seen that over a time span of only 15 years, the TRN that China has been able to build in this scientific sector has become wider, more complex and diversified, but also still under the main control of Chinese institutions. This has induced us to see if these changes have had an impact on the quality of the research itself.
To explore this aspect we have designed a negative binomial regression whose results have allowed us to identify some determinants in the quality of research and to clarify the role that complexity has on research quality in gerontology. Our findings suggest that, ideally, in order to have the maximum impact on the number of received citations, and therefore on quality, research in gerontology should be carried out on very specialized issues, involving a small number of scientific sectors. The network should include one or more US institutions, and at least one university. Furthermore, we have observed that those articles published on high impact factor journals tend to be cited more. Regarding the actors coordinating the network, a leading role assigned to China has a negative impact on quality only in cases in which the majority of the institutions involved in the partnership are foreign.
The investigation of the impact of complexity on quality has been carried out by means of three different measures of complexity: (1) size complexity; (2) institutional complexity; (3) country complexity. We have studied their separated effect on research quality and we have used interaction terms in order to capture their joint effects. Our results indicate that complexity does play a role in affecting quality of research carried out in collaboration.
More interestingly, our study suggests that there exists an interaction effect among the various dimensions of network complexity, which might moderate the reciprocal impacts on quality. In particular, considering the analysis of the interactions between the complexity indices, results seem to indicate that large networks in terms of number of authors increase quality only if the institutional complexity is at its minimum. If the variety of institutions is at its maximum, to increase the number of co-authors causes a decrease in the number of citations. On the other hand, in the cases in which the institutional complexity is maximum, i.e., all types of institutions participate in the research in the same proportion, to increase the country complexity allows to increase the number of citations. In other words, we may say that research quality benefits from complex research networks, both in terms of countries and of types of institutions involved, but such networks should be “compact” in terms of number of authors. Vice versa, when the variety of institutions is low, higher results are reached by wider networks in terms of number of authors.
As far as policy design implications are concerned, our first pilot study indicates two main suggestions. First, it is not sufficient to promote the enlargement of research networks per se, given that the different dimensions of complexity might have contrasting impacts on quality. This suggests that to design policies simply aimed at fostering the access to TRN might not be enough to reach better research, at least in the field of gerontology. For projects involving different institutions, there might be multiplier effects on quality if also large TRN are promoted, since the two components of complexity reinforce each other. Second, other scientific fields might give different results, and this implies that—at least in the case of health-related sectors—high caution is needed while designing policy tools aimed at increasing the strength on the national scientific system.
Even if this analysis represents a first exercise limited to a very specific sector and taking into account only publications with at least one author located in China, its relevance is manifold. First of all, to the best of our knowledge, it is the first attempt of taking into account the different dimensions of complexity. This not only allows to identify a possible impact of each component on the quality of research, but it also permits to identify interaction effects among them. Second, the methodology developed in this paper can be extended to other sectors and/or to other countries. As it is reasonable to assume, the impact that complexity has on the quality of the research carried out in a specific country also depends on the “maturity” reached by its scientific system, and cross-country comparisons may shed light on the capacity of each research environment to manage and to exploit the TRN in which it participates. Furthermore, to identify the determinants of research quality may help policy makers in the identification of what to foster and what to facilitate while designing policies aimed at strengthening the competitiveness of the research system of a country.

Acknowledgments

The research leading to these results has been developed with the contribution of the “Bando FIR 2016” (Italian Fund for Research Facilitation). It has also received funding from the People Programme (Marie Curie Actions) of the European Union’s Seventh Framework Programme fp7/2007-2013/underreA grant agreement no 612589. The publication does not necessarily reflect the opinion of the EU.

Author Contributions

Even if the article is the result of a joint effort, individual contributions can be identified as follows: all authors designed the research; Lauretta Rubini collected the data and Chiara Pollio designed and applied the method. In particular, Lauretta Rubini has primarily contributed to Section 2.1; Chiara Pollio to Section 2.2.2, Section 2.2.3 and Section 2.2.4; Lauretta Rubini and Chiara Pollio have jointly contributed to Section 2.2.1 and Section 3, and all authors have contributed to Section 1 and Section 4.

Conflicts of Interest

The authors declare no conflict of interest.

Appendix A

Table A1. Correlation between explanatory variables.
STD_AUTHS(c)S(i)Nr_SectRepr_NARepr_UNIRepr_USRepr_FORCN_OnlyUSASS_SumCOMP_SumUNIHOSP_SumUNI_SumHOSP_SumPUBB_Sum
STD_AUTH1.000
S(c)0.3361.000
S(i)0.3800.3041.000
Nr_Sect0.0780.0540.0571.000
Repr_NA−0.339−0.229−0.324−0.1011.000
Repr_UNI0.1520.3270.0610.123−0.5121.000
Repr_US0.1520.3780.1280.032−0.1720.2301.000
Repr_FOR0.2120.5960.2280.040−0.2620.3560.6591.000
CN_Only−0.209−0.903−0.277−0.0340.233−0.326−0.385−0.5731.000
US0.1690.6790.1630.019−0.1610.2260.5280.382−0.7291.000
ASS_Sum0.1650.2240.189−0.008−0.0550.0220.1090.142−0.1450.1481.000
COMP_Sum0.0790.1170.166−0.011−0.0600.0590.1110.153−0.1060.0540.0191.000
UNIHOSP_Sum0.3020.0680.3260.012−0.194−0.2050.0190.068−0.002−0.0070.040−0.0551.000
UNI_Sum0.4770.6470.1910.026−0.2680.4870.3150.376−0.5130.4610.1800.072−0.0821.000
HOSP_Sum0.2440.0400.2910.071−0.060−0.149−0.015−0.0020.044−0.0470.0060.010−0.061−0.0501.000
PUBB_Sum0.2070.2290.345−0.009−0.1080.1130.2050.210−0.1980.1720.0500.1490.0280.195−0.0091.000

References

  1. Aboukhalil, R. The rising trend in authorship. Winnower 2014, 4. [Google Scholar] [CrossRef]
  2. Guan, J.; Ma, N. A comparative study of research performance in computer science. Scientometrics 2004, 61, 339–359. [Google Scholar] [CrossRef]
  3. Moed, H.F. Citation Analysis in Research Evaluation; Springer: Dordrecht, The Netherlands, 2005; Volume 9. [Google Scholar]
  4. Kyvik, S.; Larsen, I. International contact and research performance. Scientometrics 1994, 29, 161–172. [Google Scholar] [CrossRef]
  5. Melin, G.; Persson, O. Studying reserach collaboration using co-authorships. Scientometrics 1996, 36, 363–377. [Google Scholar] [CrossRef]
  6. Beaver, D.D. Reflections on scientific collaboration (and its study): Past, present, and future. Scientometrics 2001, 52, 365–377. [Google Scholar] [CrossRef]
  7. De Lange, C.; Glänzel, W. Modelling and measuring multilateral co-authorship in international scientific collaboration. Part I. Development of a new model using a series expansion approach. Scientometrics 1997, 40, 593–604. [Google Scholar] [CrossRef]
  8. Adams, J. Collaborations: The rise of research networks. Nature 2012, 490, 335–336. [Google Scholar] [CrossRef] [PubMed]
  9. Gomez, I.; Fernandez, M.T.; Sebastian, J. Analysis of the structure of international scientific cooperation networks through bibliometric indicators. Scientometrics 1999, 44, 441–457. [Google Scholar] [CrossRef]
  10. Glänzel, W.; Schubert, A. Analysing scientific networks through co-authorship. In Handbook of Quantitative Science and Technology Research; Moed, H.F., Glänzel, W., Schmoch, U., Eds.; Kluwer Academic Publishers: Dordrecht, The Netherlands, 2005; pp. 257–276. [Google Scholar]
  11. Messner, D. The Network Society; Frank Cass: London, UK, 1997. [Google Scholar]
  12. Anbari, F.T.; Umpleby, S.A. Productive research teams and knowledge generation. In Knowledge Creation, Diffusion, and Use in Innovation Networks and Knowledge Clusters; Carayannis, E.G., Campbell, D.F.J., Eds.; Praeger: Westport, WA, USA, 2006; pp. 26–38. [Google Scholar]
  13. Katz, J.S.; Martin, B.R. What is research collaboration? Res. Policy 1997, 26, 1–18. [Google Scholar] [CrossRef]
  14. Gharawi, M.A.; Dawes, S.S. Exploring the influence of contextual distances on transnational public sector knowledge networks: A comparative study of AIRNow-I Shanghai and the Hajj-MDSS initiatives. In Proceedings of the Annual Hawaii International Conference on System Sciences, Wailea, Maui, HI, USA, 7–10 January 2013; pp. 1714–1723. [Google Scholar]
  15. Samaddar, S.; Nargundkar, S.; Daley, M. Inter-organizational information sharing: The role of supply network configuration and partner goal congruence. Eur. J. Oper. Res. 2006, 174, 744–765. [Google Scholar] [CrossRef]
  16. Landry, R.; Traore, N.; Godin, B. An econometric analysis of the effect of collaboration on academic research productivity. High. Educ. 1996, 32, 283–301. [Google Scholar] [CrossRef]
  17. Luukkonen, T.; Persson, O.; Sivertsen, G. Understanding Patterns of International Scientific Collaboration. Sci. Technol. Hum. Values 1992, 17, 101–126. [Google Scholar] [CrossRef]
  18. Subramanyam, K. Bibliometric studies of research collaboration: A review. J. Inf. Sci. 1983, 6, 33–38. [Google Scholar] [CrossRef]
  19. De Beaver, D.B.; Rosen, R. Studies in scientific collaboration—Part II. Scientific co-authorship, research productivity and visibility in the French scientific elite, 1799–1830. Scientometrics 1979, 1, 133–149. [Google Scholar] [CrossRef]
  20. Katz, J.S. Geographical proximity and scientific collaboration. Scientometrics 1994, 31, 31–43. [Google Scholar] [CrossRef]
  21. Rubini, L. Transfer of knowledge in science-based research networks: A case study on human health genetics in Italy. Int. J. Healthc. Technol. Manag. 2010, 11, 304. [Google Scholar] [CrossRef]
  22. Hagstrom, W.O. The Scientific Community; Southern Illinois University Press: Carbondale, IL, USA, 1965. [Google Scholar]
  23. Rubini, L.; Pollio, C. China and Europe networks in Health. An empirical analysis on co-publications. Int. J. Healthc. Technol. Manag. 2016. [Google Scholar] [CrossRef]
  24. Hennemann, S.; Liefner, I. Global Science Collaboration. In The Handbook of Global Science, Technology, and Innovation; John Wiley & Sons, Ltd.: Hoboken, NJ, USA, 2015; pp. 343–363. [Google Scholar]
  25. Di Tommaso, M.R.; Rubini, L.; Barbieri, E. Southern China: Industry, Development and Industrial Policy; Routledge: Abington, PA, USA, 2013. [Google Scholar]
  26. Barbieri, E.; Tassinari, M. China’s strategic sectors: Trends in health-related manufacturing. Int. J. Healthc. Technol. Manag. 2017. [Google Scholar] [CrossRef]
  27. Zhou, P.; Glänzel, W. In-depth analysis on China’s international cooperation in science. Scientometrics 2010, 82, 597–612. [Google Scholar] [CrossRef]
  28. Jonkers, K. Mobility, Migration, and the Chinese Scientific Research System; Routledge: London, UK, 2010; Volume xix, p. 232. [Google Scholar]
  29. Zhou, P.; Leydesdorff, L. The emergence of China as a leading nation in science. Res. Policy 2006, 35, 83–104. [Google Scholar] [CrossRef]
  30. Zhang, N.J.; Guo, M.; Zheng, X. China: Awakening giant developing solutions to population aging. Gerontologist 2012, 52, 589–596. [Google Scholar] [CrossRef] [PubMed]
  31. Jiang, Q.; Yang, S.; Sanchez-Barricarte, J.J. Can China afford rapid aging? Springerplus 2016, 5. [Google Scholar] [CrossRef] [PubMed]
  32. Sun, J.; Guo, Y.; Wang, X.; Zeng, Q. mHealth For Aging China: Opportunities and Challenges. Aging Dis. 2016, 7, 53–67. [Google Scholar] [CrossRef] [PubMed]
  33. Luukkonen, T. Bibliometrics and evaluation of research performance. Ann. Med. 1990, 22, 145–150. [Google Scholar] [CrossRef] [PubMed]
  34. Martin, B.R. The use of multiple indicators in the assessment of basic research. Scientometrics 1996, 36, 343–362. [Google Scholar] [CrossRef]
  35. Narin, F.; Hamilton, K.S. Bibliometric performance measures. Scientometrics 1996, 36, 293–310. [Google Scholar] [CrossRef]
  36. Seglen, P.O. Citations and journal impact factors: Questionable indicators of research quality. Allergy 1997, 52, 1050–1056. [Google Scholar] [CrossRef] [PubMed]
  37. Bonzi, S.; Snyder, H.W. Motivations for citation: A comparison of self citation and citation to others. Scientometrics 1991, 21, 245–254. [Google Scholar] [CrossRef]
  38. Kostoff, R.N. The use and misuse of citation analysis in research evaluation—Comments on theories of citation? Scientometrics 1998, 43, 27–43. [Google Scholar] [CrossRef]
  39. Wallin, J.A. Bibliometric methods: Pitfalls and possibilities. Basic Clin. Pharmacol. Toxicol. 2005, 97, 261–275. [Google Scholar] [CrossRef] [PubMed]
  40. MacRoberts, M.H.; MacRoberts, B. Problems of Citation Analysis: A Critical Review. J. Am. Soc. Inf. Sci. Technol. 2007, 40, 342–349. [Google Scholar] [CrossRef]
  41. Leydesdorff, L.; Amsterdamska, O. Dimensions of Citation Analysis. Sci. Technol. Hum. Values 1990, 15, 305–335. [Google Scholar] [CrossRef]
  42. Paul, D. In Citing Chaos. J. Bus. Tech. Commun. 2000, 14, 185–222. [Google Scholar] [CrossRef]
  43. Weingart, P. Impact of bibliometrics upon the science system: Inadvertent consequences? Scientometrics 2005, 62, 117–131. [Google Scholar] [CrossRef]
  44. Saha, S.; Saint, S.; Christakis, D.A. Impact factor: A valid measure of journal quality? J. Med. Libr. Assoc. 2003, 91, 42–46. [Google Scholar] [PubMed]
  45. King, J. A review of bibliometric and other science indicators and their role in research evaluation. J. Inf. Sci. 1987, 13, 261–276. [Google Scholar] [CrossRef]
  46. Virgo, J.A. A Statistical Procedure for Evaluating the Importance of Scientific Papers. Libr. Q. Inf. Community Policy 1977, 47, 415–430. [Google Scholar] [CrossRef]
  47. Hagstrom, W. Inputs, Outputs, and the Prestige of University Science Departments. Sociol. Educ. 1971, 44, 375–397. [Google Scholar] [CrossRef]
  48. Van Raan, A.F.J. Advanced bibliometric methods as quantitative core of peer review based evaluation and foresight exercises. Scientometrics 1996, 36, 397–420. [Google Scholar] [CrossRef]
  49. Durieux, V.; Gevenois, P.A. Bibliometric indicators: Quality measurements of scientific publication. Radiology 2010, 255, 342–351. [Google Scholar] [CrossRef] [PubMed]
  50. Shannon, C.E. A mathematical theory of communication. ACM SIGMOB. Mob. Comput. Comm. Rev. 2001. [Google Scholar] [CrossRef]
  51. Spellerberg, I.F.; Fedor, P.J. A tribute to Claude Shannon (1916–2001) and a plea for more rigorous use of species richness, species diversity and the “Shannon-Wiener” Index. Glob. Ecol. Biogeogr. 2003, 12, 177–179. [Google Scholar] [CrossRef]
  52. Cameron, A.C.; Trivedi, P.K. Regression Analysis of Count Data; Cambridge University Press: Cambridge, UK, 1998. [Google Scholar]
  53. Hilbe, J.M. Negative Binomial Regression, 2nd ed.; Cambridge University Press: Cambridge, UK, 2011. [Google Scholar]
  54. Long, J.S.; Freese, J. Regression Models for Categorical Dependent Variables Using Stata, 3rd ed.; Stata Press: College Station, TX, USA, 2014. [Google Scholar]
  55. Williams, R. Using the margins command to estimate and interpret adjusted predictions and marginal effects. Stata J. 2012, 12, 308–331. [Google Scholar]
Figure 1. Evolution in the total number of Chinese publications and total number of countries involved in the field of gerontology. Source: authors’ elaboration based on ISI Web of Knowledge ISI WoK data.
Ijerph 14 00975 g001
Figure 2. Chinese transnational research networks (TRN)s in gerontology. Source: authors’ elaboration based on ISI WoK data. Note: the dimension of nodes is proportional to the times in which the country hosts the reprint author while the width of the linkage is proportional to the number of publications involving the two countries.
Ijerph 14 00975 g002
Figure 3. International vs. China-only publications. Number and percentage. Source: authors’ elaboration based on ISI WoK data.
Ijerph 14 00975 g003
Figure 4. Distribution of index complexity indices for International and China-only publications: (a) Number of authors’ index, kernel estimates; (b) Shannon index for institutional heterogeneity, kernel estimates. Source: authors’ elaboration.
Ijerph 14 00975 g004
Figure 5. Shannon index for country’s heterogeneity for International publications, kernel estimate. Source: authors’ elaboration.
Ijerph 14 00975 g005
Figure 6. Effect of number of authors’ index on citations when institutional complexity is minimum (S(i) = 0) and when institutional complexity is maximum (S(i) = 100). Source: authors’ elaboration.
Ijerph 14 00975 g006
Figure 7. Effect of number of country’s complexity index on citations when institutional complexity is minimum (S(i) = 0) and when institutional complexity is maximum (S(i) = 100). Source: authors’ elaboration.
Ijerph 14 00975 g007
Table 1. Reprint author’s nationality and the role of China.
NumberTotalBy Reprint Author
ChineseForeignNo Reprint Author
Majority128912314
Minority134239714
Parity105403134
Total36715415162
Source: authors’ elaboration based on ISI WoK data.
Table 2. Control variables included in the model.
Name of the VariableDescription
Nr_SectNumber of scientific sectors to which the publication refers
Repr_NADummy = 1 if no reprint author is indicated in the publication
Repr_UNIDummy = 1 if the reprint author’s affiliated institution is a University
Repr_FORDummy = 1 if the reprint author is from a foreign institution
Repr_USDummy = 1 if the reprint author’s country is the US
ASSDummy = 1 if at least one association takes part in the publication
COMPDummy = 1 if at least one company takes part in the publication
HOSPDummy = 1 if at least one hospital takes part in the publication
PUBDummy = 1 if at least one public institution takes part in the publication
UNIDummy = 1 if at least one university takes part in the publication
UNIHOSPDummy = 1 if at least one university-hospital takes part in the publication
USDummy = 1 if US-based authors take part in the publication
Impact_Factor5-year impact factor (2015) of the journal of the publication i
CN_repr_majDummy = 1 if the reprint author is located in China and Chinese institutions represent the majority
CN_repr_minDummy = 1 if the reprint author is located in China and Chinese institutions represent the minority
i For the journals for which the data on 2015 were not available, the last available previous information has been taken.
Table 3. Descriptive statistics of the dependent variable CIT (number of citations). Source: authors’ elaboration based on ISI WoK data.
VariableMeanStandard DeviationVarianceMedianProportion of Zeros
CIT5.60511.665136.07810.447
Table 4. Regression analysis.
CIT(1)(2)(3)
STD_AUTH0.012 **0.021 **0.022 ***
(−2.15)(2.57)(−2.64)
S(c)−0.002−0.015 **−0.011
(−0.46)(−2.12)(−1.36)
S(i)−0.009−0.005−0.005
(−1.35)(−0.82)(−0.82)
Nr_Sect−0.094 **−0.084 *−0.088 **
(−2.15)(−1.91)(−2.01)
Repr_NA−5.131 ***−5.125 ***−5.153 ***
(−18.27)(−18.22)(−15.59)
Repr_UNI−0.101−0.114−0.109
(−0.95)(−1.07)(−1.02)
Repr_US−0.088−0.056−0.011
(−0.41)(−0.26)(−0.05)
Repr_FOR0.0730.1200.011
(−0.43)(0.71)(0.05)
US0.364 **0.435 ***0.385 **
(2.36)(2.76)(2.43)
ASS0.1760.0310.078
(0.68)(0.11)(0.27)
COMP0.025−0.031−0.035
(0.08)(−0.10)(−0.11)
HOSP0.2970.2580.27
(1.45)(1.12)(1.17)
PUB0.2720.2180.236
(1.27)(0.89)(0.97)
UNIHOSP0.425 **0.3590.364
(2.01)(1.49)(1.51)
UNI0.732 ***0.744 ***0.749 ***
(3.17)(2.95)−2.98
S(c)*S(i) 0.000 ***0.000 ***
(3.00)−2.88
STD_AUTH*S(i) −0.000 *−0.000 *
(−1.78)(−1.80)
STD_AUTH*S(c) 0.004−0.001
(0.24)(−0.07)
CN_reprint_maj −0.013
(−0.06)
CN_repr_min −0.596 **
(−2.07)
Impact_Factor0.091 ***0.089 ***0.090 ***
(−4.8)(4.69)(4.74)
Constant2.199 ***2.178 ***2.188 ***
(9.08)(7.44)(6.29)
Year dummiesYesYesYes
N136213621362
Pseudo R-sq0.2180.2190.22
AIC5282.4935278.2765277.248
BIC5386.8285398.2615407.665
Log-likelihood−2621.25−2616.138−2613.62
T-statistics in parentheses. Significance: * p < 0.1, ** p < 0.05, *** p < 0.01.
Table 5. Average marginal effects.
CIT(1)(2)(3)
STD_AUTH0.068 **0.122 **0.065 *
S(c)−0.013−0.089−0.018
S(i)−0.05−0.031−0.04
Nr_Sect−0.546 **−0.487 ***−0.51 **
Repr_NA−29.721 ***−29.739 ***−29.816 ***
Repr_UNI−0.587−0.662−0.632
Repr_US−0.513−0.323−0.066
Repr_FOR0.4250.6970.063
US2.107 **2.523 ***2.229 **
ASS1.0170.1810.449
COMP0.145−0.177−0.201
HOSP1.7221.4991.561
PUB1.5741.2671.366
UNIHOSP2.459 **2.0852.108
UNI4.239 ***4.32 ***4.337 ***
CN_reprint_maj −0.074
CN_repr_min −3.45 **
Impact_Factor0.528 ***0.516 ***0.52 ***
Significance: * p < 0.1, ** p < 0.05, *** p < 0.01.

